

Sample Category Title
Quiet Start to the Week
Market movers today
Focus this week will be on Flash PMI's for euro and US as well as Japanese CPI. We may also see more policy easing from China.
In the Nordics, the Norges Bank meeting on Thursday will take centre stage. We look for a hike of 25bp and signals of another hike in August.
Today is rather quiet with only US NAHB housing index worth noting. Surprisingly, the US housing market has shown tentative signs of bottoming in recent months. We may also get more news on the visit by US Secretary of State Anthony Blinken to Beijing.
The 60 second overview
Markets: It has been fairly quiet overnight with very limited news for markets to trade on. Focus this morning has primarily been on China following US Secretary of State Blinken's delayed visit to his counterparts in Beijing. Both sides have so far referred to the talks as "candid" marking a seemingly slight improvement of the diplomatic relations between the two super powers.
Also Chinese equities have been in focus this morning with the large Chinese indices trading lower on the back of not least tech- and chipmaker stocks trading heavy following concerns as to a Chinese cyber-security probe. Finally, market expectations for more economic stimulus already tomorrow are building amid the Chinese recovery losing steam.
EUR/USD (temporarily) on the rise. Last week saw EUR/USD complete the largest weekly rise in 2023. The rise was not least boosted by relative monetary policy decisions from the Fed and the ECB. The Fed's decision to leave monetary policy unchanged was expected, but markets struggled to believe the Fed's own expectations of two more 25bp rate hikes. We are not convinced either, and we do not expect more hikes from the Fed. In this regard we believe Friday's release of Michigan inflation expectations supported this call with 1-year expectations dropping sharply to 3.3% in June, from 4.2% in May. For more on our Fed call please see Research US - Fed review: Powell's hawkish bluff, 14 June.
In addition EUR/USD found support last week from the ECB hiking policy rates by 25bp whilst delivering fairly firm guidance towards more tightening in the future on the back of an upward revision to inflation projections by the staff. In contrast to our Fed expectations, we expect two more 25bp hikes from the ECB. Read more in Flash: ECB Review - 'Very likely' to hike again in July, 15 June.
Looking ahead we highlight that EUR/USD is driven by more than relative rates and after last week's rise we expect a move lower in the cross.
Equities took a breather on Friday after another strong week. S&P logged its fifth straight week of gains (2.6% in a week!), something that has not happened since November 2021. Friday sector performance was tightly bunched with rotation into defensives (utilities, materials, consumer staples) and out of growth cyclicals (tech, communications). Europe fared better with Stoxx 600 up 0.4% while S&P500 down as much. US is closed for holiday today.
FI: US 10Y government bond yields ends the week more or less unchanged despite the fairly hawkish comments from the Federal Reserve at the FOMC meeting, while 2Y yields rose 10bp during the week. Hence, the curve flattening of the US curve continued as both the 2-10Y and 10-30Y segments continued to flatten.
We see the same picture for the European yield curves where the curves also continue to flatten from the front end and the slope of both the 2-10Y and 10-30Y German curves flatten as ECB promised more rate hikes.
FX: EUR/USD experienced substantial gains last week, reaching a multi-week high and consolidated around the 1.0950 mark. EUR/GBP moved lower during Friday's session, currently trading at levels last seen September 2022. For UK markets, focus this week turns to CPI out Wednesday and Bank of England meeting Thursday. This week, the big event for NOK FX is the Norges Bank monetary policy meeting on Thursday, where we expect a 25bp hike.
Credit: Credit markets had a slightly positive day on Friday reflecting positive developments in equity markets. Overall iTraxx Main was 1bp tighter at 76bp while iTraxx Xover was 9bp tighter at 397bp.
EUR/USD Daily Outlook
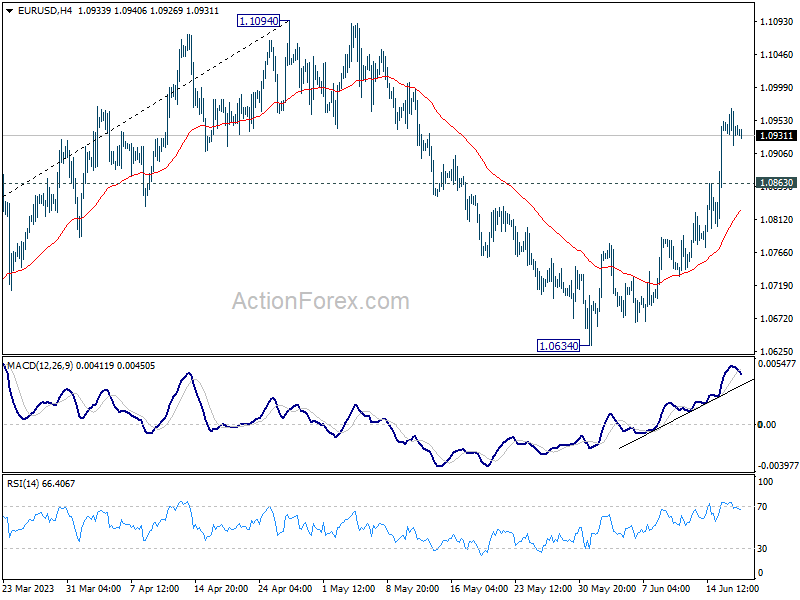
Daily Pivots: (S1) 1.0916; (P) 1.0944; (R1) 1.0969; More...
Intraday bias in EUR/USD remains on the upside for the moment. Current rise from 1.0634 should target a retest on 1.1094 high. Decisive break there will confirm resumption of whole up trend from 0.9534. On the downside, below 1.0863 minor support will turn intraday bias neutral first.
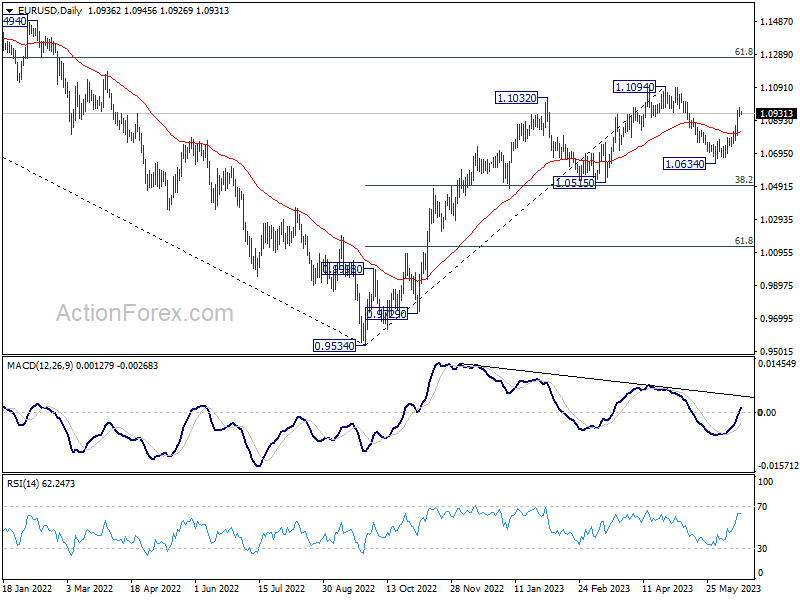
In the bigger picture, as long as 1.0515 support holds, rise from 0.9534 (2022 low) would still extend higher. Sustained break of 61.8% retracement of 1.2348 (2021 high) to 0.9534 at 1.1273 will solidify the case of bullish trend reversal and target 1.2348 resistance next (2021 high).
GBP/USD Daily Outlook
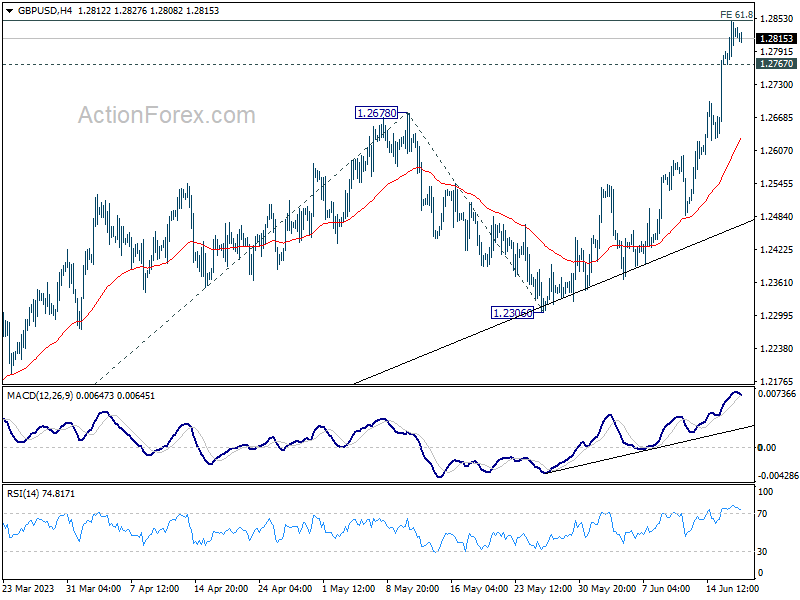
Daily Pivots: (S1) 1.2777; (P) 1.2812; (R1) 1.2857; More...
Intraday bias in GBP/USD stays on the upside for the moment. Sustained trading above 61.8% projection of 1.1801 to 1.2678 from 1.2306 at 1.2848 will pave the way to 100% projection at 1.3183 next. On the downside, below 1.2697 minor support will turn intraday bias neutral and bring consolidations first, before staging another rally.
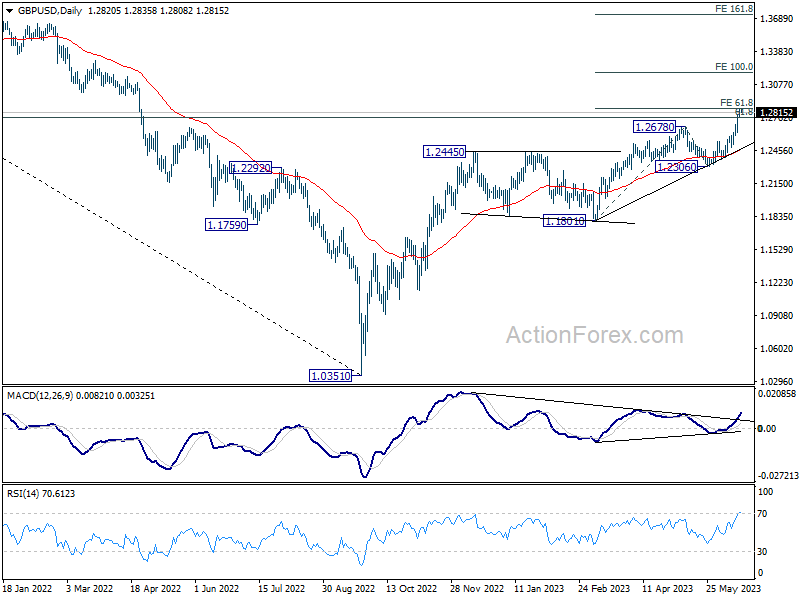
In the bigger picture, the strong support from 55 W EMA (now at 1.2345) is a medium term bullish sign. Outlook will stay bullish as long as 1.2305 support holds. Rise from 1.0351 medium term bottom (2022 low) is expected to extend further to retest 1.4248 key resistance (2021 high).
USD/CHF Daily Outlook
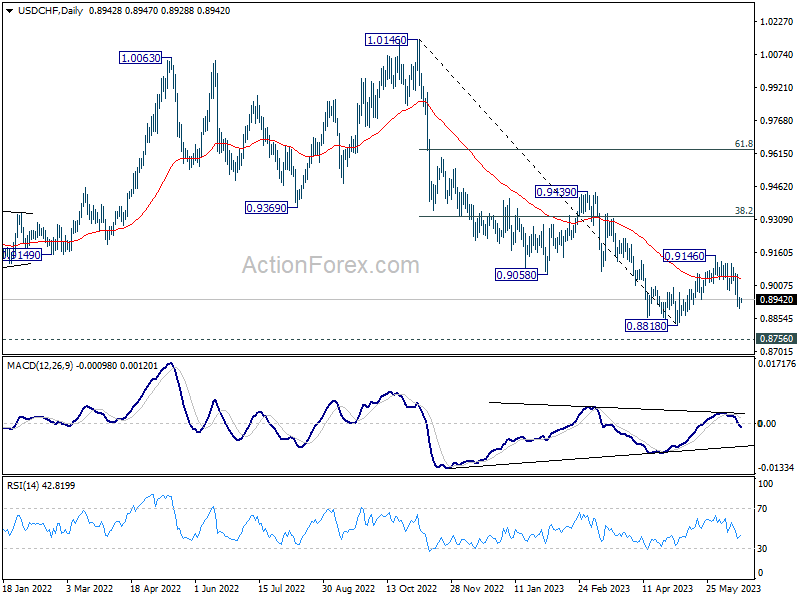
Daily Pivots: (S1) 0.8912; (P) 0.8930; (R1) 0.8959; More...
Intraday bias in USD/CHF stays on the downside. Deeper decline could be seen to 0.8818 and possibly below. But strong support is still expected from 0.8756 to bring reversal. On the upside, above 0.8983 minor resistance will turn intraday bias neutral first.
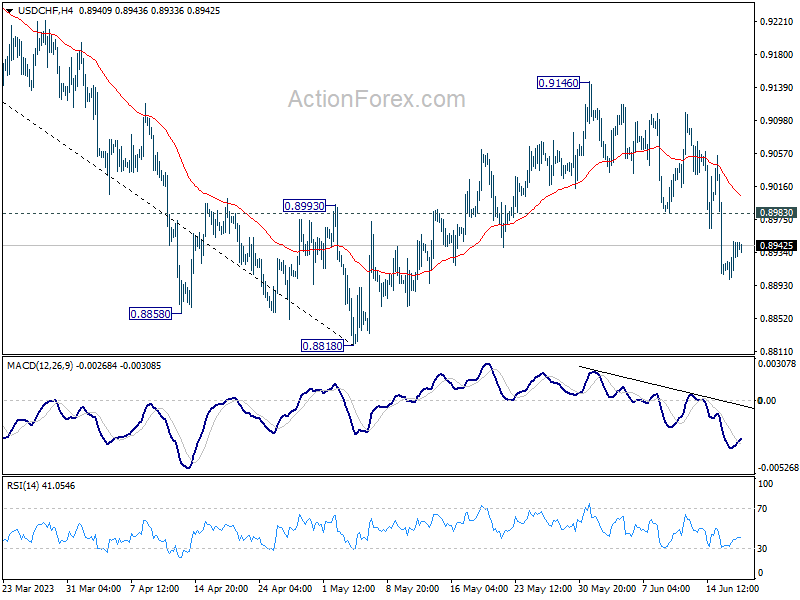
In the bigger picture, fall from 1.1046 (2022 high) is seen as a leg in the long term range pattern from 1.0342 (2016 high), which might have completed at 0.8818 already, just ahead of 0.8756 long term support. Sustained trading above 0.9058 support turned resistance should confirm medium term bottoming.
USD/JPY Daily Outlook
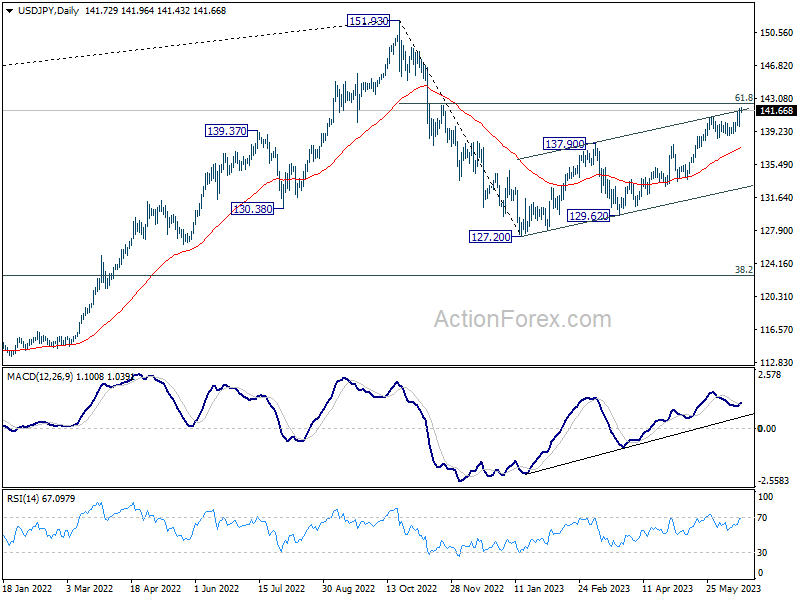
Daily Pivots: (S1) 140.47; (P) 141.19; (R1) 142.54; More...
Intraday bias in USD/JPY remains on the upside at this point, for 61.8% retracement of 151.93 to 127.20 at 142.48 next. Sustained break there will pave the way back to retest 151.93 high. However, rejection by 142.48, followed by break of 139.27 will indicate short term topping and turn bias back to the downside.
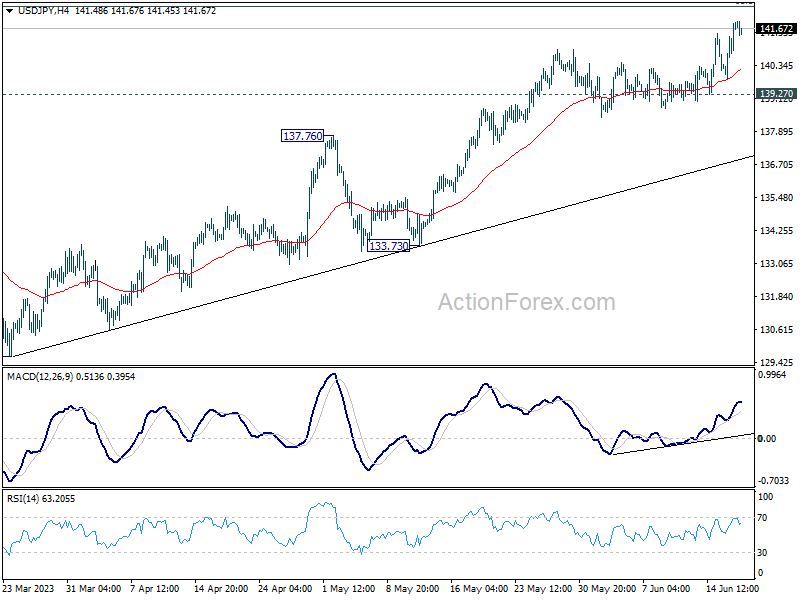
In the bigger picture, rise from 151.93 are seen as a corrective pattern to up trend from 102.58. The first leg has completed at 127.20. Rebound from there is seen as the second leg, and should be limited below 151.93. Sustained trading below 55 D EMA (now at 137.47) will argue that the third leg has started back to 127.20 and possibly below.
USD/CAD Daily Outlook
Daily Pivots: (S1) 1.3171; (P) 1.3205; (R1) 1.3233; More....
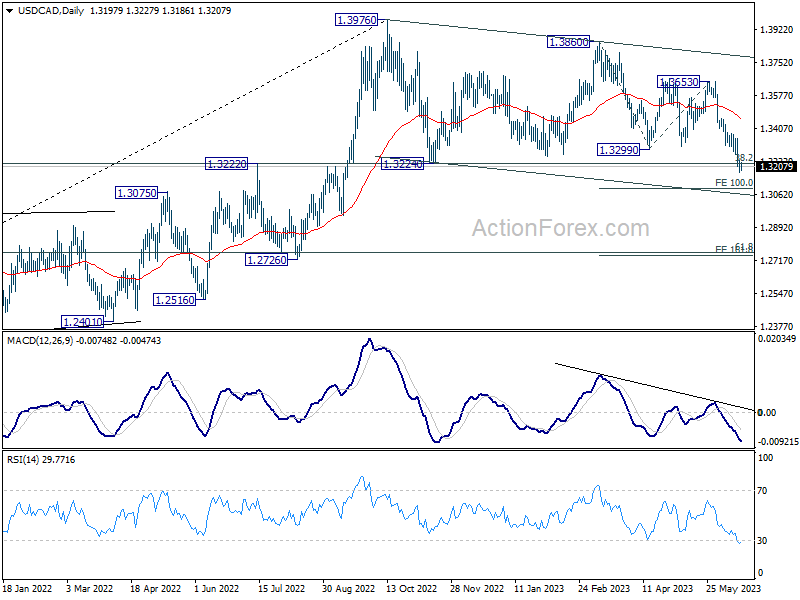
Intraday bias in USD/CAD remains on the downside at this point. Fall from 1.3976 is developing at least a a deeper correction. Further fall should be seen to 100% projection of 1.3860 to 1.3299 from 1.3653 at 1.3092 next. On the upside, above 1.3353 minor resistance will turn intraday bias neutral and bring consolidations first, before staging another decline.
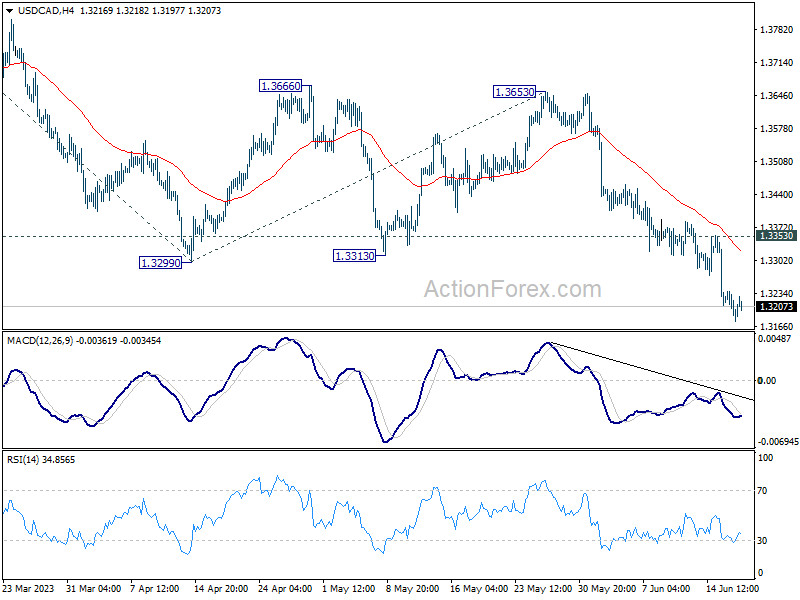
In the bigger picture, price actions from 1.3976 are still viewed as a correction to up trend from 1.2005 (2021 low), but chance of trend reversal is increasing with current decline. But in either case, sustained trading below 38.2% retracement of 1.2005 to 1.3976 at 1.3233 will pave the way to 61.8% retracement at 1.2758. Risk will stay on the downside as long as 1.3653 resistance holds, even in case of strong rebound.
AUD/JPY Technical: At the Risk of a Minor Pull-back
AUD/JPY Technical: At the Risk of a Minor Pull-back
- Minor uptrend phase of AUD/JPY since its 1 June 2023 low 0f 90.26 has reached overstretched condition.
- The overstretched rally of AUD/JPY is characterized by a 14-month high seen in the Bollinger Bandwidth (a measurement of historical volatility).
- Short-term upside momentum has started to wane.
Fig 1: AUD/JPY medium-term trend as of 19 Jun 2023 (Source: TradingView, click to enlarge chart)
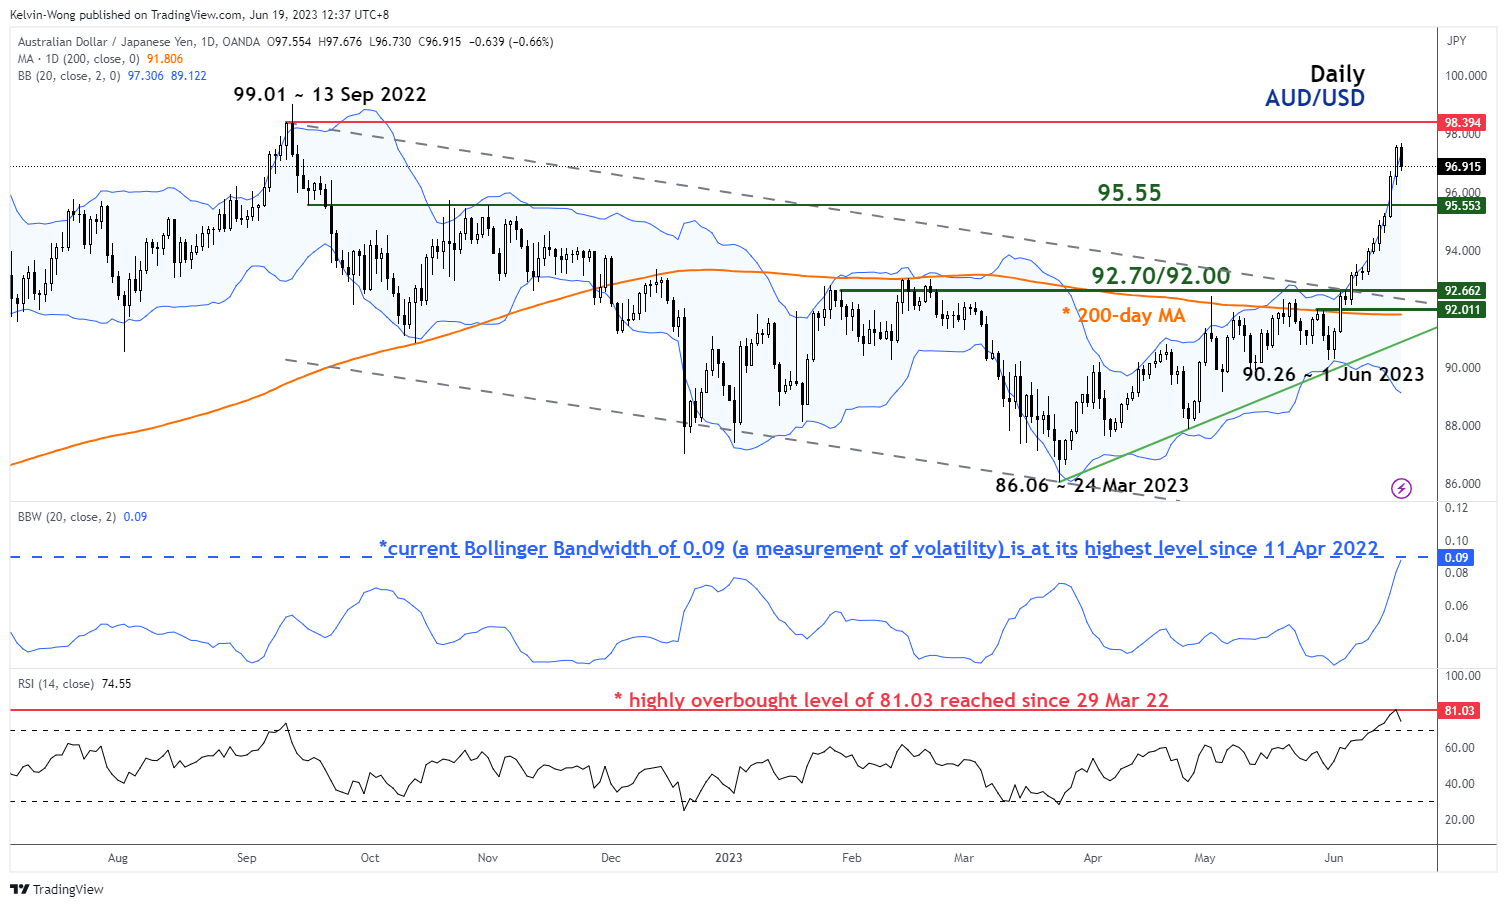
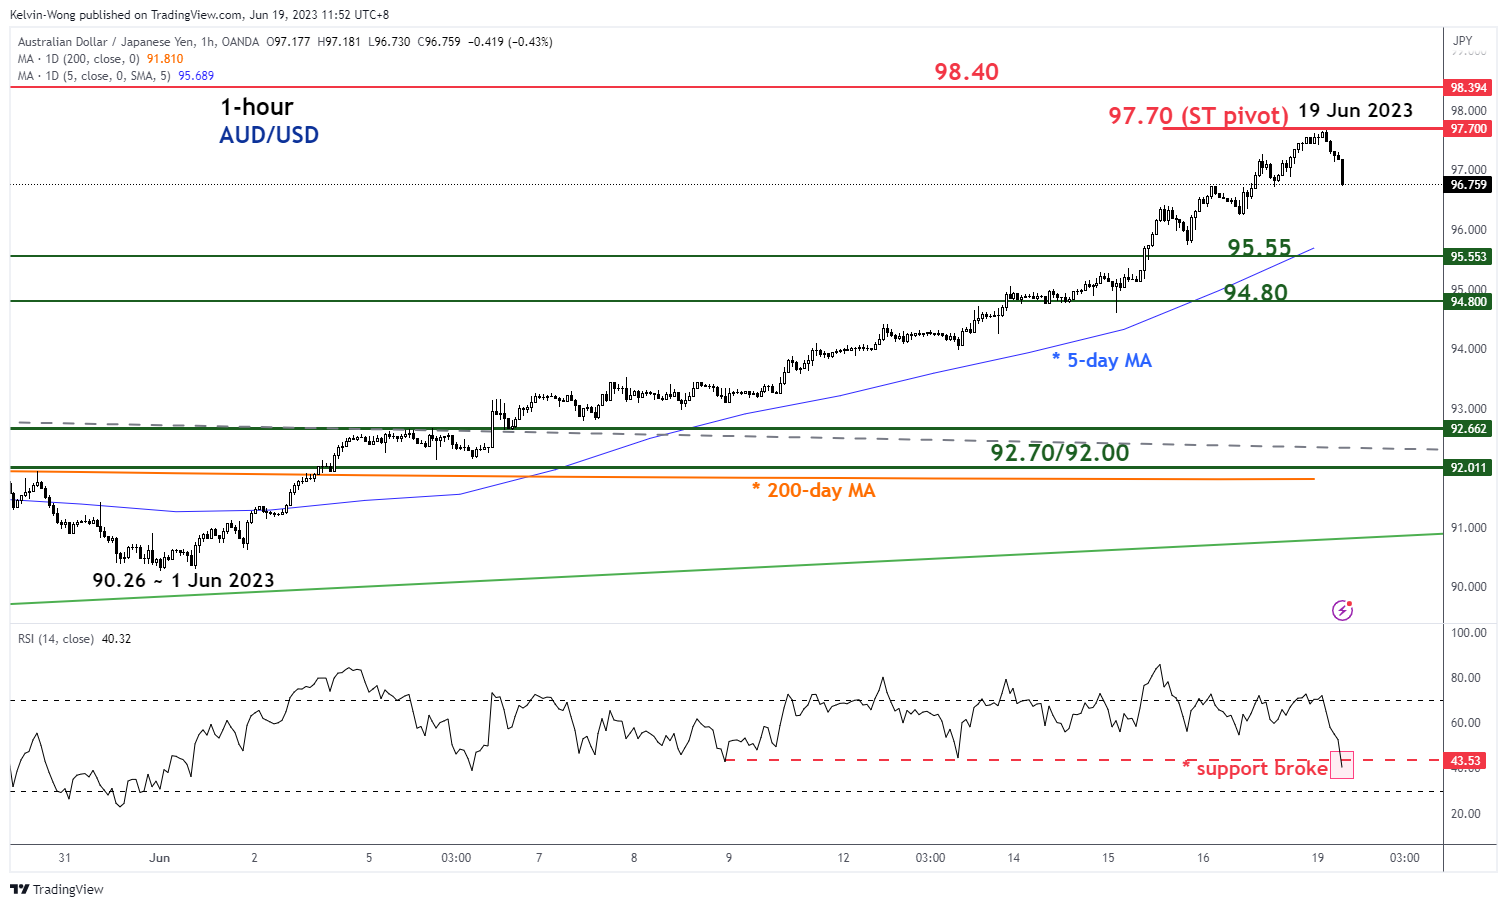
Fig 2: AUD/JPY minor short-term trend as of 19 Jun 2023 (Source: TradingView, click to enlarge chart)
The AUD/JPY has rallied as expected and surpassed 95.50 short-term resistance as highlighted in our previous analysis, “AUD/JPY Technical: Rallied to 6-month high” published on 9 June 2023.
The AUD/JPY has printed a current intraday high of 97.67 today, 19 June in the Asian session, and the current minor uptrend phase in place since its 1 June 2023 low 0f 90.26 has recorded a gain of +741 pips (+8.2%).
Right now, several key technical elements advocate the risk of an overstretched rally, which increases the risk of minor corrective pull-back within a potential ongoing medium-term uptrend phase since the 24 Mar 2023 low of 86.06.
Daily volatility of AUD/JPY has increased to its highest level in 14 months
The daily Bollinger Bandwidth (a measurement of historical volatility) of AUD/JPY has increased significantly in the past three weeks and its current level is at 0.09 is the highest since 11 April 2022.
In addition, the recent price actions of AUD/JPY (15 & 16 June 2023) have two consecutive daily closes above the upper Bollinger Band (see daily chart).
Hence, these observations suggest the up move from the 1 June 2023 low of 90.26 is overstretched (high volatility condition) which may lead to an impending lower normalized volatility condition that is characterized by an impending potential pull-back in price actions of AUD/JPY.
Short-term upside momentum has dissipated
The 1-hour RSI oscillator has exited from its overbought level and just broken below a key corresponding support level of 43.5%.
This short-term momentum factor suggests that the current minor uptrend phase of AUD/JPY since the 1 June 2023 low of 90.26 has started to lose its strength, increasing the risk of a minor correction pull-back (see 1-hour chart)
The near-term supports are coming in at 95.55 (also the 13-day moving average) and 94.80 (38.2% Fibonacci retracement of the minor uptrend from the 1 June 2023 low to 19 June 2023 high).
A clearance above 97.70 short-term pivotal resistance negates the bearish tone to see the medium-term resistance coming in at 98.40 (13 September 2022 swing high area).
Time for Correction?
The week kicks off on positive geopolitical vibes as the weekend talks between the US and China went well, and more senior level talks, including Xi Jinping are expected in the next few hours.
Despite this, Asian indices remained mostly sold on Monday, while US futures traded in the negative. It’s certainly because last week was a bit confusing in terms of where the Federal Reserve (Fed) is headed to, after the dot plot showed two more possible rate hikes before the year ends, versus a final rate hike expected in July. Activity on Fed funds futures gives more than 70% for a July hike, and more than 75% for a September hike on fear that inflation wouldn’t slow as much as expected, and that the US jobs market will remain too robust to call the end of the US rate hikes. Fed Chair Powell will testify before the Senate this week and will certainly stick to the Fed’s hawkish stance.
The S&P 500 and Nasdaq both fell on Friday, but the S&P500 ended last week having gained 2.6%. It was the 5th straight week of gains for the S&P500, while Nasdaq closed the week 3.3% higher than where it had started. Both indices are now at the highest levels since last spring, and both are in overbought territory. Volatility continues fading, while any investors questions whether this is the calm before storm.
On good thing is that the Fed’s reverse repo operations are trending lower, as a result of a flood of US bond issuance following the debt ceiling agreement and keep market liquidity sustained for equities.
But the US 2-year yield is headed toward the 5% mark – which is negative for equity valuations, whereas upside potential remains contained at the long end of the curve. And the widening spread means that bond investors continue pricing in recession in the foreseeable future, which is, in theory, negative for equity valuations as well.
Big Tech is responsible for around 80% of the gains in the S&P500 this year due to the AI-rally, but Russell 2000 gives signs of willingness of joining the rally as well. And because there is nothing much encouraging happening on the Fed end, the overall direction of the market, and market mood, will depend on the performance of the Big Tech. And they are now in the overbought market.
Soft Dollar
The US dollar trades below its 50-DMA, as other central banks are as aggressive as the Fed – if not more! The Bundesbank President Nagel for example hinted that the ECB hikes could extend into autumn and may persist beyond September if core inflation doesn’t slow persistently. The EURUSD is back on track for further gains and will likely continue pushing into the 1.10 psychological mark. Price pullbacks are interesting opportunities to strengthen long positions for a further rise toward the 1.12 mark.
Across the Channel, Cable consolidates above the 1.28 mark ahead of the next inflation update, due Wednesday and the next Bank of England (BoE) decision due Thursday. Inflation in Britain is expected to have eased from 8.7% to 8.4%, but the BoE – which has been telling us since a while that these numbers would get smashed by the H2, is now questioning their inflation forecast model – as a clear sign that even they don’t believe that inflation will take the direction their model says it will. The BoE expectations remain comfortably hawkish, with another 125bp hike priced in before the end of this year. The latter could help push Cable toward the 1.30 mark.
In Switzerland, the Swiss National Bank (SNB) is also preparing to hike the rates by 25bp this week to follow the European peers, while in Turkey, the central bank, with its new leadership, is expected to hike the one-week repo rate from 8.5% to 20% in an effort to normalize the monetary policy that has been put to coma since around two years. Normalization will be painful, both for the economy and the lira, and the dollar-TRY will be left to float free from time to time to test the strength of the negative pressure from the market. The USDTRY remains – is kept - steady around the 23 mark, while the upside is the only direction that the pair could take even despite a monstrous rate hike that will hit the fan this week.
AUD/USD Daily Report
Daily Pivots: (S1) 0.6854; (P) 0.6877; (R1) 0.6899; More...
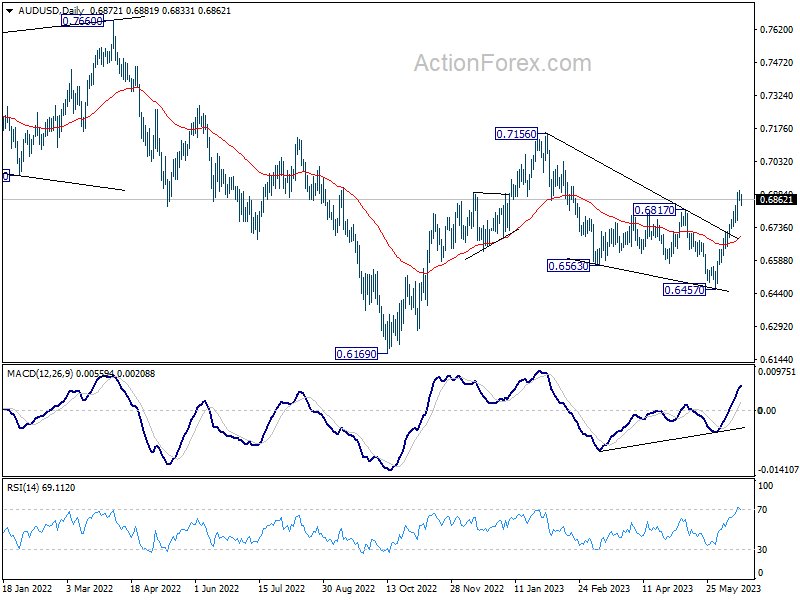
Intraday bias in AUD/USD is turned neutral with current retreat, and with 4H MACD crossed below signal line. Some consolidations could be seen first. But downside of retreat should be contained by 38.2% retracement of 0.6457 to 0.6898 at 0.6730 to bring another rally. As noted before, whole corrective decline from 0.7156 could have completed with three waves down to 0.6457 already. Above 0.6898 will resume the rally from 0.6457 to retest 0.7156 high next.
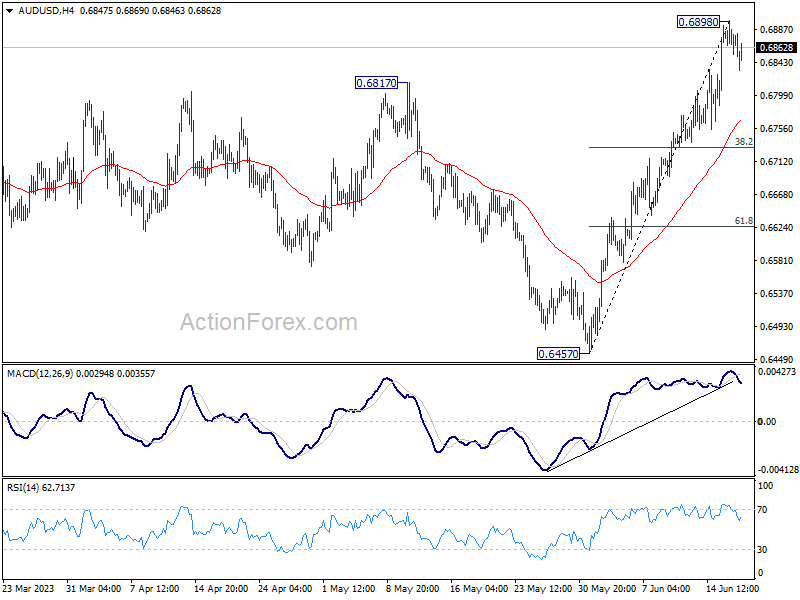
In the bigger picture, fall from 0.7156 could have completed in a three wave corrective structure at 0.6457. The development argues that rise from 0.6169 (2022 low) is still in progress. Firm break of 0.7156 will also add to the case that whole down trend from 0.8006 (2021 high) has finished and turn medium term outlook bullish. For now this will be the favored case as long as 55 D EMA (now at 0.6694) holds, even in case of deep pull back.
Dollar and Yen Licking Wounds; BoE and SNB Hikes Highlight the Week
Dollar and Japanese Yen saw a modest bounce back in today's Asian session, making up for some of their steep losses from last week. However, the buying momentum for both currencies remains relatively weak. Due to a light economic calendar today, coupled with public holiday in the US, trading could be relatively quiet. But, the rest of the week is likely to bring considerable volatility, with BoE and SNB rate decisions, Fed Chair Jerome Powell's testimony, and a barrage of crucial economic data.
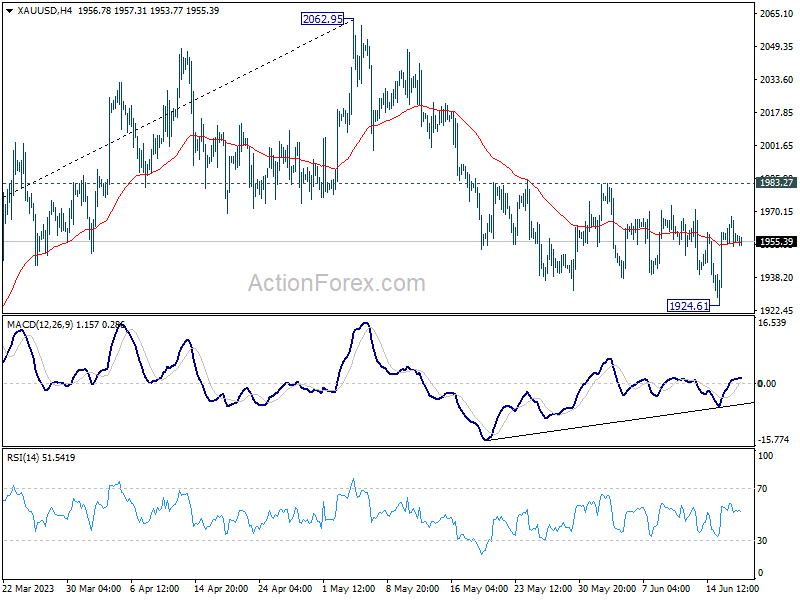
From a technical standpoint, movement in Gold will be observed for signs of an re-escalating selloff in Dollar. Bullish convergence condition in 4H MACD suggests that corrective decline from 2026.95 might have concluded at 1924.61. Solid break above 1983.27 resistance would confirm this scenario, potentially triggering a stronger rally back towards 2062.95 high. On the other hand, if Gold price is rejected by 1983.27, fall from 2062.95 could resume through 1924.61 support. If this scenario materializes, it might be accompanied by a more sustainable rebound in Dollar.
In Asia, at the time of writing, Nikkei is down -0.97%. Hong Kong HSI is down -1.17%. China Shanghai SSE is down -0.49%. Singapore Strait Times is down -0.60%. 10-year JGB yield is down -0.0064 at 0.398, back below 0.4% handle.
NZ BNZ services jumped back to 53.3, economy still on a broader slowing trajectory
New Zealand's BusinessNZ Performance of Services Index climbed from 50.1 in April to 53.3 in May, revealing a slight uptick in the services sector. However, it's worth noting that this figure remains marginally under long-term average of 53.6. A closer look at the numbers shows activity/sales leaping from 45.4 to 52.0, employment increasing from 50.5 to 52.6, and new orders/business ascending from 50.1 to 55.4. Stocks inventories slightly declined from 57.1 to 56.8, while supplier deliveries edged up from 50.6 to 51.1.
BusinessNZ's Chief Executive Kirk Hope shared his insights, stating, "The lift in expansion for May also saw a pickup in the proportion of positive comments, which rose from 39.8% in April to 50.6% for the current month." He further added that while there weren't any defining themes, the overall positive comments were "either industry-specific or very general around increased activity."
Nonetheless, the economy appears to be on a deceleration trajectory, which, according to BNZ Senior Economist Craig Ebert, is necessary to deflate the inflationary pressures.
"The bounce back in the PSI in May arguably helped calm a lot of nerves – after it sagged to 50.1 in April, and after the services component of Q1 GDP declined 0.6%. Still, this doesn't deny the economy is on a broadly slowing trajectory, which is what's required to take the inflationary heat out of it," Ebert explained.
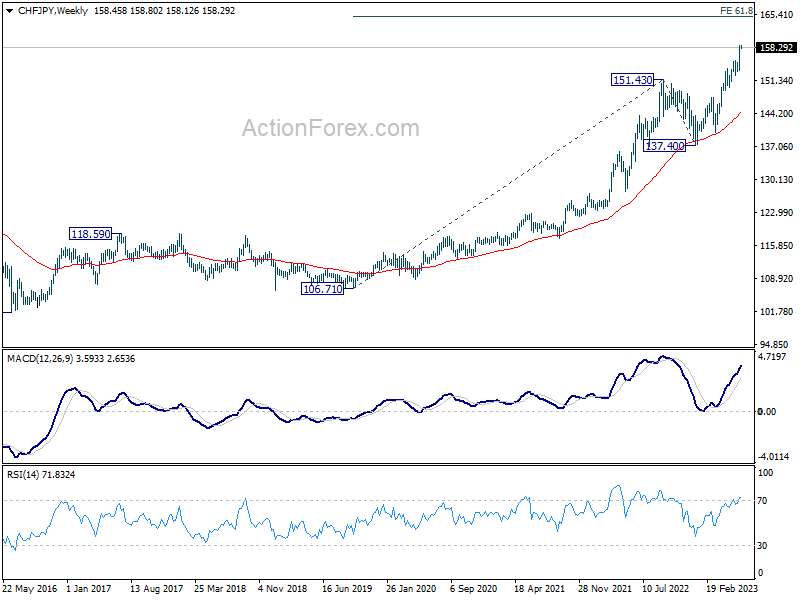
CHF/JPY extending up trend, ready for 160, and then 165
While Swiss Franc hasn't been a strong currency recently, it did manage to extend up trend against Yen. It now ready to take out prior high of 158.45 set in 1979, (barring the spike after SNB suddenly removed the cap of Franc in 2015).
Monetary policy divergence between SNB and BoJ continues to be the driving factor for the move. SNB is set to raise interest rate again this week and any hawkish comments or economic projections could propel CHF/JPY further higher.
From a near term point of view, CHF/JPY passed through 161.8% projection of 137.40 to 147.58 from 140.21 at 156.58 last week. There is no sign of topping yet. Near term outlook will stay bullish as long as 155.53 resistance turned support holds. Next target is 200% projection at 160.57.
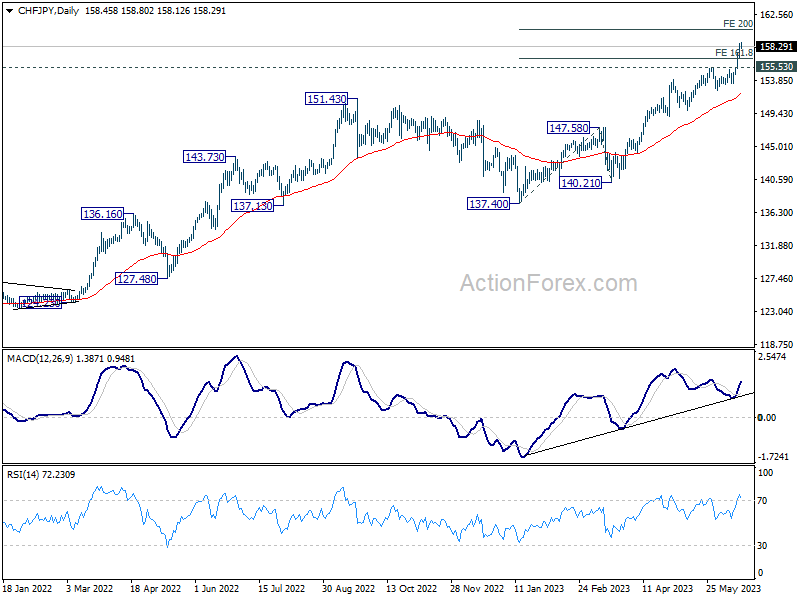
From a medium term point of view, the up trend from 106.71 is in progress, and will remain on healthy track as long as 151.43 resistance turned support holds. Next target is 61.8% projection of 106.71 to 151.43 from 137.40 at 165.03.
BoE and SNB to hike again; Fed Powell to testify; Lots of data
BoE is widely expected raise interest rate by 25bps to 4.75% this week. That would be its 13th straight rate rise as inflation remained stubbornly high despite some cooling. Hawkish bias would be maintained with some analysts expecting at least another 25bps hike in August of September. Yet, markets are indeed pricing in a peak rate of 5.75%. While May CPI data to be released on Wednesday would likely trigger some volatility in Sterling, it's unlikely to alter BoE's decision this time.
SNB is also widely expected to continue tightening this week. But opinions are divided on whether a 25bps or a 50bps hike would be delivered to the current 1.50%. Chairman Thomas Jordan was clear about two things in recent interview. Switzerland's neutral rate might be "slightly lower" than the norm of 2-3%. Additionally, "if inflation is higher than the target, monetary policy must be restrictive." Judging from there, raising interest rate to above 2% should be a natural expectation. The question is only when that will be reached.
In terms of central bank activity, Fed Chair Jerome Powell will testify before Congress this week. He's expected to be scrutinized further regarding Fed's median projection of two more 25bps hike, as well as the timing of rate cuts. RBA minutes of June meeting and BoJ minutes of April meeting (not last week's) will also be published.
On the data front, in addition to the UK, Japan will also publish CPI data. Meanwhile, PMI data from Australia, Japan, Eurozone, UK, and US will also be closely watched.
Here are some highlights for the week:
- Monday: New Zealand BNZ services; Canada IPPI, RMPI; US NAHB housing index.
- Tuesday: RBA minutes; Swiss trade balance; Germany PPI; Eurozone current account; US building permits and housing starts.
- Wednesday: BoJ minutes; Australia leading index; UK CPI, PPI; Canada retail sales, new housing price index.
- Thursday: New Zealand trade balance; SNB rate decision; BoE rate decision; US jobless claims, current account, existing home sales.
- Friday: Australia PMIs; Japan CPI, PMI manufacturing; UK retail sales, PMIs; Eurozone PMIs; US PMIs.
AUD/USD Daily Report
Daily Pivots: (S1) 0.6854; (P) 0.6877; (R1) 0.6899; More...
Intraday bias in AUD/USD is turned neutral with current retreat, and with 4H MACD crossed below signal line. Some consolidations could be seen first. But downside of retreat should be contained by 38.2% retracement of 0.6457 to 0.6898 at 0.6730 to bring another rally. As noted before, whole corrective decline from 0.7156 could have completed with three waves down to 0.6457 already. Above 0.6898 will resume the rally from 0.6457 to retest 0.7156 high next.
In the bigger picture, fall from 0.7156 could have completed in a three wave corrective structure at 0.6457. The development argues that rise from 0.6169 (2022 low) is still in progress. Firm break of 0.7156 will also add to the case that whole down trend from 0.8006 (2021 high) has finished and turn medium term outlook bullish. For now this will be the favored case as long as 55 D EMA (now at 0.6694) holds, even in case of deep pull back.
Economic Indicators Update
| GMT | Ccy | Events | Actual | Forecast | Previous | Revised |
|---|---|---|---|---|---|---|
| 22:30 | NZD | Business NZ PSI May | 53.3 | 49.8 | 50.1 | |
| 12:30 | CAD | Industrial Product Price M/M May | 0.20% | -0.20% | ||
| 12:30 | CAD | Raw Material Price Index M/M May | 2.40% | 2.90% | ||
| 14:00 | USD | NAHB Housing Market Index Jun | 50 | 50 |