

Sample Category Title
Japan starts verbal intervention as USD/JPY surges pass 140
The steep decline in Japanese Yen in Asian session trigger verbal intervention by a top government official. Chief Cabinet Secretary Hirokazu Matsuno said at a press conference, "It is important for foreign exchange markets to move in a stable manner reflecting fundamentals, and excessive changes are undesirable."
"There is no change to the government's stance that we will closely monitor movements in the currency market and take appropriate steps if necessary," he added.
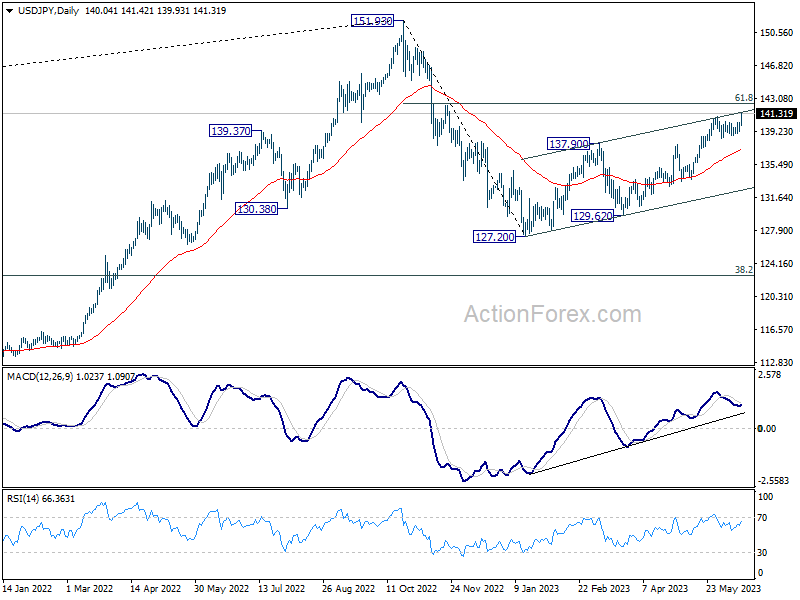
USD/JPY surges pass 140.90 resistance to resume whole rally from 127.20 (Jan low). 61.8% retracement of 151.93 Further rise should be seen to 127.20 at 142.48. But the pair might start to feel heavy above there, as the government could step up rhetorics on intervention further.
China production and investment data show struggling private sector
China's industrial production growth for May came in at 3.5% yoy, aligning with market expectations. However, a discrepancy was observed in growth rates of private and state-owned businesses. Industrial output from private businesses only managed to expand by 0.7% yoy, a stark contrast to the 4.4% yoy growth posted by state-owned enterprises.
Furthermore, China's fixed asset investment rose 4.0% ytd yoy, a figure falling short of the anticipated 4.4% and a marked deceleration from 4.7% recorded during the first four months of 2023. Notably, private businesses experienced a dip in their fixed asset investment by -0.1% ytd yoy, while state-owned enterprises reported robust growth of 8.4%.
Meanwhile, retail sales failed to meet expectations, recording a rise of 12.7% yoy, lower expectation of 13.9% yoy increase.
In a separate but related development, People's Bank of China announced a cut in rate on its one-year medium-term lending facility loans to financial institutions. The rate was lowered from 2.75% to 2.65%, following the bank's decision to cut seven-day reverse repo and standing lending facility rate earlier this week.
Australia employment grew 75.6k in May, unemployment rate back to 3.6%
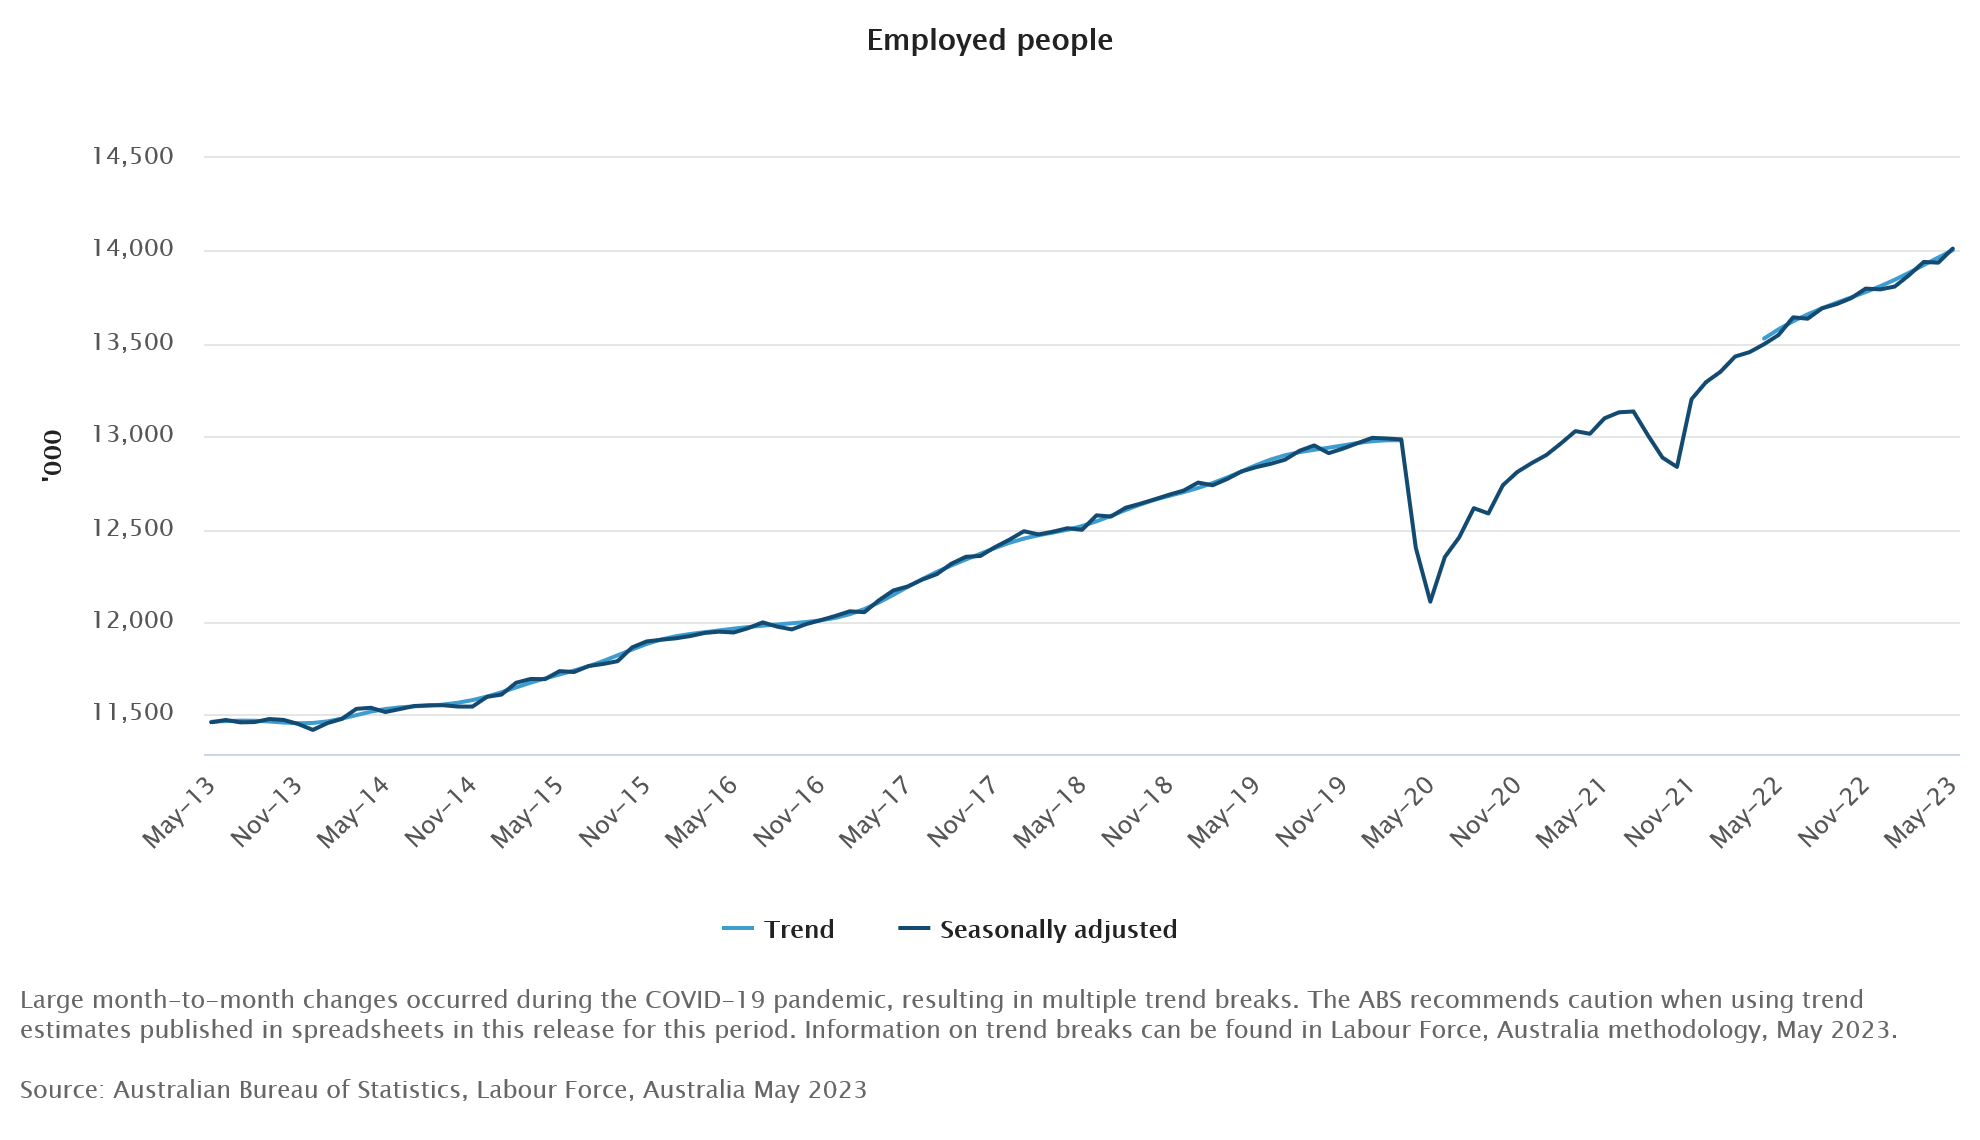
Australia employment rose 75.6k in May, well above expectation of 16.5k. Full time jobs grew 61.7k while part-time jobs grew 14.3k.
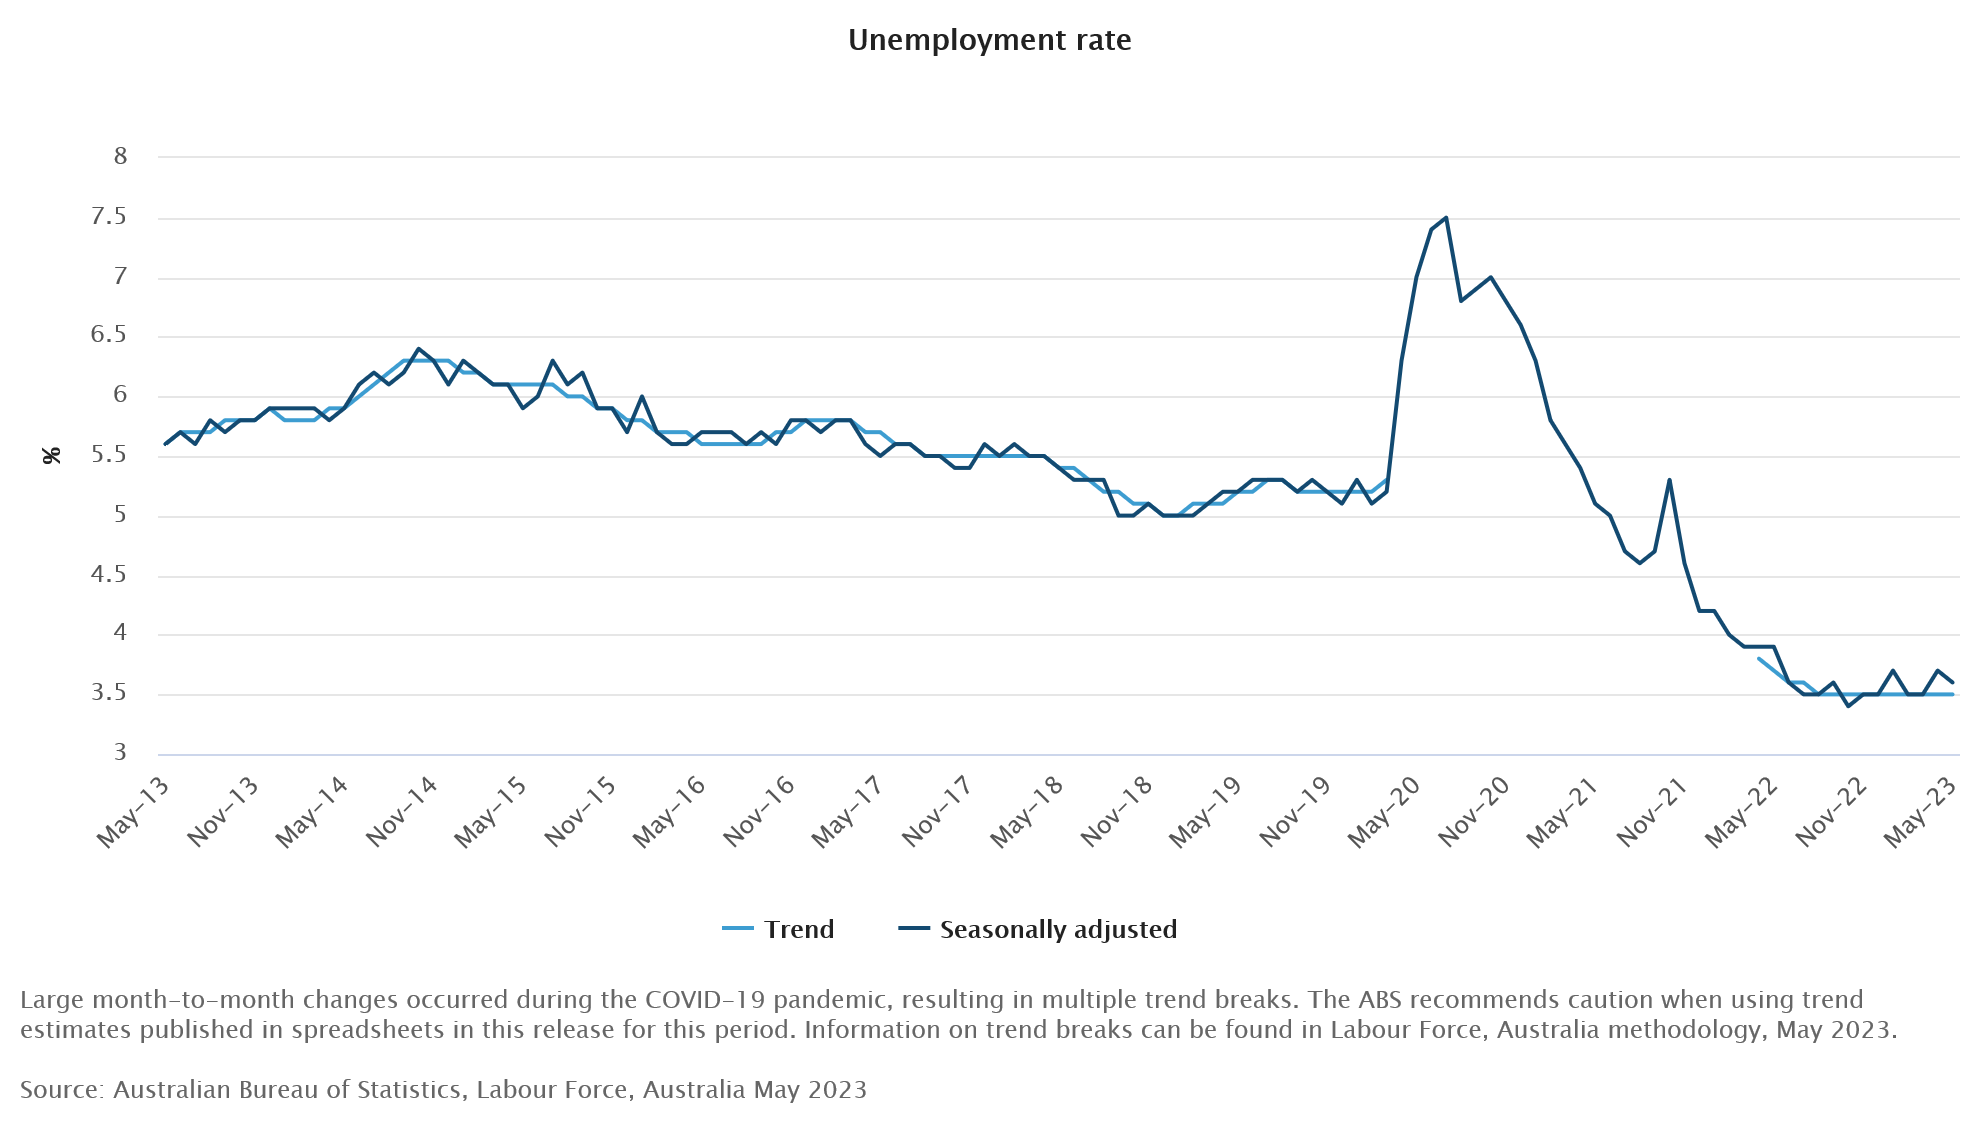
Unemployment rate dropped from 3.7% to 3.6%, below expectation of 3.7%. Participation rate rose from 66.7% to 66.9%. Monthly hours worked dropped -1.8% mom. Employment-to-population ratio rose 0.2% to 64.5%, a record high.
Bjorn Jarvis, ABS head of labour statistics, said: "Looking over the past two months, the employment increases average out to around 36,000 extra employed people each month. This is still around the average over the past year of 39,000 people a month."
"Just before the start of the pandemic almost 13 million people were employed in Australia. In May 2023, this had risen to just over 14 million people."
NZ GDP down -0.1% qoq in Q1, driven by inventory rundown and services exports
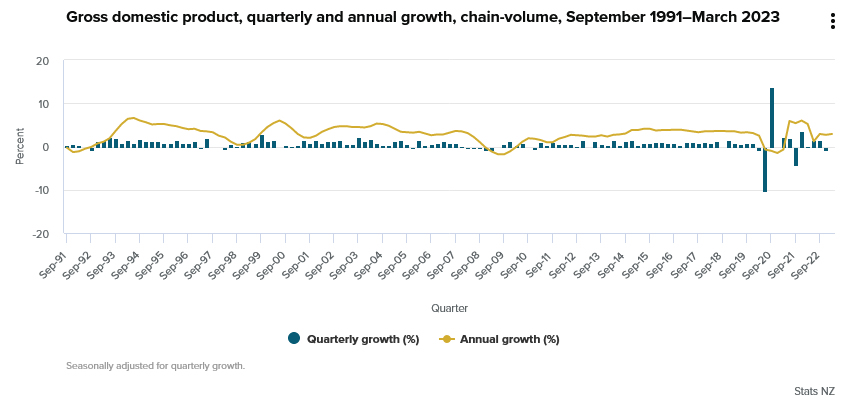
New Zealand GDP contracted -0.1% qoq in Q1 as expected. Primary industries fell -0.5%. Service industries fell -0.6%. Goods producing industries fell -0.4%.
StatsNZ noted, "The expenditure measure of GDP fell 0.2 percent this quarter. This decline was driven by run downs in inventories held by businesses, and a fall in exports of services."
"A 2.4 percent increase in household consumption expenditure and 2.0 percent growth in investment in fixed assets partially offset the falls."
Nikkei 225 Technical: Overstretched Rally
Nikkei 225 Technical: Overstretched Rally
- Nikkei 225 has hit a 33-year high with a 2023 YTD return of +29%.
- Its 3-month up move has reached overstretched condition, more than two standard deviations above its 20-day moving average for three consecutive days.
- At the risk of a corrective pull-back with short-term bullish momentum dissipating.
Fig 1: Japan 225 short-term trend as of 15 Jun 2023 (Source: TradingView, click to enlarge chart)
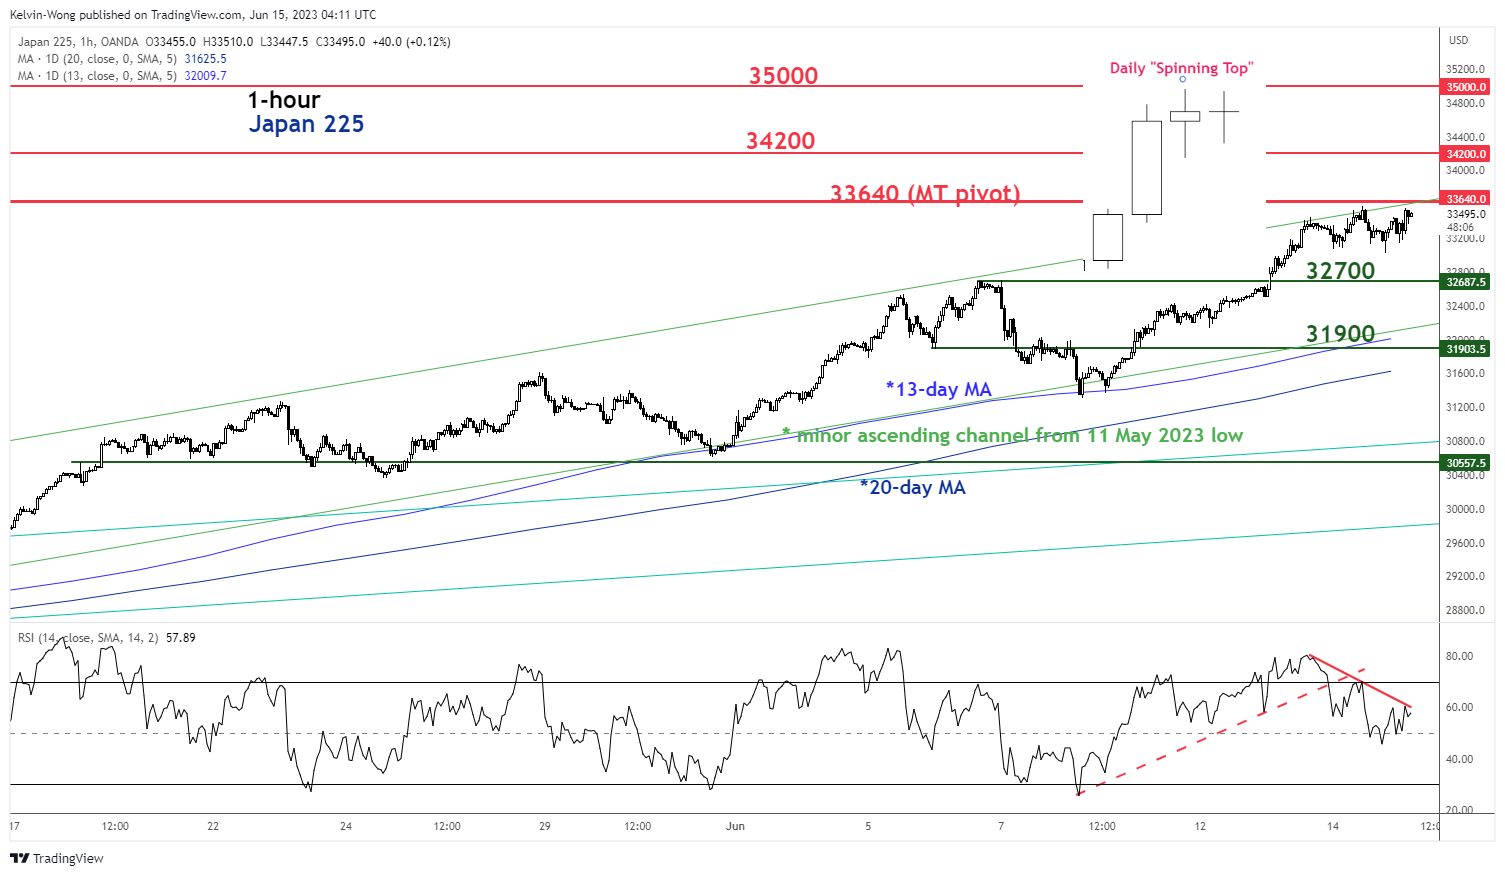
Since its 16 March 2023 low, the Japanese benchmark cash stock index, Nikkei 225 has staged a magnificent rally of 26.7% based on the current, 15 June intraday level of 33,720 at this time of the writing, a 33-year high and notched a 2023 year-to-date return of +29%, one of the top performing major stock indices (second to the US Nasdaq 100 at 37% YTD).
Rally hit overstretched condition
The 3-month of medium-term up move has reached an overstretched condition where its price actions have traded beyond two standard deviations above its 20-day moving average for three consecutive days.
The Japan 225 (a proxy of the Nikkei 225 futures) has almost reached a key short-term resistance of 33,640, defined by the upper boundary of a minor ascending channel in place since the 11 May 20023 low and a Fibonacci extension cluster.
Exhaustion elements surfaced, at risk of minor corrective decline
In addition, several bullish exhaustion elements have emerged, and the daily price action of 14 June 2023 has formed a “Spinning Top” Japanese candlestick pattern. In the shorter-term frame, the 1-hour RSI oscillator has formed a bearish divergence signal after it reached a 5-day high overbought level of 80.36 on 13 June 2023.
Watch the 33,640 key short-term pivotal resistance with near-term support at 32,700 and a break below it exposes the next support at 31,900 (the 13-day moving average & the lower boundary of the minor ascending channel). On the flip side, a clearance above 33,640 negates the bearish tone to see the next resistances coming in at 34,200 and 35,000.
Australia May Labour Force: A Robust Read But Flattered by April’s Seasonal ‘Anomaly’
Total employment: +75.9k from –4k (revised from –4.3k); unemployment rate: 3.6% from 3.7%; participation rate: 66.9% from 66.7%.
Total employment gained 75.9k or 0.5% in May, higher than Westpac’s near top-of-the-market forecast for a +40k gain, but well above the market median forecast for a more modest +17.5k lift. This has seen the three-month average growth rate lift from +42.9k/mth to +47.6k/mth.
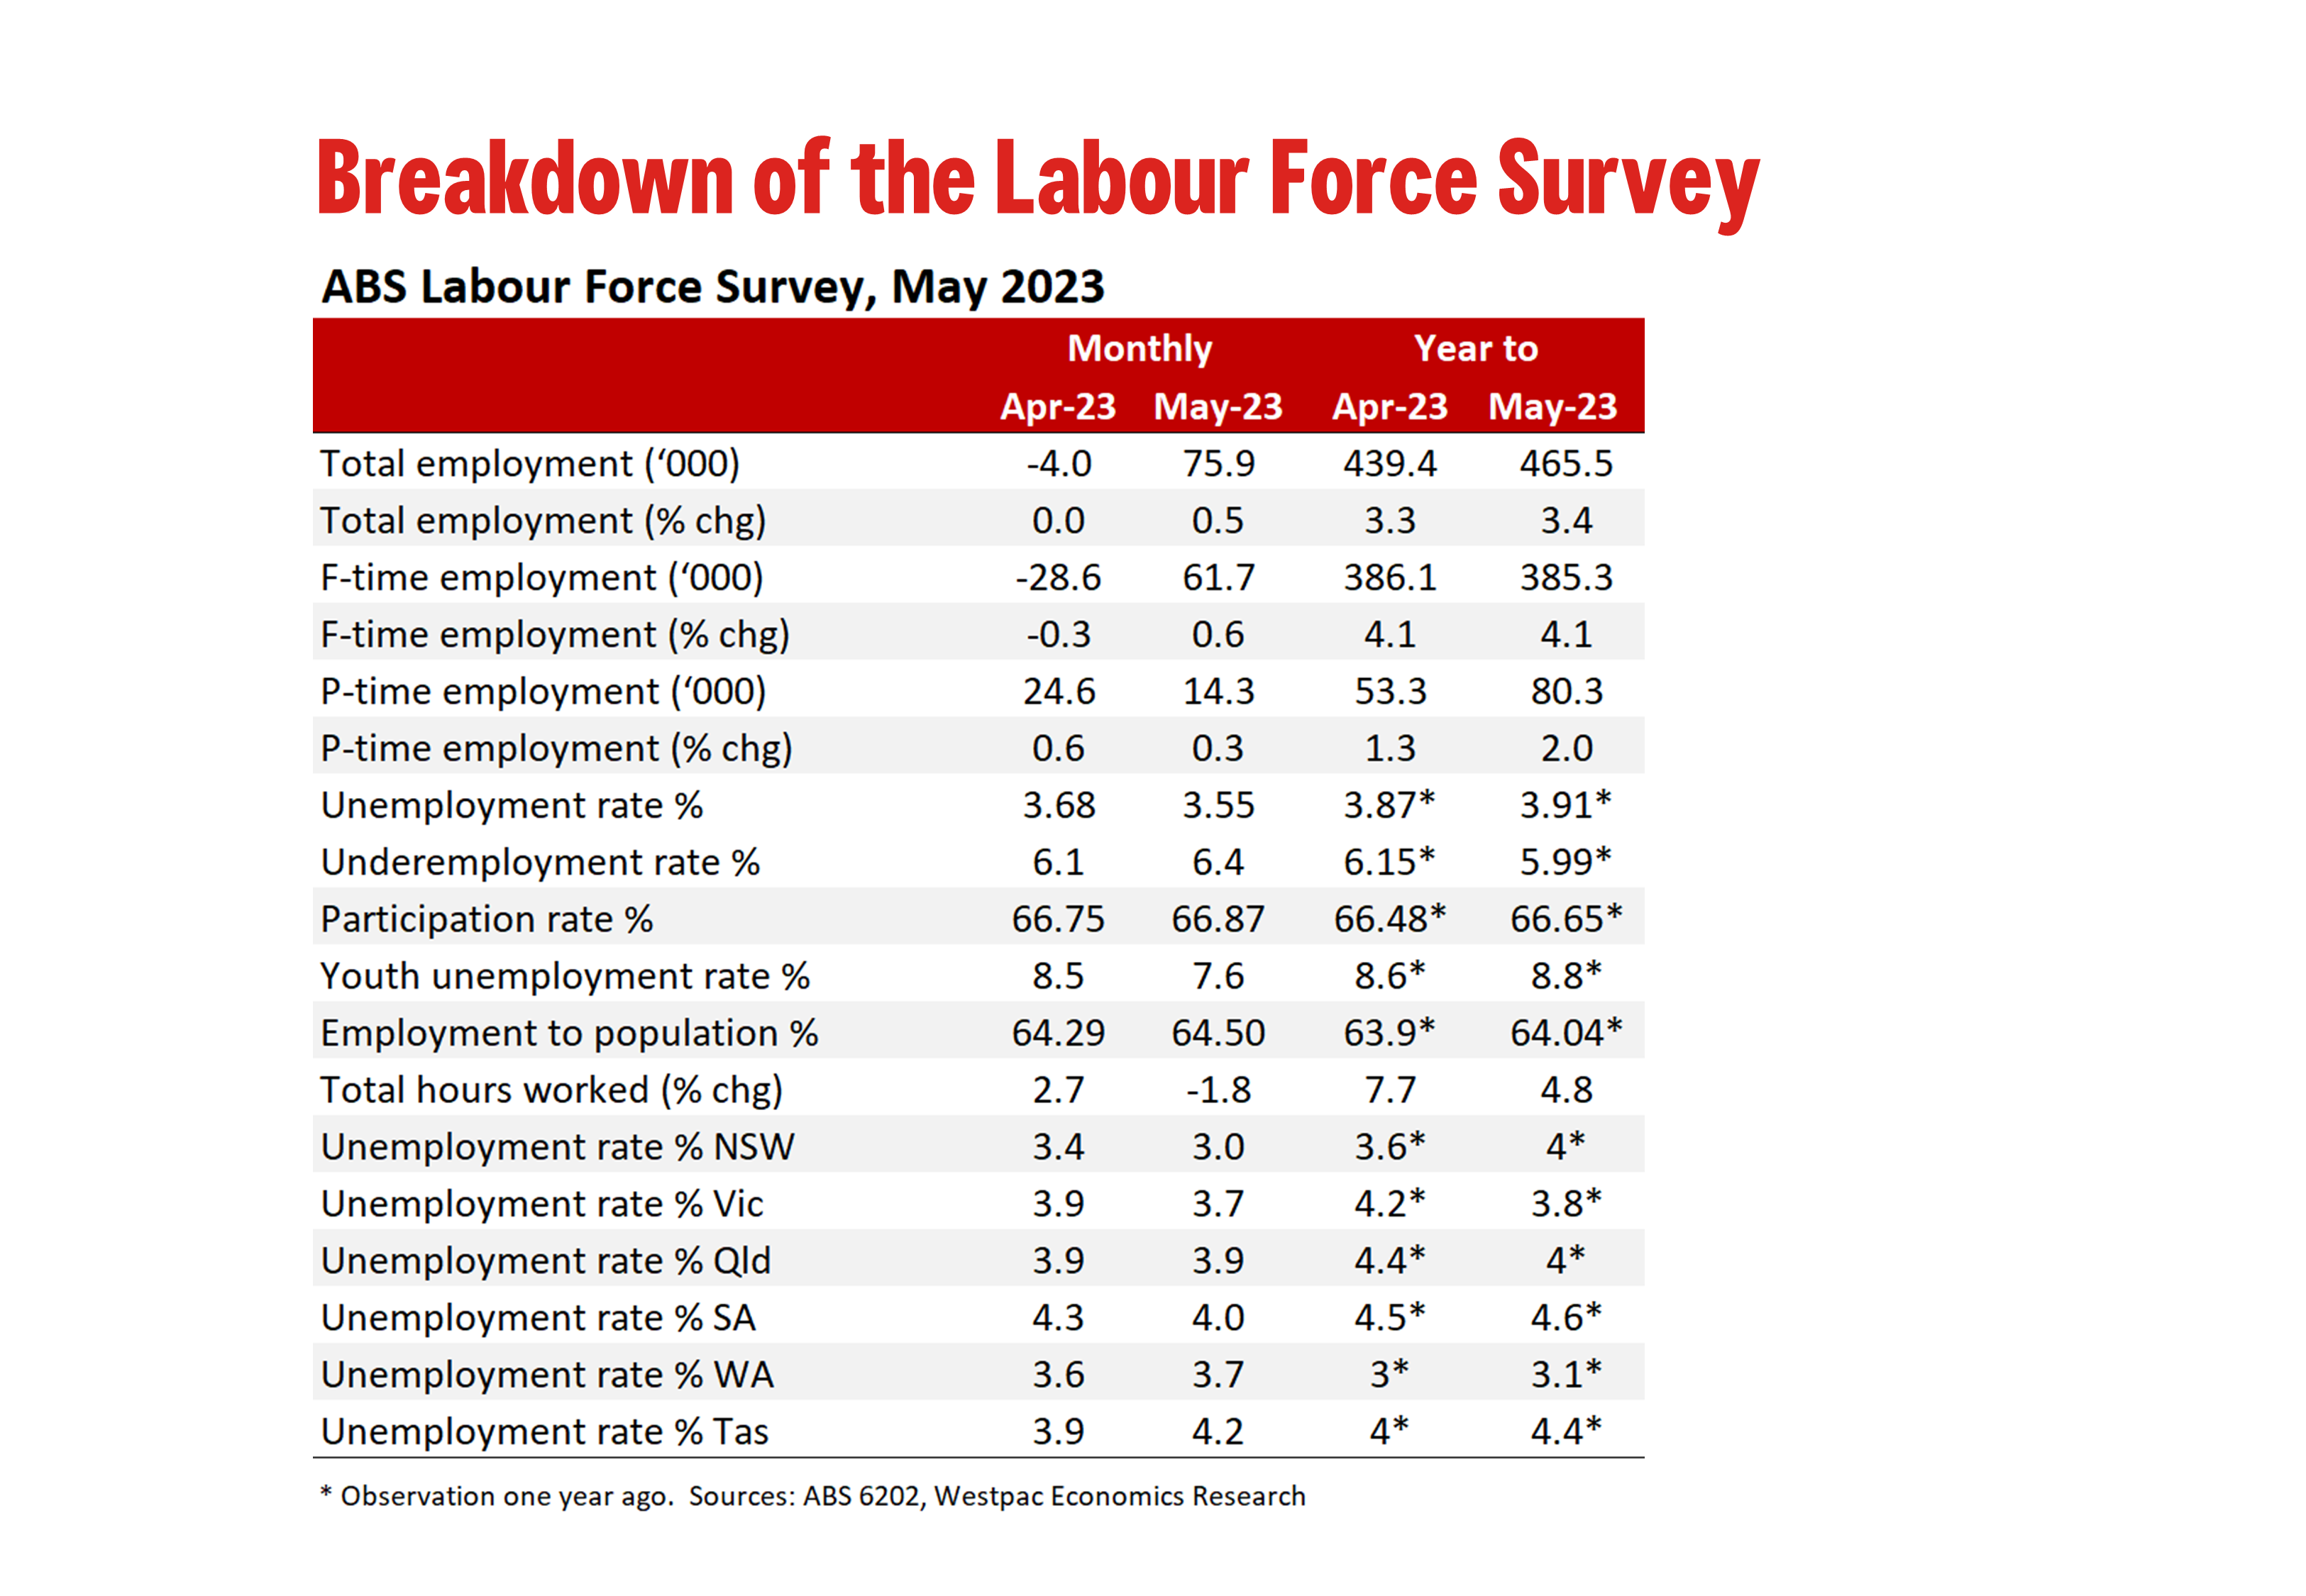
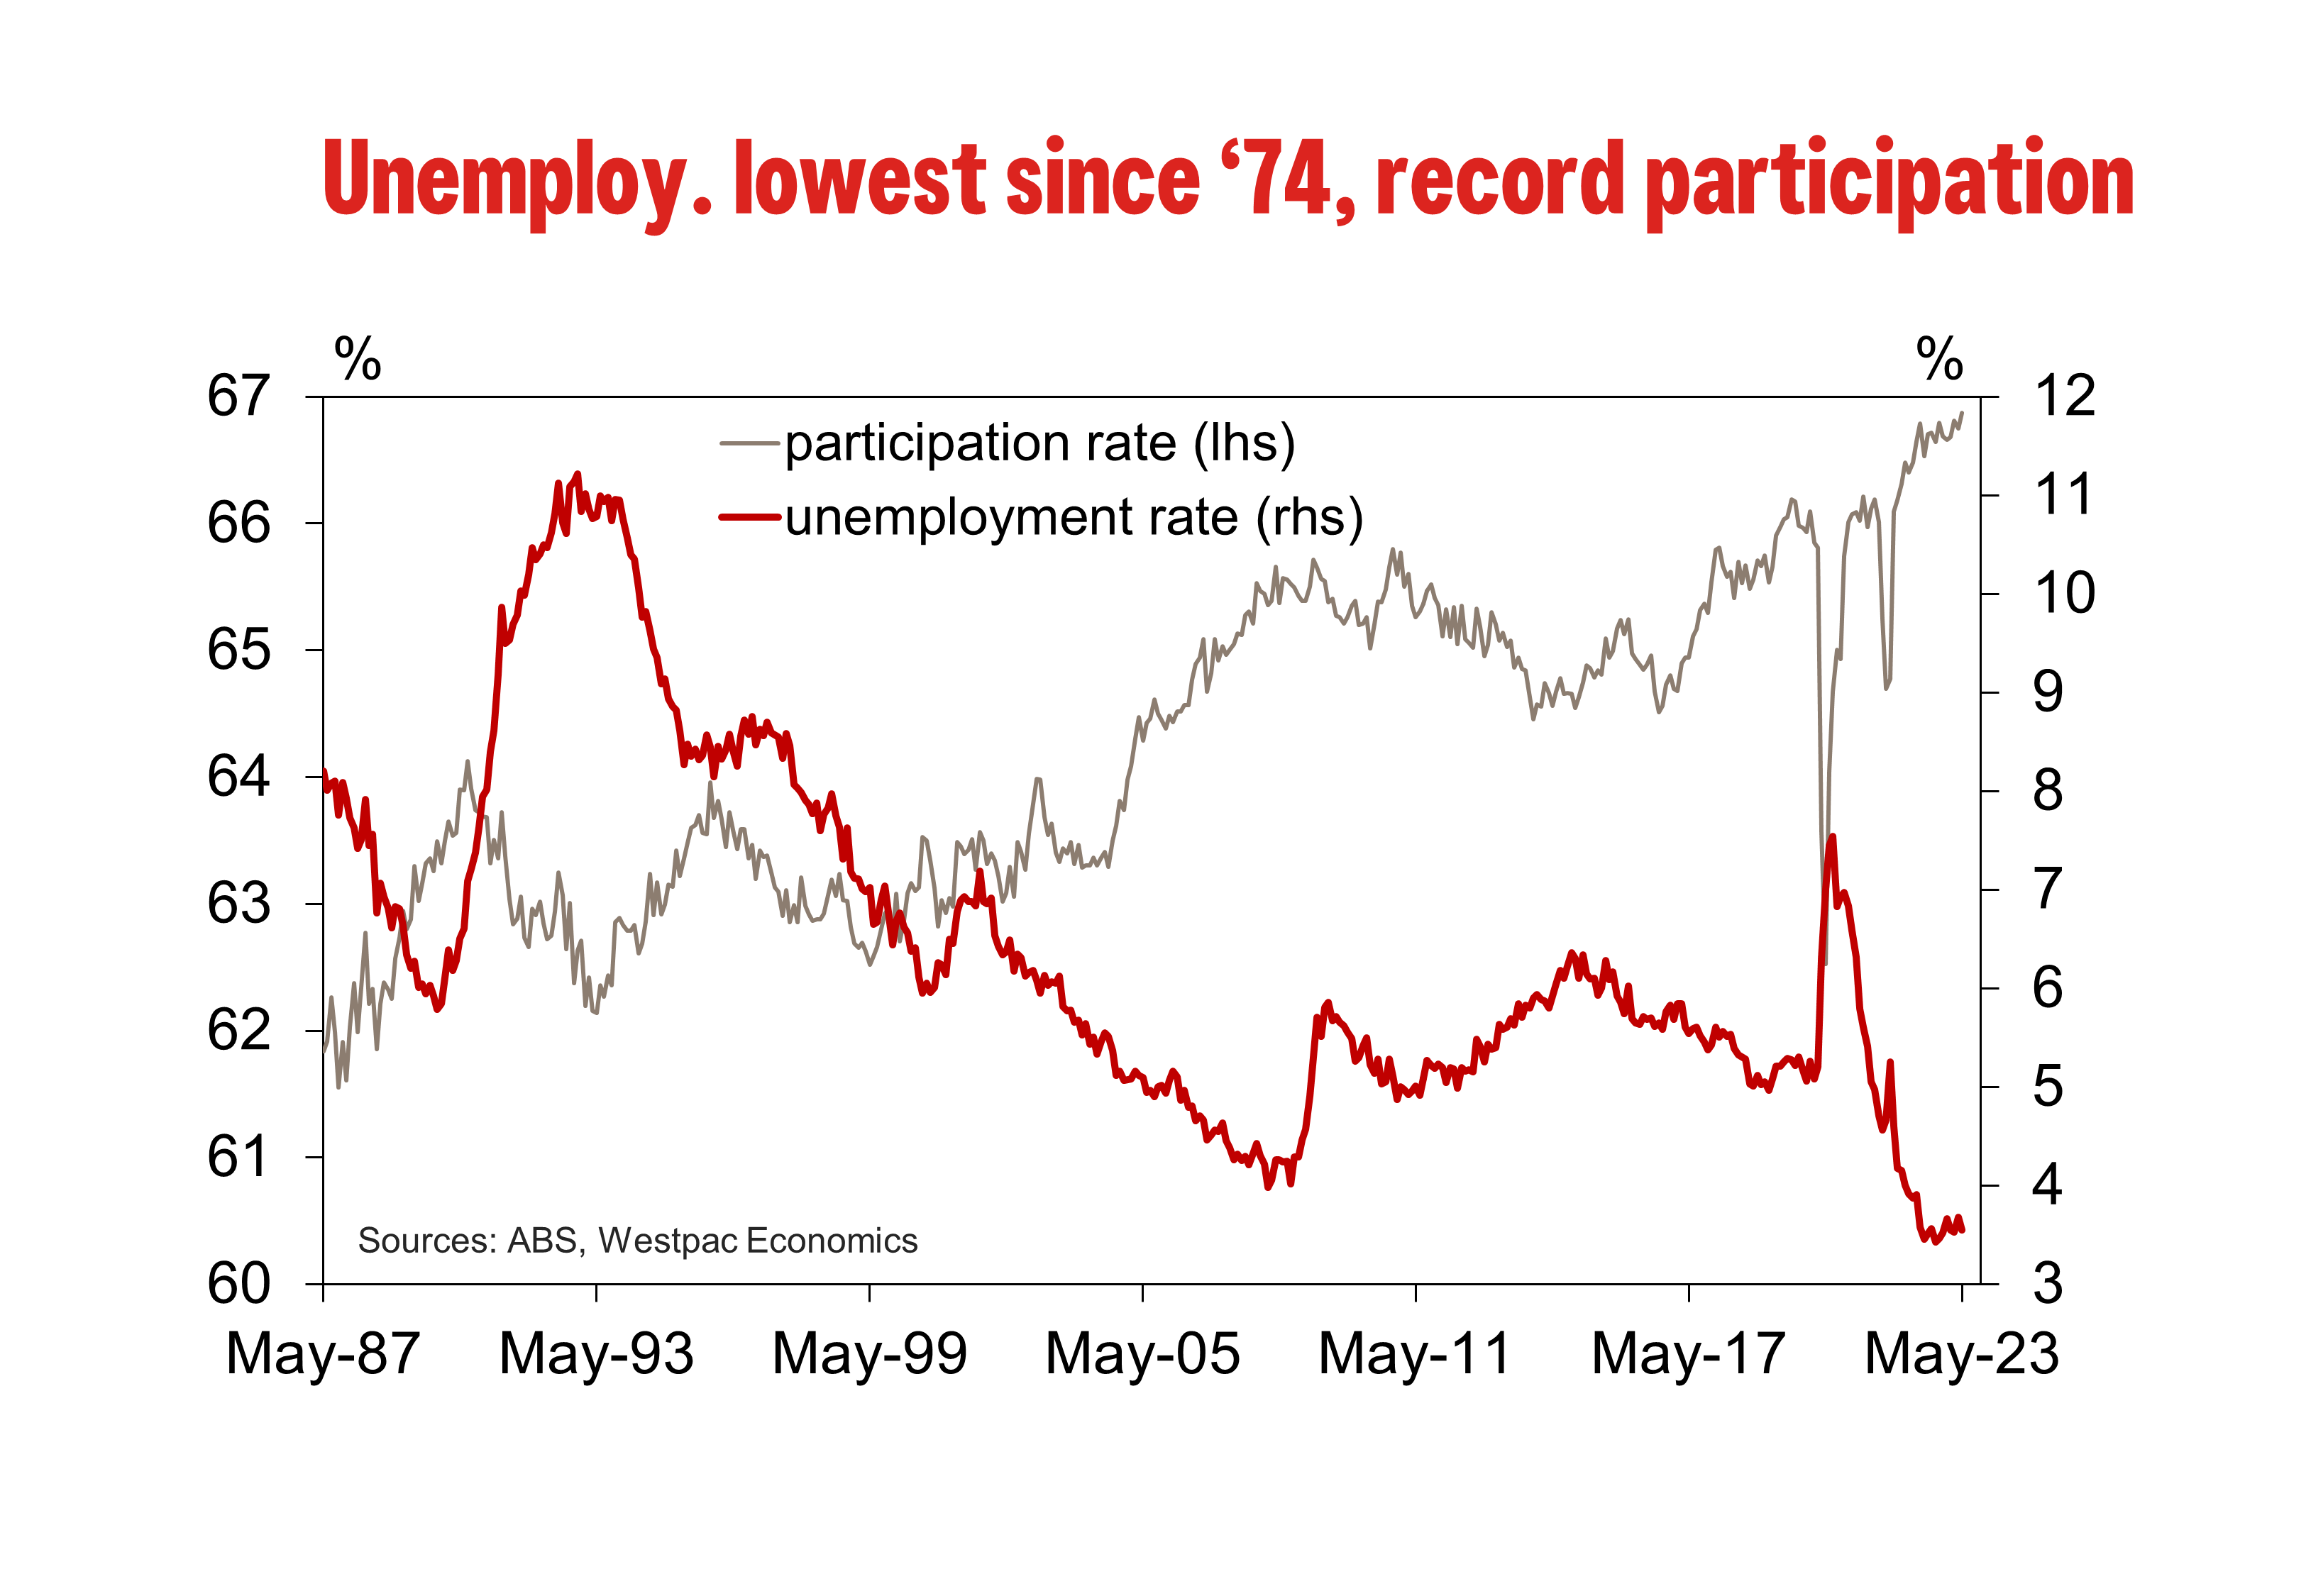
Other areas of the survey also exhibited strength too, including the lift in the participation rate (66.7% to 66.9%) and the employment-to-population ratio (64.3% to 64.5%), both representing fresh record highs. The rise in participation saw the labour force expand by a sizeable 59.4k in May, but with employment also lifting strongly, the unemployment rate dipped from 3.7% to 3.6%. At two decimal places, the unemployment rate is currently at 3.55%, so only just rounding up to 3.6%.
We do stress that some level of caution is warranted in the interpretation of the May results. In particular, the prior survey in April reported a surprise decline in employment of –4.0k and a rise in the unemployment rate from 3.5% to 3.7%. However, we noted that the April 2023 survey is among a small set of years in which the survey period fully coincided with all Easter holidays (as opposed to only a partial overlap).
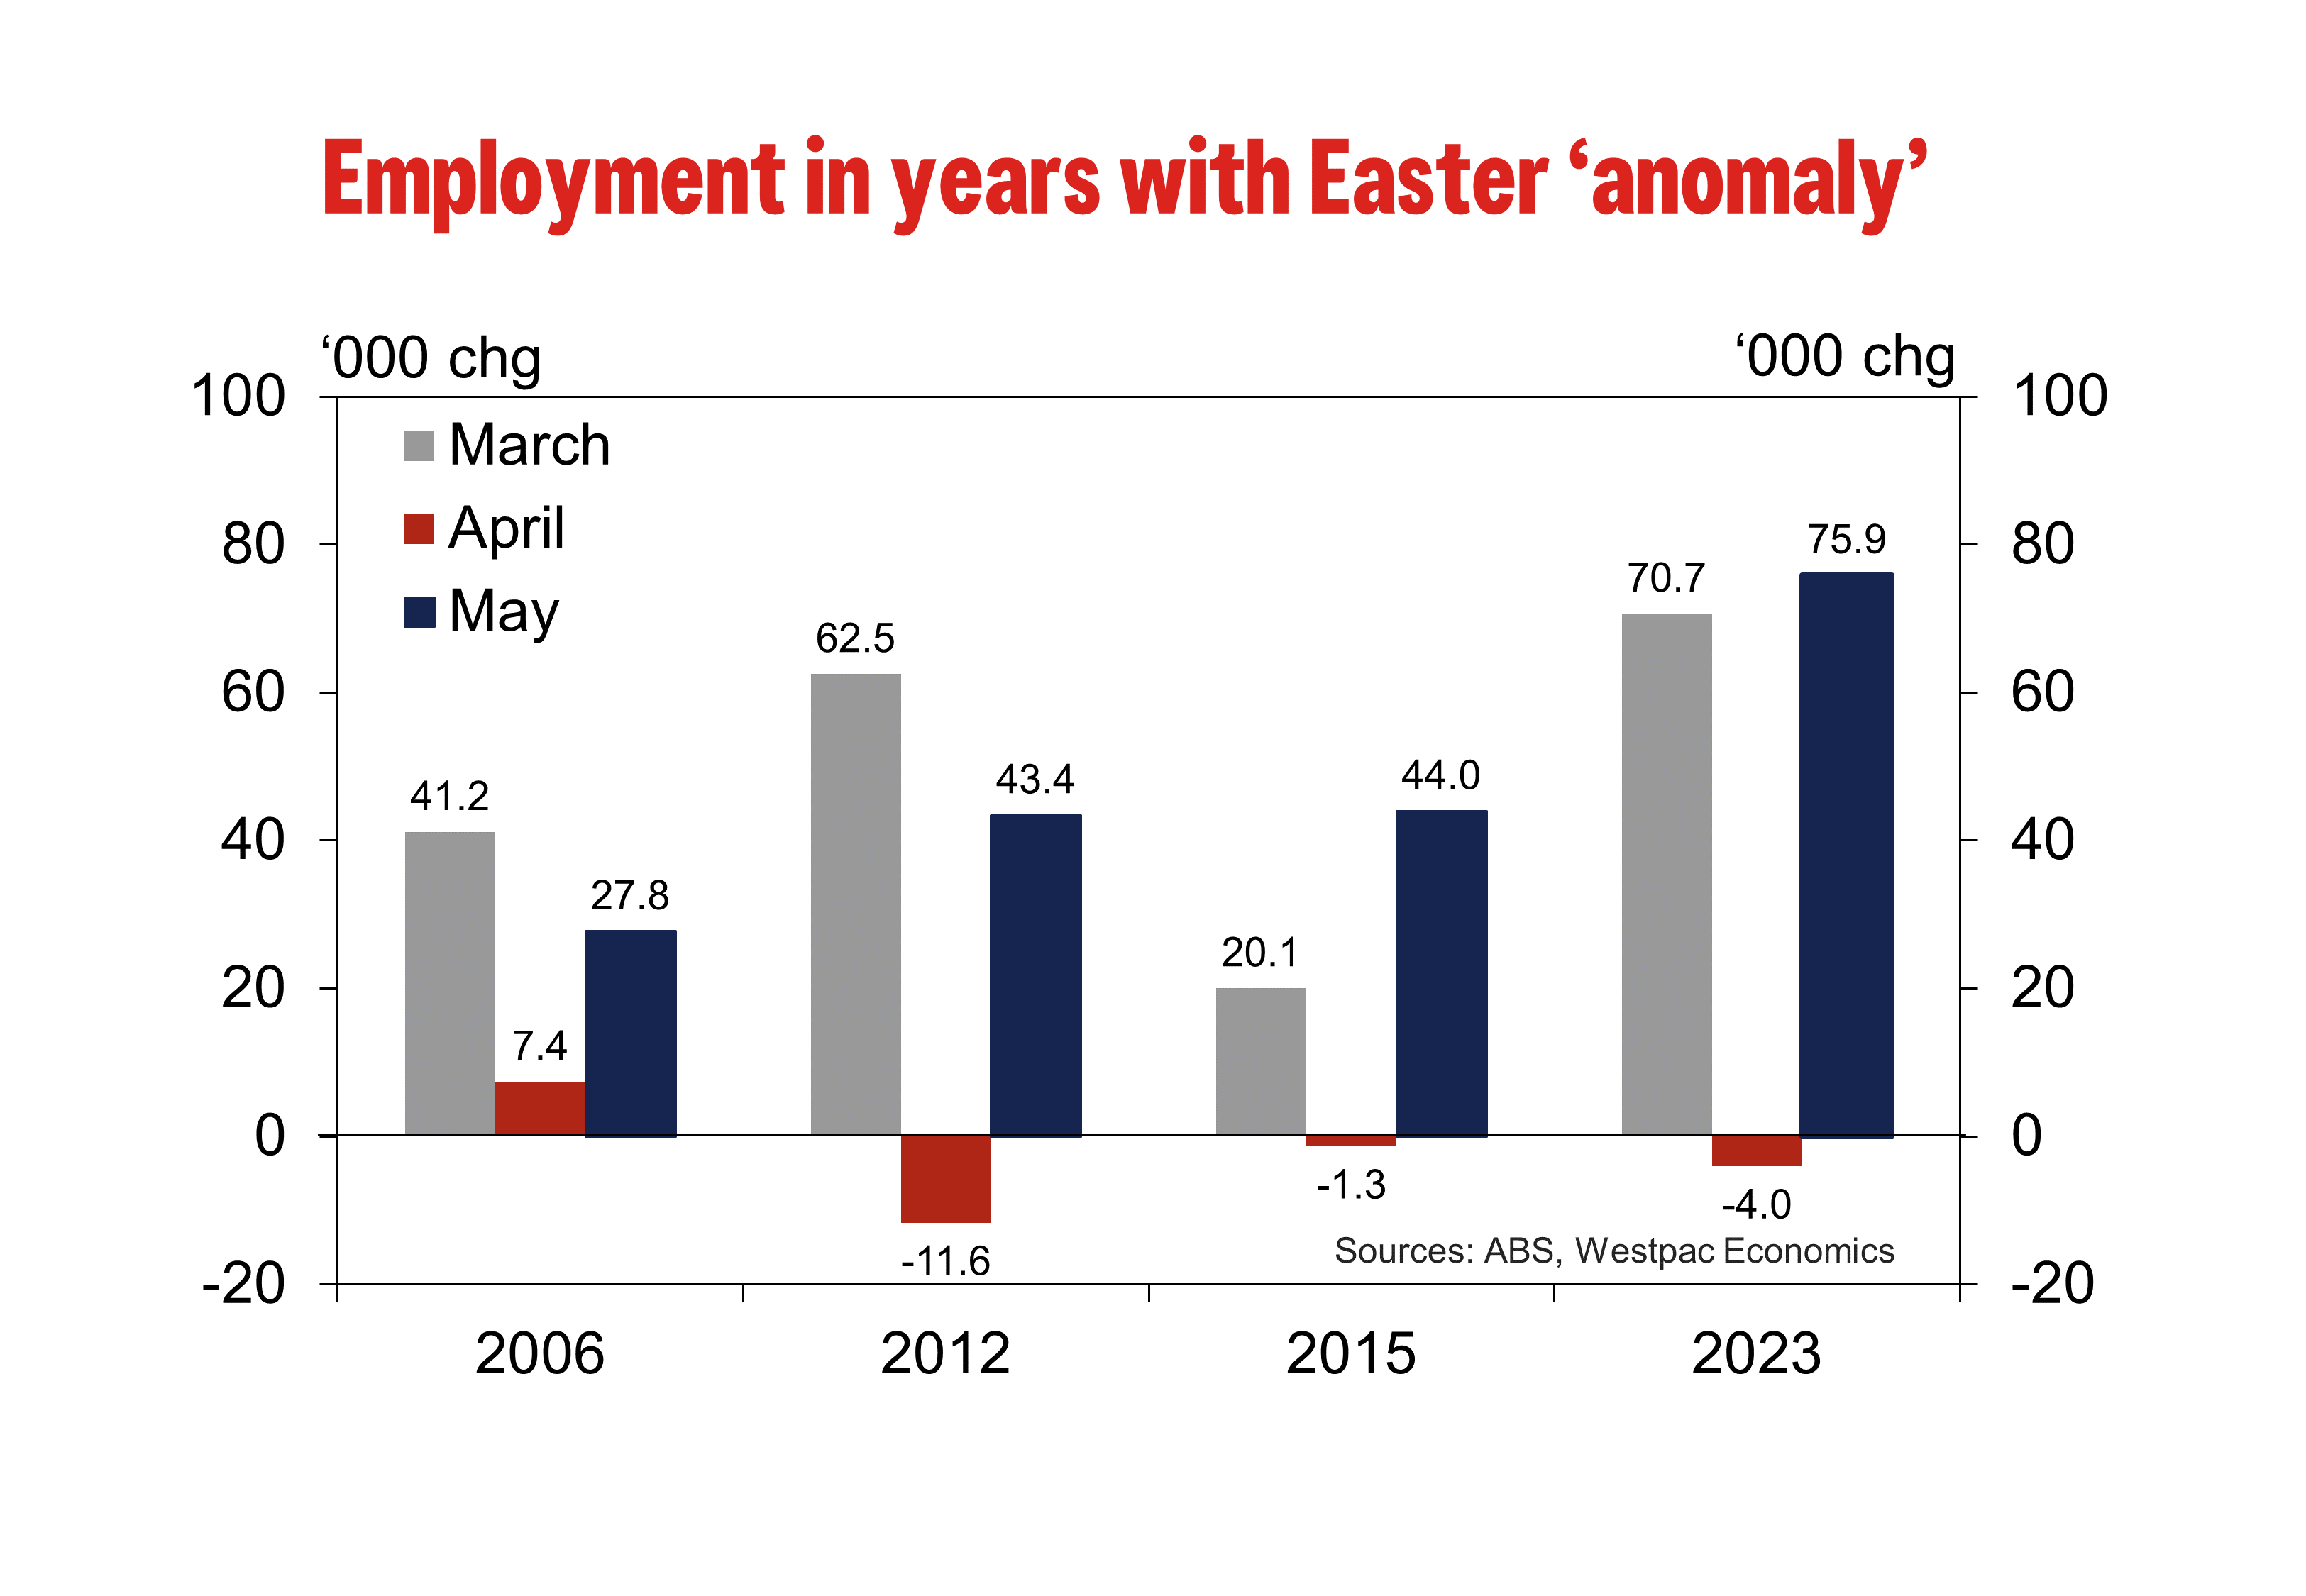
This seasonal ‘anomaly’ has only been observed three other times over the last 20 years (2015, 2012 and 2006), making it difficult to adjust for. Jobs growth exhibited a clear pattern across all those years with pronounced softness in April followed by a bounce-back in May – a dynamic we expected to play out again in 2023.
However, even in taking this into account the May Labour Force Survey provided a stronger-than-expected update, as evinced by average monthly employment gains remaining robust and the unemployment rate holding near historic lows, suggesting that if the labour market were softening, it is only doing so to a marginal degree. We are processing the numbers and working through how they will impact on our current labour market forecasts.
Technical Outlook and Review
DXY:
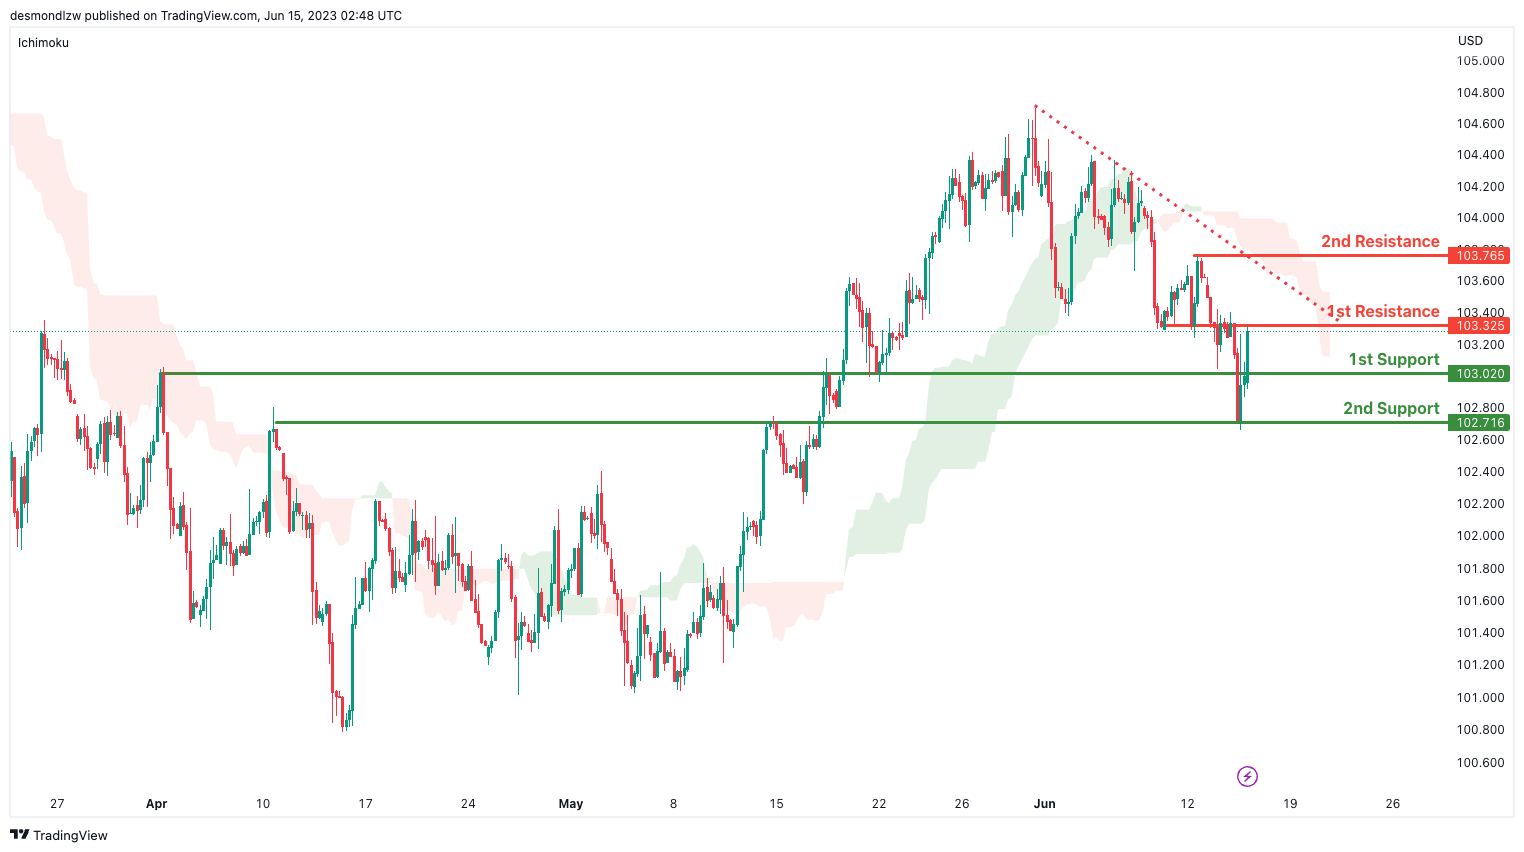
The DXY (US Dollar Index) chart currently shows a bearish momentum, indicating a downward trend in price.
Several factors contribute to this momentum. Firstly, the price is below a major descending trend line, suggesting that bearish momentum is likely to continue. Additionally, the price is below the bearish Ichimoku cloud, further reinforcing the bearish sentiment.
There is a potential for a bearish reaction off the first resistance level at 103.32, which is an area of overlap resistance. This level may act as a point of resistance where sellers could potentially enter the market.
On the downside, the first support level at 103.02 can be considered as a level of support. It is a pullback support level, indicating a potential area where buyers could step in.
The second support level at 102.71 is an additional area of support, representing an overlap support level.
EUR/USD:
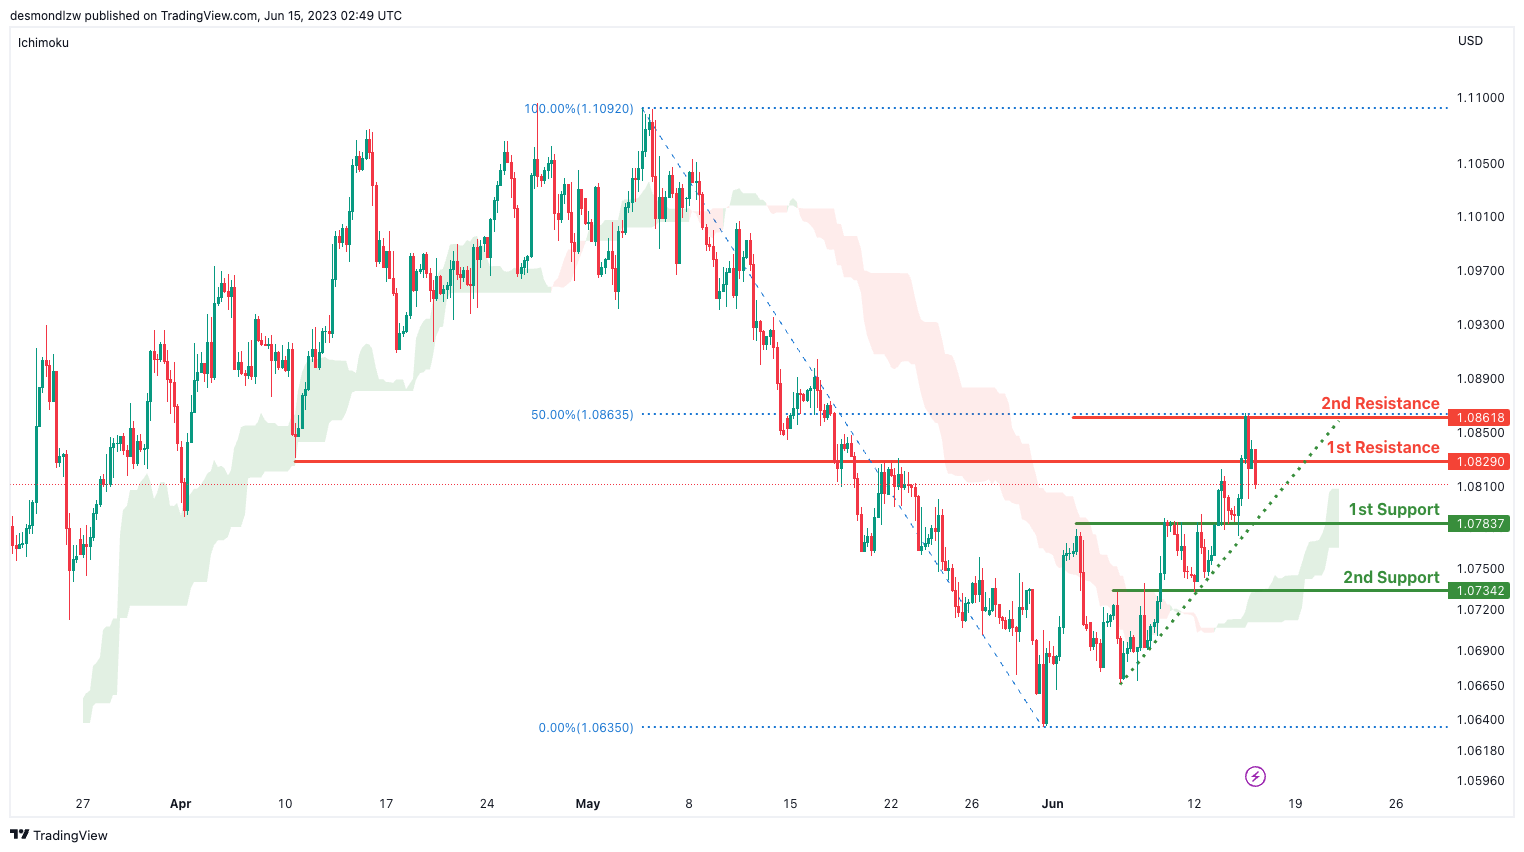
The EUR/USD chart currently shows a bullish momentum, indicating an upward trend in price.
Several factors contribute to this momentum. Firstly, the price is above a major ascending trend line, suggesting the potential for further bullish momentum. Additionally, the price is above the bullish Ichimoku cloud, further reinforcing the bullish sentiment.
In the short term, there is a possibility for the price to drop further towards the first support level at 1.0783 before potentially bouncing back and rising towards the first resistance at 1.0829.
The first support level at 1.0783 is significant as it represents an area of overlap support. It is a level where buyers may step in to support the price.
The second support level at 1.0734 is another area of support, representing an overlap support level.
On the upside, the first resistance level at 1.0829 acts as a pullback resistance, potentially causing the price to face selling pressure.
Similarly, the second resistance level at 1.0861 is a swing high resistance, which further reinforces the potential for price reversal or a stall in upward movement.
GBP/USD:
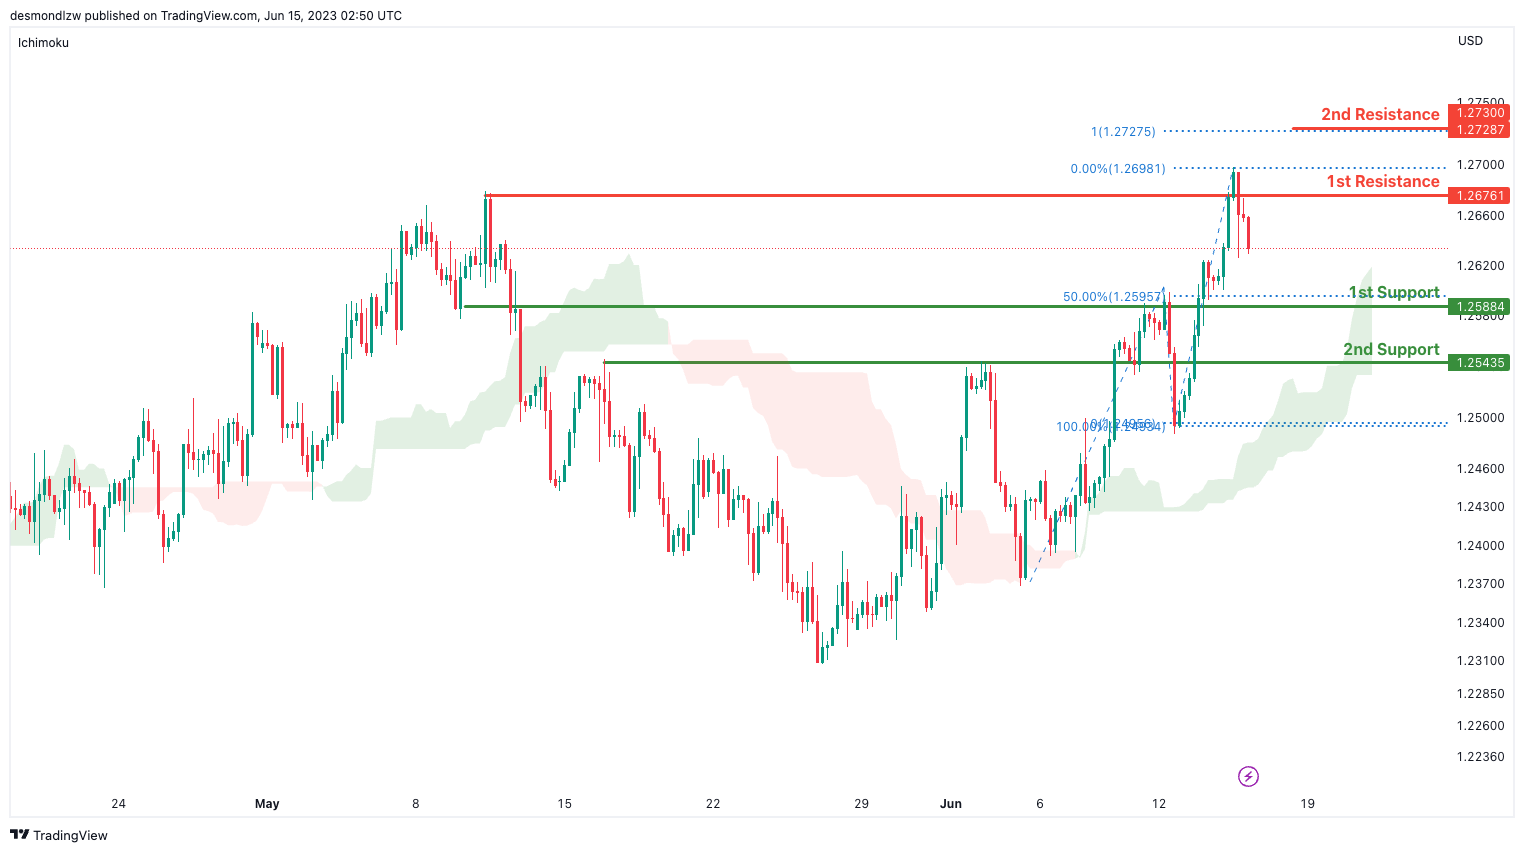
The GBP/USD chart currently exhibits a bullish momentum, indicating an upward trend in price.
One of the contributing factors to this momentum is that the price is above the bullish Ichimoku cloud. This suggests a positive sentiment and potential for further upward movement.
In the short term, there is a possibility for the price to drop further towards the first support level at 1.2588 before potentially bouncing back and rising towards the first resistance at 1.2676.
The first support level at 1.2588 is significant as it represents an area of overlap support and coincides with the 50% Fibonacci retracement level. Traders may consider this level as a potential area of support where buyers may step in.
The second support level at 1.2543 is a pullback support level, providing additional support to the price.
On the upside, the first resistance level at 1.2676 acts as a pullback resistance, potentially causing the price to face selling pressure.
The second resistance level at 1.2738 represents the 100% Fibonacci projection, further reinforcing its significance as a potential level where the price might encounter resistance.
USD/CHF:
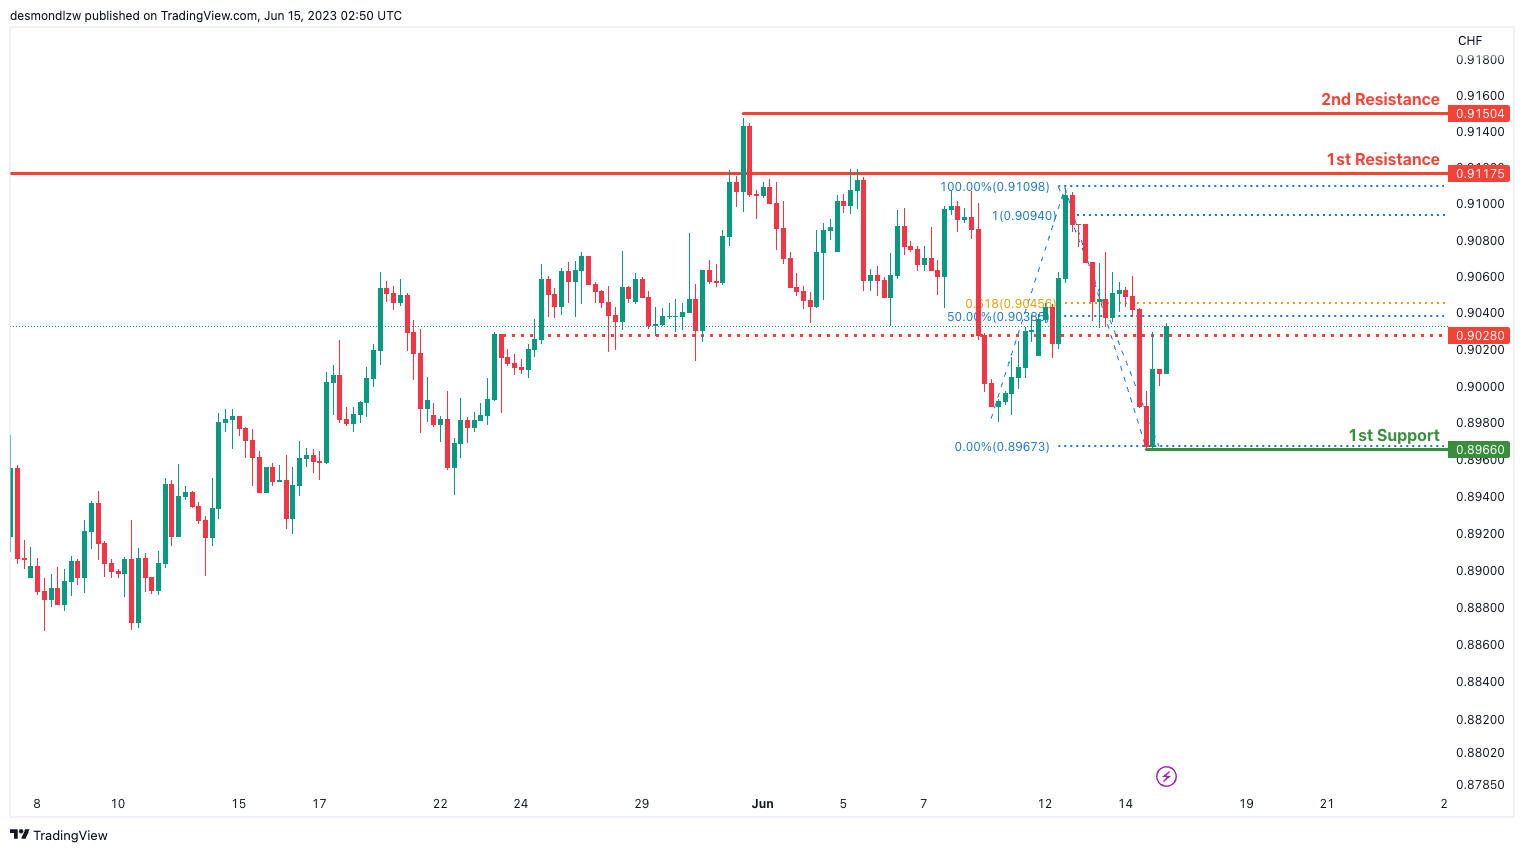
The USD/CHF chart currently shows a bullish momentum, indicating an upward bias in price movement.
There is a potential for a bullish continuation towards the first resistance level at 0.9117. This resistance level is significant as it represents an area of overlap resistance where the price has previously encountered selling pressure.
The second resistance level at 0.9150 is a swing high resistance, further reinforcing its significance as a potential barrier to upward movement.
On the downside, the first support level at 0.8966 acts as a swing low support. Traders may consider this level as a potential area of support where buyers may enter the market.
Additionally, there is an intermediate resistance level at 0.9028, which represents a Fibonacci confluence of the 50% Fibonacci retracement and the 61.80% Fibonacci projection. This level may act as a temporary barrier to further upward movement.
USD/JPY:
The USD/JPY chart currently shows a bullish momentum, indicating an upward bias in price movement.
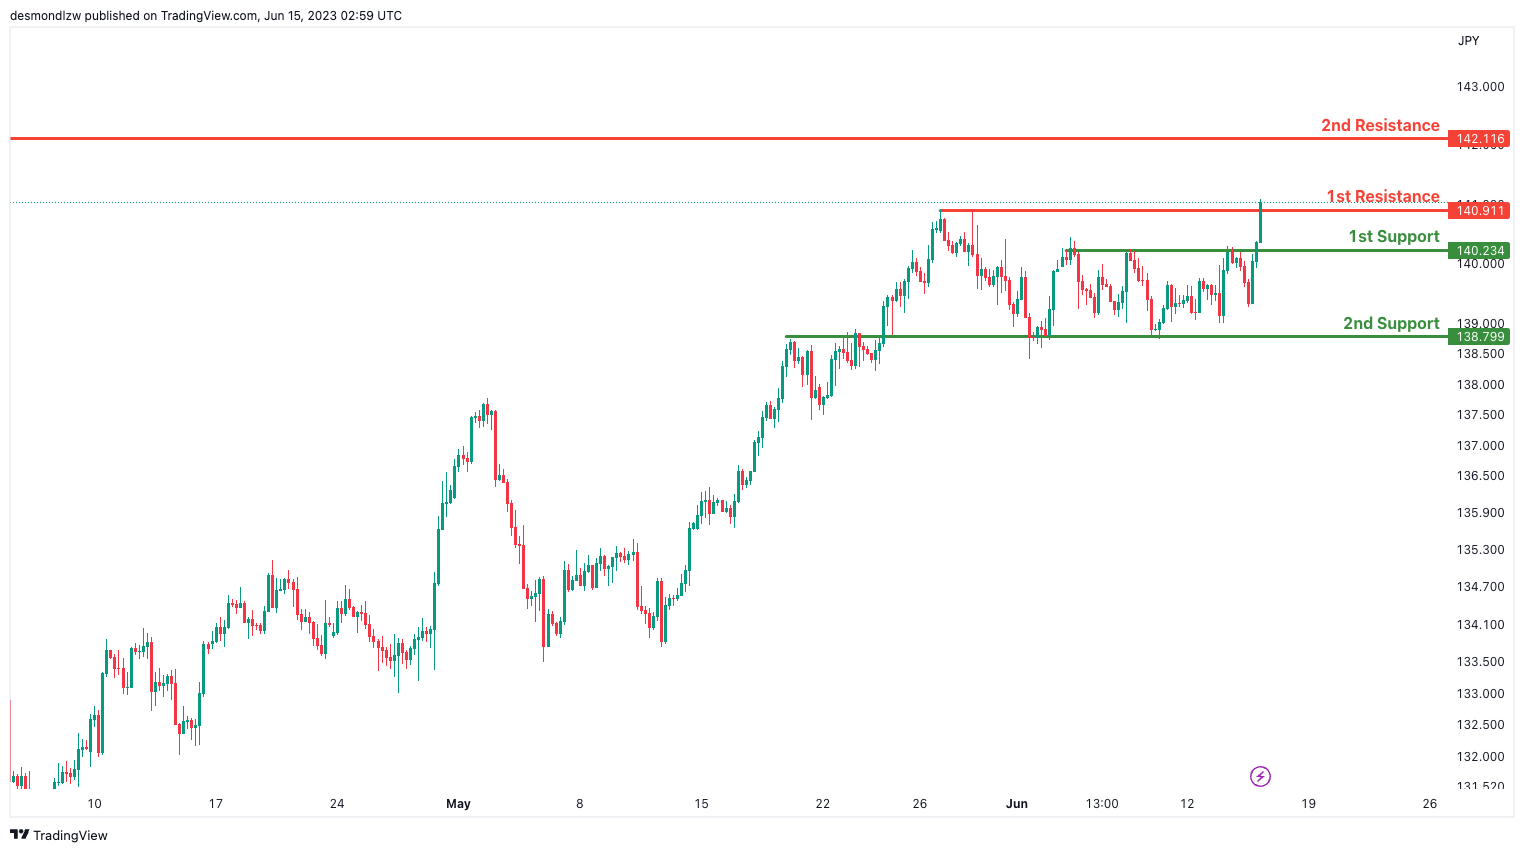
There is a potential for a bullish break through the first resistance level at 140.23. This resistance level is significant as it represents a multi-swing high resistance, suggesting that a break above this level could lead to further upward movement.
The second resistance level at 142.11 is a swing high resistance, further reinforcing its significance as a potential barrier to upward movement.
On the downside, the first support level at 140.23 acts as a pullback support. Traders may consider this level as a potential area of support where buyers may enter the market.
Additionally, there is a second support level at 138.79, which represents an overlap support level. This level may provide additional support if the price experiences a retracement.
USD/CAD:
The USD/CAD chart currently exhibits a bullish momentum, indicating an upward trend in price movement.
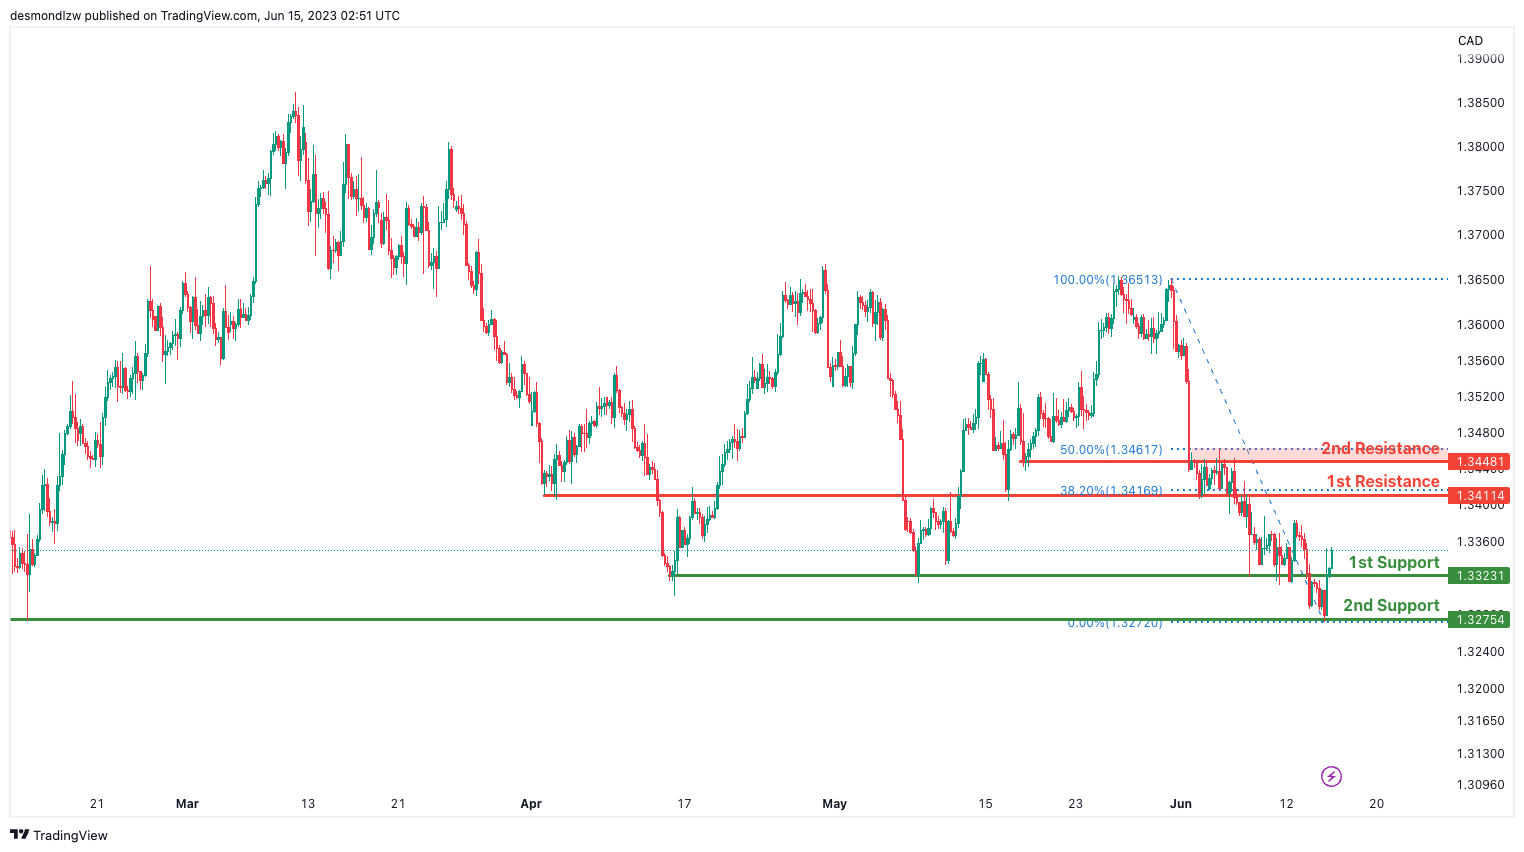
There is a potential for a bullish continuation towards the first resistance level at 1.3411. This resistance level is significant as it coincides with an overlap resistance and the 38.20% Fibonacci retracement, suggesting that it could act as a barrier to further upward movement.
The second resistance level at 1.3448 represents the 50% Fibonacci retracement. This level may also provide resistance to the bullish momentum.
On the downside, the first support level at 1.3323 acts as a pullback support, indicating a potential area where buyers may step in to support the price.
Additionally, there is a second support level at 1.3275, which represents an overlap support level. This level may provide additional support if the price experiences a retracement.
AUD/USD:
The AUD/USD chart currently shows a bearish momentum, indicating a downward trend in price movement.
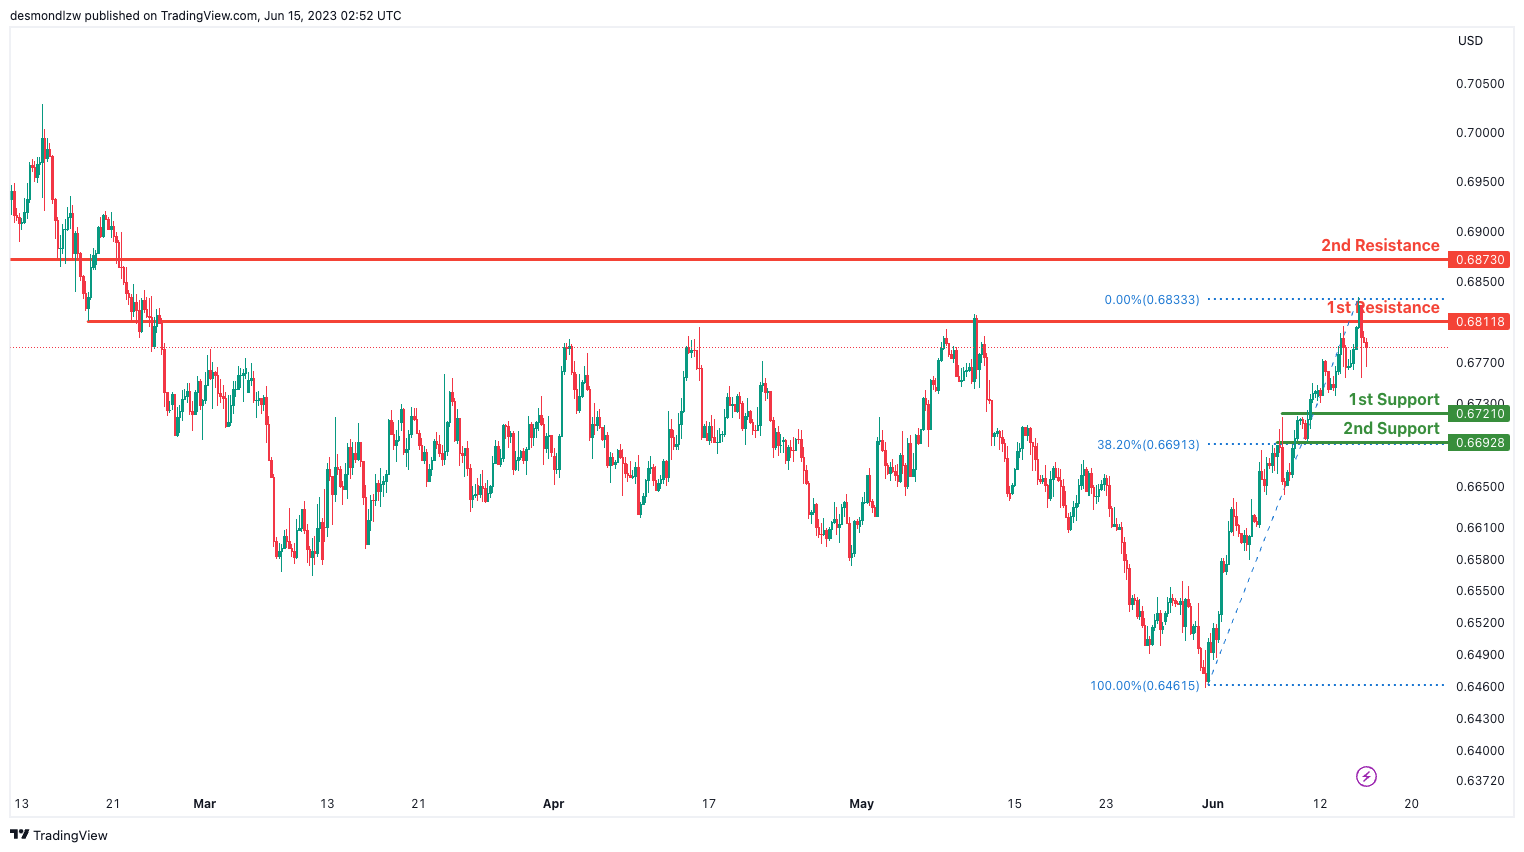
There is a potential for a bearish continuation towards the first support level at 0.6721. This support level is significant as it acts as a pullback support, suggesting that buyers may step in to provide some temporary support to the price.
The second support level at 0.6692 represents an overlap support level. It adds further significance to the potential support zone and may attract buying interest.
On the upside, the first resistance level at 0.6811 is an overlap resistance level. It may act as a barrier to any upward movement and provide selling pressure.
Additionally, the second resistance level at 0.6873 represents a pullback resistance and coincides with the 38.20% Fibonacci retracement. This level may reinforce the bearish momentum and could attract sellers into the market.
NZD/USD
The NZD/USD chart currently shows a bearish momentum, indicating a downward trend in price movement.
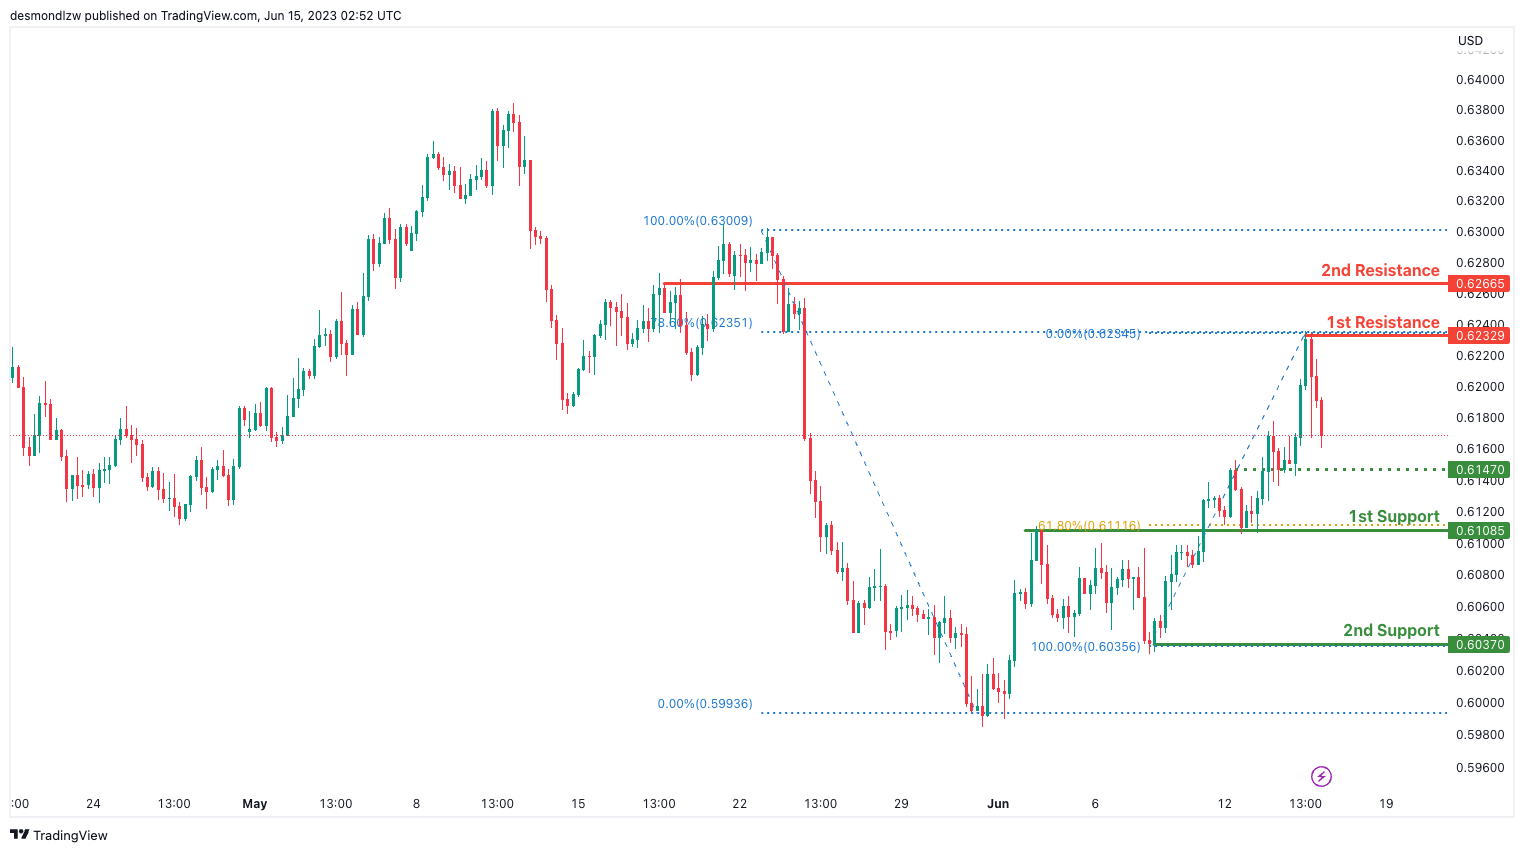
There is a potential for a bearish continuation towards the first support level at 0.6108. This support level is significant as it represents a pullback support and coincides with the 61.80% Fibonacci retracement level. It suggests that buyers may step in and provide temporary support at this level.
The second support level at 0.6307 represents a swing low support, further reinforcing its importance as a potential level for price to find support.
On the upside, the first resistance level at 0.6232 is an overlap resistance level. It may act as a barrier to any upward movement and provide selling pressure.
Additionally, the second resistance level at 0.6266 represents a pullback resistance. It suggests that sellers may become more active at this level, potentially limiting the bullish momentum.
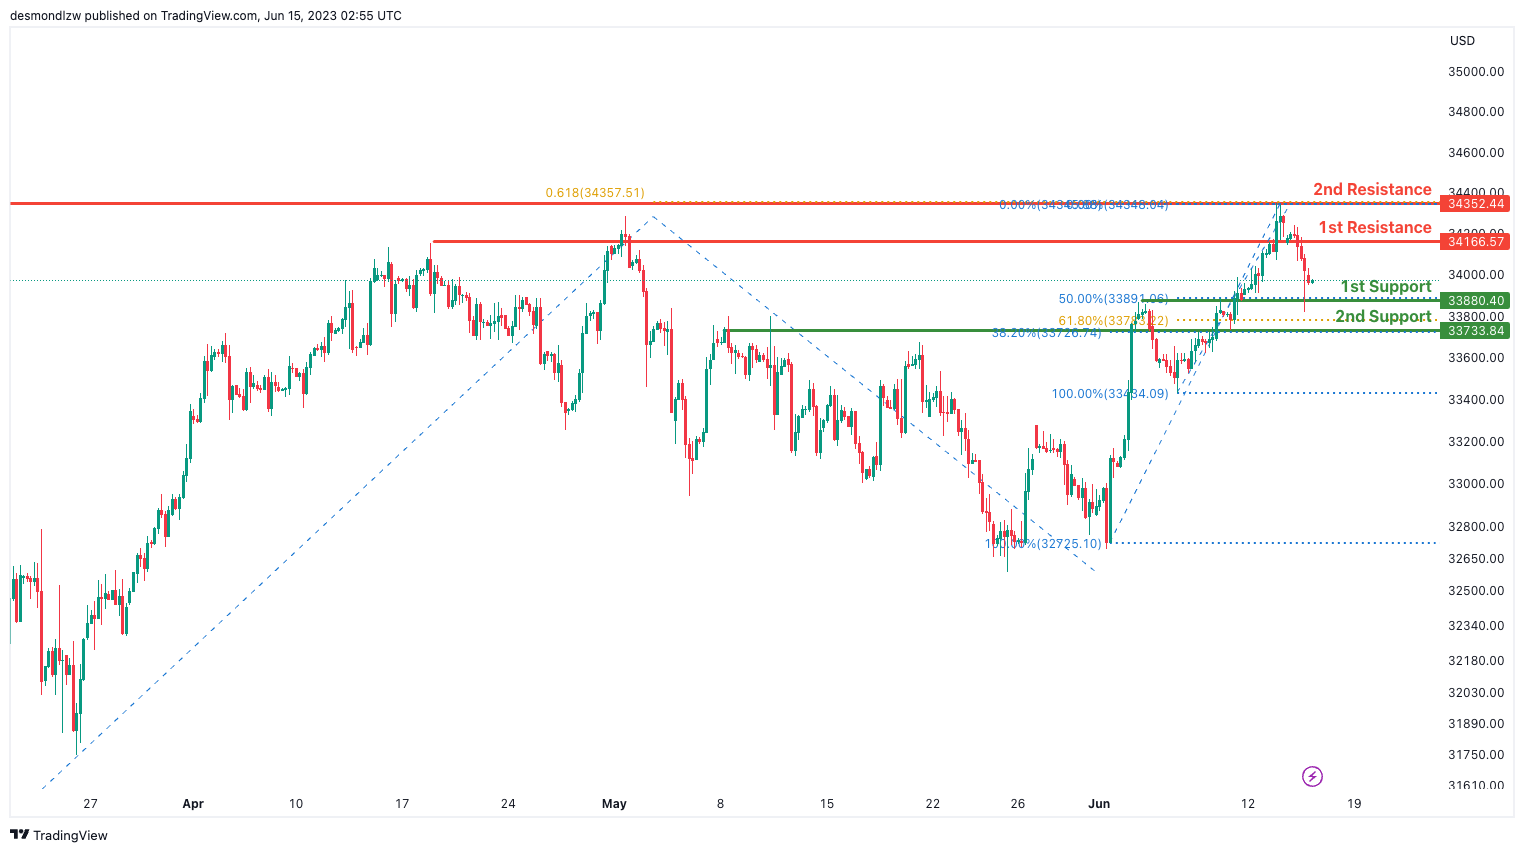
DJ30:
The DJ30 (Dow Jones Industrial Average) chart currently exhibits a bearish momentum, indicating a downward trend in price movement.
There is a potential for a bearish continuation towards the first support level at 33880.40. This support level is significant as it represents an overlap support and coincides with the 50% Fibonacci retracement level. It suggests that buyers may step in and provide temporary support at this level.
The second support level at 33733.84 is also an overlap support and represents a confluence of the 61.80% and 38.20% Fibonacci retracement levels. This further reinforces its importance as a potential level for price to find support.
On the upside, the first resistance level at 34166.57 is a pullback resistance. It may act as a barrier to any upward movement and provide selling pressure.
Additionally, the second resistance level at 34352.44 represents a swing high resistance. It suggests that sellers may become more active at this level, potentially limiting the bullish momentum.
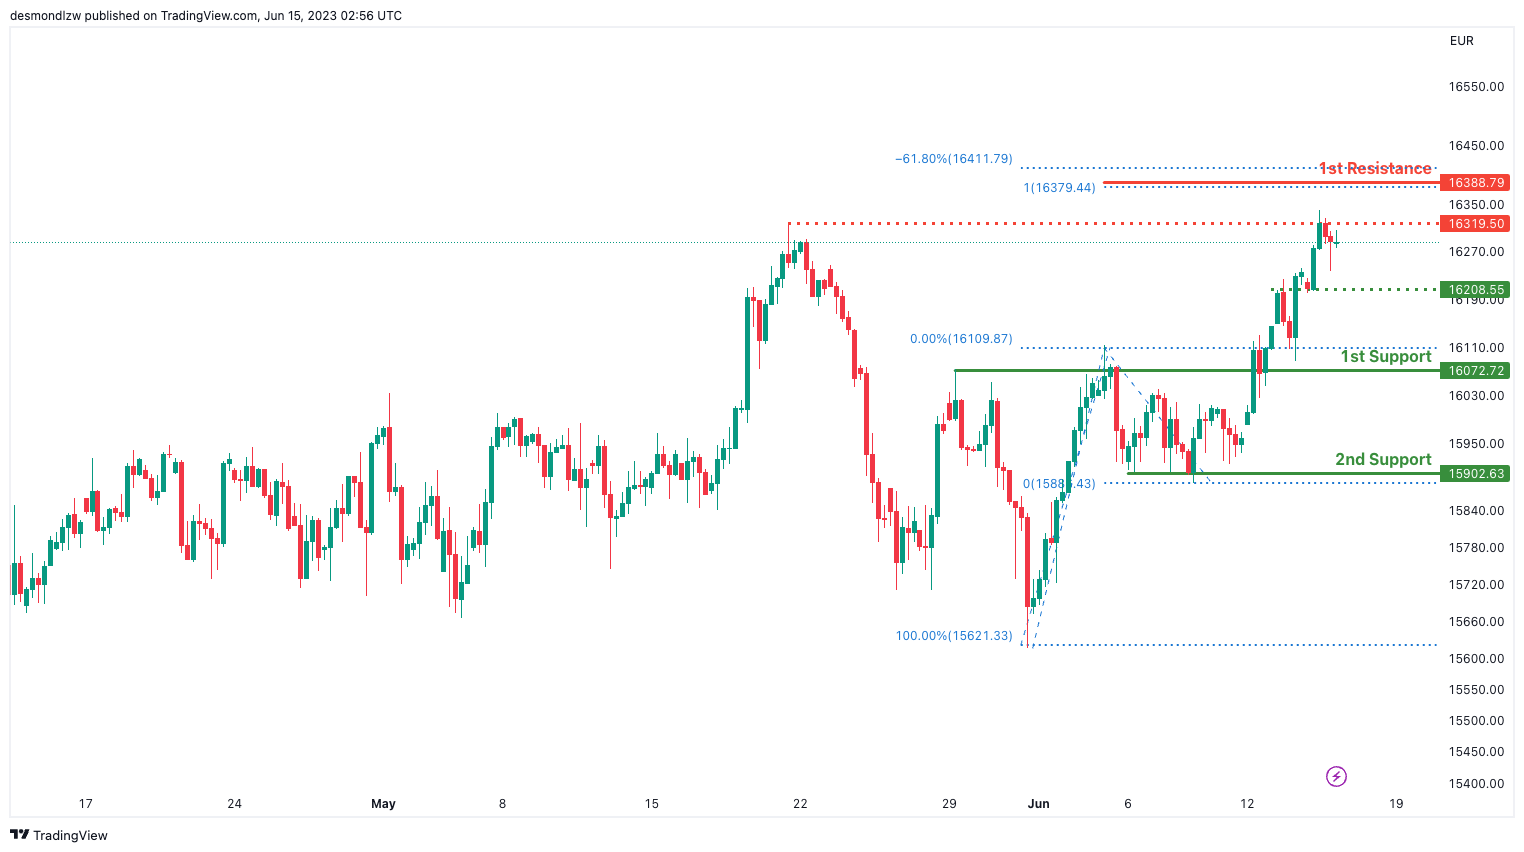
GER30:
The GER30 chart currently exhibits a bullish momentum, indicating an upward trend in price movement.
There is a potential for a bullish continuation towards the first resistance level at 16388.79. This resistance level is significant as it represents a swing high and is further reinforced by the presence of Fibonacci expansions at -61.8% and 100%.
In case of a pullback, the first support level at 16072.72 can provide an area of support. This support level is considered an overlap support, adding to its significance.
Additionally, there is an intermediate resistance level at 34352.44, which acts as a swing high resistance.
Similarly, an intermediate support level at 16208.55 is identified as an overlap support, potentially providing temporary support during minor price retracements.
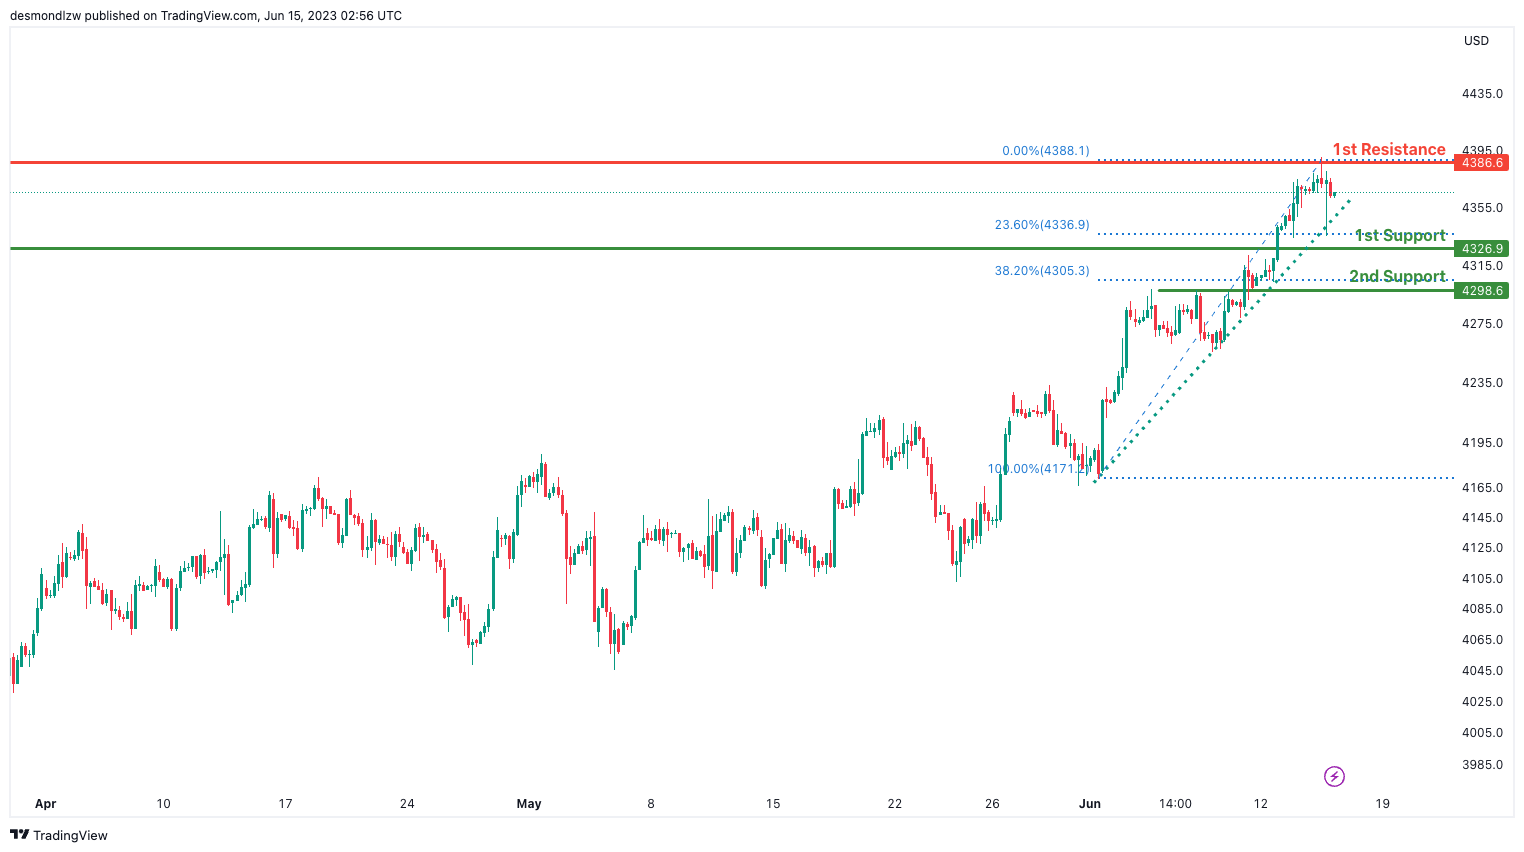
US500
The US500 (S&P 500) chart currently exhibits a bullish momentum, indicating an overall positive bias in price movement. This is supported by the fact that the price is above a major ascending trend line, suggesting the potential for further bullish momentum.
In the short term, there is a possibility of a further drop towards the first support level at 4326.9. This support level is significant as it coincides with a 23.60% Fibonacci retracement, making it a strong area of support to watch. From there, a potential bounce may occur, leading to a rise towards the first resistance level at 4386.6. This resistance level is an overlap resistance, indicating a potential area where selling pressure could be encountered.
If the bullish momentum continues, the price may encounter the second support level at 4298.6, which aligns with a 38.20% Fibonacci retracement. Conversely, if bearish pressure intensifies, the price may struggle to break above the first resistance level and experience a deeper pullback.
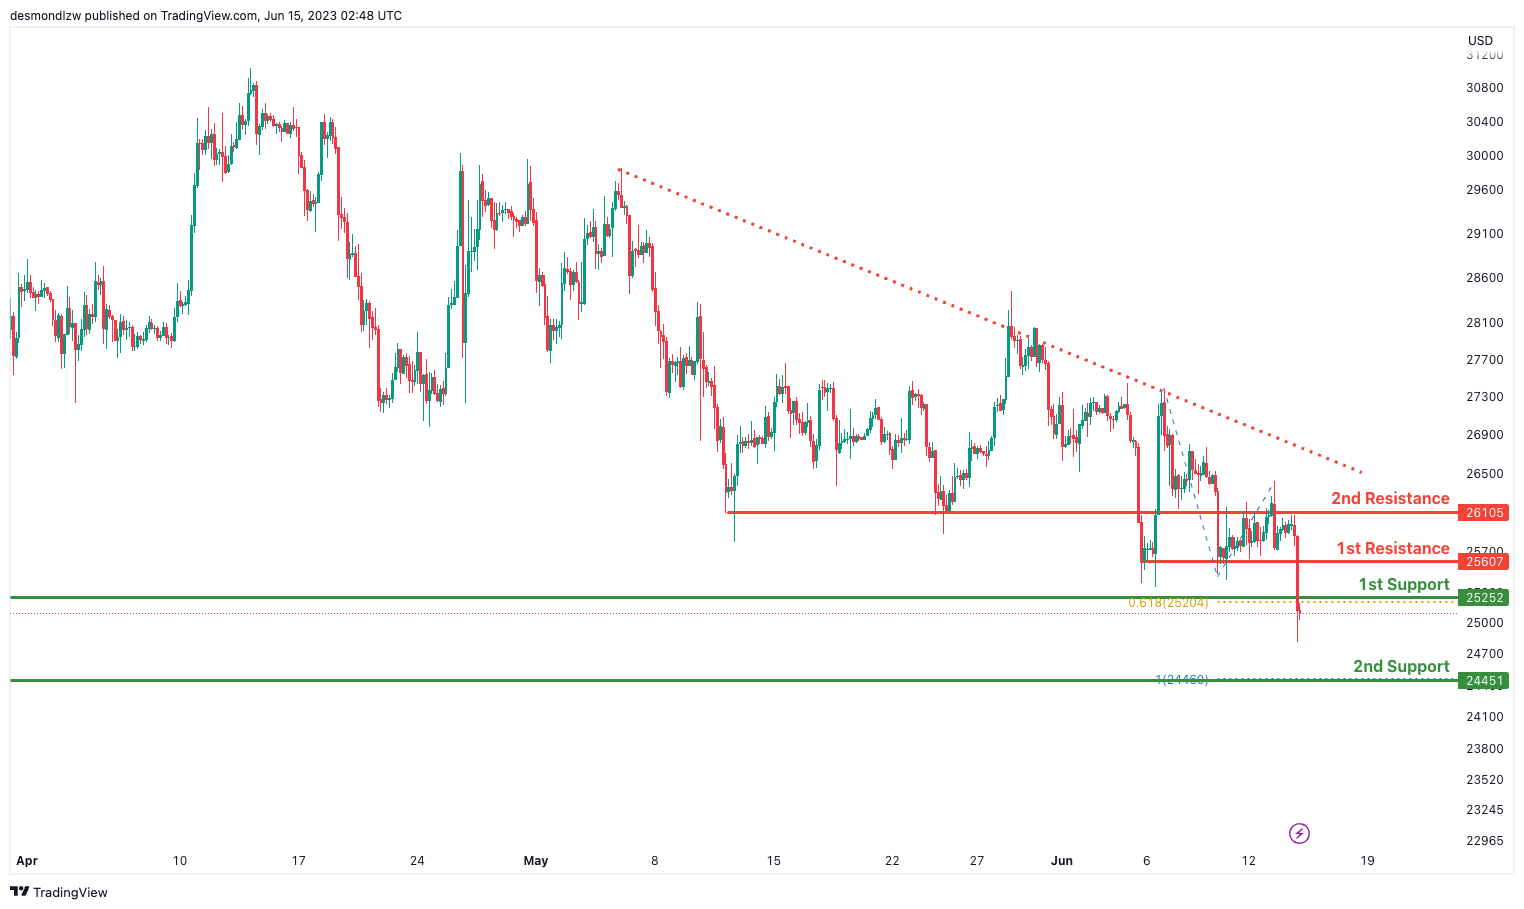
BTC/USD:
The BTC/USD chart currently exhibits a bearish momentum, as the price is below a major descending trend line, suggesting a potential continuation of the bearish trend.
There is a possibility for the price to make a bearish break off the first support level at 25,252 and drop towards the second support level at 24,451.
The first support level at 25,252 is considered a pullback support, indicating a potential area where buyers might step in. If the price breaks below this level, it could indicate further downward movement towards the second support level at 24,451.
On the upside, the first resistance level at 25,607 acts as a pullback resistance, potentially causing selling pressure and hindering upward movement. The second resistance level at 26,105 is an overlap resistance, adding to its significance as a potential barrier for price advancement.
ETH/USD:
The ETH/USD chart currently shows a bearish momentum, with the price below a major descending trend line, indicating a potential continuation of the bearish trend.
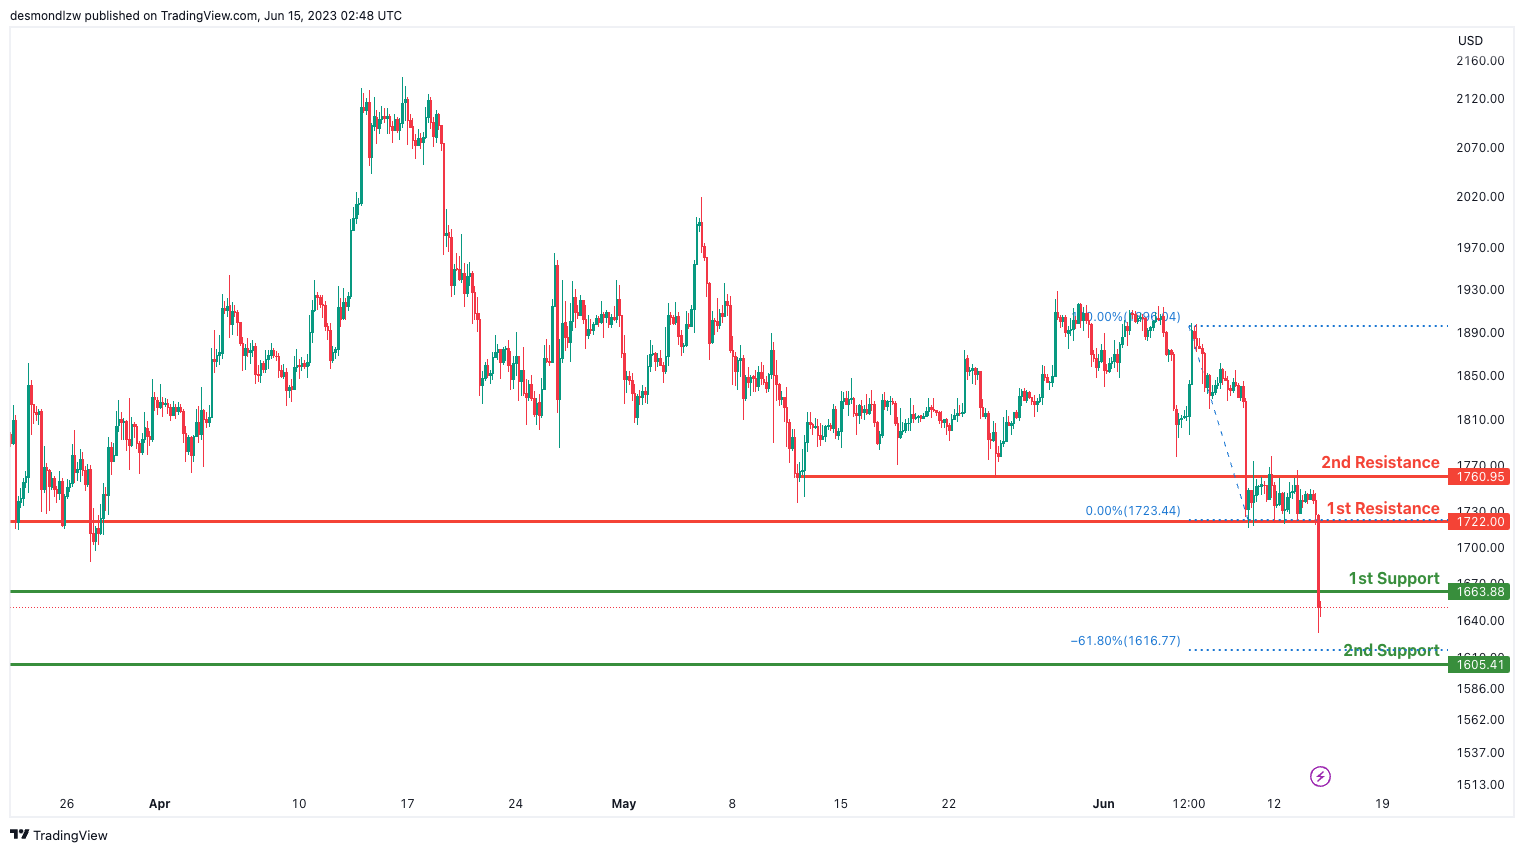
There is a possibility for the price to make a bearish break off the first support level at 1,683.88 and drop towards the second support level at 1,605.41.
The first support level at 1,683.88 is considered a pullback support, suggesting a potential area where buyers might enter the market. However, if the price breaks below this level, it could indicate further downward movement towards the second support level at 1,605.41.
On the upside, the first resistance level at 1,722.00 acts as a pullback resistance, potentially causing selling pressure and impeding upward movement. The second resistance level at 1,760.95 is an overlap resistance, adding to its significance as a potential barrier for price advancement.
WTI/USD:
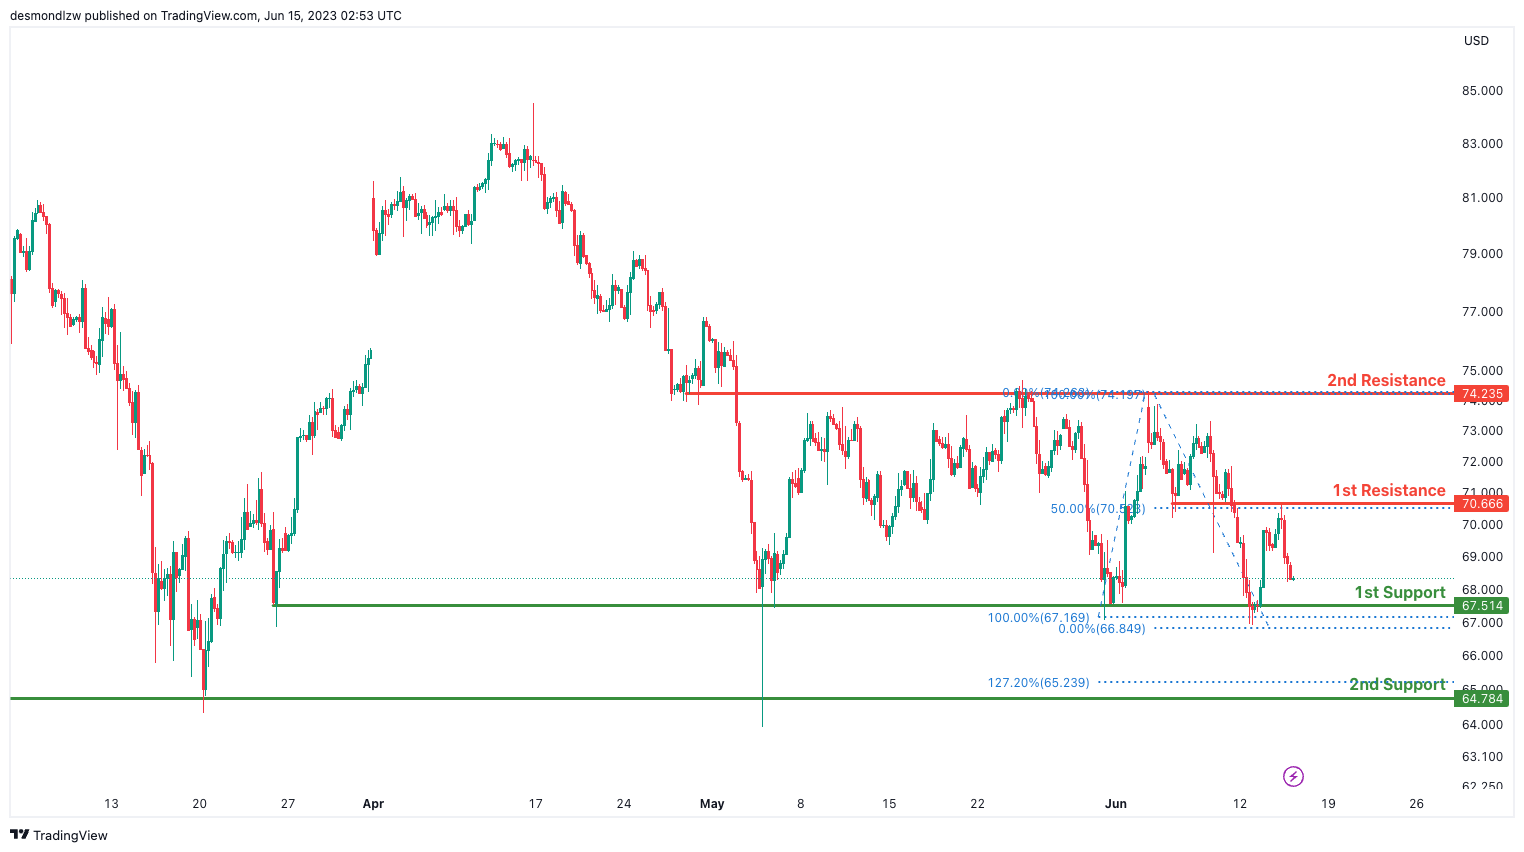
The WTI (West Texas Intermediate) chart currently exhibits a bearish momentum, indicating a downward trend in price.
There is a potential for a bearish continuation towards the first support level at 67.51, which is a multi-swing low support level. This level has previously acted as a support level where price found temporary stability. In case of a further decline, the second support level at 64.78, also a multi-swing low support, may come into play.
On the upside, the first resistance level at 70.66 acts as an overlap resistance, potentially causing selling pressure and hindering upward movement. Additionally, the second resistance level at 74.24 is also an overlap resistance level, reinforcing its significance as a potential barrier for price advancement.
XAU/USD (GOLD):
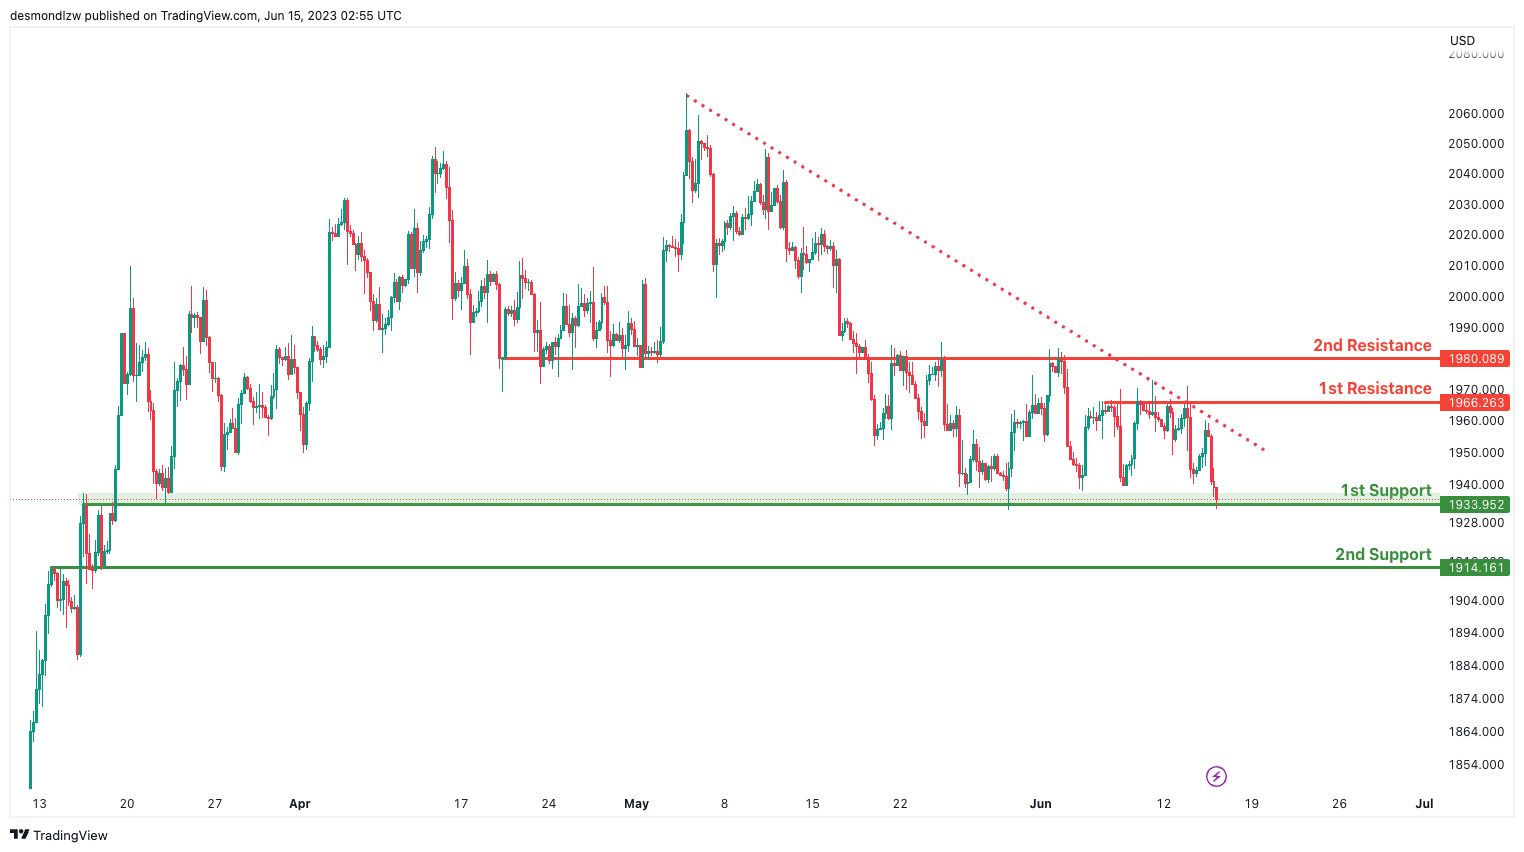
The XAU/USD (Gold/USD) chart currently shows a bearish momentum, indicating a downward trend in price. This is supported by the fact that the price is below a major descending trend line, suggesting the presence of bearish momentum.
There is a potential for a short-term rise towards the first resistance level at 1966.26. This resistance level is significant as it has previously acted as a swing high resistance, where price faced selling pressure.
If the bullish momentum persists, the second resistance level at 1980.08, an overlap resistance, may come into play. This level could potentially provide a stronger barrier for further upward movement.
On the downside, the first support level at 1933.95 is an overlap support, indicating a potential area where buyers could provide support and prevent further decline. If the bearish momentum continues, the second support level at 1914.16, also an overlap support, may be tested.
Crude Oil Price Faces Uphill Task Near $72
Key Highlights
- Crude oil price recovered losses and climbed above $68.
- A major bearish trend line is forming with resistance near $70.80 on the 4-hour chart.
- EUR/USD climbed higher above the 1.0820 resistance.
- The Fed kept interest rates at 5.25%.
Crude Oil Price Technical Analysis
Crude oil price found support near the $66.80 zone against the US Dollar. The price started a fresh increase above the $68.00 resistance zone.
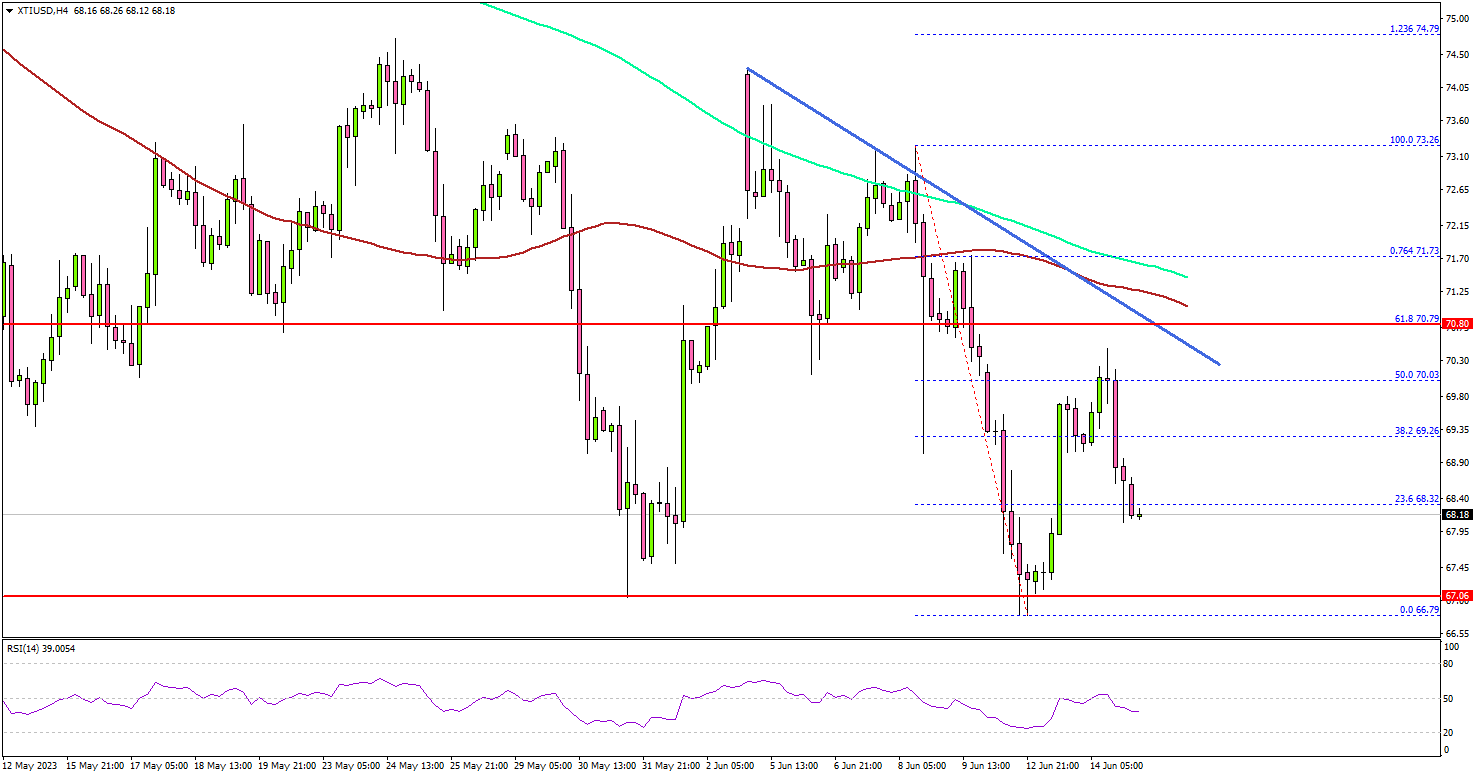
Looking at the 4-hour chart of XTI/USD, the price even cleared the $68.80 resistance but stayed below the 100 simple moving average (red, 4-hour) and the 200 simple moving average (green, 4-hour).
It faced sellers near the 50% Fib retracement level of the recent decline from the $73.26 swing high to the $66.79 low. There is also a major bearish trend line forming with resistance near $70.80 on the same chart.
On the upside, the first major resistance is near the $70.80 level. The next key resistance is near $71.50 and the 100 simple moving average (red, 4-hour), above which the price may perhaps accelerate higher.
On the downside, initial support is near the $68.20 level. The next major support sits near the $67.00 level. Any more losses might call for a test of the $65.00 support zone in the coming days.
Looking at EUR/USD, the pair gained bullish momentum and was able to climb further higher toward the 1.0850 resistance zone.
Economic Releases to Watch Today
- US Initial Jobless Claims - Forecast 249K, versus 261K previous.
- US Retail Sales for May 2023 (MoM) – Forecast -0.1%, versus +0.4% previous.
DAX Incomplete Elliott Wave Bullish Sequence Favors Higher
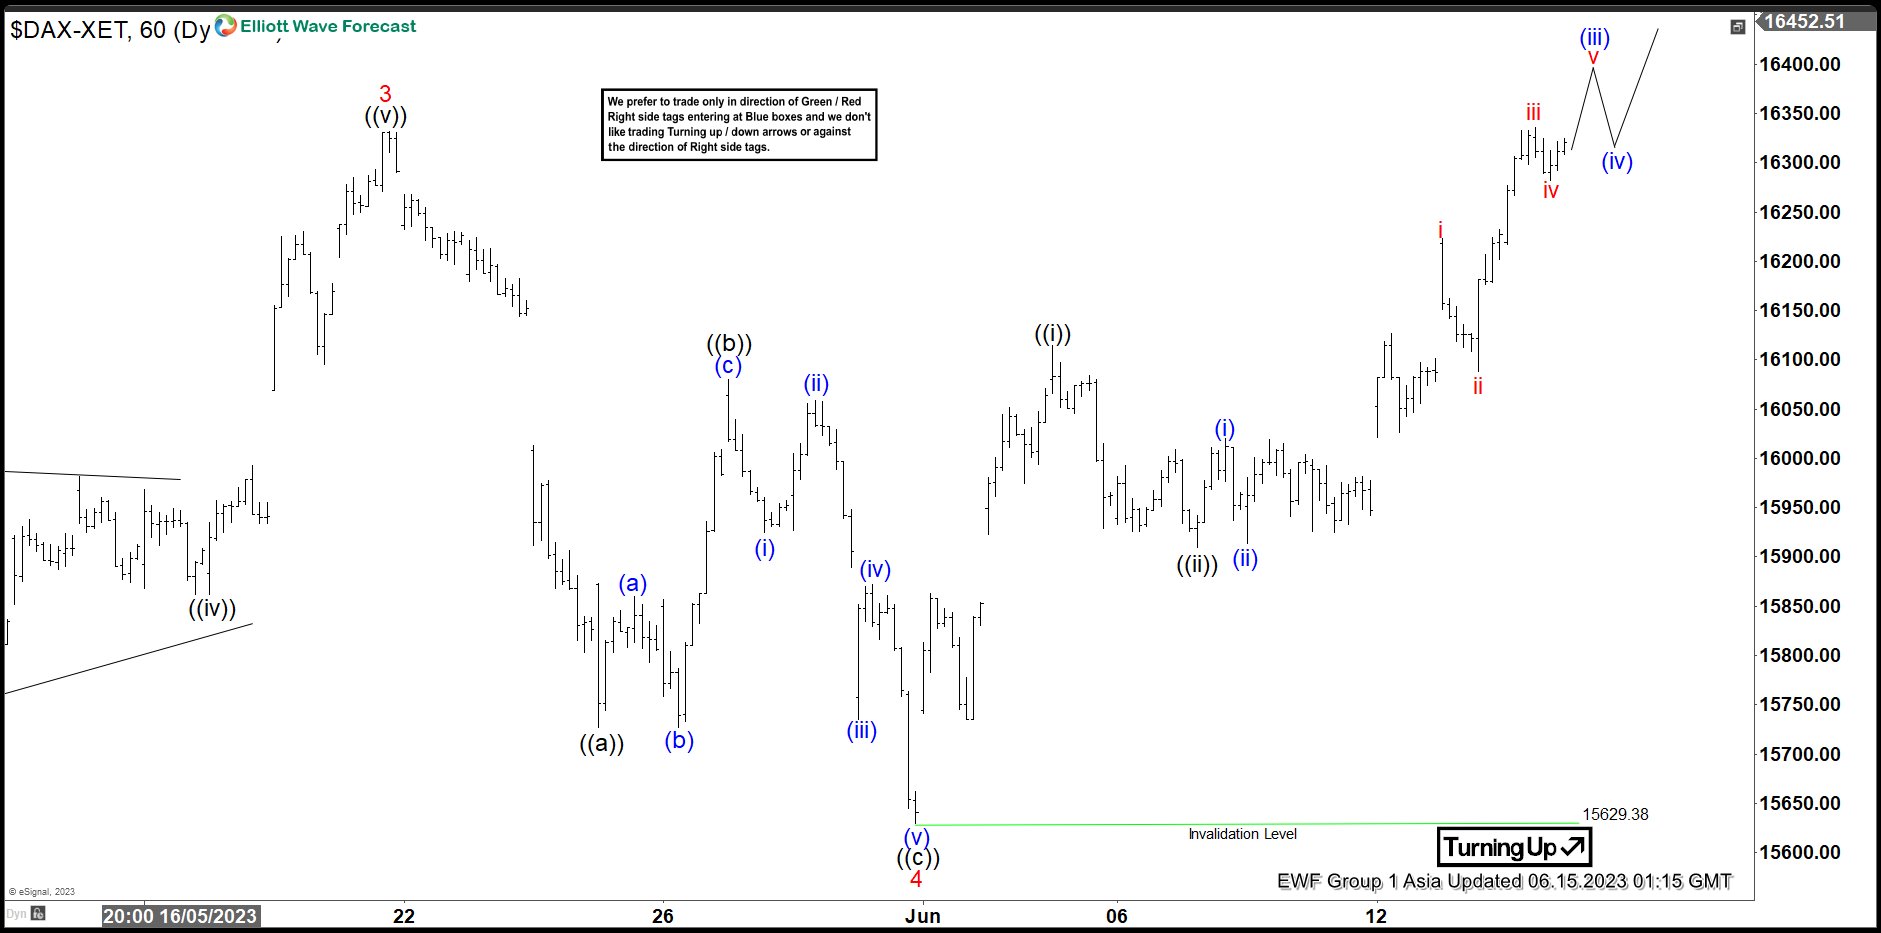
Short Term Elliott Wave View in DAX suggests the rally from 3.20.2023 low is in progress as a 5 waves impulse. Up from 3.20.2023 low, wave 1 ended at 15298.49 and pullback in wave 2 ended at 14809.82. Index then extends higher in wave 3 towards 16331.94. Pullback in wave 4 is unfolding as a zigzag Elliott Wave structure. Down from wave 3, wave ((a)) ended at 15726.5 and wave ((b)) ended at 16079.73. Wave ((c)) lower ended at 15629.12 which completed wave 4. Index has resumed higher in wave 5.
Internal subdivision of wave 5 is unfolding as a 5 waves impulse Elliott Wave structure. Up from wave 4, wave ((i)) ended at 16114.84 and pullback in wave ((ii)) ended at 15909.85. Index then resumes higher again in wave ((iii)). Up from wave ((ii)), wave (i) ended at 16020.28 and wave (ii) ended at 15913.95. Expect the Index to extend higher 1 more leg to complete wave (iii), then it should pullback in wave (iv) before it resumes higher again. Near term, as far as pivot at 15629.38 low stays intact, expect dips to find support in 3, 7, or 11 swing for further upside.
DAX 1 Hour Elliott Wave Chart
DAX Elliott Wave Video
https://www.youtube.com/watch?v=gmoTr7pV9qg
Fed Review: Powell’s Hawkish Bluff
- The Fed held rates unchanged at 5.00-5.25% as widely anticipated. However, the updated 'dots' surprised hawkishly, signalling two more 25bp rate hikes.
- Between the lines, Powell did hint that the Fed is seeing underlying inflation cooling. While the strong macro data calls for hawkish communication, we doubt the rate hikes will end up materializing, and make no changes to our Fed call.
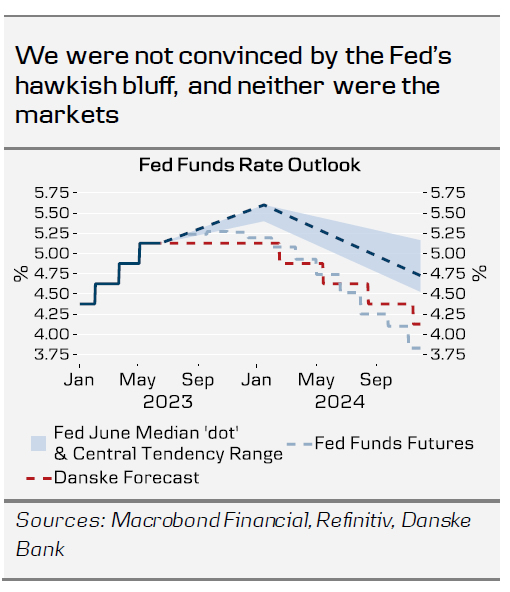
While the decision to pause rate hikes was widely anticipated, all eyes were on the communication regarding possibility of future rate hikes. The FOMC participants surprised hawkishly, as the median end-2023 Fed Funds forecast rose by 50bp to 5.50-5.75%.
However, between the lines of Powell's communication, one could still hear that the Fed is now seeing underlying inflation moderating. As we wrote in Global Inflation Watch, 14 June, wage-sensitive components of inflation especially in the broader services sector, have recorded a clear slowdown over the past months. Some slack is slowly building into the labour markets, evident in household employment declining by 310k in May. In Powell's words, 'the things we need for disinflation are coming into play'.
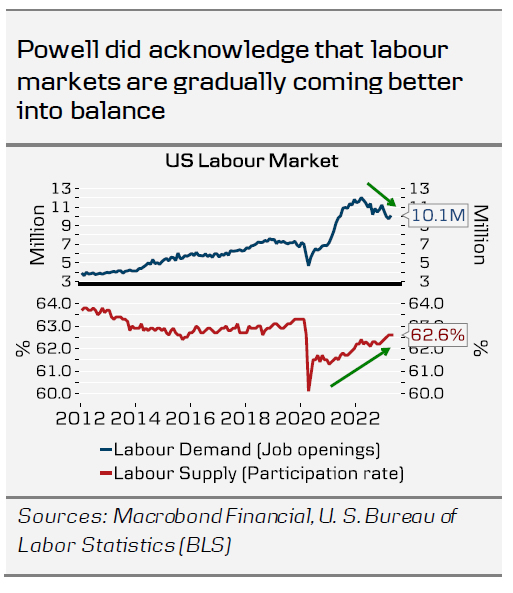
But the disinflationary process will be gradual, and as long as realized inflation stays high, the Fed needs to sound hawkish. Powell emphasized the Fed's commitment to bringing inflation down, while firmly signalling the possibility of further hikes. But it will be up to the markets to call the Powell's bluff, and as only 19bp is currently priced in by September, it does not seem like the message was all that convincing after all.
While financial conditions were not discussed in detail, we know from past minutes that FOMC participants are well aware of the inflation-prolonging risk of allowing financial conditions to ease prematurely, as was the case in early 2023.
The forecast for two more rate hikes relies on an optimistic growth outlook. The Fed sees 2023 GDP growth at 1.0% in Q4/Q4 basis (up from 0.4% in March), which is far from recessionary even after accounting for the strong start of the year. We do not consider such soft landing as impossible, but see risks tilted towards weaker, or modestly contractionary GDP development during H2. Furthermore, hiking rates further from here increases the risk of a hard landing down the line, which seems to be at odds with 2024 growth forecast being little changed (at +1.1%). As we wrote back in our May Fed Preview, 24 April, holding rates steady at the current restrictive level strikes the best balance between bringing inflation down, and avoiding a hard landing. We still think this holds today.
As such, we stick to our forecast, and expect no further rate changes this year. The risks are inarguably skewed towards at least one more hike, and the June Jobs Report and CPI will be the key to watch ahead of the July meeting, which will be 'live' according to Powell.
Initially, the hawkish pause weighed on the EUR/USD, but the knee-jerk reaction towards 1.0800 somewhat retraced during Powell's speech. We stick to our strategic case for a lower EUR/USD in H2, as we expect relative growth differentials to favour the USD despite lower carry. We see the cross at 1.06/1.03 on 6M/12M. Tomorrow, potentially hawkish ECB could drive the cross higher, which could give rise to selling opportunities.