

Sample Category Title
EUR/AUD Daily Outlook
Daily Pivots: (S1) 1.5878; (P) 1.5938; (R1) 1.6000; More...
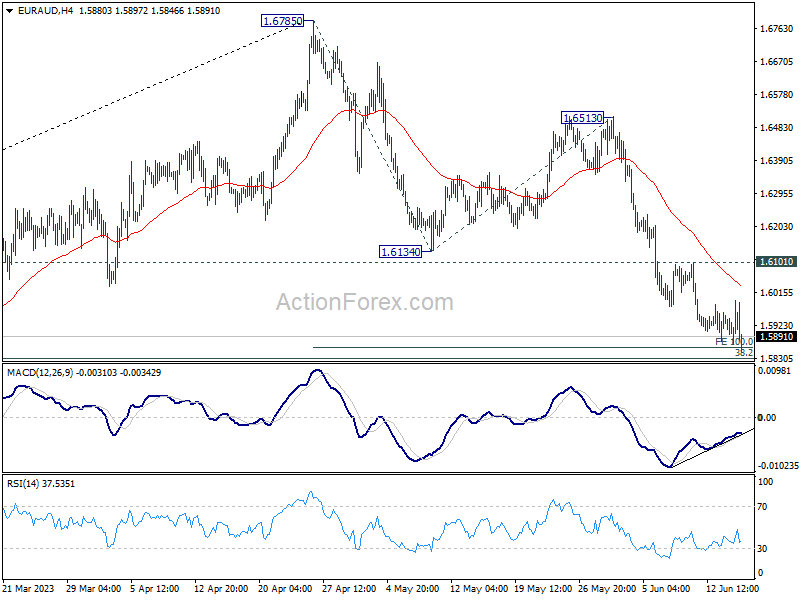
EUR/AUD continues to lose downside momentum as seen in 4H MACD. Strong support is still expected from around 100% projection of 1.6785 to 1.6134 from 1.6513 at 1.5862 to complete the fall from 1.6785. On the upside, break of 1.6101 resistance will confirm short term bottoming, and turn bias back to the upside for rebound.
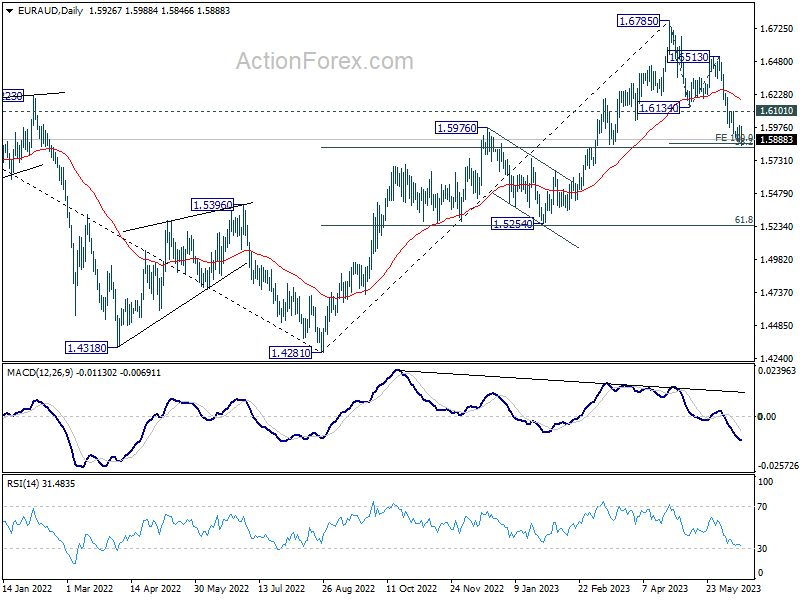
In the bigger picture, a medium term is possibly in place at 1.6785 already, on bearish divergence condition in D MACD. Fall from there is seen as corrective whole up trend from 1.4281 (2022 low). Deeper decline is expected as long as 1.6513 resistance holds, to 38.2% retracement of 1.4281 to 1.6785 at 1.5828. Strong support could be seen there to complete the first leg of the corrective pattern.
EUR/JPY Daily Outlook
Daily Pivots: (S1) 151.19; (P) 151.48; (R1) 152.05; More....
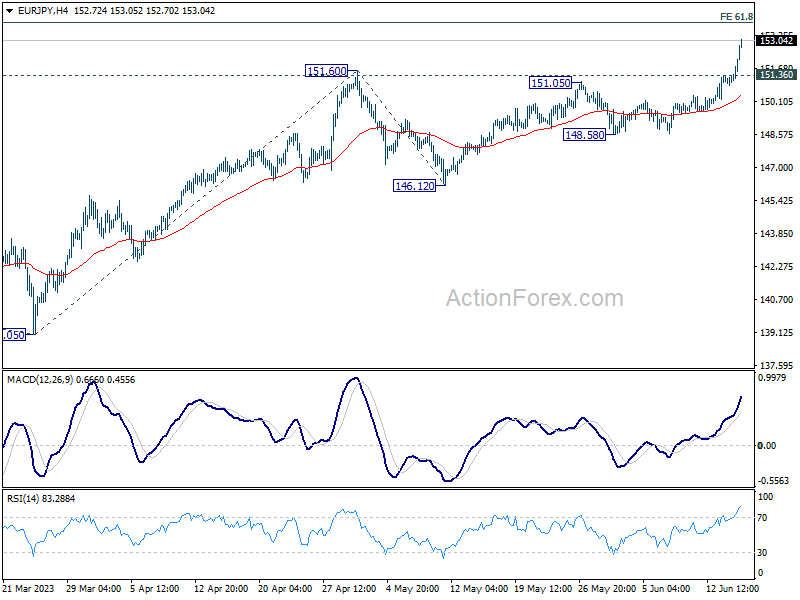
EUR/JPY's strong break of 151.60 resistance confirms larger up trend resumption. Intraday bias remains on the upside for 153.64 projection level. Sustained break there will be a sign of strong medium term momentum. Next target is 100% projection of 139.05 to 151.60 from 146.12 at 158.67. On the downside, below 151.36 minor support will turn intraday bias neutral first.
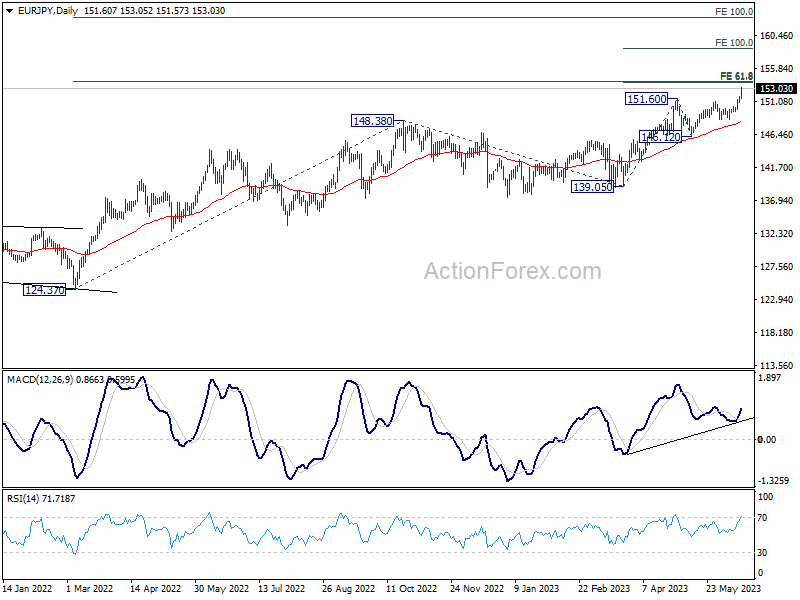
In the bigger picture, rise from 114.42 (2020 low) is in progress. Next target is 61.8% projection of 124.37 to 148.38 from 138.81 at 153.64. Sustained break there will pave the way to 100% projection at 162.82. For now, medium term outlook will remain bullish as long as 146.12 support holds, even in case of deep pull back.
Crypto Market Gives Back March Rally
Market picture
Cryptocurrency market capitalisation fell 3.2% over the past 24 hours to $1,021 trillion, its lowest level since mid-March when cryptocurrencies rallied on concerns about US banks. There is likely to be a reversal now that crypto exchanges have become a target for regulators and the banking system has managed to avoid any new high-profile failures.
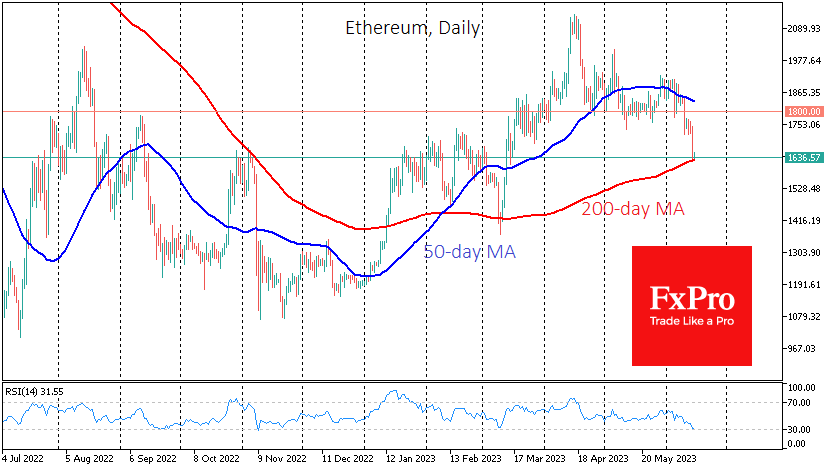
Bitcoin started Thursday’s session below $25K (-3.6% in 24 hours), while Ethereum fell to $1640 (-5.4%). Major altcoins are losing between 0.45% (Tron) and 6% (Litecoin).
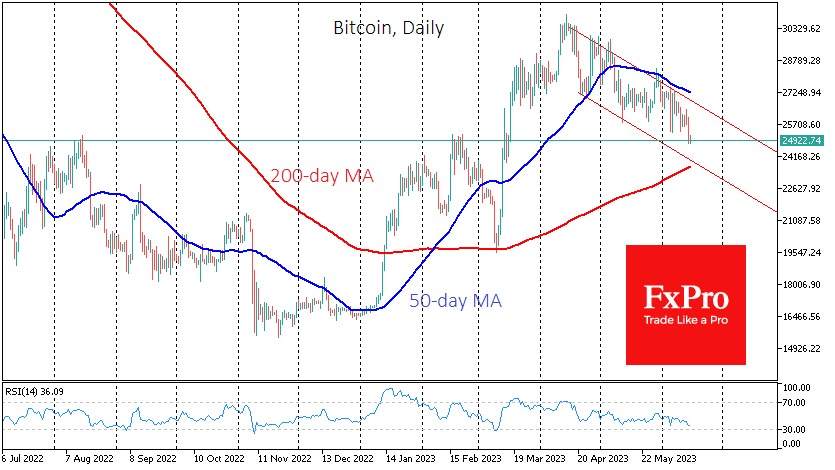
Bitcoin has retreated to local resistance levels from August last year to February this year. The bulls may try to hold the sell-off near this level, but the current decline is still within the descending channel that has been in place since April. More significant support for Bitcoin is near the 200-day average – now at $23.6K and pointing higher.
News background
Michael Saylor, MicroStrategy founder, says the SEC trying to bring regulatory clarity for the crypto market lays the groundwork for a new bitcoin rally. He believes that “confusion & anxiety has been holding back institutional investors.”
The relatively low realisation of gains and losses, coupled with the virtual lack of reaction from holders, suggests that investors are “indifferent” to the SEC’s actions against Binance and Coinbase, Glassnode said. The market reaction has kept Binance’s position as one of the largest holders of BTC and ETH.
The head of the US House Financial Services Committee, Republican Patrick McHenry, said the SEC should have taken strict action against the Binance exchange long ago. He said it should have been shut down years ago.
Mark Cuban, a billionaire, blamed SEC for not having a classification system for cryptocurrencies. Under such circumstances, the regulator can recognise any token as a security.
Binance CEO Changpeng Zhao denied rumours of market manipulation to inflate BNB’s value by selling Bitcoin.
US 30 Cash Index Fails at 34,280 Again; Bearish Pressure Rises
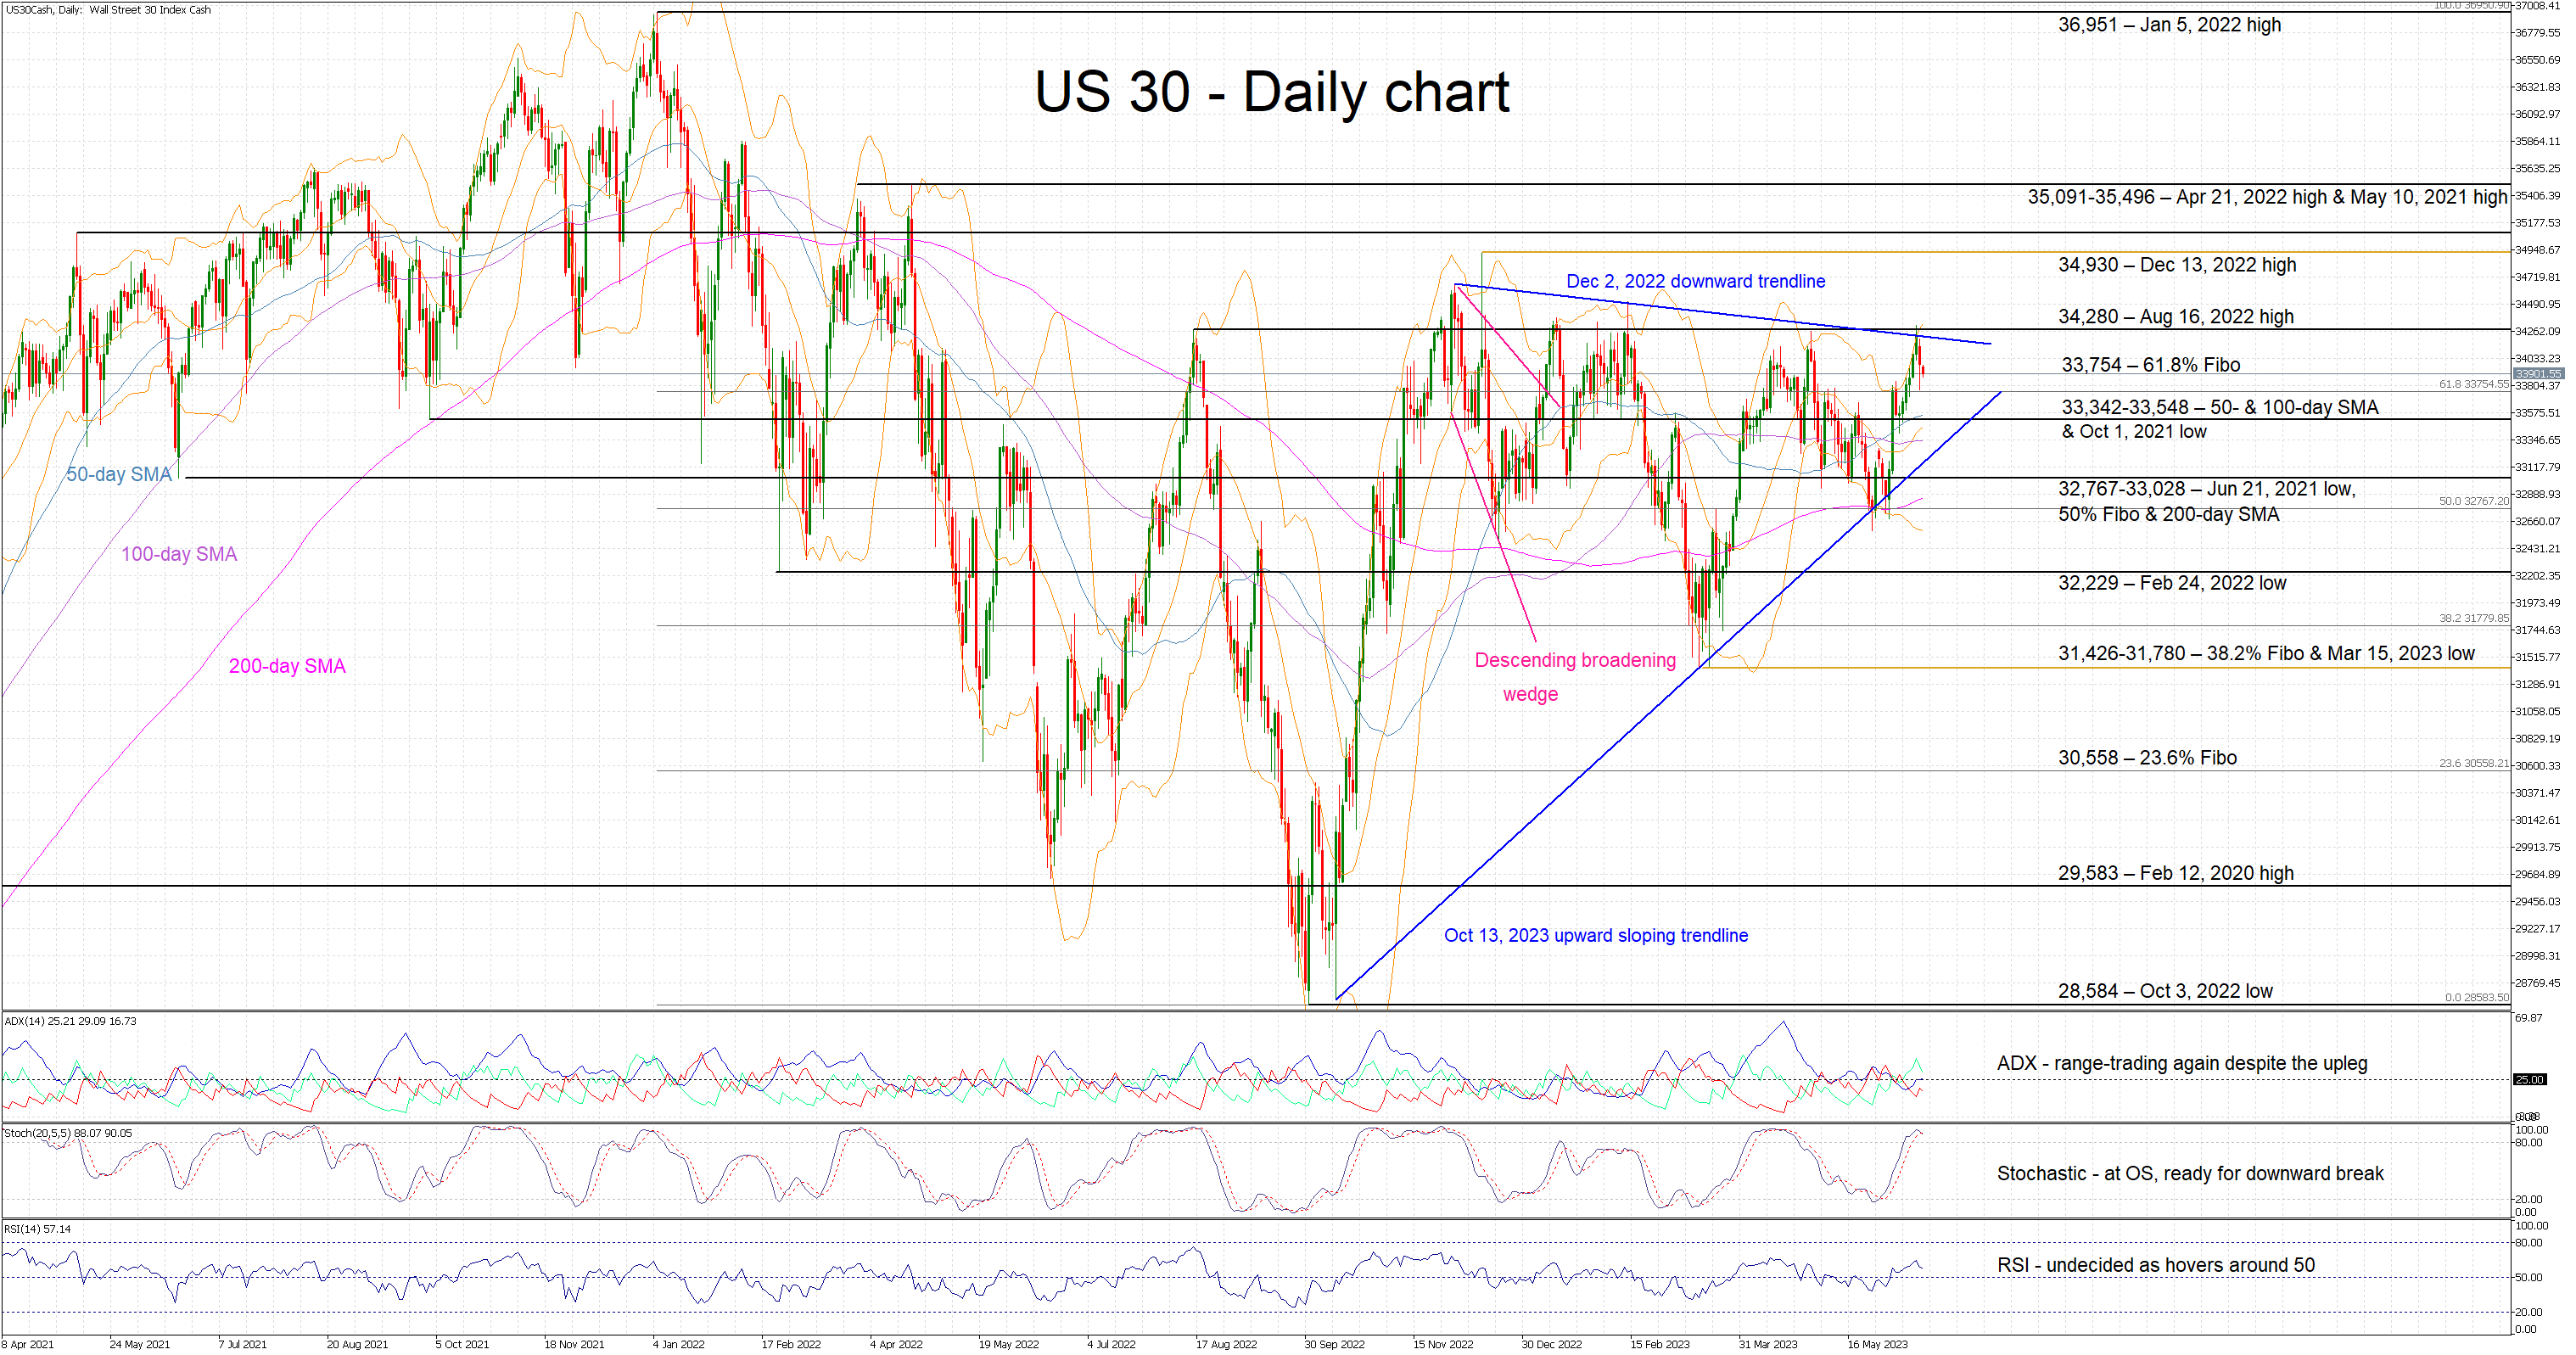
The US 30 cash index is edging lower today after failing again to close above the December 2, 2022 downward trendline and the 34,280 level. The bears appear determined to defend this area, hoping that they can take advantage of any exhaustion signs appearing on the bulls’ side.
With the Average Directional Movement Index (ADX) hovering around its 25-threshold and signaling a range-trading market, the bears are betting on the stochastic oscillator for the much-awaited bearish signal. Indeed, this indicator is trading in its overbought (OB) area and it has just crossed below its moving average. However, a decisive move below its OB territory is needed to support the bears’ intentions.
Should the bulls decide to retest the August 16, 2022 high at 34,280, they would firstly have to break the December 2, 2022 downward trendline. The December 13, 2022 high at 34,930 would be the next aim, a tad below the busier 35,091-35,496 range populated by the April 21, 2022 and May 10, 2021 highs respectively.
On the other hand, the bears would be keen on a break of the 61.8% Fibonacci retracement of the January 5, 2022 – October 3, 2022 downtrend at 33,754 before targeting the, arguably more important, 33,342-33,548 area. The combination of the 50- and 100-day simple moving averages (SMAs), and the October 1, 2021 low means that the bears’ determination would be put to the test there.
To sum up, the US 30 bulls are taking a breather after failing again to break the 34,280 level. Time does not appear to be on their side and a potential correction could be more forceful than they currently anticipate.
Will the Nonstop Rally in AUDUSD Falter?
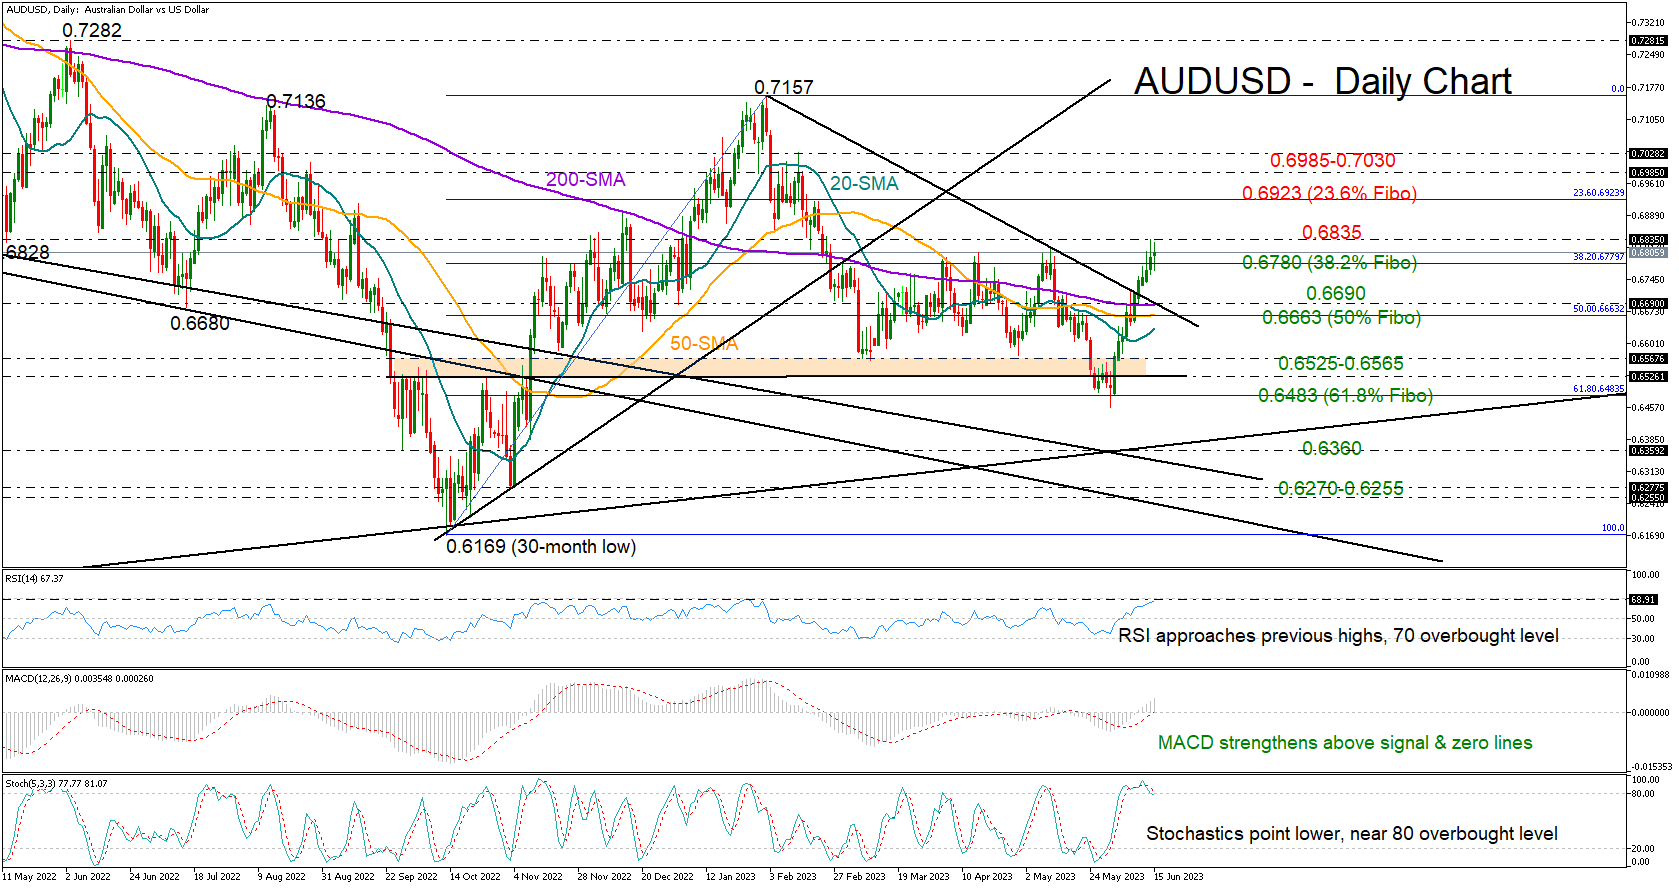
AUDUSD has been enjoying an almost three-week nonstop rally, gaining around 5.0% since the bounce on the 0.6500 level at the end of May.
On Wednesday, the pair reached its highest level since February and closed slightly above the 0.6780 ceiling, which has been capping bullish actions over spring. The impressive ascend could motivate some profit-taking as the RSI and the stochastic oscillator are hovering near overbought territory. Yet, the indicators have yet to show a clear downside reversal, suggesting some extra recovery before the next pivot takes place.
A clear step above yesterday’s high of 0.6835 could push the price up to the 23.6% Fibonacci retracement level of the previous uptrend at 0.6923. Additional increases from here could immediately lose pace somewhere between 0.6985 and 0.7030. If buying interest grows further, the door will open for the February and August highs at 0.7157 and 0.7136 respectively.
In the event the price pulls below 0.6800, the spotlight will fall on the broken 2023 resistance trendline and the 200-day simple moving average (SMA) at 0.6690. The 50% Fibonacci mark and the 50-day SMA are marginally lower, with the 20-day SMA approaching that territory as well. Should the bears breach those lines, selling forces could intensify towards the 0.6565-0.6525 floor. An extension below the 61.8% Fibonacci mark would put the pair back in a downtrend in the medium-term picture.
All in all, AUDUSD is expected to haunt extra gains in the short-term if it stays afloat above 0.6800-0.6780.
WTI Futures Pull Back after Bouncing Off Restrictive Trendline
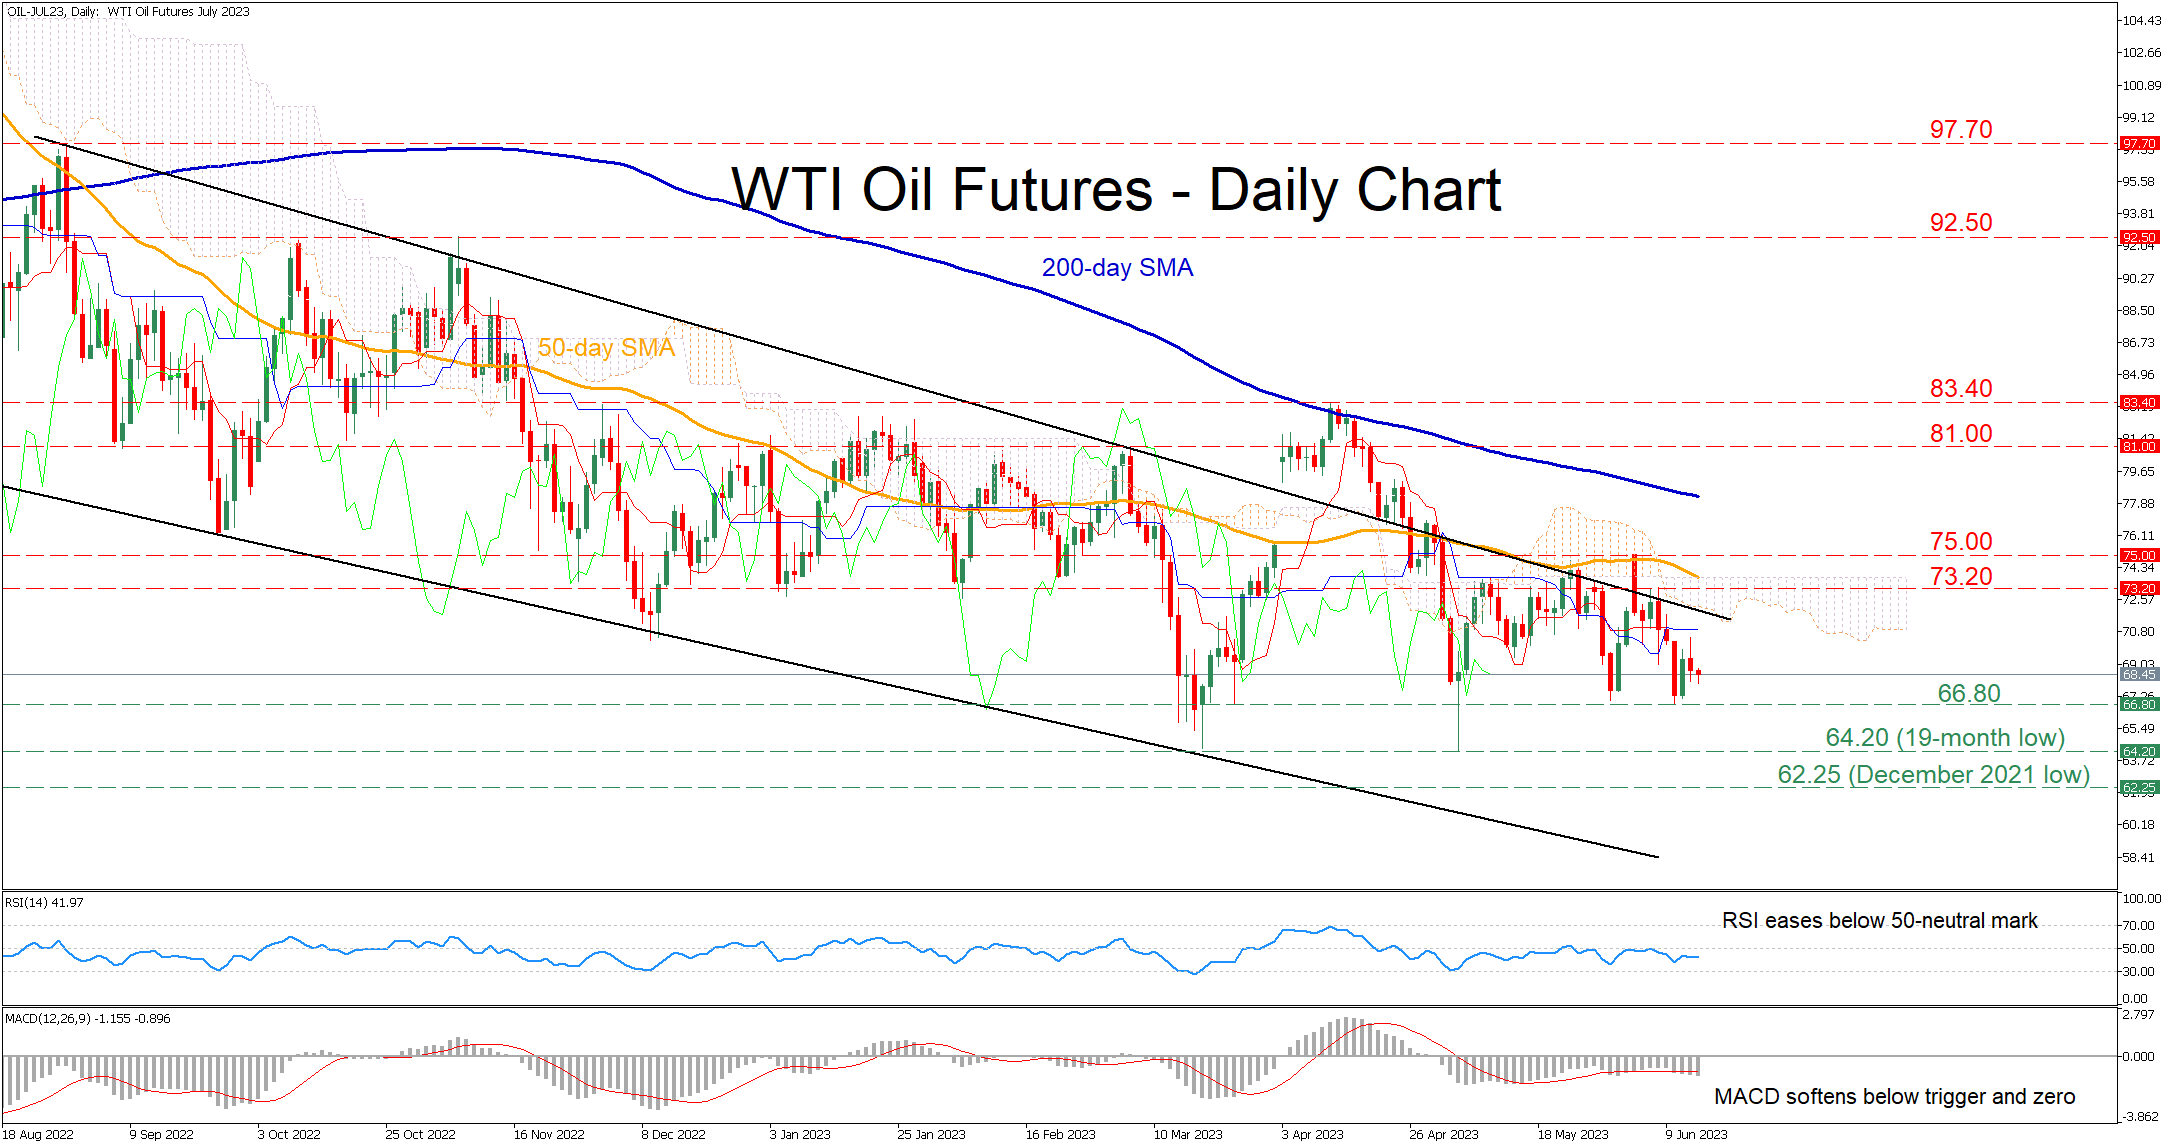
WTI oil futures (July delivery) have been moving within their downward sloping channel for the last 10 months, creating a structure of lower highs and lower lows. In the near term, the price is trading flat slightly below the 70.00 region following a moderate pullback from the upper boundary of their long-term bearish channel.
The momentum indicators currently suggest that bearish forces are strengthening. Specifically, the RSI has flatlined below its 50-neutral mark, while the MACD is softening below both zero and its red signal line.
Should the bears try to push the price lower, immediate support could be found at the June low of 66.80. A dive below that floor could open the door for the double-bottom region of 64.20, which is also a 19-month low. Failing to halt there, the price could decline to post a fresh multi-month low, where the December 2021 bottom of 62.25 could curb further downside attempts.
On the flipside, bullish actions could propel the price towards the recent resistance of 73.20. Breaking above that zone, WTI futures might face the 75.00 hurdle before the March peak of 81.00 comes under scrutiny. Conquering the latter, the bulls may then target the 2023 high of 83.40.
In brief, WTI oil futures retraced lower after failing to post a bullish breakout from their long-term descending channel. Nevertheless, the price has been trading sideways in the last couple of daily sessions, waiting for developments that could provide fresh directional impetus.
New Zealand Dollar Dips after Soft GDP Report
- New Zealand GDP declines by 0.1%
- Fed takes a pause, but sends hawkish message
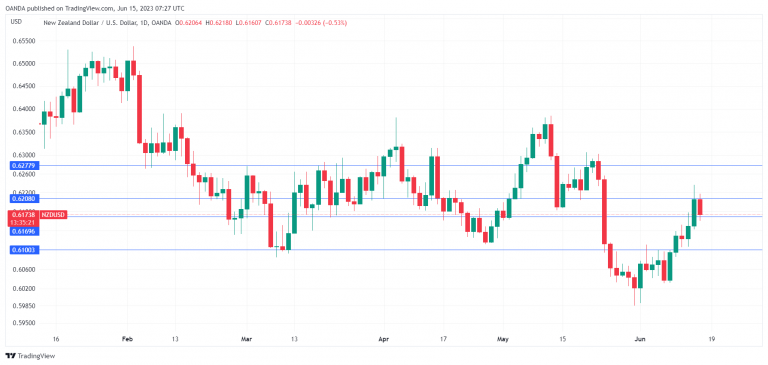
The New Zealand dollar is in negative territory on Thursday, after surging 0.9% higher on Wednesday. In the European session, NZD/USD is trading at 0.6171, down 0.57%.
New Zealand’s economy shrinks, a bit
With the financial markets fixated on the Federal Reserve on Wednesday, New Zealand’s GDP release was overshadowed by Jerome Powell & Co. The economy contracted by 0.1% q/q in the first quarter, matching the consensus and higher than the -0.7% reading in Q4 2022. This means that technically, New Zealand is in a recession, with two consecutive quarters of negative growth. Still, the market reaction has not been dramatic, as the 0.1% decline is marginal. On an annualized basis, GDP in Q1 rose 2.9%, up from 2.3% in the previous quarter.
The Reserve Bank of New Zealand raised rates by 25 basis points in May, bringing the benchmark rate to 5.5%. The central bank will have some time to gauge the effect of its rate tightening, as it does not meet again until July 12th. The IMF weighed in on the Bank’s rate policy ahead of the GDP release, urging more tightening in order to bring down high inflation.
Federal Reserve delivers a hawkish pause
The Federal Reserve held rates unchanged on Wednesday, which is what the markets had expected, especially after this week’s inflation report which showed inflation falling to 4.0%. At the same time, the rate statement and economic projections for the fourth quarter were hawkish. The Fed revised GDP growth and a key inflation gauge higher while revising the unemployment rate lower. As well, the dot plot indicated two more small rate hikes this year.
Powell said after the decision that the Fed had not made a decision about the July meeting, but his message was clearly hawkish, and the markets have priced in a 71% probability of a July hike, according to CME FedWatch. Powell may have inflation on the run, but there’s still a way to go before the 2% target is achieved.
NZD/USD Technical
- NZD/USD is testing support at 0.6169. Below, there is support at 0.6100
- 0.6208 and 0.277 are the next resistance lines
AUD/USD: May Collapse to a Minimum of 0.617
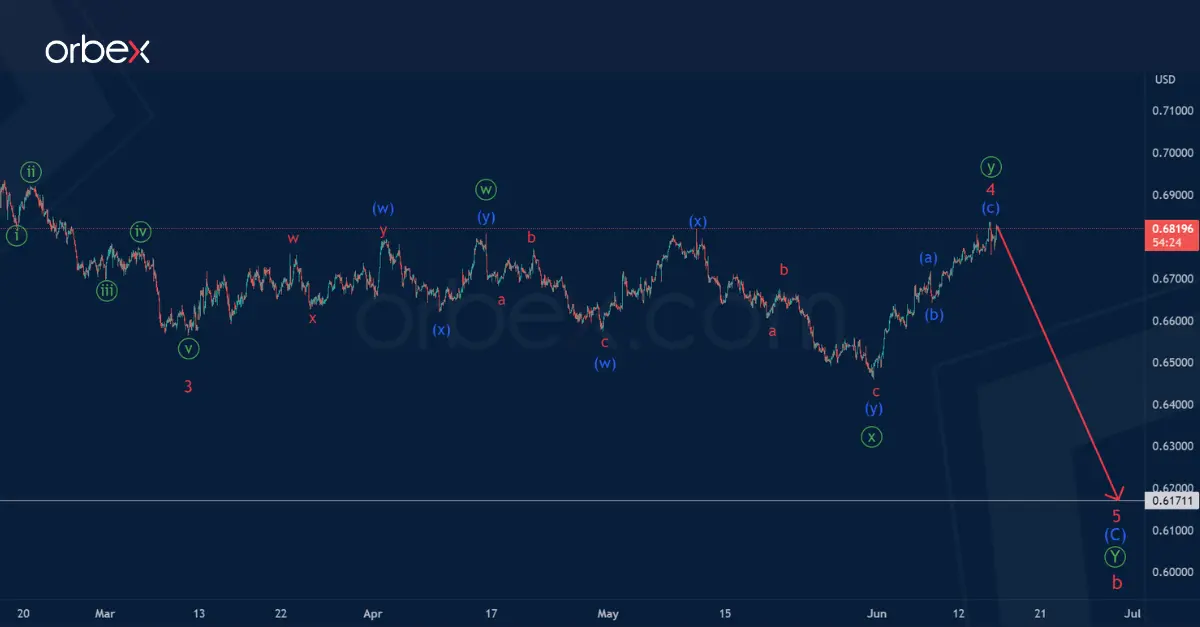
In the long term, the AUDUSD pair may form a large correction b of the cycle degree, which has the structure of a primary double zigzag Ⓦ-Ⓧ-Ⓨ.
Two parts, sub-waves (A)-(B), can be completed inside the actionary wave Ⓨ. The current chart shows the structure of wave (C).
Wave (C) is an impulse that consists of minor sub-waves 1-2-3-4-5. There is a high probability that the price inside the final minor wave 5 will reach a minimum of 0.617.
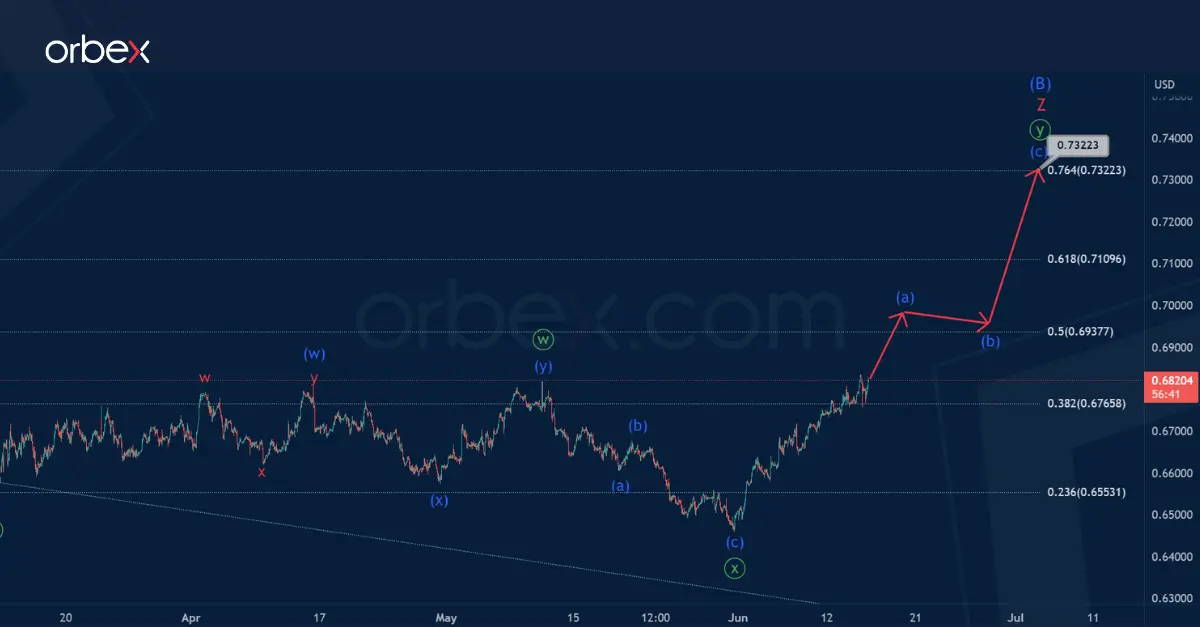
The current chart shows an alternative markup option in which we see an incomplete intermediate correction (B).
Wave (B) has a complex internal structure of a triple zigzag W-X-Y-X-Z.
There is a high probability that a minor wave Z is being built in the last section. This wave may end in the form of a minute double zigzag at 0.732, as shown on the chart.
At the level of 0.732, correction (B) will be at 76.4% of impulse (A).
USD Claws Back Losses
USD/JPY bounces back
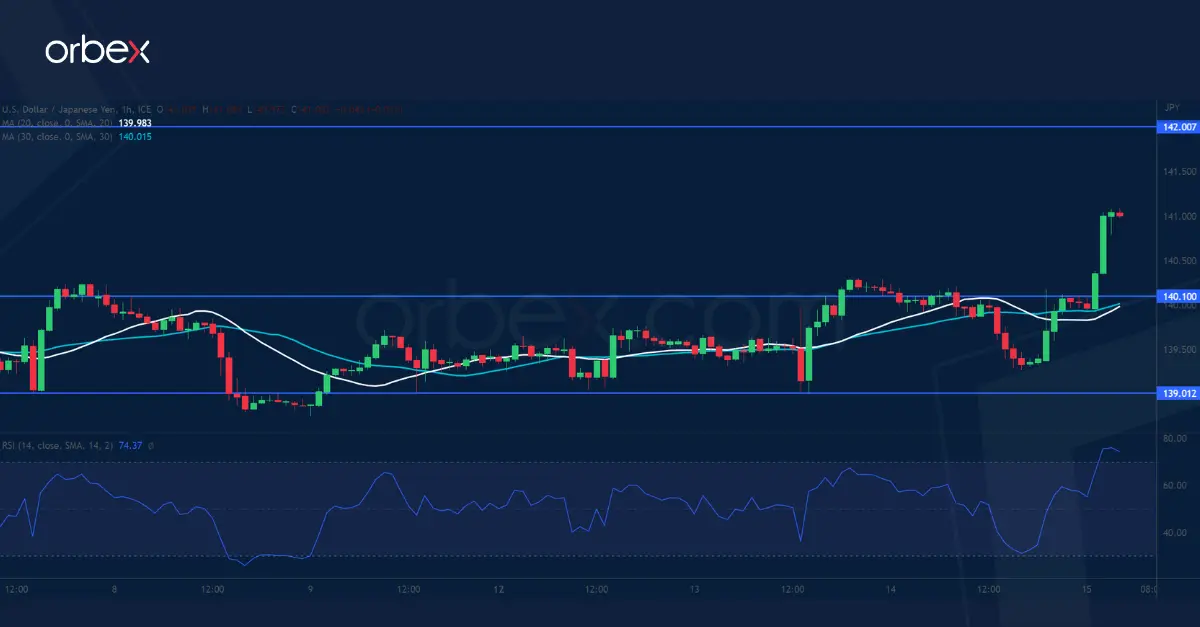
The US dollar bounced after the Fed signalled another 50 bp hike by year-end despite a pause. The pair has consolidated its gains along the 20-day SMA (139.00) after rising above the key supply zone around 138.00. The latest surge above 140.90 has prompted sellers to cover and could pave the way for a bullish continuation with 142.00 as the next threshold. This would confirm the upward skew and attract buyers in hope of an extension to 145.00. 140.10 is the closest support as the RSI shot into the overbought area.
NZD/USD turns lower
The New Zealand dollar softened after traders sold the news as the Fed held interest rates steady. The pair came under pressure at a previous demand zone 0.6240-0.6250 after clearing the former daily support of 6.1400. The RSI’s overbought condition has put a strain on follow-through bids as buyers started to take some chips off the table. 0.6140 is the closest support to see if there is any renewed interest. Failing that, a deeper retracement would expose the base of the breakout rally at 0.6080 from last week.
US30 sees correction
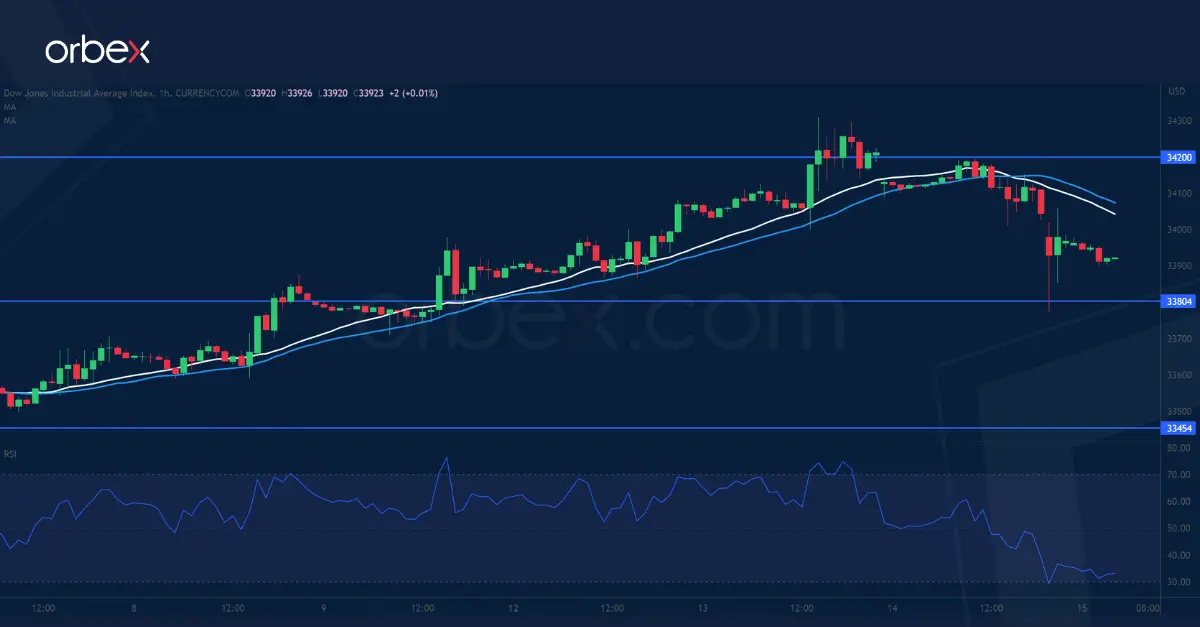
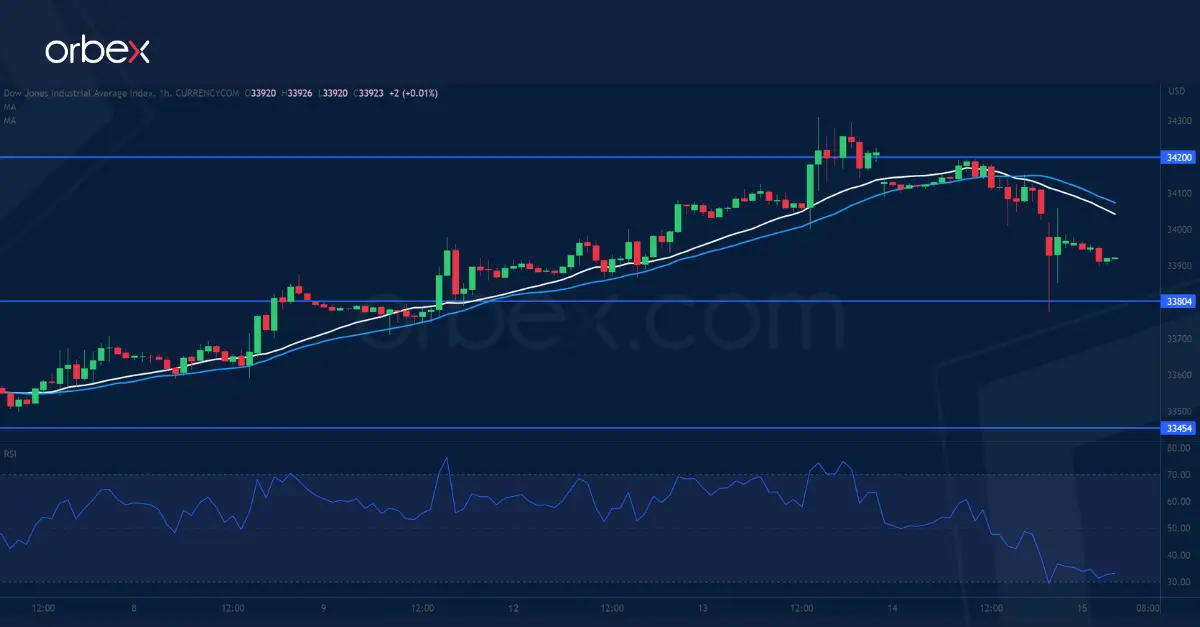
The Dow Jones broke lower on profit-taking after the FOMC kept options open in a mildly hawkish manner. A pop above the daily resistance of 34250 was a sign that the bulls had doubled down on the rebound, putting this year’s high of 34500 within reach. However, a break below the psychological level of 34000 at the base of the latest surge is an opportunity for the bulls to catch their breath, making 34200 a fresh resistance. 33800 is the next support and 33450 on the 20-day SMA the bulls’ second layer of defence.
Next Up is the ECB
Markets
The Fed skipped a rate rise but its updated dot plot signaled that there may be two more to come this year with a first one most likely in July (dubbed a “live” meeting). 12 of the 18 MPC members pushed for the higher peak rate at 5.5-5.75% later this year. 7 MPC members have also lifted their estimate of the neutral rate beyond 2.5%. That’s up from four in March and three in December last year. Are we seeing the contours of a(n implicit) higher inflation target? Anyway, growth and core inflation was revised higher for this year (1% and 3.9% respectively) and remain more or less unchanged further out. Ongoing labour market strength forced the Fed to lower the expected unemployment rate to just 4.1% end 2023 and 4.5% in the two years ahead. Why, then, go for a pause and not just hike yesterday? The Fed wishes to go slowly and more gradual after an aggressive tightening campaign. It also offers theoretically the best chances for cooling the economy rather than outright break it. But going easy also implies rates need to be high for a long enough period to dampen activity sufficiently and bring inflation back to target. The Fed sees next year’s policy level at 4.5-4.75% and at 3.25-3.5% in 2025. US markets finished the day surprisingly stoic with equities closing in a range of -0.7% and +0.4%. After a sharp, dot plot driven intraday reversal at the front end of the curve (+18 bps in the 2-y), the US 2-y yield close the day 2.2 bps higher. In a further curve inversion, the 30-y even lost 3.75 bps. The dollar left the lows of the day but no more than that. DXY closed around 103 and EUR/USD still took out the 1.08 level. Markets currently don’t buy the 50 bps additional tightening but we think that’s only a matter of time. The burden of the proof has shifted: it suffices for economic data to just meet the consensus bar to move markets towards the updated rate projections.
The PBOC this morning as expected also cut its 1-y medium term lending facility rate by 10 bps to 2.65%. It followed the unexpected 7-day reverse repo rate cut earlier this week. The moves are aimed at jolting a stalling Chinese economy. That was once again obvious from this morning’s monthly batch of data. Industrial production, retail sales, property and fixed asset investments all flopped in May. China’s yuan gapped lower at the open but in the meantime recovered to USD/CNY 7.15. Other markets, including US bonds (yields +2.3-4.9 bps) are affected by a stellar Australian jobs report (see below).
Next up is the ECB. A 25 bps rate hike to 3.5% is all but certain. We expect the central bank to hint at another move in July, as currently discounted by money markets, but to take a more neutral, data-dependent approach beyond that. There are a few events that warrant monitoring before committing to anything from September on. One is the full stop on the APP reinvestments from the second half of the year on. Another is the repayment of a big chunk of TLTROs at the end of this month. Yet another is the evolution of core inflation. There’s a good chance the “easing” in April and May may not continue, reverse even, over the summer months. Given what is priced in, the euro and yields could experience some profit-taking after the meeting. But being committed to kill off inflation, we believe they still have the backing of the ECB, which limits the downside potential.
News and views
The Australian Bureau of Statistics (ABS) published May employment data this morning. The Australian economy added 75.9k jobs (vs 17.5k expected) with the lion share of that amount being full time occupations (+61.7k). The increase in employment in May saw the number of employed people in Australia reach 14 million for the first time (almost 13 million pre-pandemic). The Australian participation rate hit a new high, rising from 66.7% to 66.9% with the unemployment rate dipping from 3.7% to 3.6%. The ABS head of labour statistics said that the whole range of indicators - strong growth in hours worked, the elevated employment-to-population ratio and participation rate, along with the low unemployment and underemployment rates – all point to a continuing tight labour market. Australian money markets further scaled up RBA tightening bets with a cumulative 50 bps of rate hikes now discounted by the October meeting. Risks are probably tilted to achieving that even earlier. AUD swap yields rise over 10 bps at the front end and 4 bps at the very long end. AUD/USD tries to take out the April and May tops around 0.68 which serve as resistance levels.