

Sample Category Title
EUR/CHF Daily Outlook
Daily Pivots: (S1) 0.9691; (P) 0.9703; (R1) 0.9716; More...
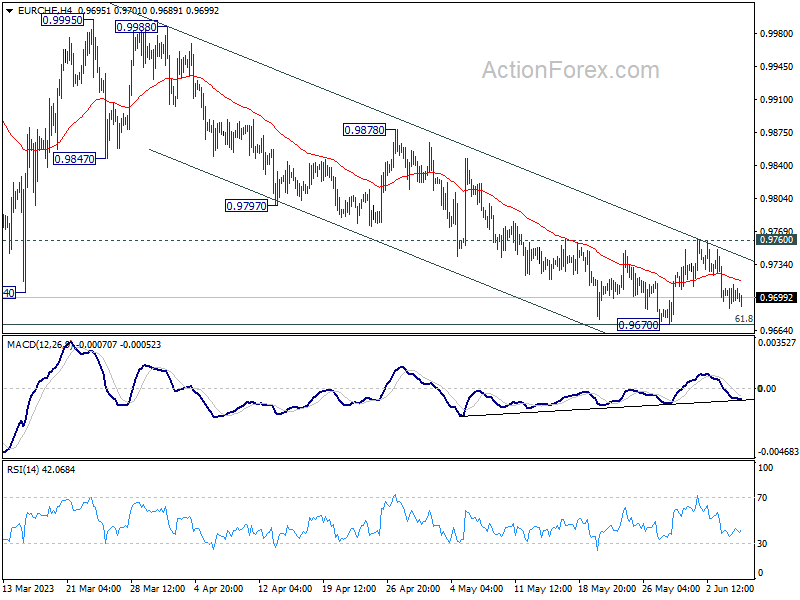
Range trading continues in EUR/CHF and intraday bias stays neutral first. On the upside, firm break of 0.9760 should confirm short term bottoming after hitting 61.8% retracement of 0.9407 to 1.0095 at 0.9670. Intraday bias will be back on the upside for 0.9878 resistance next. However, sustained break of 0.9670 will extend the whole decline from 1.0095 towards 0.9407 low instead.
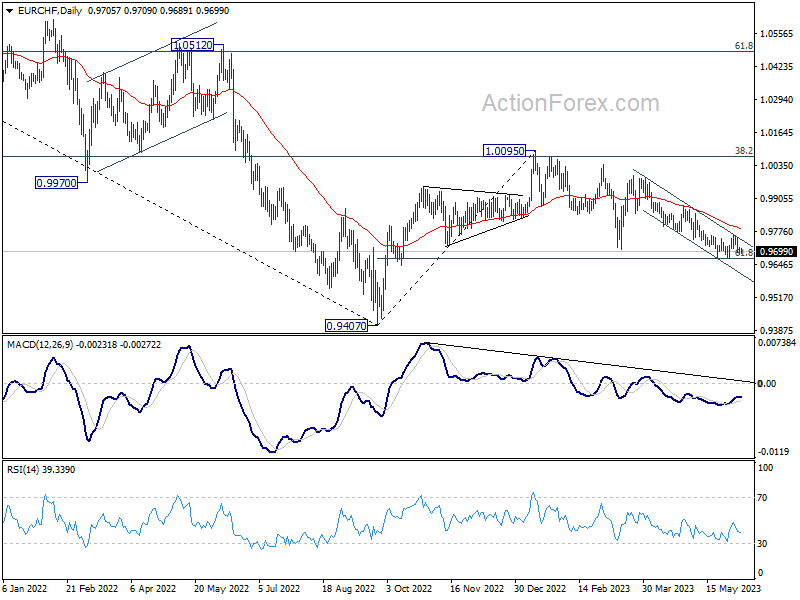
In the bigger picture, prior rejection by 38.2% retracement of 1.1149 to 0.9407 at 1.0072 suggests that medium term outlook is staying bearish. The pair is also capped below 55 W EMA (now at 0.9938). Down trend from 1.2004 (2018 high) is not completed yet and is in favor to resume through 0.9407 at a later stage. However, decisive break of 1.0095 resistance will raise the chance of bullish trend reversal. Rise from 0.9407 should then target 1.0505 cluster resistance (2020 low at 1.0505, 61.8% retracement of 1.1149 to 0.9407 at 1.1484).
EUR/USD Daily Outlook
Daily Pivots: (S1) 1.0684; (P) 1.0703; (R1) 1.0731; More...
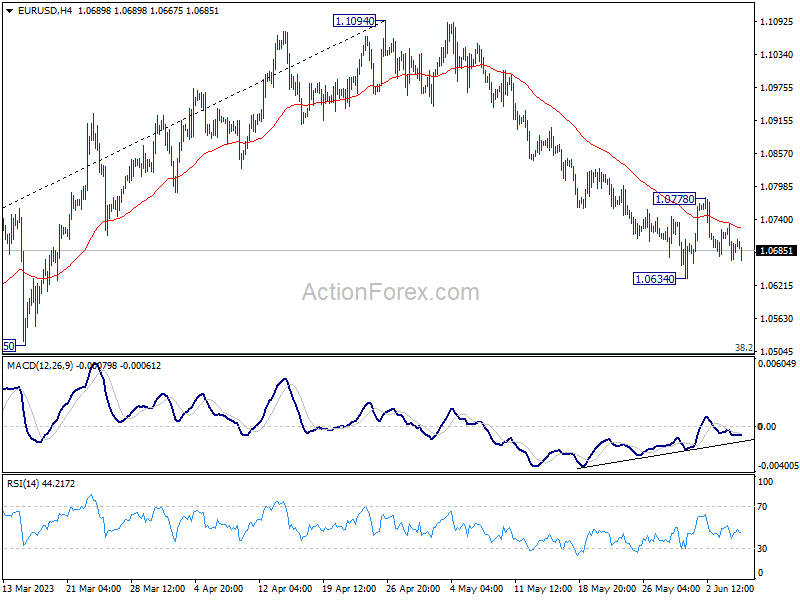
Intraday bias in EUR/USD stays neutral as sideway trading continues. On the downside, break of 1.0634 will resume the corrective decline from 1.1094. Deeper fall should then be seen to 1.0515 cluster support, 38.2% retracement of 0.9534 to 1.1094 at 1.0498. On the upside, however, above 1.0778 will resume the rebound from 1.0634 to 55 D EMA (now at 1.0820).
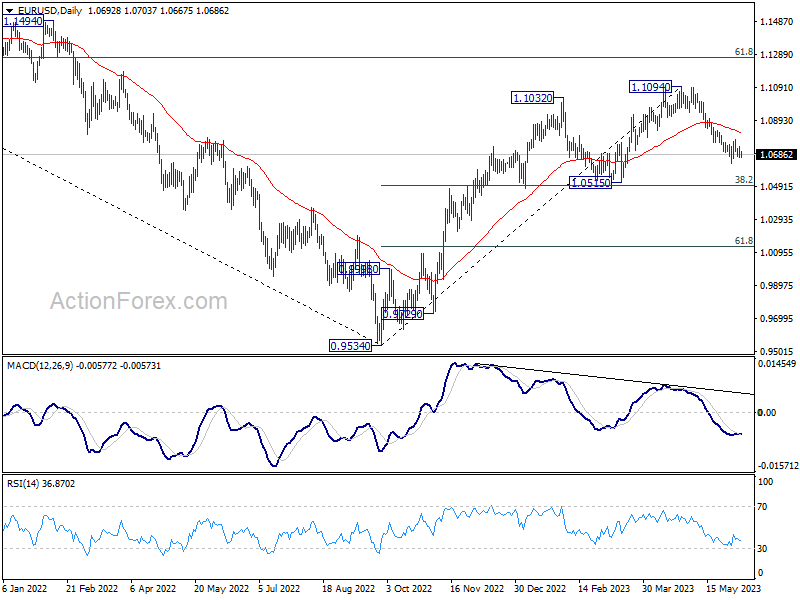
In the bigger picture, as long as 1.0515 support holds, rise from 0.9534 (2022 low) would still extend higher. Sustained break of 61.8% retracement of 1.2348 (2021 high) to 0.9534 at 1.1273 will solidify the case of bullish trend reversal and target 1.2348 resistance next (2021 high).
GBP/USD Daily Outlook
Daily Pivots: (S1) 1.2391; (P) 1.2425; (R1) 1.2458; More...
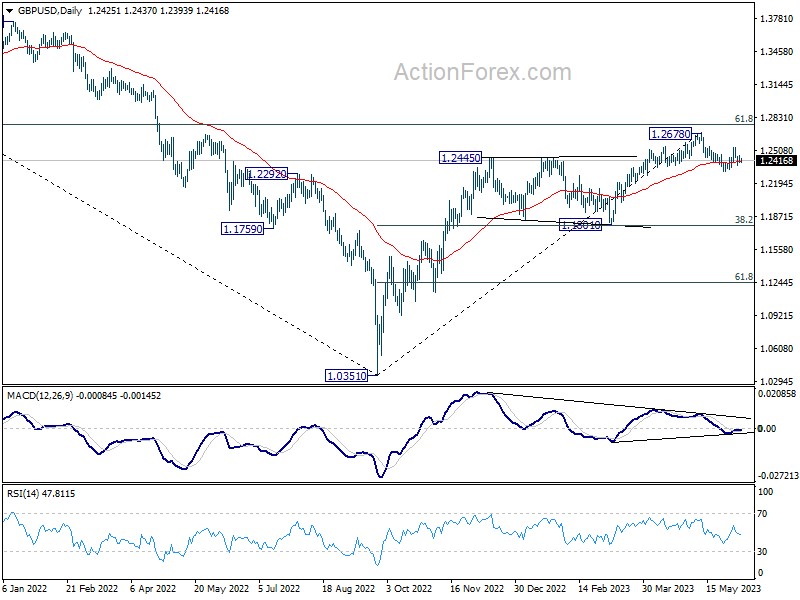
Intraday bias in GBP/USD remains neutral as range trading continues above 1.2306. On the downside, break of 1.2306 will resume the correction from 1.2678. Deeper decline would then be seen to 1.1801 cluster support (38.2% retracement of 1.0351 to 1.2678 at 1.1789). On the upside, above 1.2543 will resume the rebound from 1.2306 to retest 1.2678 high.
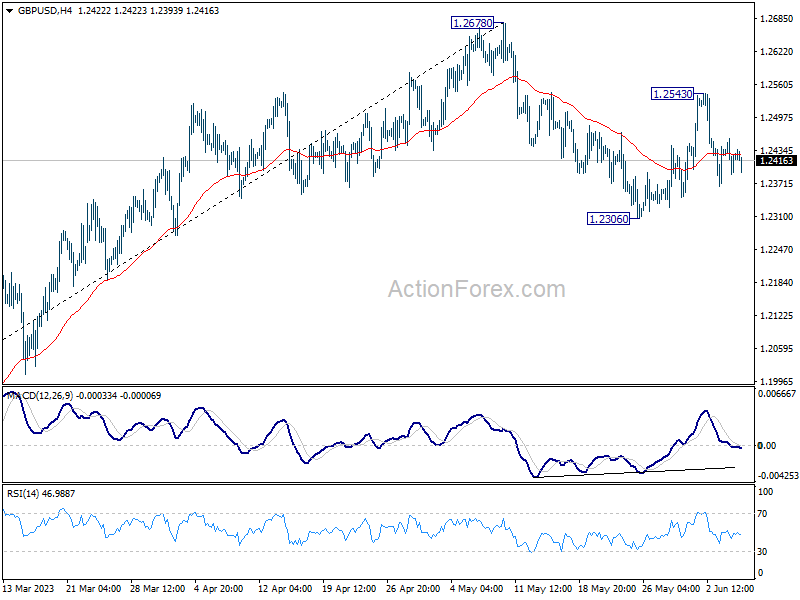
In the bigger picture, as long as 1.1801 support holds, rise from 1.0351 medium term bottom (2022 low) is expected to extend further. Sustained break of 61.8% retracement of 1.4248 (2021 high) to 1.0351 at 1.2759 will add to the case of long term bullish trend reversal. However, firm break of 1.1801 will indicate rejection by 1.2759, and bring deeper decline, even as a correction.
USD/CHF Daily Outlook
Daily Pivots: (S1) 0.9037; (P) 0.9078; (R1) 0.9105; More...
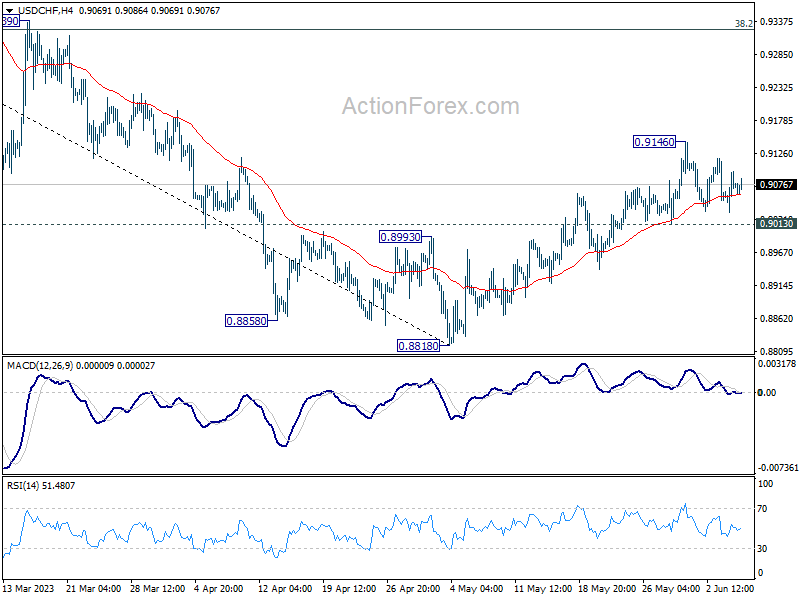
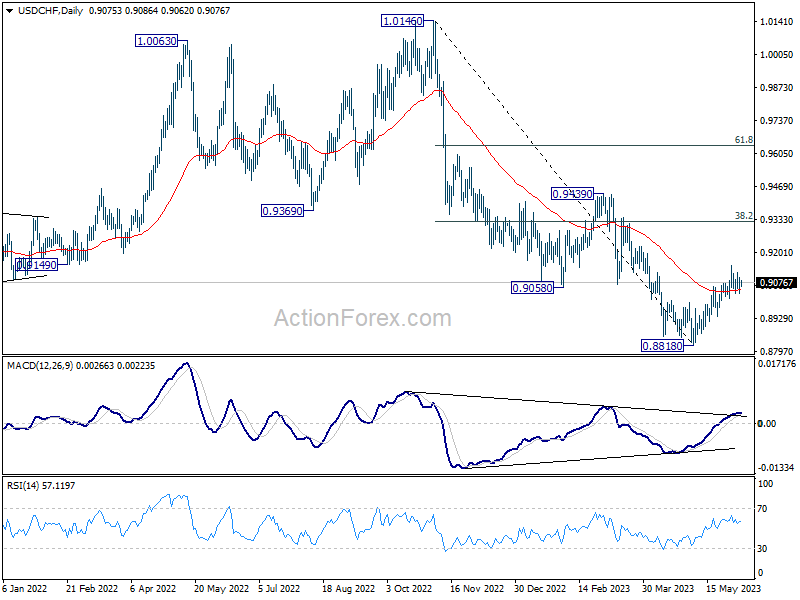
Intraday bias in USD/CHF stays neutral as consolidation from 0.9146 is extending. Further rally is expected with 0.9013 support intact. Rise from 0.8818 short term bottom is seen as correcting whole down trend from 1.0146. Above 0.9146 will target 38.2% retracement of 1.0146 to 0.8818 at 0.9325. On the downside, however, break of 0.9013 will turn bias back to the downside for retesting 0.8818 low instead.
In the bigger picture, fall from 1.1046 (2022 high) is seen as a leg in the long term range pattern from 1.0342 (2016 high), which might have completed at 0.8818 already, just ahead of 0.8756 long term support. Sustained trading above 0.9058 support turned resistance should confirm medium term bottoming. Further break of 0.9439 resistance will confirm bullish trend reversal.
USD/JPY Daily Outlook
Daily Pivots: (S1) 139.16; (P) 139.57; (R1) 140.05; More...
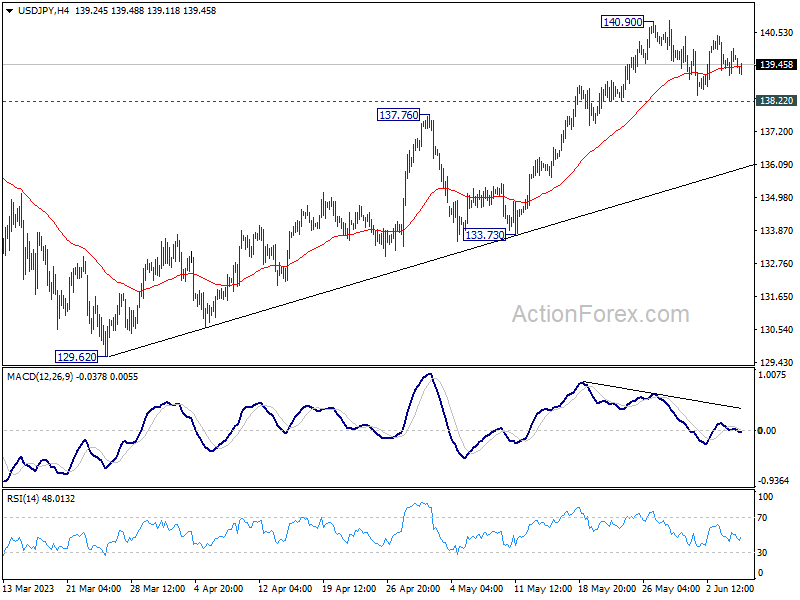
Intraday bias in USD/JPY remains neutral as consolidation from 140.90 is extending. Further rally is expected as long as 138.22 minor support holds. On the upside, break of 140.90 will resume larger rise from 127.20 to 142.48 fibonacci level. However, considering bearish divergence condition in 4 hour MACD, break of 138.22 will confirm short term topping, and turn bias back to the downside for 55 D EMA (now at 136.35).
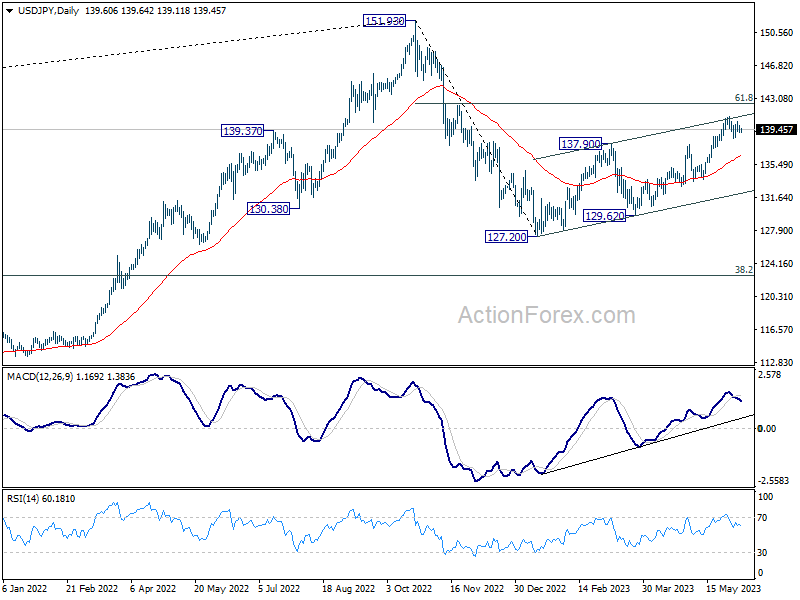
In the bigger picture, rise from 127.20 is seen as the second leg of the corrective pattern from 151.93 high. Stronger rally would be seen to 61.8% retracement of 151.93 to 127.20 at 136.34. Sustained break there will pave the way back to retest 151.93. On the downside, however, break of 133.73 support will argue that the pattern could have started the third leg through 127.20 low.
USD/CAD Daily Outlook
Daily Pivots: (S1) 1.3377; (P) 1.3415; (R1) 1.3439; More....
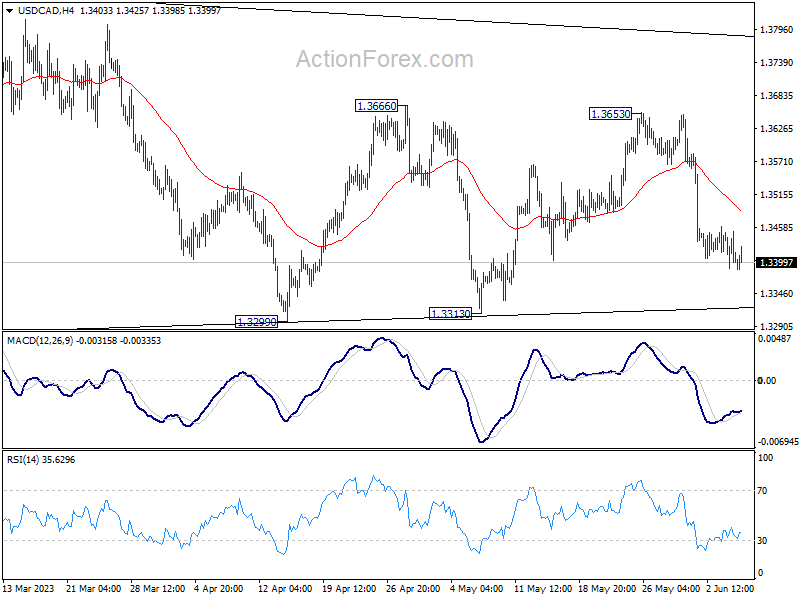
Intraday bias in USD/CAD stays neutral as range trading continues. Price actions from 1.3976 are seen as a triangle consolidation pattern. Above 1.3666 will target 1.3860 resistance first. Firm break of 1.3860 will argue that larger up trend is ready to resume through 1.3976 high. Nevertheless, sustained break of 1.3229 will dampen this view and turn near term outlook bearish.
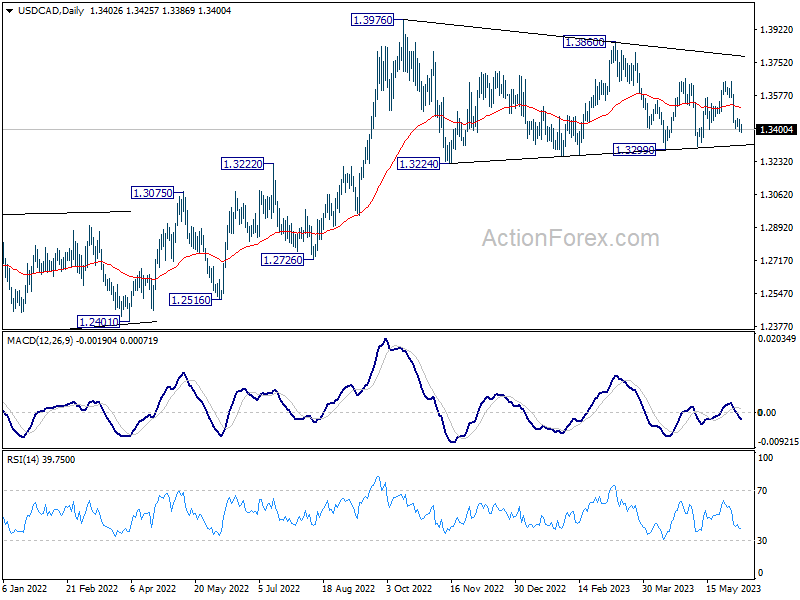
In the bigger picture, rise from 1.2005 (2021 low) is expected to resume through 1.3976 after consolidation from there completes. On decisive break of 1.3976, next target will be 1.4667/89 long term resistance zone. This will remain the favored case as long as 38.2% retracement of 1.2005 to 1.3976 at 1.3233 holds.
EUR/CHF and USD/CHF Weekly Chart Outlook
EUR/CHF is struggling to clear the 0.9960 resistance zone. USD/CHF could gain pace if it clears the 0.9290 resistance zone.
Important Takeaways for EUR/CHF and USD/CHF Analysis
- The Euro is facing strong resistance near 0.9960 against the Swiss Franc.
- There is a key bearish trend line forming with resistance near 0.9850 on the weekly chart of EUR/CHF at FXOpen.
- USD/CHF found support near 0.8820 and recently started an upside correction.
- There is a crucial bearish trend line forming with resistance near 0.9200 on the weekly chart at FXOpen.
EUR/CHF Technical Analysis
On the weekly chart of EUR/CHF at FXOpen, the pair started a decent recovery wave from the 0.9400 support zone. The Euro was able to climb above 0.9670 against the Swiss Franc.
During the increase, it traded above the 50% Fib retracement level of the last major decline from the 1.0515 swing high to the 0.9406 low. There was also a spike above the 0.9960 resistance and the 50-week simple moving average.
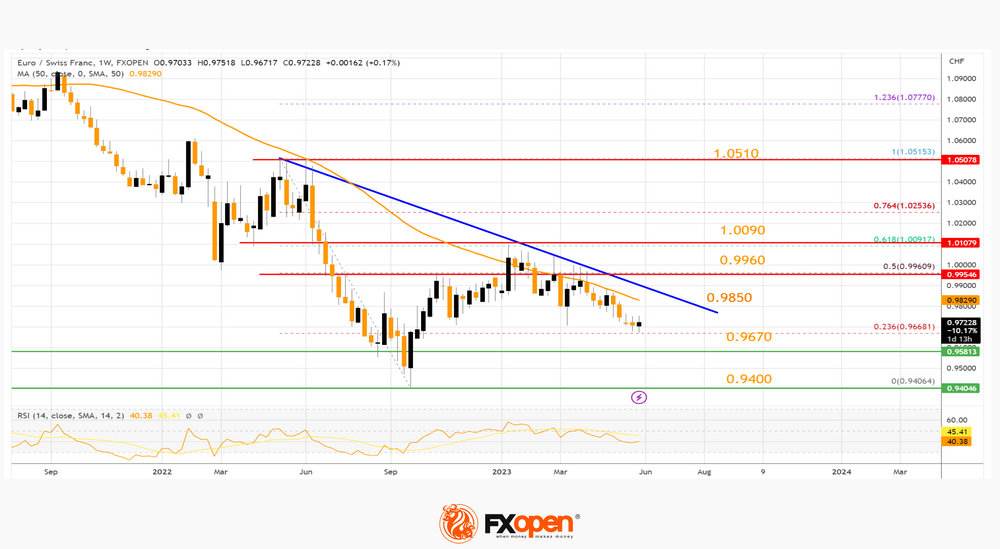
However, the pair struggled to clear the 1.0090 resistance zone. It failed near the 61.8% Fib retracement level of the last major decline from the 1.0515 swing high to the 0.9406 low.
On the EUR/CHF chart, the pair is moving lower and trading below the 50-week simple moving average. Immediate support is near the 0.9670 level. The first major support is near the 0.9400 level, below which the pair could decline toward 0.9200.
On the upside, the first major resistance is forming near a key bearish trend line at 0.9850. The next major resistance is near the 0.9960 level, above which the pair might revisit the 1.0090 resistance zone if the weekly RSI moves above 50. Any more gains might the pair toward 1.0500.
USD/CHF Technical Analysis
On the weekly chart of USD/CHF, the pair faced strong rejection near the 1.0100 level. The US Dollar started a major decline below the 0.9500 support against the Swiss Franc.
The pair tested the 0.8820 support. A low was formed near 0.8820 and the pair is now rising. It broke the 23.6% Fib retracement level of the downward move from the 0.9440 swing high to the 0.8820 low.
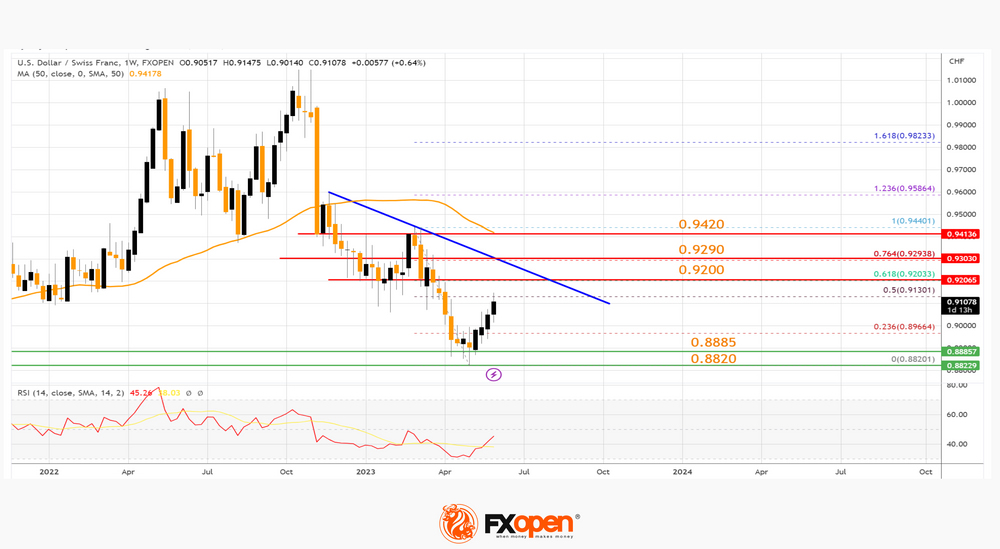
On the upside, the pair is facing resistance near a key bearish trend line at 0.9200. It is close to the 61.8% Fib retracement level of the downward move from the 0.9440 swing high to the 0.8820 low. The next major resistance is near the 0.9290 level.
The main resistance on the USD/CHF chart is near the 50-week simple moving average at 0.9420. A successful close above 0.9420 is likely to start a strong upward move toward 0.9800 in the coming weeks.
Conversely, if USD/CHF fails to break 0.9200, it could retreat lower and revisit the 0.8885 support area. The next major support is near the 0.8820 level. A downside break below the 0.8820 support might send the pair toward 0.8650.
Any more losses might push the pair further into a bearish zone. In the stated case, there is a risk of a drop toward the 0.8200 support zone in the medium term.
Weak Global Trade Weighs on Chinese Exports, Australian Growth Slows, Oil Slips Further
European indices and US futures look a little flat following a mixed session in Asia overnight, as Chinese trade data failed to inspire while Australian GDP pointed to further pain as the RBA continues raising rates.
Disappointing trade figures increase calls for stimulus
Chinese trade data offered further evidence of weakening demand both domestically and abroad, with exports falling particularly hard last month. A 7.5% decline far exceeded the -0.4% expected, while imports actually beat forecasts, albeit while also falling 4.5% in May.
Weaker global trade is not a new story but it is surprising how quickly China's reopening boost has faded, with backlogs of work supporting export numbers until now even as other countries have continued to see demand for their goods wane.
With China's reopening boom flagging so quickly, pressure is set to intensify on the leadership to announce new stimulus measures in a bid to revitalize the economy again and achieve its 5% growth target. That may initially come in the form of rate cuts, perhaps targeted to those sectors under the most pressure with authorities so far reluctant to engage in broad-based easing.
Australian growth slows as high interest rates bite
The Australian economy is slowing amid cost-of-living pressures, weaker household spending, and higher interest rates. GDP in the first quarter slipped to 0.2%, down from 0.6% in the final quarter of last year and below expectations. High-interest rates and inflation are hurting household finances and the economy is now suffering. This week's RBA hike is going to compound this and unless we see signs of price pressures easing, there may be more to come.
Oil remains under pressure after Saudi cut
Oil prices are falling again today as Saudi Arabia's attempt to dress up a unilateral move as a group cut fails to have the desired impact. Crude is now trading below the level it ended at Friday which suggests that, despite the knee-jerk reaction on Monday, traders were hedging against broader action from OPEC+ and got a light version of the deal they feared.
While Saudi Arabia remains price driven, the market is more concerned with the economic outlook, and the rest of the alliance seemingly isn't interested in taking more action in anticipation of what may come. The commitment from the start of the next year could easily change depending on what unfolds whereas markets are forced to respond to current risks and as far as the economy is concerned, they are tilted to the downside.
Gold awaiting further data following inconclusive reports
Gold is treading water again this morning, sitting right in the middle of the roughly $1,940-$1,980 range it found itself in these past weeks. The economic data we've had recently has been far from conclusive and that creates a lot of uncertainty around the policy path for interest rates and therefore appetite for the yellow metal.
Inflation has proven to be more stubborn than hoped while the labour market remains resilient, a combination that doesn't point to US rate cuts later this year as traders currently hope. This is a big summer and all of that may soon change but for now, that uncertainty is creating this choppiness and range trading we're seeing in gold.
Will the Binance and Coinbase sagas bring regulatory clarity to the space?
It's been an explosive couple of days in the crypto space, with the SEC targeting Binance and Coinbase with lawsuits containing various allegations that have rattled the industry. Bitcoin initially fell more than 5% on Monday before recovering largely on Tuesday and now it's trading only marginally lower, just below $27,000. While the initial response to the action was negative, it didn't exactly come as a shock and the companies will have been preparing for such a move for some time.
Given the size of the two exchanges and the recent scarring from the FTX scandal, there will obviously be some concern about what comes next. But one good thing that will hopefully come from this is regulatory clarity which has been lacking for years now.
Markets Enter Standby Mode
Asian stocks crawled higher on Wednesday, following the positive cues from Wall Street overnight after the S&P500 closed at its highest level in 2023. However, markets remain cautious despite hopes for stimulus in China with risk sentiment shaky after the World Bank’s warning on the global economic outlook. European futures are pointing to a cautiously positive open despite the industrial production figures for Germany rising less than expected in April. In the currency markets, the dollar seems to be on standby amid the absence of a fresh fundamental spark. Oil prices fell in the previous session, despite initially rallying on news of Saudi Arabia’s supply cut while gold was little changed.
In other news, Australia’s economy slowed more than expected in the first quarter of 2023 as aggressive policy tightening took hold. GDP expanded 0.2% from the prior quarter which was the weakest expansion witnessed since the third quarter of 2021. Year on year, the economy grew 2.3% cooling from a downwardly revised 2.6%. This disappointing report comes just one day after the Reserve Bank of Australia surprised markets with a 25-basis point rate hike. Aussie bulls seemed unfazed by the data, with the currency edging slightly higher across the board. Taking a quick look at the technicals, AUDUSD is bullish on the daily charts with prices approaching the 200-day SMA around 0.6690. A solid breakout above this point may encourage a move toward 0.6740.
Bank of Canada rate decision in focus
After the surprise 25 basis point hike by the RBA on Tuesday, all eyes will be on the Bank of Canada rate decision on Wednesday. While the central bank is not expected to hike rates, money markets are still pricing in a 46% probability of a rate rise becoming a reality this afternoon. It’s worth keeping in mind that the stronger-than-expected GDP and CPI data have supported expectations around the BoC keeping rates higher for longer. If the central bank surprises markets with a hike in June, the Canadian dollar could rally. Talking technicals, the CAD has been one of the best-performing G10 currencies month-to-date, gaining over 1% against the dollar. USDCAD has found itself trapped within a wide range on the monthly, weekly, and daily charts with a potential breakout on the horizon. With the current path of least resistance pointing south, it may be wise to keep an eye on how prices behave around the 1.3300 support.
Oil weighed by growth concerns
Oil prices were under pressure on Wednesday as concerns over global economic growth kept bears in the driving seat following the initial bounce at the start of the week on Saudi Arabia’s pledge to cut oil production. The global commodity is likely to remain volatile as fears over the demand outlook clash with supply-side forces. Nevertheless, the scales of power seem to remain in favour of the bears, especially when factoring in how oil has shed roughly 12% year-to-date amid China’s uneven growth and the Fed’s aggressive rate hikes. It may be worth keeping a close eye on the US weekly crude inventories report published later today which could influence oil prices. Another build in inventories could fuel downside losses, dragging WTI crude toward $70.
Commodity spotlight – Gold
Gold was steady this morning in the absence of a fresh fundamental catalyst. Given how we have entered the blackout period for Fed speakers and the rest of the week is light on US data, the precious metal could remain trapped in a range. Nevertheless, the OECD’s global economic outlook might inject some light into the precious metal ahead of the Fed decision next week. In the meantime, support can be found at $1935 and resistance around $1985.
Bitcoin (BTCUSD) Short Term 5 Swing Bearish Sequence Favors Lower
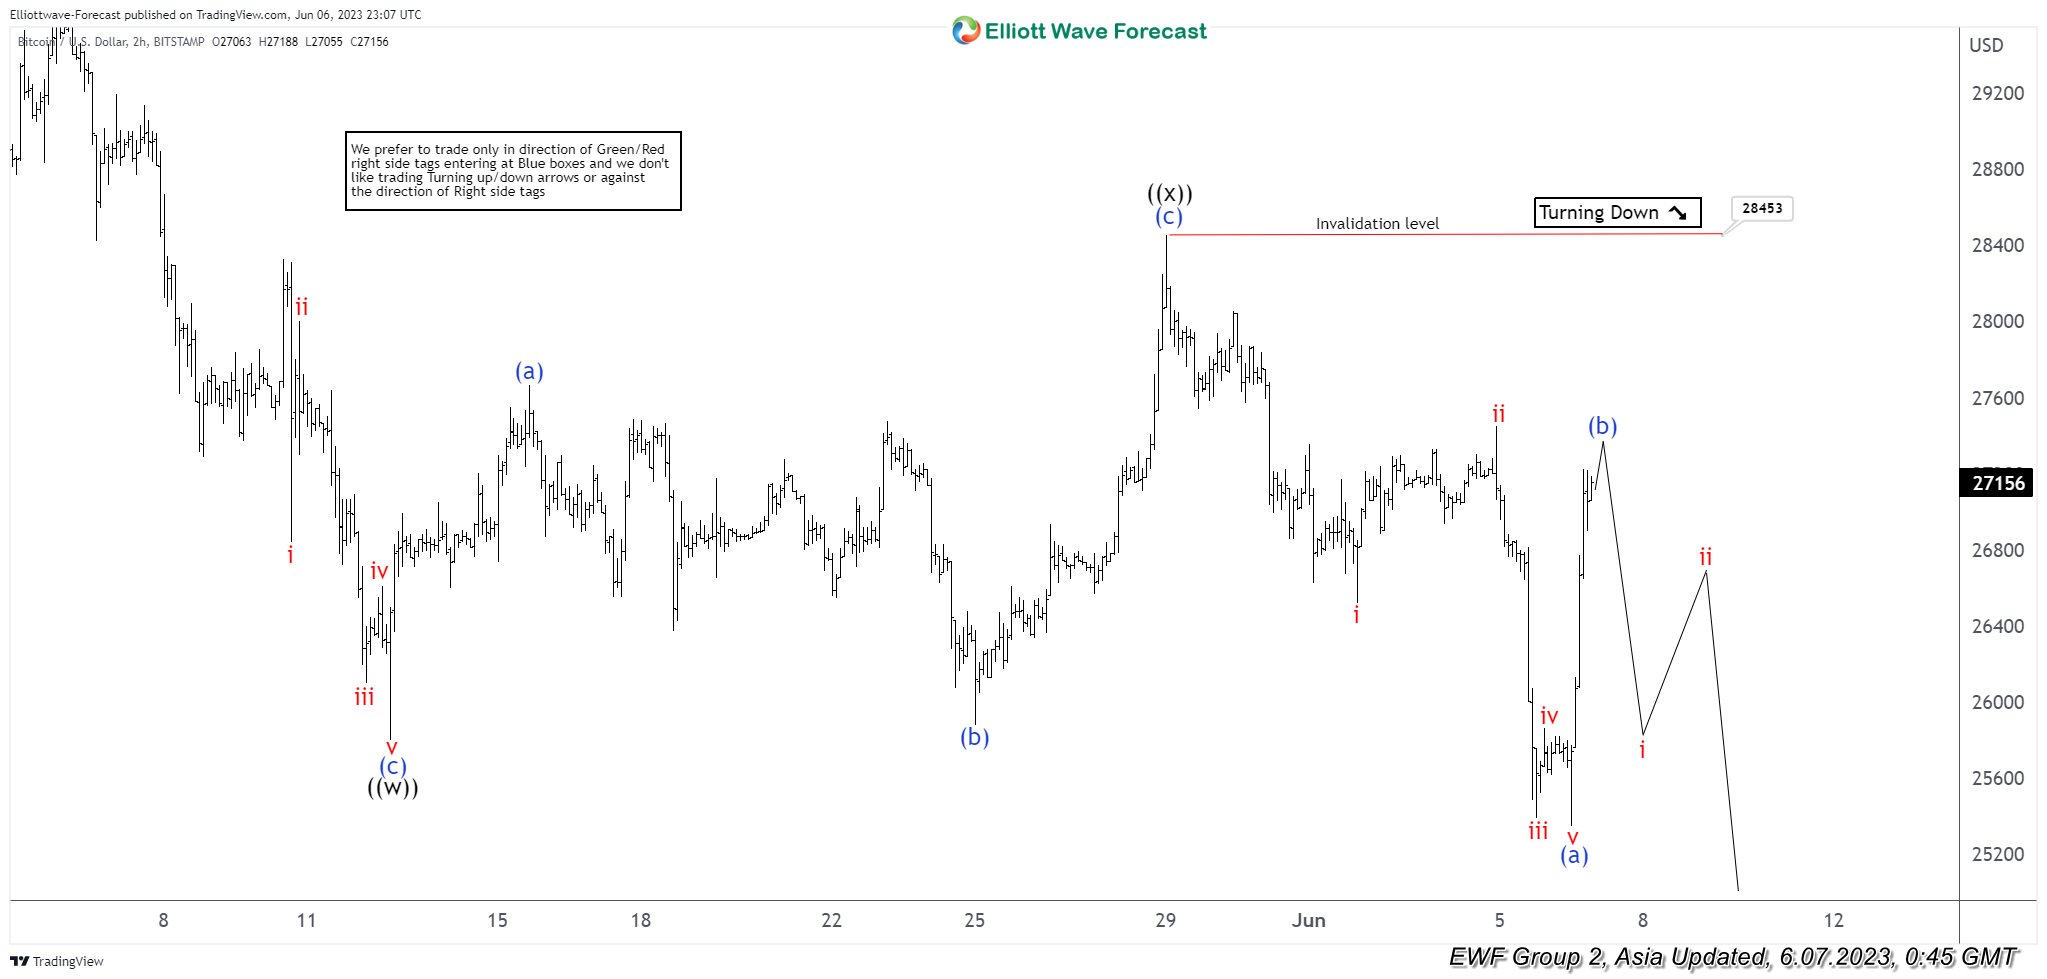
Bitcoin (BTCUSD) decline from 4.14.2023 high shows a 5 swing sequence suggesting further downside can’t be ruled out. A 5 swing sequence typically is an incomplete sequence and can see more downside to end 7 swing as a double three (double zigzag) Elliott Wave structure. Down from 4.14.2023 high, wave (a) ended at 26981 and rally in wave (b) ended at 29851. Wave (c) lower ended at 25800 which completed wave ((w)) in higher degree. Up from there, wave (a) ended at 27666, pullback in wave (b) ended at 25878. Wave (c) higher ended at 28453 which completed wave ((x)).
Bitcoin has turned lower in wave ((y)) with internal subdivision as another zigzag in lesser degree. Down from wave ((x)), wave i ended at 26519 and wave ii ended at 27451. Wave iii ended at 25389, wave iv ended at 25863, and wave v lower ended at 25350 which completed wave (a) of ((y)) in higher degree. Rally in wave (b) is expected to fail below 28453 in the first degree for further downside in wave (c). Ideal target lower is 100% – 161.8% Fibonacci extension from 4.14.2023 high which comes at 20020 – 23244. Near term, as far as pivot at 28453 high stays intact, expect rally to fail in 3, 7, or 11 swing for further downside.
Bitcoin (BTCUSD) 2 Hours Elliott Wave Chart
BTCUSD Elliott Wave Video
https://www.youtube.com/watch?v=B5yo3spURbA