Sample Category Title
EUR Struggles for Support
EUR/USD breaks lower
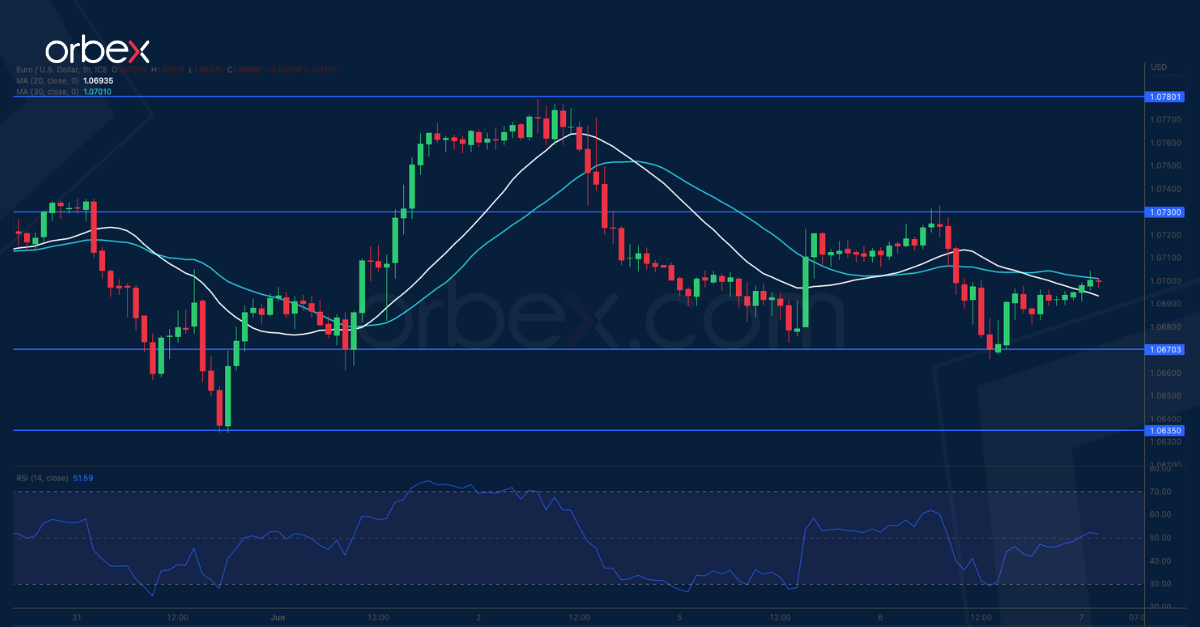
The Euro struggled after retail sales across the bloc remained flat in April. The pair has given up most of the gains from its mid-Mach rally and is heading towards the daily support of 1.0540. The latest bounce has met stiff selling pressure at 1.0780 and the subsequent U-turn sent the single currency back to the base of the rebound at 1.0670 with a tentative break suggesting further weakness. Its breach would invalidate the brief bullish momentum and cause a sell-off below 1.0635. 1.0730 has become a fresh resistance.
AUD/USD bounces back
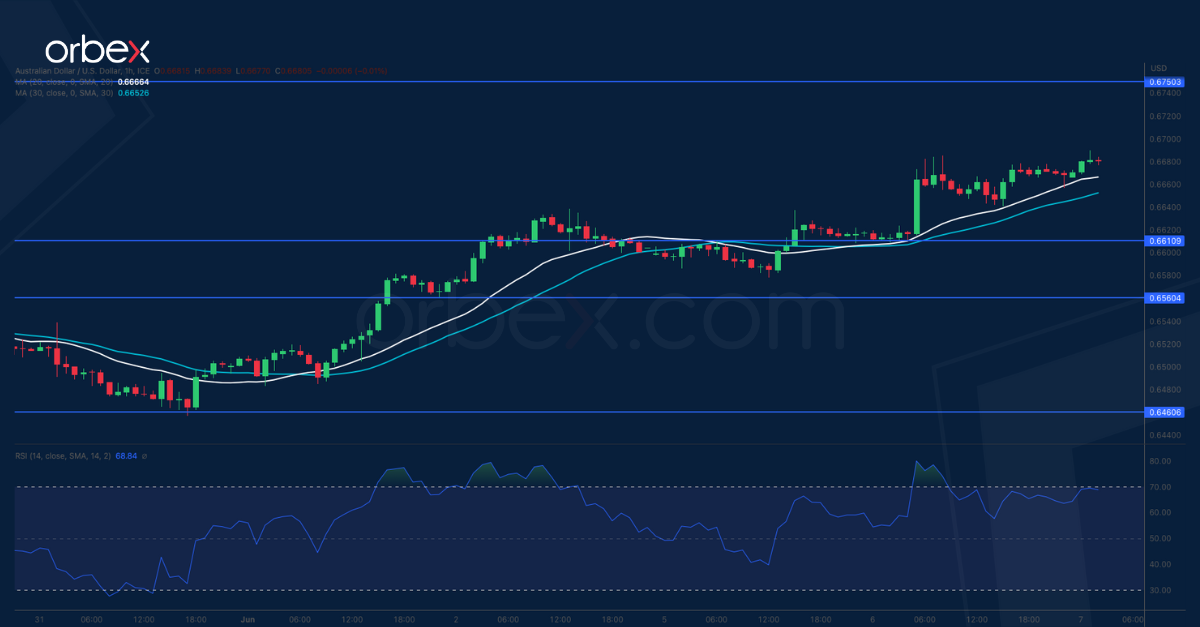
The Australian dollar jumped after the RBA surprised the market with another tightening move. The price continues to capitalise on its bounce off the base of last November’s rally at 0.6460. A surge above the key support-turned-resistance of 0.6640 has forced more sellers to cover their bets and eased the bearish pressure, clearing the path for a potential extension towards 0.6750. The RSI’s double top in the overbought zone may temporarily limit the bullish fever and 0.6610 is the closest support in case of a retracement.
UK 100 tests resistance
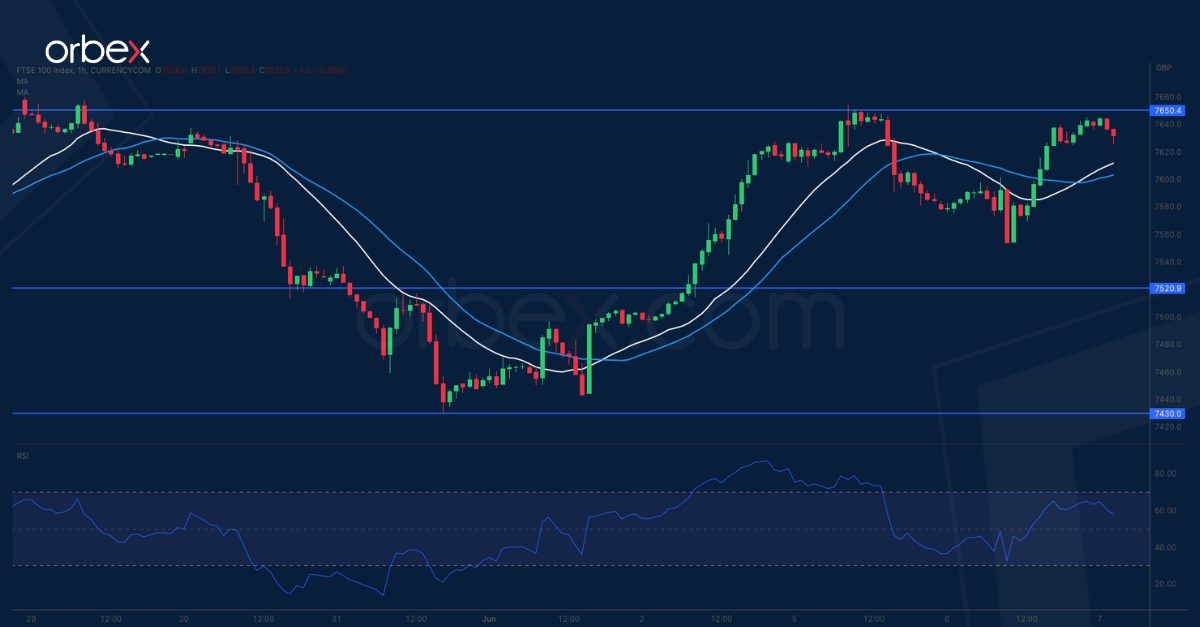
The FTSE 100 bounces back supported by a rally in energy stocks. A V-shaped rebound has brought the index to its first key resistance at 7650 which coincides with the 20-day SMA. A bullish breakout would flush selling interests out and pave the way for an extended recovery to the previous consolidation zone around 7800 where a liquidation kicked off later last month. A close above this major ceiling might trigger a bullish continuation above 8000 in the medium-term. 7520 is an important level to maintain the current momentum.
Weak Chinese Trade Data Add to Growth Worries
Markets
German Bunds outperformed US Treasuries during European trading hours following an unexpectedly strong decrease of inflation expectations in the ECB’s April Consumer Expectations Survey. The divergence between the two became even larger as US Treasuries started underperforming (especially at the front end the curve) during the US session. The move started after the US Treasury announced plans to boost the size of its coming bills sales: $60bn for the 4-week tenor (+$25bn), $50bn for the 8-week tenor (+$35bn) and $46bn for the 17-week auction (+$2bn). Since the debt ceiling has been raised, the US Treasury is rapidly trying to replenish its depleted general account with the Fed which shrank to its lowest level since 2017. In coming weeks/months, sizes at the longer tenors will be upped as well with the bigger question being whether this will drain more liquidity in times of Fed rate hikes and QT or whether it will just trigger a shift in investor allocation from one cash instrument to the other. Daily changes on the US curve ranged between +1.3 bps (2-yr) and -4.2 bps (30-yr). Minutes before the market close, US Treasuries managed to erase a large part of the intraday losses in a strange, inexplicable, short squeeze. German yields closed the session up to 4 bps lower at the front end and broadly stable at the very long end. Loss of interest rate support at the front end pulled EUR/USD back below 1.07 to close at 1.0693.
Asian risk sentiment is mixed this morning as weak Chinese trade data (May exports -7.5% Y/Y) add to growth worries. The calendar is again razor thin. The OECD updates its economic outlook. Yesterday’s, the World Bank did the same. It projects global growth to decelerate from 3.1% in 2022 to 2.1% in 2023. Risks of financial stress in emerging markets and developing economies is intensifying amid elevated global interest rates. The Bank of Canada’s policy rate decision is today’s biggest wildcard. Money markets are split 50/50 over whether the BoC will lift its policy rate again by 25 bps after pausing in March and April. It would be an omen for global central banks after the RBA earlier this week conducted a second 25 bps rate hike after a one-meeting pause in April.
News and views
Global supply chain pressures eased further in May according to the NY Fed’s Global Supply Chain Pressure index (GSCPI) which eased from to -1.71 from -1.35 in April. The reading was the lowest since the start of the series in 1997. There were significant downward contributions from Great Britain backlogs and Taiwan delivery times. Euro Area delivery times and backlogs exhibited the largest sources of upward pressure in May. Looking at the underlying data, readings for all regions tracked by the GSCPI are below their historical averages. The GSCPI integrates a number of commonly used metrics with the aim of providing a comprehensive summary of potential supply chain disruptions. Global transportation costs are measured by employing data from the Baltic Dry Index and the Harpex index, as well as airfreight cost indices from the US BLS. The GSCPI also uses several supply chain-related components from PMI surveys, focusing on manufacturing firms across seven interconnected economies
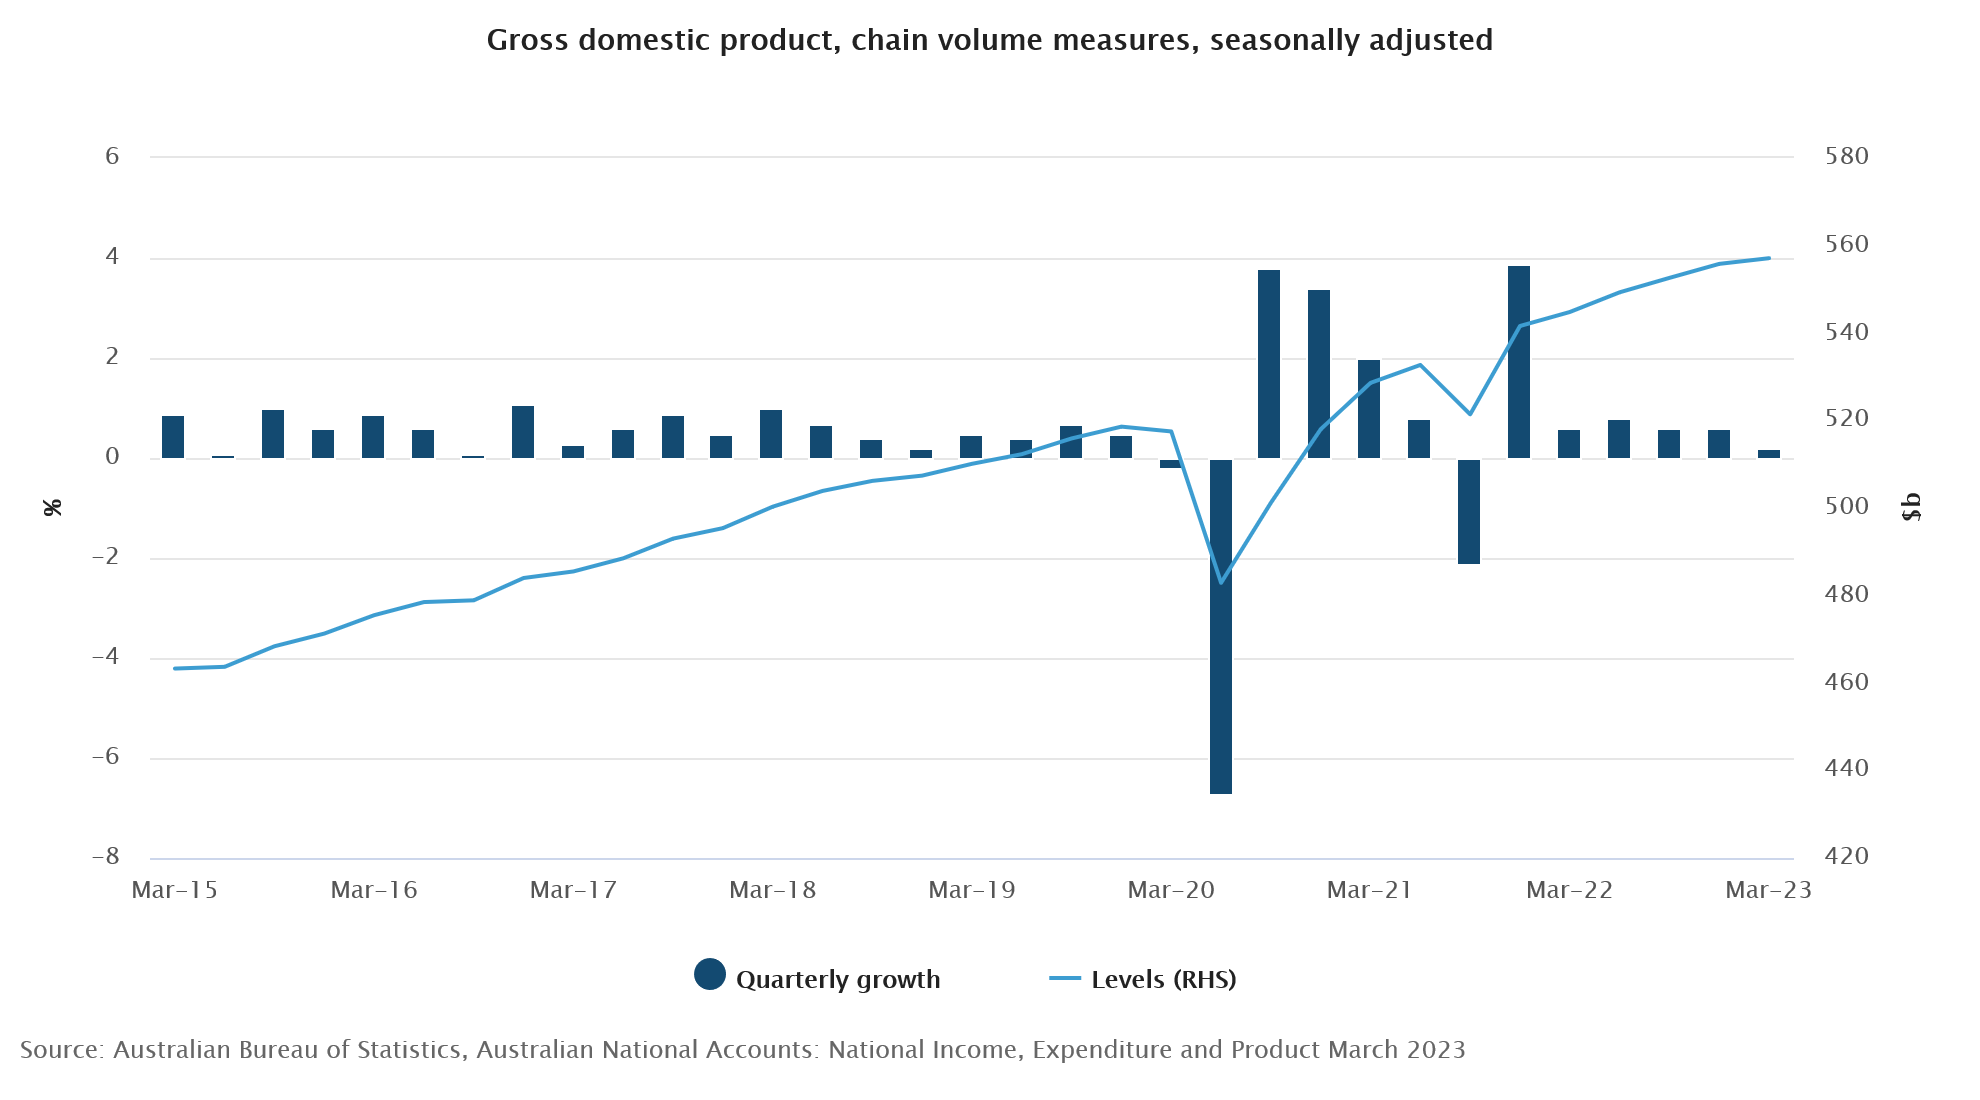
Australian GDP rose 0.2% Q/Q and 2.3% Y/Y in the first quarter of 2023. It was the sixth straight rise in quarterly GDP, but the slowest since the Covid-19 lockdowns in September 2021. Private and public global fixed capital formation (respectively +1.4% after -0.9% in Q4 and +3% from -1.2%) were the main drivers of GDP growth. Household consumption continued to slow in Q1 rising 0.2% Q/Q and resulting in a 0.1 ppt contribution to growth. Net trade detracted 0.2 ppt from growth as exports increased 1.8% and imports rose 3.2.%. Despite the deceleration in growth, prices continued to grow strongly in Q1. The GDP implicit price deflator rose 1.9% Q/Q and 6.8% Y/Y. Compensation of employees also continued to rise (2.4%) as did employment, hours worked, pay raises and bonuses in the public sector. The household saving to income ratio fell to 3.7%, its lowest level since 2008, driven by higher income tax payable, interest payable on dwellings, and increased spending due to the rising cost of living pressures.
Lira Opens Its Eyes in a Dark Post-Coma Room
The SEC sued Coinbase, a day after it sued Binance for allegedly breaking US security rules. A 101-page complaint revealed how Coinbase allowed its users to trade tokens which were, in reality, unregistered securities in the US.
Coinbase dived 12% yesterday and is down by almost 30% since the start of the week, Binance Coin lost up to 10% while Bitcoin has fully recovered the Binance shock and barely reacted to Coinbase news.
Cryptocurrency valuations have been impressively resilient to shocks in crypto exchanges; it is now clear for most crypto traders that the existential threat of cryptocurrency exchanges is not an existential threat for cryptocurrencies.
Globally sticky inflation and rising yields are a stronger headache for cryptocurrency valuations than crypto exchanges’ trouble with the SEC.
Pause, skip, hike?
The Fed is broadly expected to keep interest rates steady next week, but preserve the possibility of further rate hikes for the July meeting. The threat of another rate hike – sometime down the road – should be enough to keep the pressure in US yields to the upside. The US 2-year yield is steady around the 4.50% level.
Across the Atlantic Ocean, the policy tightening results are better seen and felt. Consumer expectations for the euro area fell significantly in April, a week after the Euro-area inflation revealed a much faster-than-expected fall in both headline and core numbers. According to the latest European Central Bank (ECB) survey, the inflation expectation for the next 12-months is down from 5% to 4.1%, and the expectation for the next 3-years is down from 2.9% to 2.5% - a stone’s throw distance from the ECB’s 2% policy target. The German 2-year yield slid more than 1% yesterday on the news, and the spread between the 10-year German and Italian bonds fell to the lowest level since April on improved sentiment following good news from the inflation front. The question is, whether the ECB will soften its hand, and adopt a Fed-like policy, where the rate hikes could pause, after next week’s almost certain 25bp hike, or will the Eurozone policymakers continue sounding and acting as hawkish as possible to avoid any accident between now and success. ECB Chief Chhrstinte Lagarde insisted in her latest speech that she sees ‘no clear evidence’ that inflation has peaked.
For now, investors are ready for two more 25bp hikes into the end of summer.
What does it mean for the euro? Well, because another Fed rate hike – in July, and two other ECB hikes in the coming meetings are broadly priced in, the softer inflation data from the eurozone comes to support the ECB doves, and apply additional pressure on the EURUSD. But because the US dollar also stagnates near 3-month high levels, and because the dollar rally is also giving signs of exhaustion, the EURUSD could hold ground and not crumble below the 1.07 level.
More of central bank talk, the BoC is expected to keep rates steady at 4.5% when it meets today, while the RBA surprised investors with a 25bp hike yesterday, pointing at sticky inflation, but softer-than-expected Australian GDP data and shrinking Chinese exports came to halt gains in the AUDUSD into the 200-DMA.
Lira jitters
The Turkish lira is back to running from record low to record low. The dollar-lira is up by almost 15% since mid-May, and more importantly, it looks like the central bank’s efforts to fight a stronger dollar is either fading – after Erdogan’s victory in the latest elections – or keeping the lira steady is becoming more difficult and increasingly expensive for the Turks.
In all cases, we see a movement in the lira that we haven’t seen for a long time. Keep in mind that the lira has not been trading freely since the end of 2021.
Do you get back to selling the lira? The lira is still a black box, and no one knows what the government is really up to. But we know that there is effort, after the elections, to shift Turkey’s beyond-absurd monetary policy toward a more orthodox place – which requires higher interest rates, obviously.
As a result, Turkey appointed Mehmet Simsek as its new finance minister. Mr. Simsek is well-known and well-appreciated by the markets, and is now supposed to clean up the mess of the past year-and-a-half, and eventually restore investor confidence.
But restoring confidence won’t be a piece of cake of course. In past years, Turkey didn’t lack talneted finance ministers or smart central bankers. But each time sometime tried to do his/her job correctly – which in Turkey means raising the rates – he/she got rapidly sacked. Therefore, what investors want to see in Turkey is not how talented Mehmet Simsek is in finance, but how resistant he will be to the low-rate pressure from the presidential office.
Focus on Geopolitics
Market movers today
Geopolitical events are stealing the spotlight during an otherwise uneventful week. Ukraine's counter offensive seems to have finally started although it is being overshadowed by the destruction of the Kakhovka dam yesterday. Ukraine is accusing Russia for blowing up the dam, and the US intelligence hints to same direction, but Russia has not claimed responsibility. By late Tuesday evening, more than a thousand people had been evacuated and 40,000 people were estimated to be affected by the flooding. While Ukraine's spring offensive is their best opportunity to defeat Russia, the massive flooding of the Dnipro river will now complicate operations on both sides.
On data front, today brings Germany's industrial production and US trade balance data for April.
We also have a few ECB speeches scheduled just before the quiet period begins tomorrow.
The 60 second overview
EU: With the dry weather spell ongoing in Europe, we observe a risk for a stagflationary shock hitting the euro area. We observe that the water level in the key water pass way 'Kaub' in the Rhine is well below the past 10y mean level. Compared to last year's level it is +50cm higher at this point in time. Last year this was a driver of higher energy, notably higher natural gas prices, as this pathway is also used to transport coal to the power plants.
EUR/USD declined below the 1.07 mark yesterday on generally cautious market sentiment and relatively weak tier 2 releases from the euro area. German factory orders and euro area retail sales both declined more than expected, while the ECB found an across-the-board deterioration in its consumer expectations survey for April - the view on inflation, nominal income growth, nominal spending and house price growth all waned, while expectations for economic growth remained in negative territory. Overall, clear indications of weakening demand in the euro area.
China-US relations: Media reported that US secretary of state Anthony Blinken is eyeing a visit to China to meet Xi in the coming weeks.
Equities: Equities were softly higher yesterday in thin news flow. Cyclicals led the march higher, but the outperformance is no longer limited to FANMAG but also financials and real estate, especially regional banks. Small caps bounced back after the sell-off on Monday, with Russell 2000 surging +2.7% vs S&P 500 +0.2%. Futures are basically flat this morning.
FI: The ECB's CES initially took European yields lower across the maturity spectrum as inflation expectations declined in April. That said, longer dated issuance helped steepen the curve.
FX: AUD rallied further yesterday and Scandies sold off on a relatively quiet day on the G10 FX market where notably oil market lost momentum from OPEC+'s output cut announcement. EUR/USD remained anchored around the 1.07 level. EUR/SEK climbed towards last week's high and EUR/NOK rose close to the 11.90 level.
Credit: iTraxx Xover tightened 7.4bp and Main 1.3bp, with both indices closing at the tightest levels since prior to the SVB debacle. Primary market activity continued at a high pace and both OP Corporate Bank and DNB were in the market in preferred senior and Tier 2 format, respectively.
Technical Outlook and Review
DXY:
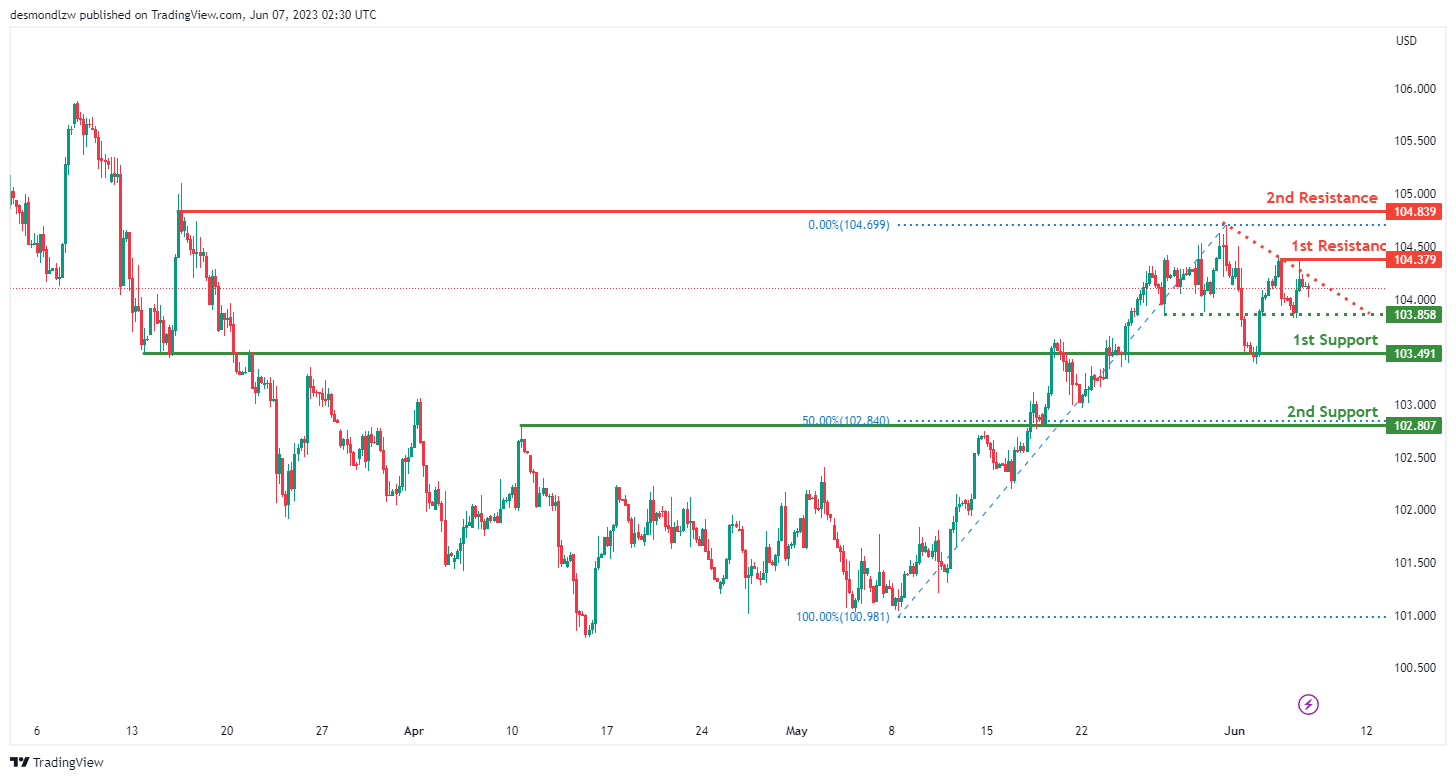
The DXY (Dollar Index) chart currently shows bearish momentum as the price is below a major descending trend line. This suggests a potential continuation of the bearish trend.
Considering this momentum, there is a possibility that the price could continue its bearish movement towards the first support level at 103.49. This level is identified as an overlap support.
The second support level at 102.80 is also an overlap support and aligns with the 50% Fibonacci retracement, further enhancing its significance.
On the other hand, the first resistance at 104.37 is recognized as a multi-swing high resistance, while the second resistance at 104.83 is identified as a swing high resistance.
EUR/USD:
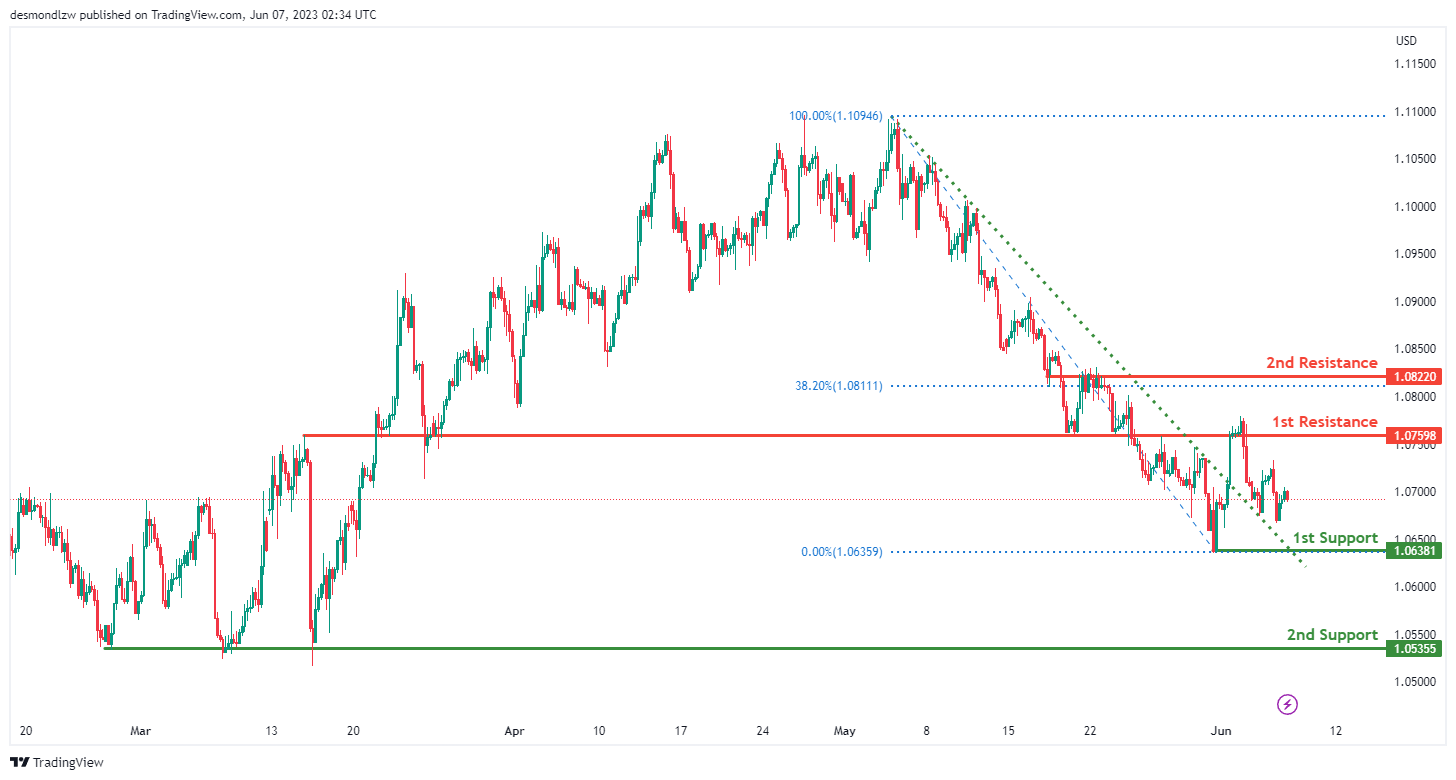
The EUR/USD chart currently shows bullish momentum as the price has broken above a descending resistance line, indicating a potential bullish move.
Considering this momentum, there is a possibility that the price could continue its bullish trend towards the first resistance level at 1.0759. This level is identified as a multi-swing high resistance.
The first support level at 1.0638 is recognized as an overlap support, while the second support level at 1.0535 is a multi-swing low support.
Additionally, the second resistance level at 1.0822 is an overlap resistance and coincides with the 38.20% Fibonacci retracement, further adding to its significance.
GBP/USD:
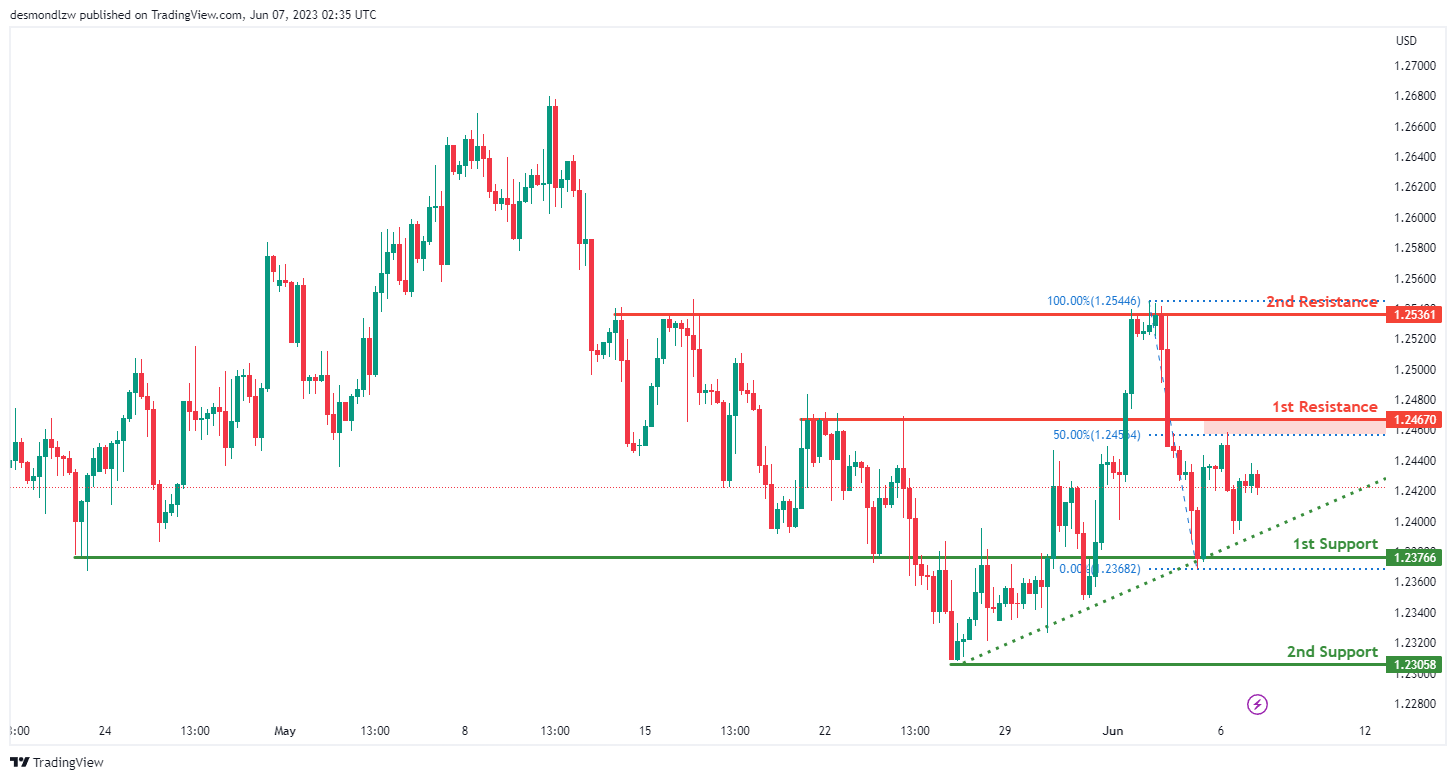
The GBP/USD chart currently demonstrates bullish momentum as the price is above a major ascending trend line, indicating the potential for further upward movement.
Considering this momentum, there is a possibility that the price could continue its bullish trend towards the first resistance level at 1.2467. This level is identified as an overlap resistance and is supported by the 50% Fibonacci retracement.
The first support level at 1.2376 is recognized as an overlap support, while the second support level at 1.2305 is a swing low support.
Additionally, the second resistance level at 1.2536 is a multi-swing high resistance.
USD/CHF:
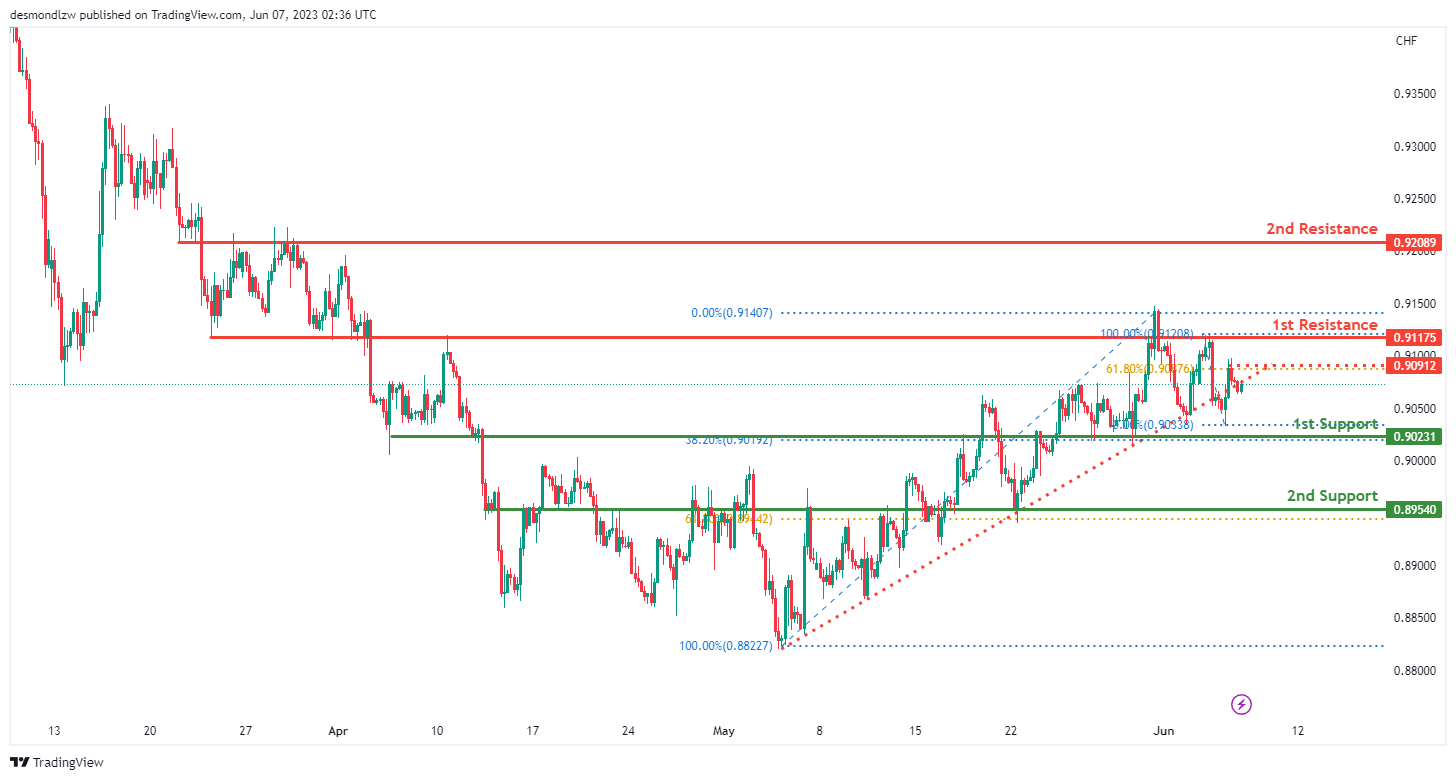
The USD/CHF chart currently exhibits bearish momentum as the price has broken below an ascending support line, indicating the potential for further downward movement.
Considering this bearish momentum, there is a possibility that the price could experience a bearish reaction from the first resistance level at 0.9117 and decline towards the first support level at 0.9023. The first support level is identified as an overlap support and also coincides with the 38.20% Fibonacci retracement. Additionally, the second support level at 0.8954 is an overlap support and aligns with the 61.80% Fibonacci retracement.
On the other hand, the first resistance level at 0.9117 and the second resistance level at 0.9208 are identified as overlap resistances.
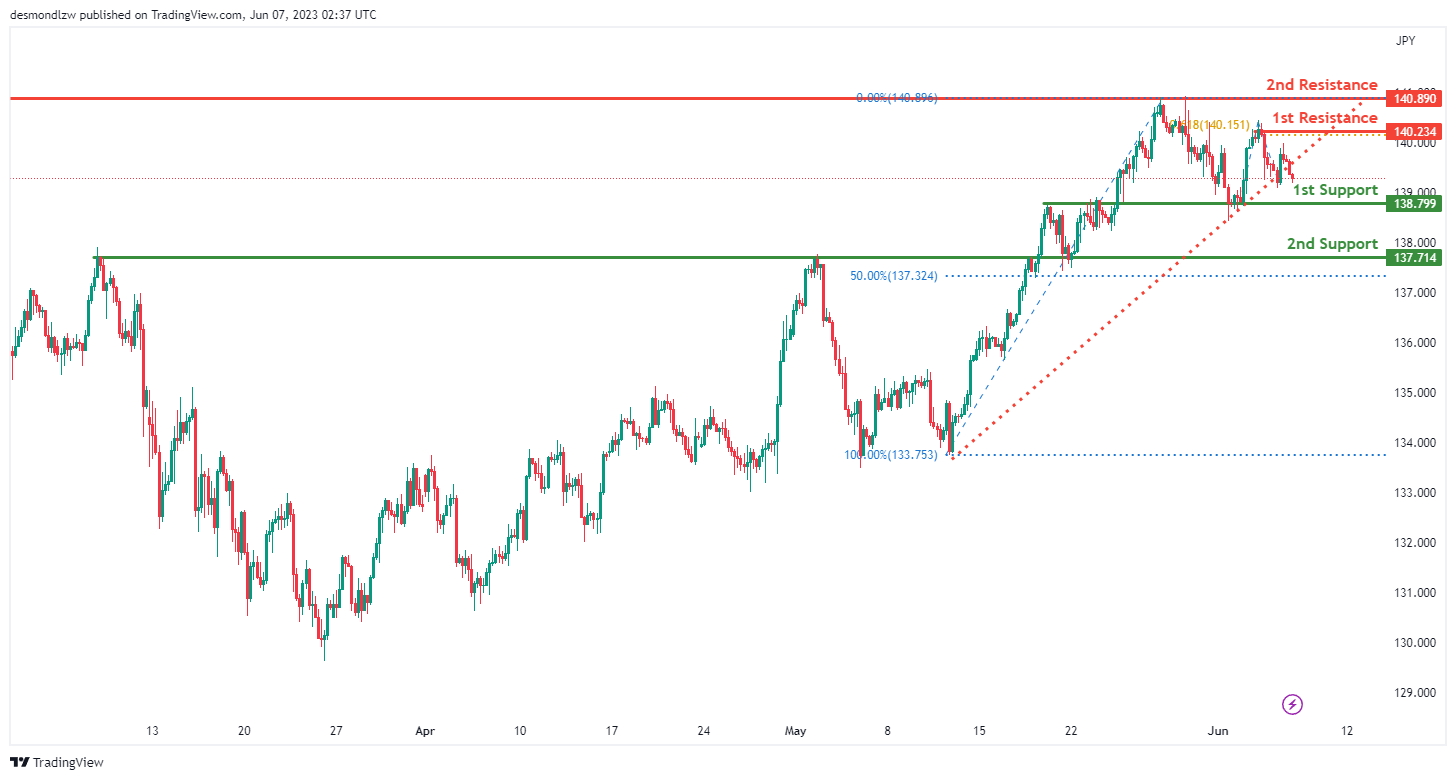
USD/JPY:
The USD/JPY chart currently exhibits bearish momentum as the price has broken below an ascending support line, suggesting the potential for further downward movement.
Considering this bearish momentum, there is a possibility that the price could continue its bearish trend towards the first support level at 138.79. This level is identified as an overlap support. Additionally, the second support level at 137.71 aligns with the 50% Fibonacci retracement, further reinforcing its significance as a potential support area.
On the other hand, the first resistance level at 140.23 and the second resistance level at 140.89 are identified as swing high and multi-swing high resistances, respectively.
USD/CAD:
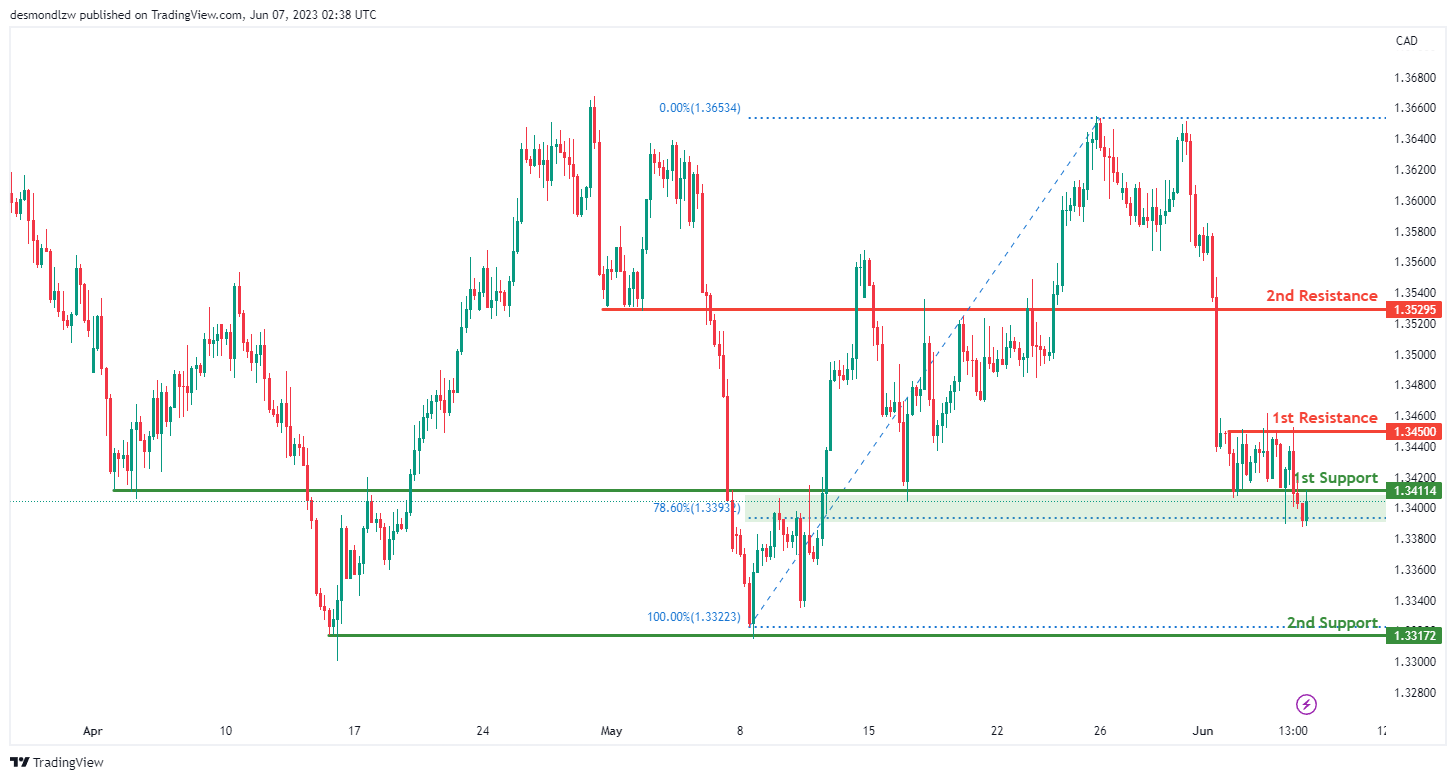
The USD/CAD chart currently exhibits bullish momentum, indicating a potential upward trend in the market.
Based on this bullish momentum, there is a possibility that the price could experience a bullish bounce off the first support level and move towards the first resistance level.
The first support level at 1.3411 is identified as an overlap support, while the second support level at 1.3317 is a multi-swing low support, both serving as potential areas where buyers might enter the market.
On the upside, the first resistance level at 1.3450 is identified as a multi-swing high resistance, and the second resistance level at 1.3529 is a pullback resistance, potentially posing challenges to further upward price movements.
AUD/USD:
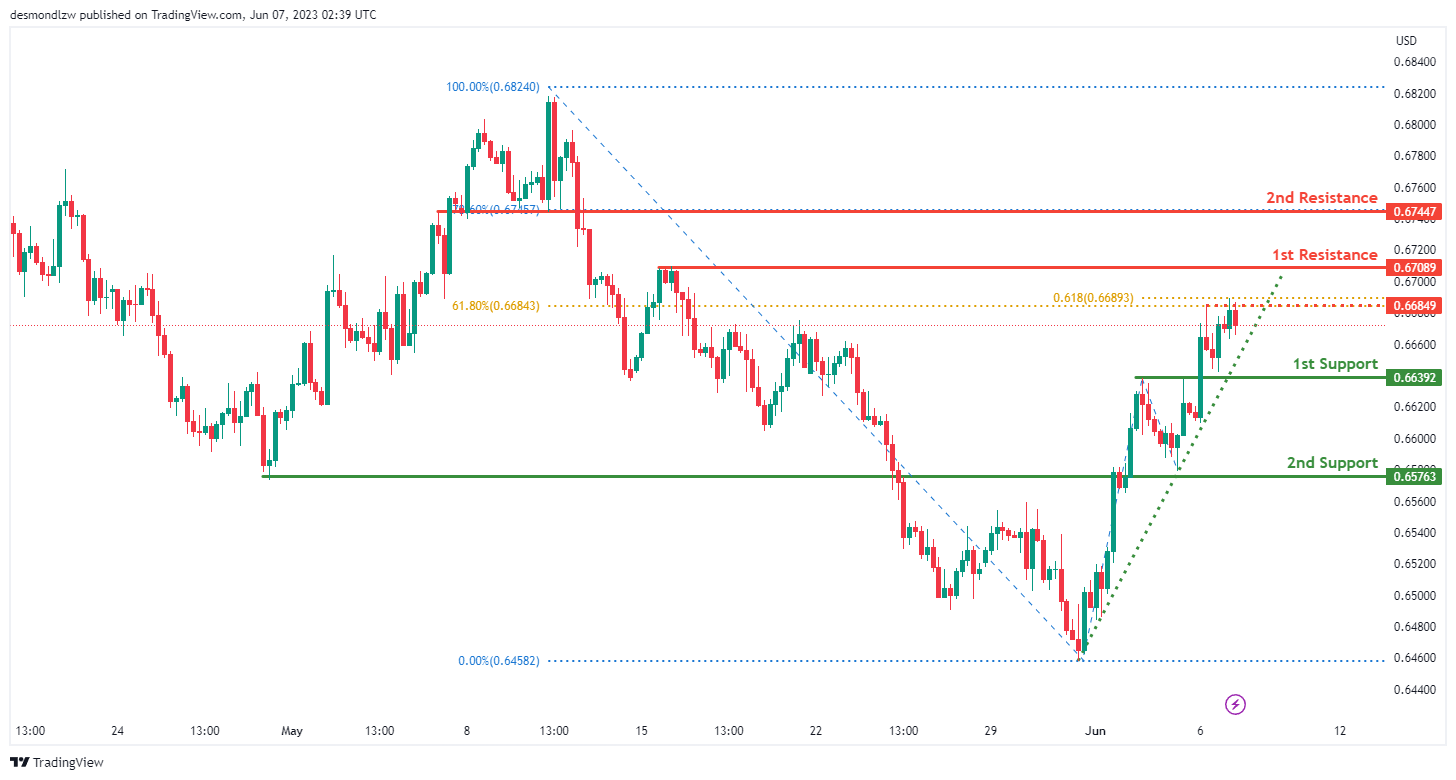
The AUD/USD chart currently demonstrates bullish momentum, indicating a potential upward trend in the market.
Contributing to this momentum is the fact that the price is above a major ascending trend line, suggesting the possibility of further bullish movements.
Considering this bullish context, there is a potential for a bullish continuation towards the first resistance level.
The first support level at 0.6639 is recognized as an overlap support, while the second support level at 0.6576 also serves as an overlap support, adding to their significance as potential areas where buyers might enter the market.
On the upside, the first resistance level at 0.6708 is identified as a multi-swing high resistance, while the second resistance level at 0.6744 is a pullback resistance, coinciding with the 78.60% Fibonacci retracement level. Additionally, the intermediate resistance at 0.6684 is a multi-swing high resistance, aligning with the 61.80% Fibonacci retracement and projection levels.
NZD/USD
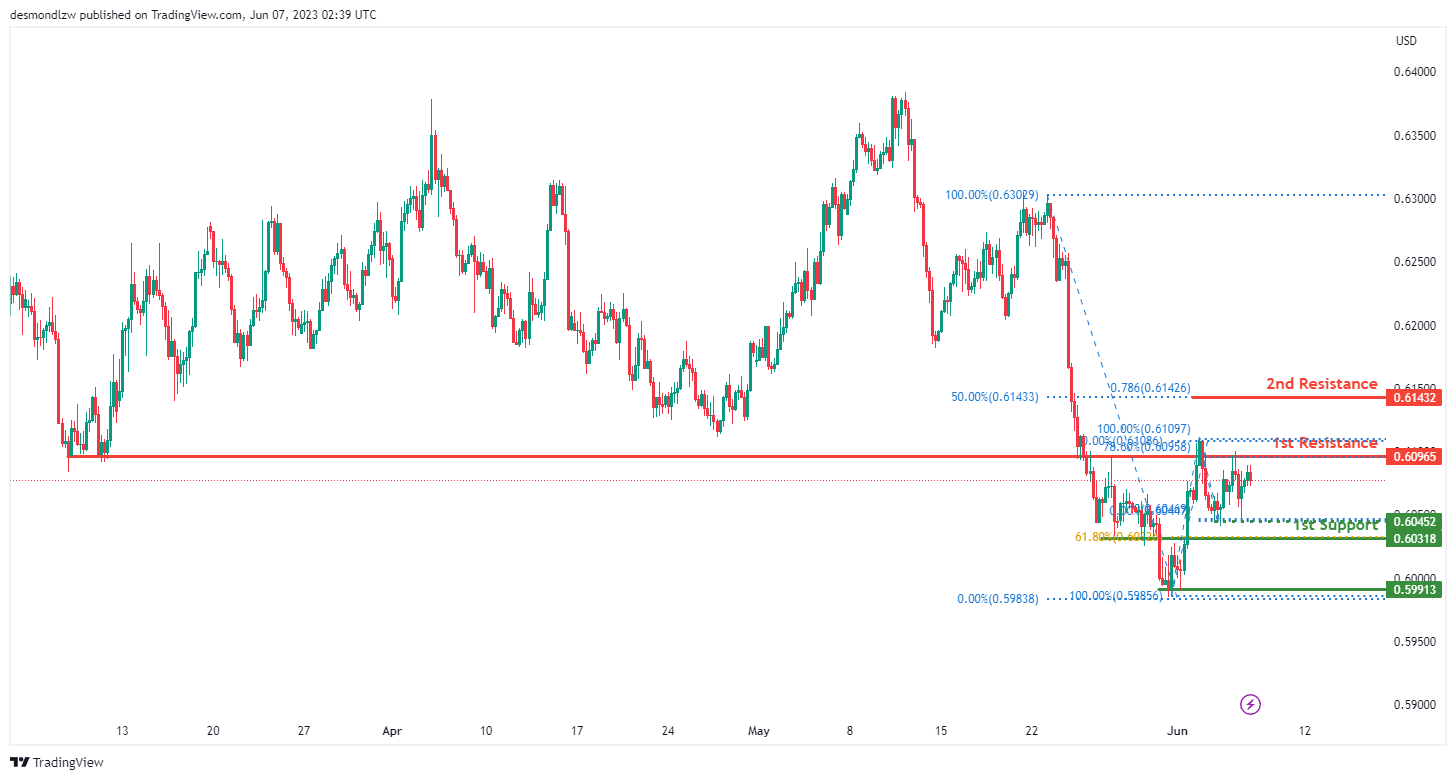
The NZD/USD chart currently shows bearish momentum, indicating a potential downward trend in the market.
Considering this bearish momentum, there is a possibility of a bearish continuation towards the first support level.
The first support at 0.6031 is identified as an overlap support, coinciding with the 61.80% Fibonacci retracement level. The second support at 0.5991 is recognized as a multi-swing low support, adding to its significance.
On the upside, the first resistance at 0.6096 is a multi-swing high resistance, while the second resistance at 0.6143 aligns with the 50% Fibonacci retracement and 78.60% Fibonacci projection levels.
Additionally, the intermediate support at 0.6045 serves as a multi-swing low support.
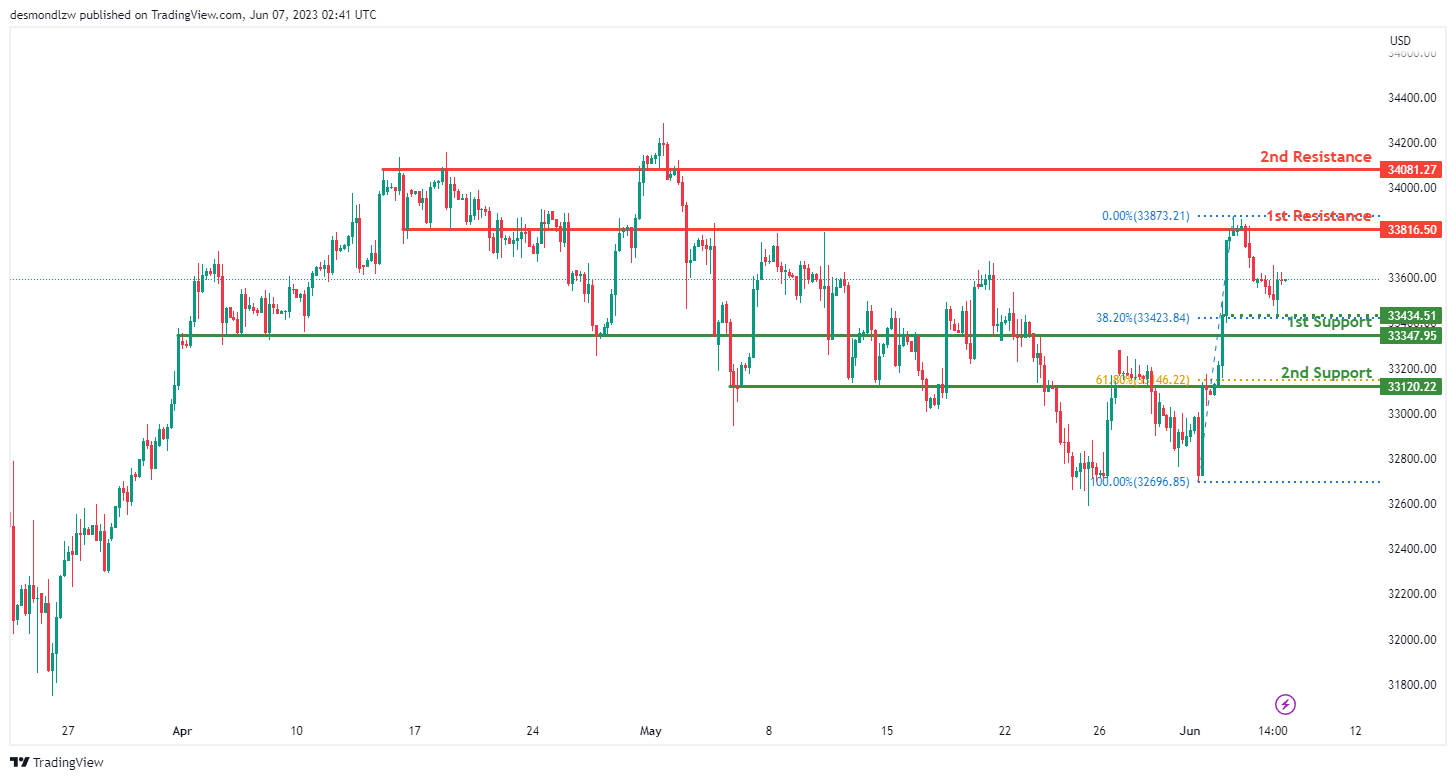
DJ30:
The DJ30 (Dow Jones Industrial Average) chart currently exhibits bullish momentum, indicating a potential upward trend in the market.
Considering this bullish momentum, there is a possibility of a bullish continuation towards the first resistance level.
The first support at 33,347.95 is identified as pullback support, while the second support at 33,120.22 is recognized as an overlap support, coinciding with the 61.80% Fibonacci retracement level.
On the upside, the first resistance at 33,816.50 is an overlap resistance, and the second resistance at 34,081.22 is identified as pullback resistance.
Additionally, the intermediate support at 33,434.51 serves as swing low support.
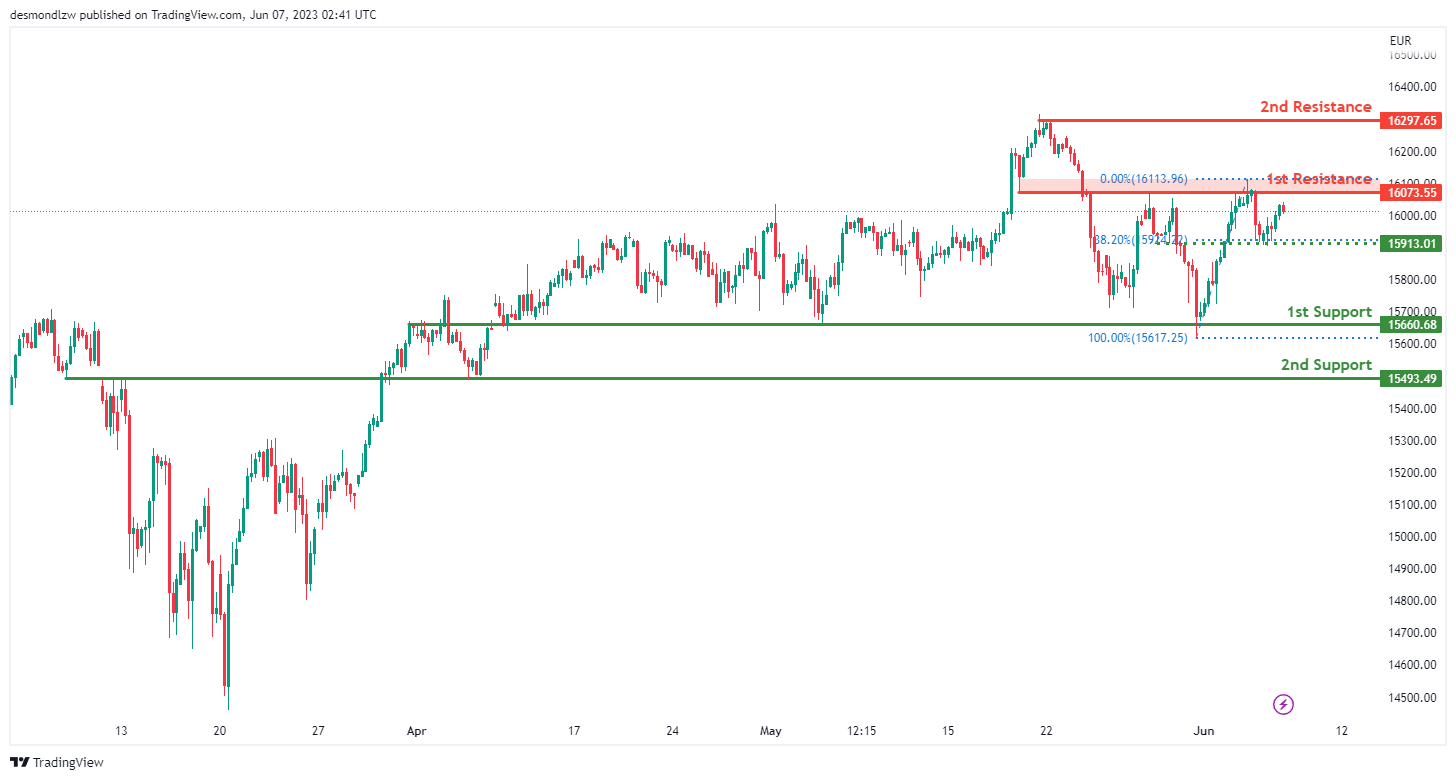
GER30:
The GER30 (DAX) chart currently exhibits a weak bullish momentum with low confidence, suggesting a potential upward trend in the market, although with some uncertainty.
Considering this weak bullish momentum, there is a possibility of a bullish continuation towards the first resistance level.
The first support at 15,660.68 is identified as pullback support, while the second support at 15,493.49 is recognized as an overlap support.
On the upside, the first resistance at 16,023.55 is an overlap resistance, and the second resistance at 16,297.65 is identified as swing high resistance.
Additionally, the intermediate support at 15,913.01 serves as an overlap support and aligns with the 38.20% Fibonacci retracement level.
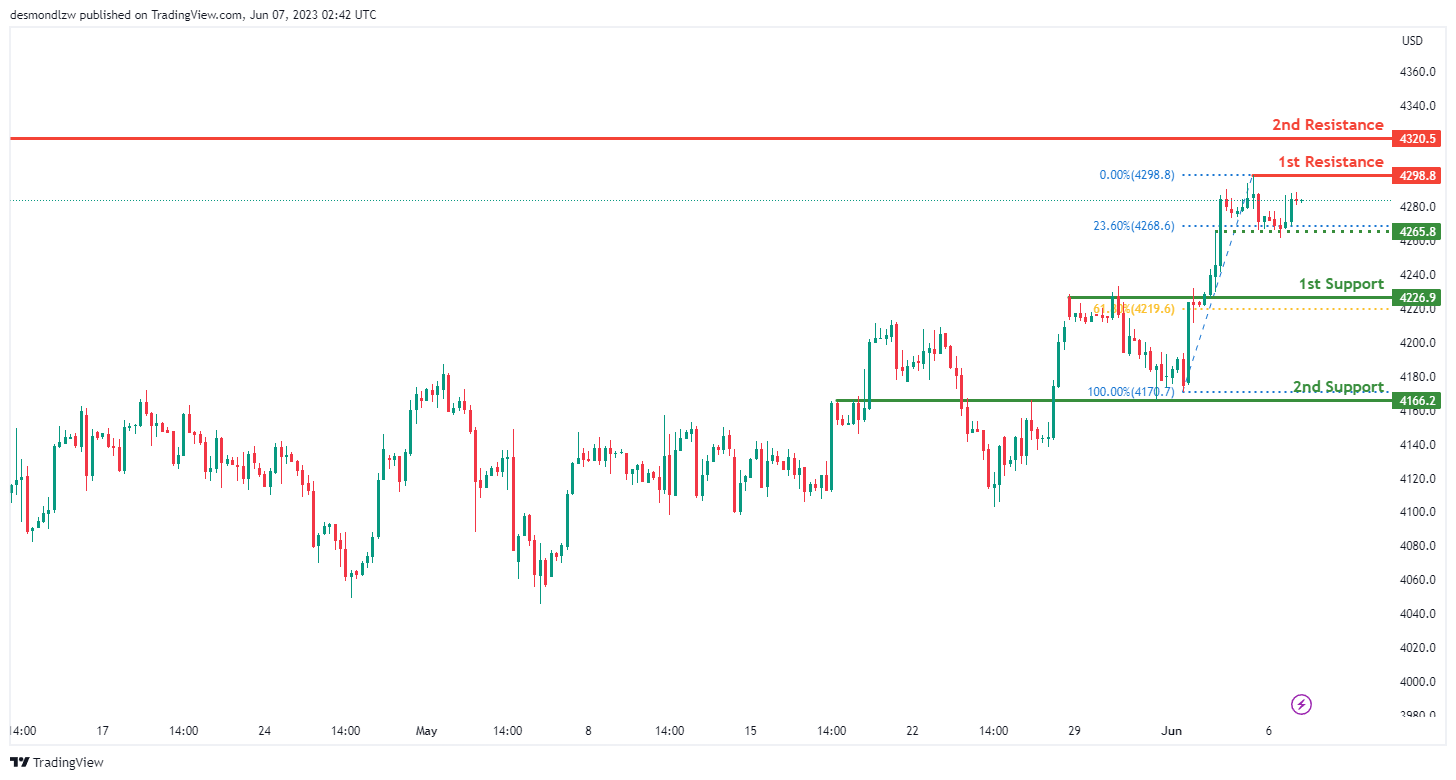
US500
The US500 (S&P 500) chart currently exhibits a weak bullish momentum with low confidence, suggesting a potential upward trend in the market, although with some uncertainty.
Considering this weak bullish momentum, there is a possibility of a bullish continuation towards the first resistance level.
The first support at 4,226.9 is identified as pullback support, and the second support at 4,166.2 is recognized as an overlap support.
On the upside, the first resistance at 4,298.8 is a swing high resistance, and the second resistance at 4,320.5 is also identified as a swing high resistance.
Additionally, the intermediate support at 4,265.8 serves as an overlap support and aligns with the 23.60% Fibonacci retracement level.
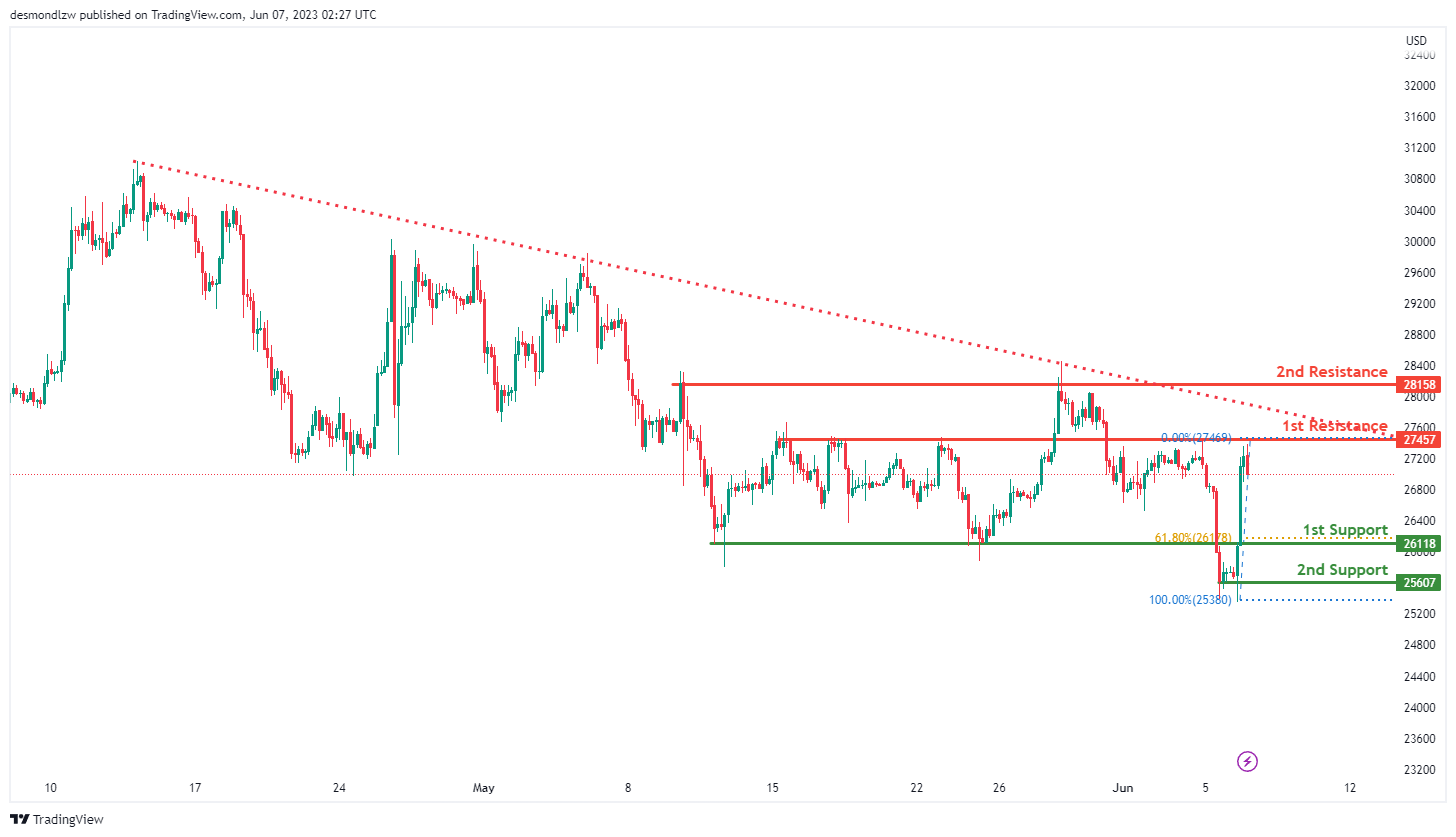
BTC/USD:
The BTC/USD chart currently indicates a bearish momentum, with the price below a significant descending trend line, suggesting a continuation of the bearish trend.
Considering this bearish momentum, there is potential for the price to continue its downward movement towards the first support level at 26118.0. This level is identified as a pullback support, where buyers may show increased interest in entering the market.
Furthermore, the second support level at 25607.0 is recognized as a multi-swing low support, adding to its significance as a potential price level where buyers may provide support.
On the other hand, the first resistance level at 27457.0 is identified as an overlap resistance, potentially acting as a barrier to upward price movements.
Additionally, the second resistance level at 28158.0 is noted as a multi-swing high resistance, suggesting a level where selling pressure has historically been observed.
ETH/USD:
The ETH/USD chart currently shows a bearish momentum, indicating a downward trend in the market.
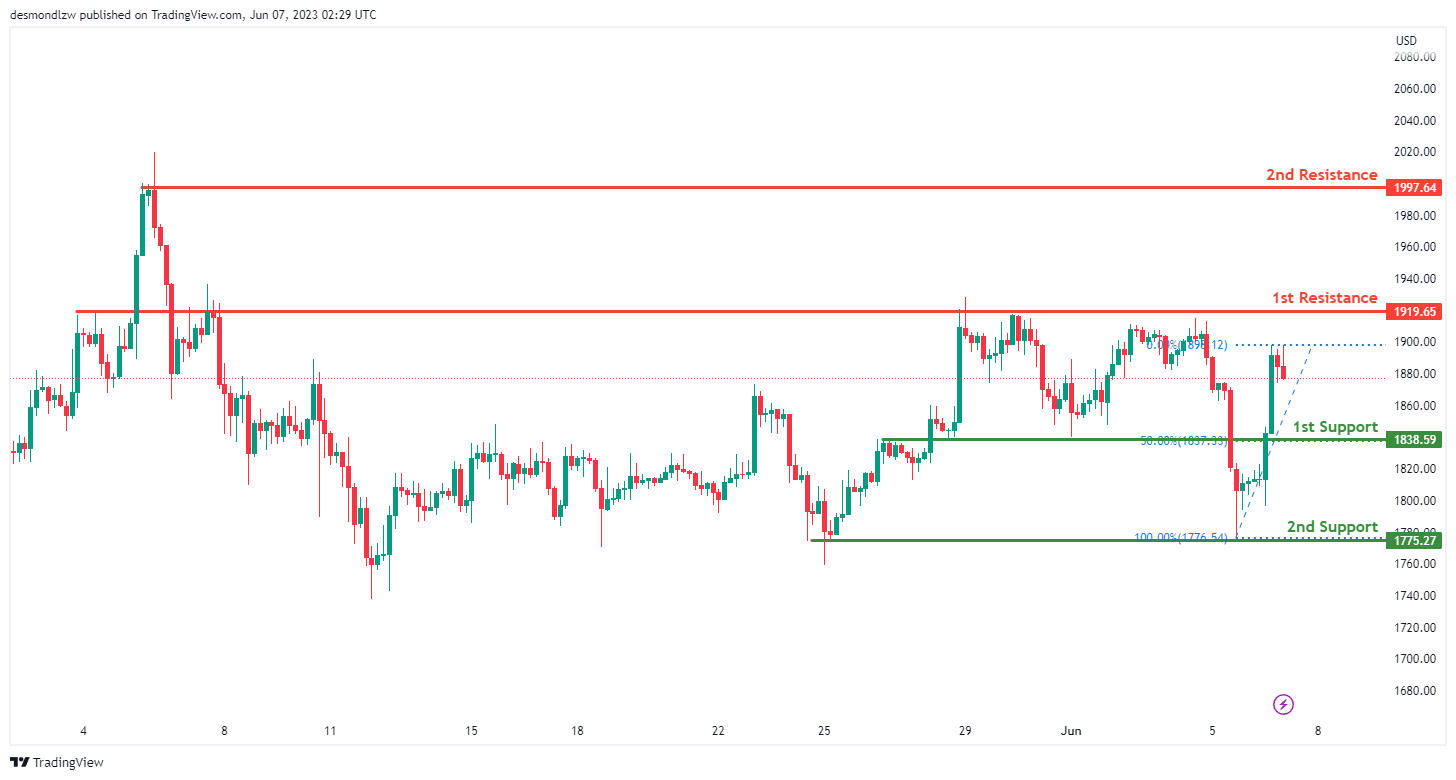
Based on this bearish momentum, there is potential for a continuation of the bearish movement towards the first support level at 1838.59. This level is considered a significant area of pullback support, where buyers may show increased interest in entering the market.
Additionally, the second support level at 1775.27 is recognized as a multi-swing low support, further reinforcing its importance as a potential price level where buyers could potentially enter.
On the other hand, the first resistance level at 1919.65 is identified as an overlap resistance, suggesting it may act as a barrier to upward price movements.
Furthermore, the second resistance level at 1997.65 is noted as a swing high resistance, indicating a level where selling pressure has historically been observed.
WTI/USD:
The WTI (West Texas Intermediate) chart currently shows a bullish momentum, indicating an upward trend in the market.
In this bullish context, there is a potential for the price to continue its upward movement towards the first resistance level.
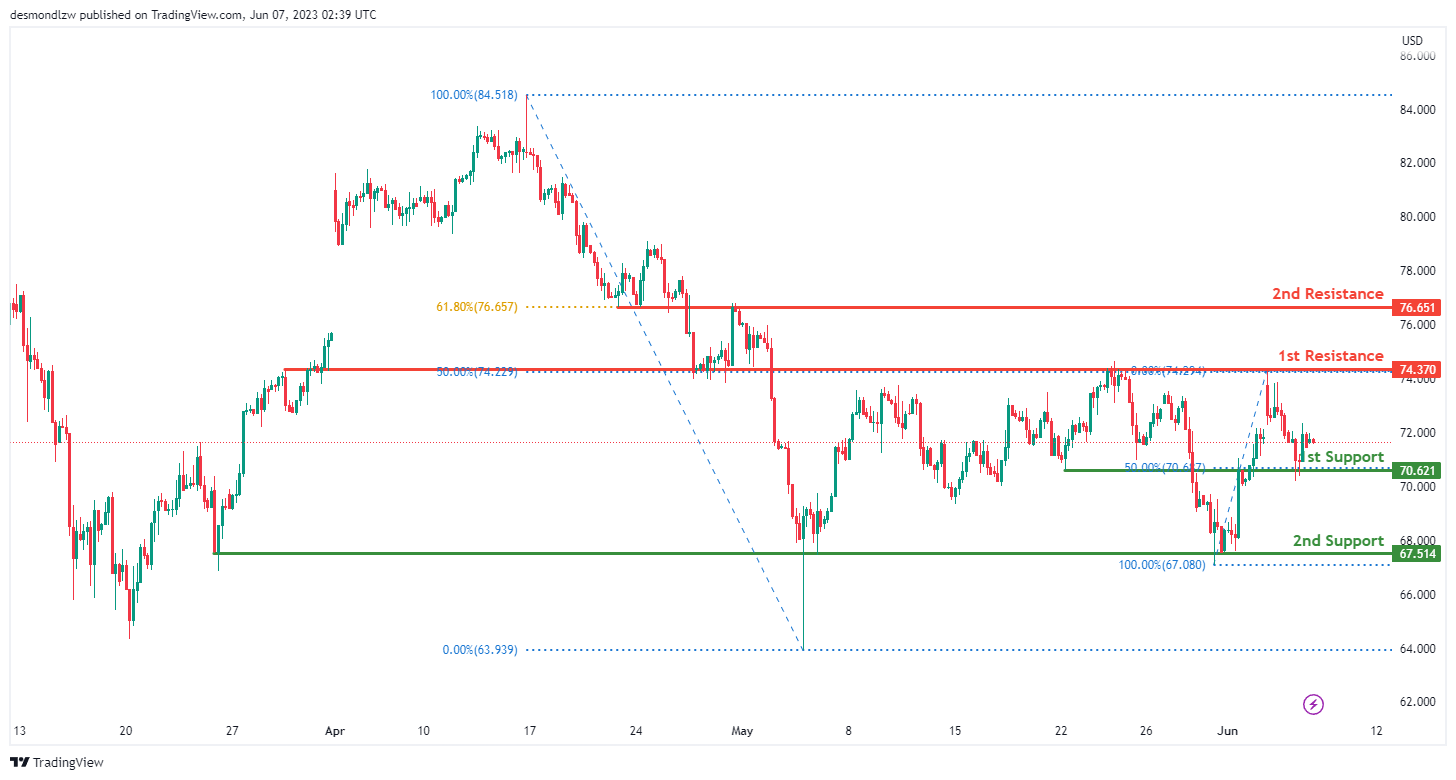
The first support level at 70.62 is identified as an overlap support and coincides with the 50% Fibonacci retracement level, adding to its significance as a potential area where buyers may provide support.
Furthermore, the second support level at 67.51 is recognized as a multi-swing low support, further reinforcing its importance as a potential price level where buyers may step in.
On the upside, the first resistance level at 74.37 is identified as an overlap resistance, potentially acting as a barrier to further upward price movements.
Additionally, the second resistance level at 70.65 is noted as a swing high resistance, aligning with the 61.80% Fibonacci retracement level, making it another notable level to monitor.
XAU/USD (GOLD):
The XAU/USD (Gold/US Dollar) chart currently demonstrates a bullish momentum, indicating an upward trend in the market.
Considering this bullish momentum, there is a potential for the price to continue its upward movement towards the first resistance level.
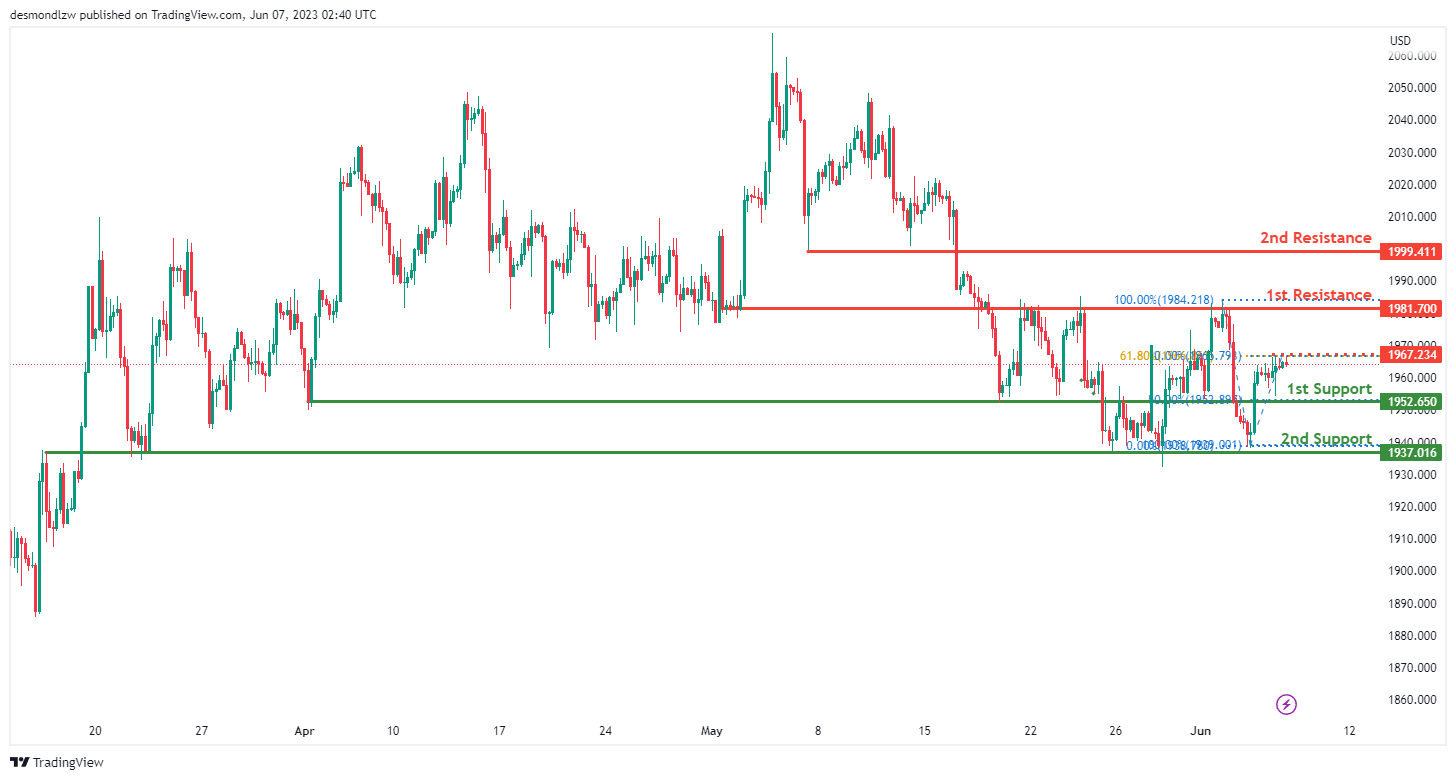
The first support level at 1952.65 is identified as an overlap support, serving as a potential area where buyers may provide support.
Furthermore, the second support level at 1937.01 is recognized as a multi-swing low support, reinforcing its significance as a potential price level where buyers may step in.
On the upside, the first resistance level at 1981.70 is identified as an overlap resistance, potentially acting as a barrier to further upward price movements.
Additionally, the second resistance level at 1999.41 is noted as a pullback resistance, indicating potential selling pressure at this level.
An intermediate resistance level at 1967.23 is also identified as a multi-swing high resistance, aligning with the 61.80% Fibonacci retracement level, further adding to its importance.
AUD/USD Daily Report
Daily Pivots: (S1) 0.6626; (P) 0.6656; (R1) 0.6701; More...
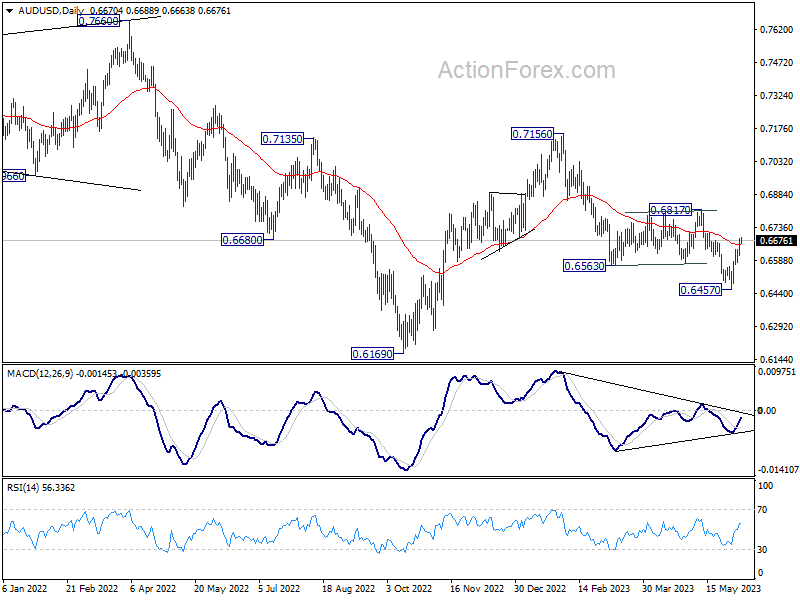
AUD/USD's rise from 0.6457 is still in progress and intraday bias stays on the upside for 0.6817 key structural resistance. On the downside, though, break of 0.6578 minor support will retain near term bearishness, and turn bias back to the downside for retesting 0.6457 low instead.
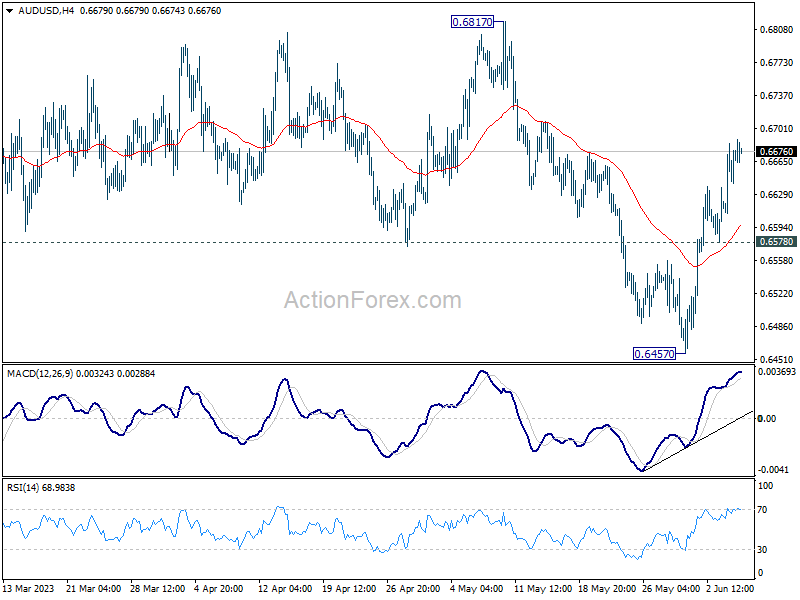
In the bigger picture, rejection by 55 W EMA (now at 0.6811) keeps medium term outlook bearish. Current development suggests that down trend from 0.8006 (2021 high) is possibly still in progress. Retest of 0.6169 (2022 low) should be seen next. Firm break there will confirm down trend resumption. For now, this will remain the favored case as long as 0.6817 resistance holds.
Aussie Holds Strong Despite Poor China Trade Data, Loonie Awaits BoC
Australian Dollar is staying generally firm in Asian session today, as supported by hawkish comments from RBA Governor Philip Lowe. More tightening could still be underway after yesterday's surprised rate hike. Aussie basically shrugged off Weaker than expected Q1 GDP growth. Meanwhile, market reactions to the poor set of trade data from China was surprisingly indifferent.
The forex markets are generally quiet though, with most major pairs and crosses stuck inside yesterday's range. Canadian Dollar softens slightly as focus turns to BoC rate decision. There is room for an hawkish twist even if there is no surprised rate hike, which could give the Loonie a lift. Dollar, Euro are the weaker ones for now while Yen is trying to resume its near term recovery.
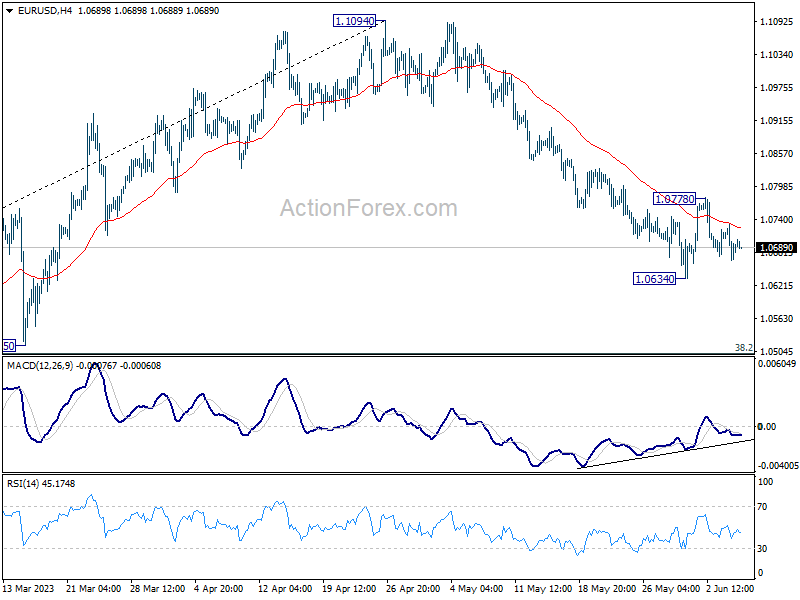
Technically, the main focus continues to be on the overdue breakout of Dollar from its narrow range against European majors and Yen. A few critical thresholds are under the spotlight and could catalyze significant market moves. Key levels to watch include 1.0634 support in EUR/USD, 1.2306 support in GBP/USD, 0.9146 resistance in USD/CHF, and 140.90 resistance in USD/JPY. Firm break of any of these levels could ring the bell for Dollar's resurgence.
In Asia, at the time of writing, Nikkei is down -1.00%. Hong Kong HSI is up 0.97%. China Shanghai SSE is up 0.02%. Singapore Strait Times is down -0.33%. Japan 10-year JGB yield is down -0.0054 at 0.418. Overnight, DOW rose 0.03%. S&P 500 rose 0.24%. NASDAQ rose 0.36%. 10-year yield rose 0.006 to 3.699.
RBA Lowe: Some further tightening of monetary policy may be required
In a speech, RBA Governor Philip Lowe revealed further insight into the central bank's decision-making process and concerns regarding inflation. Lowe underscored RBA's decision to raise interest rates once more yesterday as an effort to confidently bring inflation back to target within a reasonable timeframe.
Governor Lowe said, "Yesterday's decision to increase interest rates again was taken to provide greater confidence that inflation will return to target within a reasonable timeframe."
He attributed this decision to a recent influx of data, suggesting "greater upside risks" to the Bank's inflation outlook. Persistent inflation in services prices, both domestically and abroad, combined with recent data on inflation, wages, and housing prices outpacing forecasts, were contributing factors.
The Governor noted, "Given this shift in risks and the already fairly drawn-out return of inflation to target, the Board judged that a further increase in interest rates was warranted."
However, he also highlighted various factors the Board will monitor closely in the coming months, including developments in the global economy, domestic household spending, the growth rate in unit labour costs, and inflation expectations.
While acknowledging that the RBA remains on a narrow path, Lowe pointed out "significant risks", particularly the possibility that "inflation stays too high for too long".
He concluded, "Some further tightening of monetary policy may be required, but that will depend upon how the economy and inflation evolve. The Board will continue to pay close attention to developments in the global economy, trends in household spending, and the outlook for inflation and the labour market."
Australia's Q1 GDP grew only 0.2% qoq, domestic price growth decelerated
Australia's GDP expanded by 0.2% qoq in Q1, missing expectations of 0.3% qoq growth. This marked the slowest rate of growth since the September 2021 quarter.
Head of National Accounts at the Australian Bureau of Statistics, Katherine Keenan, remarked on this development. "This is the sixth straight rise in quarterly GDP but the slowest growth since the COVID-19 Delta lockdowns in September quarter 2021," she said.
The GDP implicit price deflator, a measure of price changes, climbed by 1.9% in the quarter and by 6.8% from March 2022. A significant contributor to this increase was rise in terms of trade by 2.8%, led by steeper decline in import prices (-4.0%) than export prices (-1.4%).
Fall in import prices, the largest since December 2010, was propelled by global drop in oil prices and appreciation of Australian dollar. Meanwhile, a decrease in export prices was led by rural and mining commodities.
Domestic price growth decelerated to 1.1% as goods inflation eased. This is a downturn from the 1.4% increase observed in the December 2022 quarter.
China's exported fell -7.5% yoy in May, trade surplus shrank to USD 65.8B
In May, China's exports significantly contracted, defying expectations. The country's exports shrunk by -7.5% yoy to USD 283.5B, which was far below expectation of -0.4% yoy contraction. This marks the second-lowest export value since May 2022, with the only lower figure being the seasonally affected USD 213.8B recorded in February. Imports also contracted by -4.5% yoy to USD 217.7B, outperforming the forecasted 8.0% yoy contraction.
However, the most striking observation comes in the form of China's trade surplus. It fell sharply from USD 90.2B to USD 65.8B, defying the predicted figure of USD 94.2B. This represents the lowest level since the COVID-driven decline observed in April 2022.
BoC in focus, a coin flip for hold or hike?
As BoC meets today, many observers anticipate the bank will maintain its pause, leaving interest rates untouched at 4.50%. However, recent economic developments have injected a dose of doubt into the mix. Market speculation reveals that there is approximately a 45% probability of a 25-basis point adjustment, making this rate decision look more like a coin toss.
The prevailing viewpoint among economists is that BoC might defer any rate changes until its July meeting. Two crucial reasons fortify this standpoint. First, the July assembly aligns with the release of a fresh batch of economic projections, offering BoC ground to justify any rate recalibrations. Second, the subsequent press conference would grant Governor Tiff Macklem the opportunity to explain their decision to a watchful audience.
However, if the central bank is indeed leaning towards a rate adjustment in July, then today's announcement might carry a hint of hawkishness. If so, this shift could be a strategic move to prepare the markets for potential changes ahead, and give Canadian Dollar a lift.
Some previews on BoC:
- Will the BoC Resume Interest Rate Hikes?
- Forward Guidance: Canada May be in for Another Rate Hike—But July More Likely than June
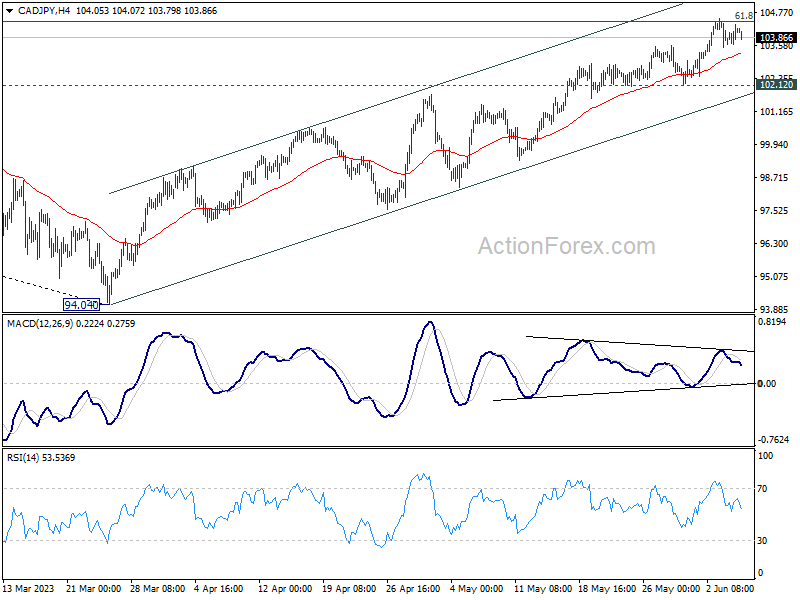
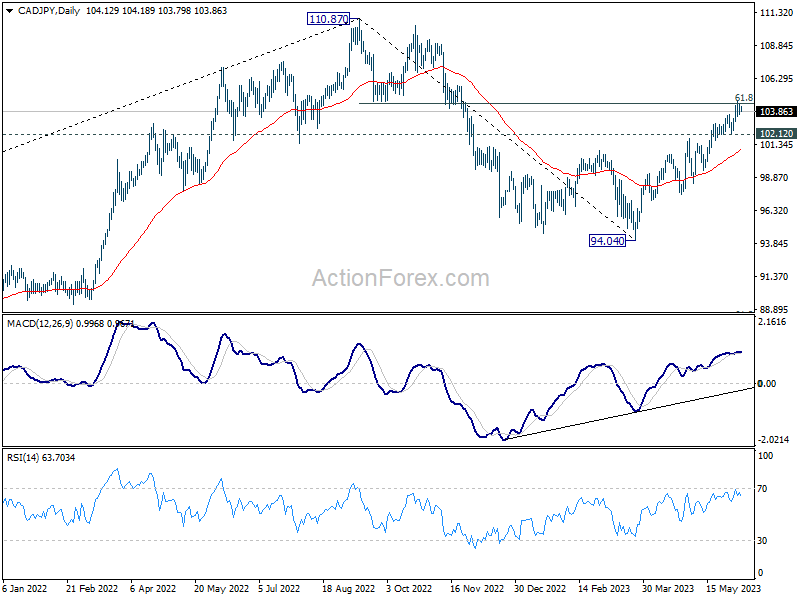
CAD/JPY has been losing upside momentum as seen in 4H MACD, even though the rally from 94.04 extended. Such rise is seen as the second leg of the corrective pattern from 110.87. It's now pressing an important fibonacci resistance of 61.8% retracement of 110.87 to 94.04 at 104.44.
Decisive break of 104.44, as prompted by hawkish BoC, could trigger upside re-acceleration to retest 110.87 high. But for now, firm break there is not expected yet.
On the other hand, break of 102.12 support will indicate rejection by 104.44. More importantly, the pattern from 110.87 might have then started the third leg. Sustained trading below 55 D EMA (now at 100.88) would bring deeper fall back towards 94.04.
Elsewhere
Swiss unemployment rate and foreign currency reserves, Germany industrial production, France trade balance, and Italy retail sales will be released in European session. Later in the day, both US and Canada will publish trade balance.
AUD/USD Daily Report
Daily Pivots: (S1) 0.6626; (P) 0.6656; (R1) 0.6701; More...
AUD/USD's rise from 0.6457 is still in progress and intraday bias stays on the upside for 0.6817 key structural resistance. On the downside, though, break of 0.6578 minor support will retain near term bearishness, and turn bias back to the downside for retesting 0.6457 low instead.
In the bigger picture, rejection by 55 W EMA (now at 0.6811) keeps medium term outlook bearish. Current development suggests that down trend from 0.8006 (2021 high) is possibly still in progress. Retest of 0.6169 (2022 low) should be seen next. Firm break there will confirm down trend resumption. For now, this will remain the favored case as long as 0.6817 resistance holds.
Economic Indicators Update
| GMT | Ccy | Events | Actual | Forecast | Previous | Revised |
|---|---|---|---|---|---|---|
| 01:30 | AUD | GDP Q/Q Q1 | 0.20% | 0.30% | 0.50% | 0.60% |
| 03:00 | CNY | Trade Balance (USD) May | 65.8B | 94.2B | 90.2B | |
| 05:00 | JPY | Leading Economic Index Apr P | 97.6% | 98.30% | 97.50% | 97.7% |
| 05:45 | CHF | Unemployment Rate M/M May | 1.90% | 1.90% | ||
| 06:00 | EUR | Germany Industrial Production M/M Apr | 0.80% | -3.40% | ||
| 06:45 | EUR | France Trade Balance (EUR) Apr | -7.7B | -8.0B | ||
| 07:00 | CHF | Foreign Currency Reserves (CHF) May | 732B | |||
| 08:00 | EUR | Italy Retail Sales M/M Apr | 0.40% | 0.00% | ||
| 12:30 | USD | Trade Balance (USD) Apr | -75.3B | -64.2B | ||
| 12:30 | CAD | Labor Productivity Q/Q Q1 | 0.00% | -0.50% | ||
| 12:30 | CAD | Trade Balance (CAD) Apr | 0.1B | 1.0B | ||
| 14:00 | CAD | BoC Interest Rate Decision | 4.50% | 4.50% | ||
| 14:30 | USD | Crude Oil Inventories | 1.2M | 4.5M |
BoC in focus, a coin flip for hold or hike?
As BoC meets today, many observers anticipate the bank will maintain its pause, leaving interest rates untouched at 4.50%. However, recent economic developments have injected a dose of doubt into the mix. Market speculation reveals that there is approximately a 45% probability of a 25-basis point adjustment, making this rate decision look more like a coin toss.
The prevailing viewpoint among economists is that BoC might defer any rate changes until its July meeting. Two crucial reasons fortify this standpoint. First, the July assembly aligns with the release of a fresh batch of economic projections, offering BoC ground to justify any rate recalibrations. Second, the subsequent press conference would grant Governor Tiff Macklem the opportunity to explain their decision to a watchful audience.
However, if the central bank is indeed leaning towards a rate adjustment in July, then today's announcement might carry a hint of hawkishness. If so, this shift could be a strategic move to prepare the markets for potential changes ahead, and give Canadian Dollar a lift.
Some previews on BoC:
- Will the BoC Resume Interest Rate Hikes?
- Forward Guidance: Canada May be in for Another Rate Hike—But July More Likely than June
CAD/JPY has been losing upside momentum as seen in 4H MACD, even though the rally from 94.04 extended. Such rise is seen as the second leg of the corrective pattern from 110.87. It's now pressing an important fibonacci resistance of 61.8% retracement of 110.87 to 94.04 at 104.44.
Decisive break of 104.44, as prompted by hawkish BoC, could trigger upside re-acceleration to retest 110.87 high. But for now, firm break there is not expected yet.
On the other hand, break of 102.12 support will indicate rejection by 104.44. More importantly, the pattern from 110.87 might have then started the third leg. Sustained trading below 55 D EMA (now at 100.88) would bring deeper fall back towards 94.04.
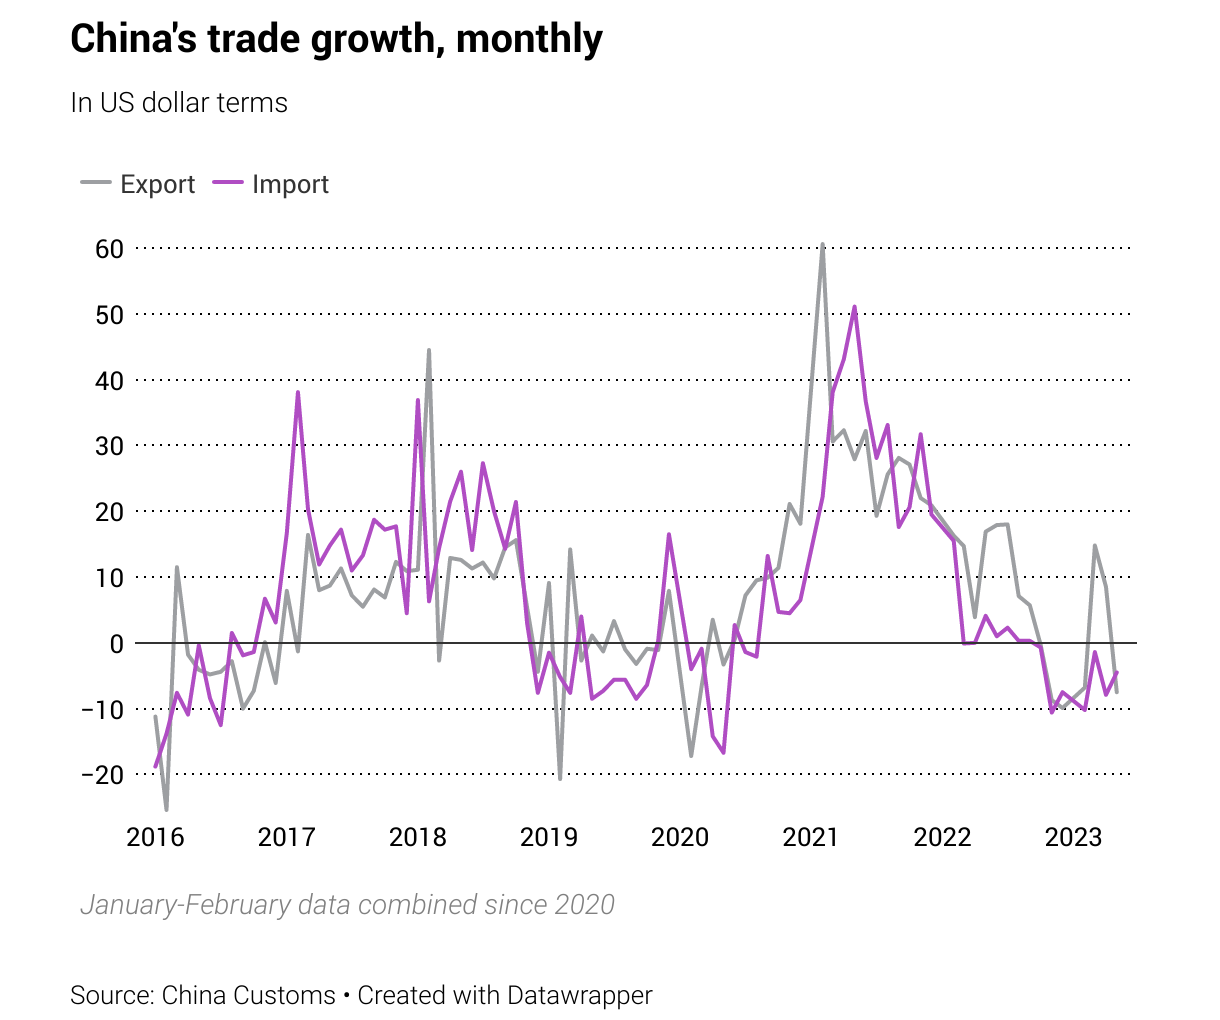
China’s exported fell -7.5% yoy in May, trade surplus shrank to USD 65.8B
In May, China's exports significantly contracted, defying expectations. The country's exports shrunk by -7.5% yoy to USD 283.5B, which was far below expectation of -0.4% yoy contraction. This marks the second-lowest export value since May 2022, with the only lower figure being the seasonally affected USD 213.8B recorded in February. Imports also contracted by -4.5% yoy to USD 217.7B, outperforming the forecasted 8.0% yoy contraction.
However, the most striking observation comes in the form of China's trade surplus. It fell sharply from USD 90.2B to USD 65.8B, defying the predicted figure of USD 94.2B. This represents the lowest level since the COVID-driven decline observed in April 2022.
Australia’s Q1 GDP grew only 0.2% qoq, domestic price growth decelerated
Australia's GDP expanded by 0.2% qoq in Q1, missing expectations of 0.3% qoq growth. This marked the slowest rate of growth since the September 2021 quarter.
Head of National Accounts at the Australian Bureau of Statistics, Katherine Keenan, remarked on this development. "This is the sixth straight rise in quarterly GDP but the slowest growth since the COVID-19 Delta lockdowns in September quarter 2021," she said.
The GDP implicit price deflator, a measure of price changes, climbed by 1.9% in the quarter and by 6.8% from March 2022. A significant contributor to this increase was rise in terms of trade by 2.8%, led by steeper decline in import prices (-4.0%) than export prices (-1.4%).
Fall in import prices, the largest since December 2010, was propelled by global drop in oil prices and appreciation of Australian dollar. Meanwhile, a decrease in export prices was led by rural and mining commodities.
Domestic price growth decelerated to 1.1% as goods inflation eased. This is a downturn from the 1.4% increase observed in the December 2022 quarter.