Sample Category Title
GBP/USD Mid-Day Outlook
Daily Pivots: (S1) 1.2391; (P) 1.2425; (R1) 1.2458; More...
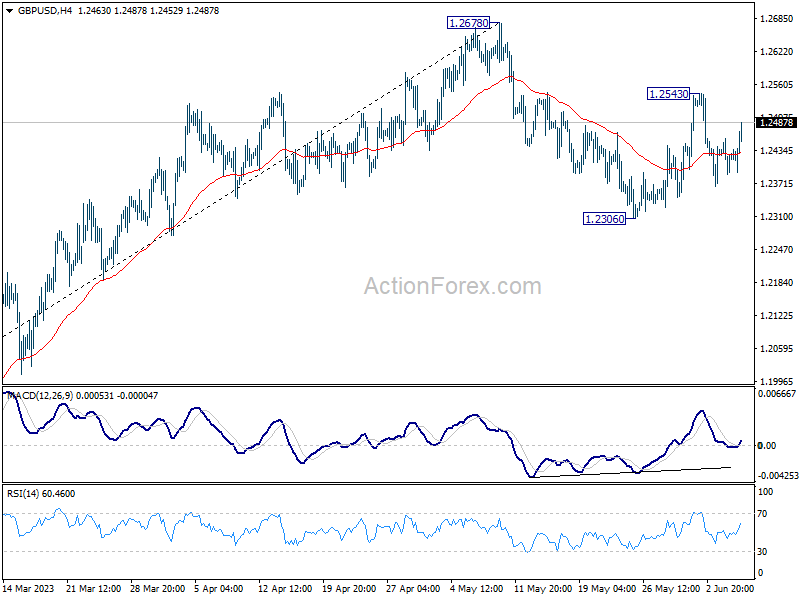
In the bigger picture, as long as 1.1801 support holds, rise from 1.0351 medium term bottom (2022 low) is expected to extend further. Sustained break of 61.8% retracement of 1.4248 (2021 high) to 1.0351 at 1.2759 will add to the case of long term bullish trend reversal. However, firm break of 1.1801 will indicate rejection by 1.2759, and bring deeper decline, even as a correction.
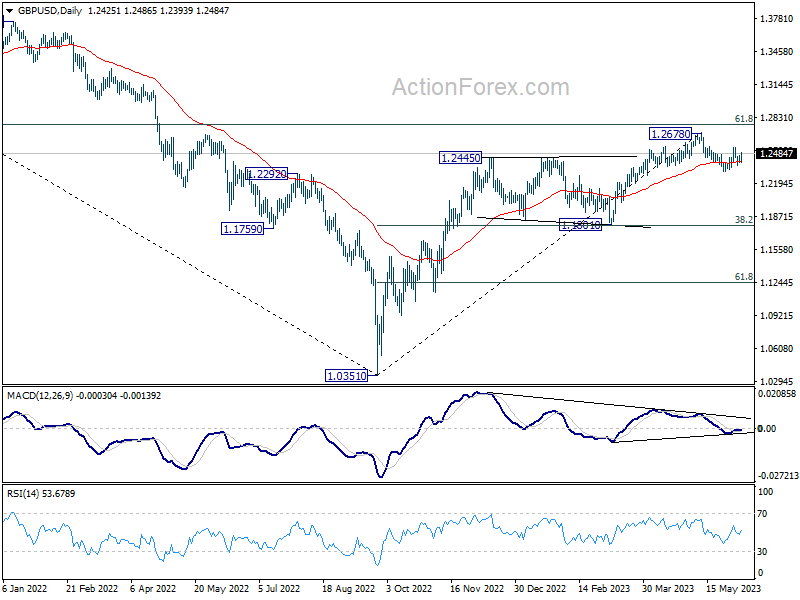
USD/CHF Mid-Day Outlook
Daily Pivots: (S1) 0.9037; (P) 0.9078; (R1) 0.9105; More...
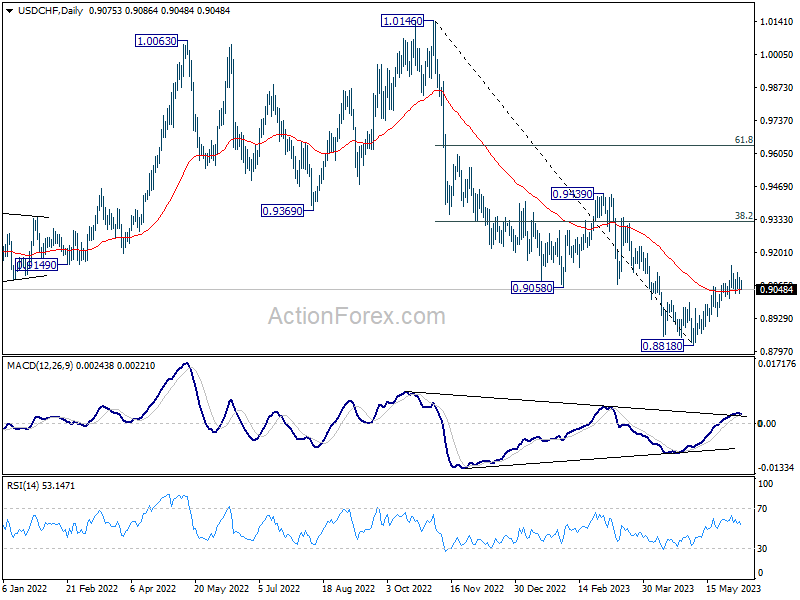
Intraday bias in USD/CHF remains neutral for the moment. Consolidation form 0.9146 could extend further. But with 0.9013 minor support intact, further rally is expected. Rise from 0.8818 short term bottom is seen as correcting whole down trend from 1.0146. Above 0.9146 will target 38.2% retracement of 1.0146 to 0.8818 at 0.9325. On the downside, however, break of 0.9013 will turn bias back to the downside for retesting 0.8818 low instead.
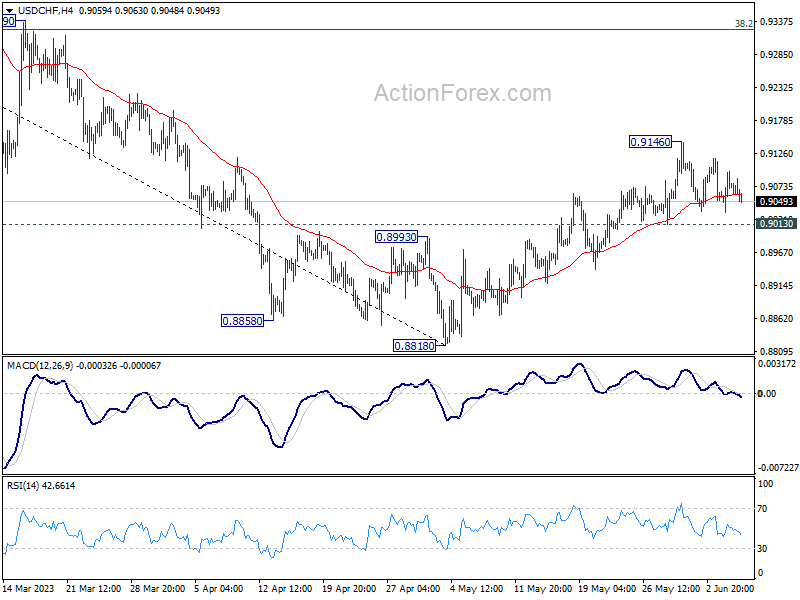
In the bigger picture, fall from 1.1046 (2022 high) is seen as a leg in the long term range pattern from 1.0342 (2016 high), which might have completed at 0.8818 already, just ahead of 0.8756 long term support. Sustained trading above 0.9058 support turned resistance should confirm medium term bottoming. Further break of 0.9439 resistance will confirm bullish trend reversal.
USD/JPY Mid-Day Outlook
Daily Pivots: (S1) 139.16; (P) 139.57; (R1) 140.05; More...
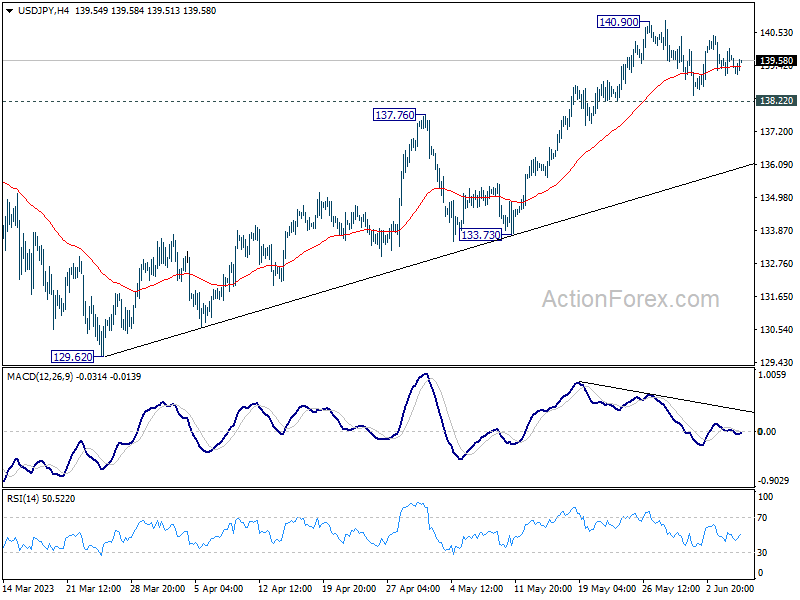
USD/JPY is still extending the consolidation from 140.90 and intraday bias stays neutral for the moment. With 138.22 minor support intact, further rally is expected. On the upside, break of 140.90 will resume larger rise from 127.20 to 142.48 fibonacci level. However, considering bearish divergence condition in 4 hour MACD, break of 138.22 will confirm short term topping, and turn bias back to the downside for 55 D EMA (now at 136.35).
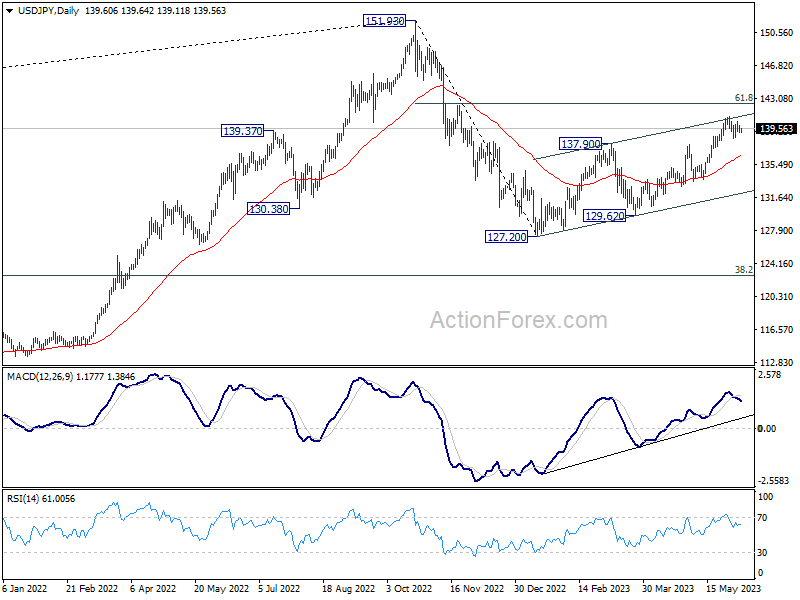
In the bigger picture, rise from 127.20 is seen as the second leg of the corrective pattern from 151.93 high. Stronger rally would be seen to 61.8% retracement of 151.93 to 127.20 at 136.34. Sustained break there will pave the way back to retest 151.93. On the downside, however, break of 133.73 support will argue that the pattern could have started the third leg through 127.20 low.
Yen Softens Amid Rising Treasury Yields, But Loss Limited
Yen is encountering renewed selling pressure, particularly against European majors. This weakness is partly attributed to the rising treasury yields that have dampened enthusiasm for the Japanese currency. However, its losses remain contained for the moment. On the other hand, Australian Dollar is seeking to prolong its short-term rally, most notably against New Zealand Dollar. The Sterling is trailing closely as the second strongest, buoyed by buying against a weaker Euro. Conversely, the Dollar is currently lagging, second only to Kiwi in terms of weak performance, followed closely by Yen. Canadian Dollar is exhibiting a mixed performance as market participants eagerly await Bank of Canada's rate decisions.
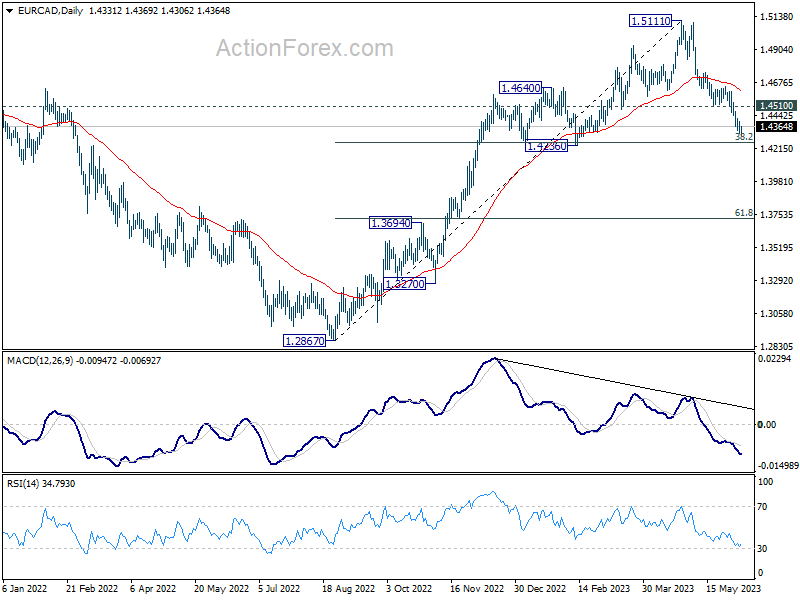
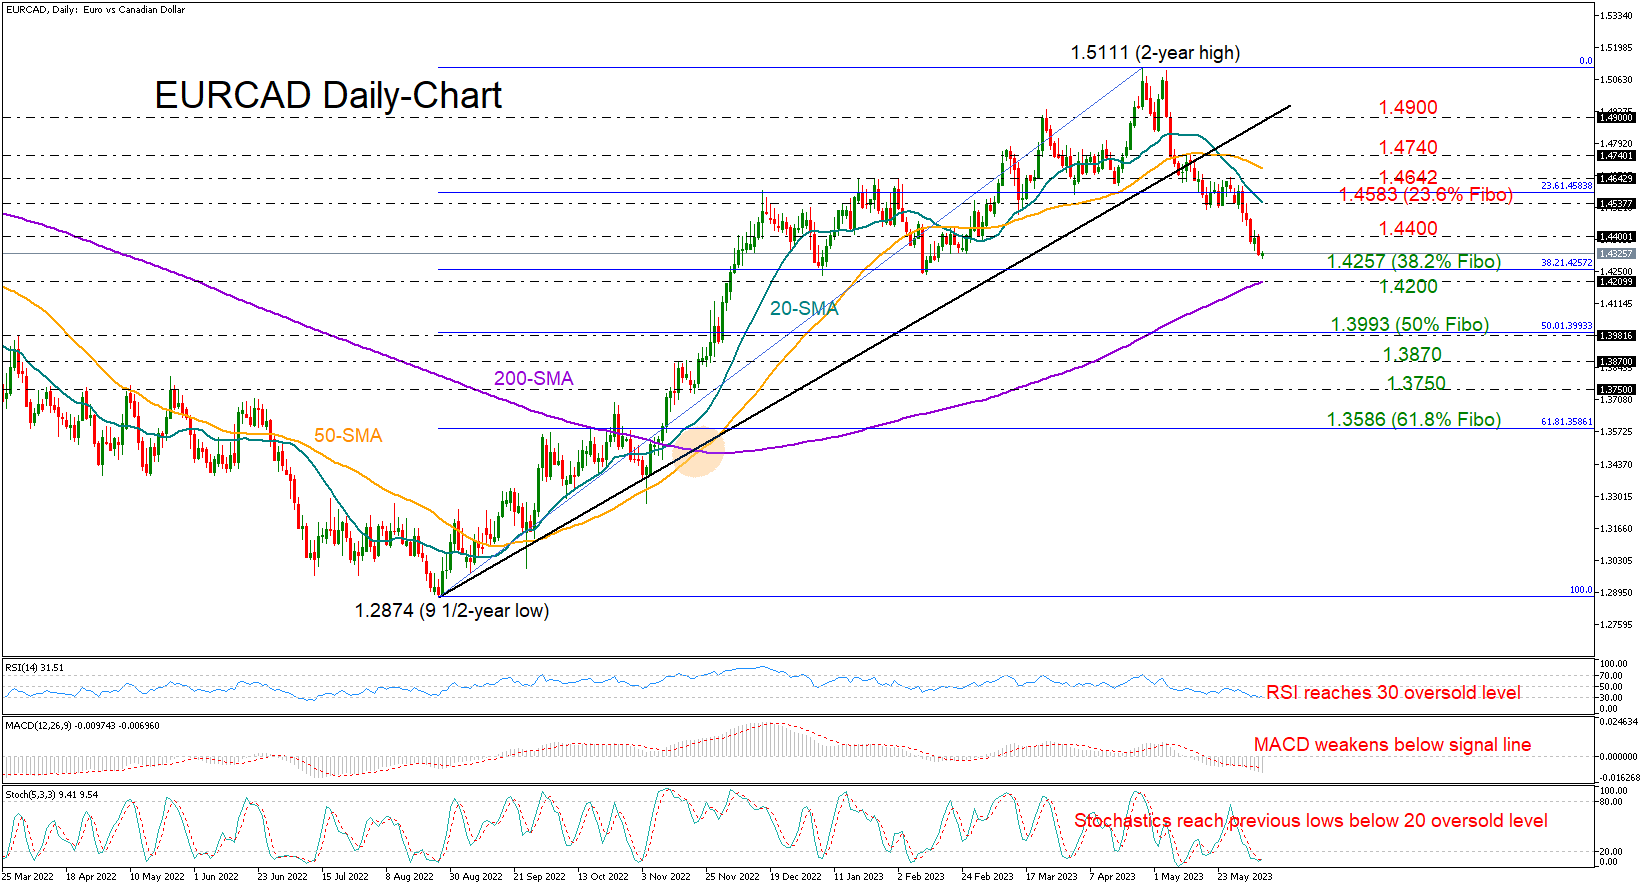
Technically, there is prospect of a bounce in EUR/CAD, considering that it's now close to 1.4236 cluster support (38.2% retracement of 1.2867 to 1.5111 at 1.4254). Break of 1.4510 minor resistance will suggest that the corrective fall from 1.5111 has completed and bring stronger rebound back to 55 D EMA (now at 1.4615) and above. Nevertheless, decisive break of 1.236 could path the way to 61.8% retracement at 1.3724. Direction of the cross will likely become clear shortly after Bank of Canada's decision.
ECB Schnabel: Peak in underlying inflation insufficient to declare victory
In an interview by De Tijd, ECB Executive Board member Isabel Schnabel noted that "given the high uncertainty about the persistence of inflation, the costs of doing too little continue to be greater than the costs of doing too much."
She emphasized "once inflation has become entrenched in the economy, it becomes much more costly to fight it," adding that "We have more ground to cover. It will depend on the incoming data by how much more rates will have to increase."
On the topic of market expectations of two more additional 25bps hikes, Schnabel remained data-driven. She responded, "That will depend on the incoming data. Let me be very clear: A peak in underlying inflation would not be sufficient to declare victory: we need to see convincing evidence that inflation returns to our 2% target in a sustained and timely manner. We are not at that point yet."
Regarding monetary policy transmission precess, Schnabel explained, "A rise in the policy rate first has an impact on financing conditions, then on the real economy, and ultimately on wages and prices." She revealed that ECB's staff analysis suggests the effects of tighter monetary policy are currently in progress, with the impact on inflation expected to peak in 2024.
However, Schnabel cautioned that uncertainty persists around the strength and speed of this process, admitting, "it may take longer than was previously the case to see the impact of our policy."
ECB Knot: Financial markets extraordinarily optimistic on inflation
Speaking at a Dutch parliamentary hearing, ECB Governing Council member and Dutch central bank head Klaas Knot highlighted the optimistic stance of financial markets about inflation, and warned about the potential pitfalls.
"Financial markets are extraordinarily optimistic and are expecting inflation to drop as fast as it rose. For next year even rate decreases are already priced in," Knot observed.
However, the Dutch central bank chief noted that this rosy outlook might invite unforeseen challenges, especially if the path to inflation stabilization necessitates a longer than anticipated period of monetary tightening. This could potentially reignite tension within the financial markets.
"Exactly in such a situation, a longer than expected period of monetary tightening to keep inflation in check will increase the risk of renewed stress on financial markets," he cautioned.
RBA Lowe: Some further tightening of monetary policy may be required
In a speech, RBA Governor Philip Lowe revealed further insight into the central bank's decision-making process and concerns regarding inflation. Lowe underscored RBA's decision to raise interest rates once more yesterday as an effort to confidently bring inflation back to target within a reasonable timeframe.
Governor Lowe said, "Yesterday's decision to increase interest rates again was taken to provide greater confidence that inflation will return to target within a reasonable timeframe."
He attributed this decision to a recent influx of data, suggesting "greater upside risks" to the Bank's inflation outlook. Persistent inflation in services prices, both domestically and abroad, combined with recent data on inflation, wages, and housing prices outpacing forecasts, were contributing factors.
The Governor noted, "Given this shift in risks and the already fairly drawn-out return of inflation to target, the Board judged that a further increase in interest rates was warranted."
However, he also highlighted various factors the Board will monitor closely in the coming months, including developments in the global economy, domestic household spending, the growth rate in unit labour costs, and inflation expectations.
While acknowledging that the RBA remains on a narrow path, Lowe pointed out "significant risks", particularly the possibility that "inflation stays too high for too long".
He concluded, "Some further tightening of monetary policy may be required, but that will depend upon how the economy and inflation evolve. The Board will continue to pay close attention to developments in the global economy, trends in household spending, and the outlook for inflation and the labour market."
Australia's Q1 GDP grew only 0.2% qoq, domestic price growth decelerated
Australia's GDP expanded by 0.2% qoq in Q1, missing expectations of 0.3% qoq growth. This marked the slowest rate of growth since the September 2021 quarter.
Head of National Accounts at the Australian Bureau of Statistics, Katherine Keenan, remarked on this development. "This is the sixth straight rise in quarterly GDP but the slowest growth since the COVID-19 Delta lockdowns in September quarter 2021," she said.
The GDP implicit price deflator, a measure of price changes, climbed by 1.9% in the quarter and by 6.8% from March 2022. A significant contributor to this increase was rise in terms of trade by 2.8%, led by steeper decline in import prices (-4.0%) than export prices (-1.4%).
Fall in import prices, the largest since December 2010, was propelled by global drop in oil prices and appreciation of Australian dollar. Meanwhile, a decrease in export prices was led by rural and mining commodities.
Domestic price growth decelerated to 1.1% as goods inflation eased. This is a downturn from the 1.4% increase observed in the December 2022 quarter.
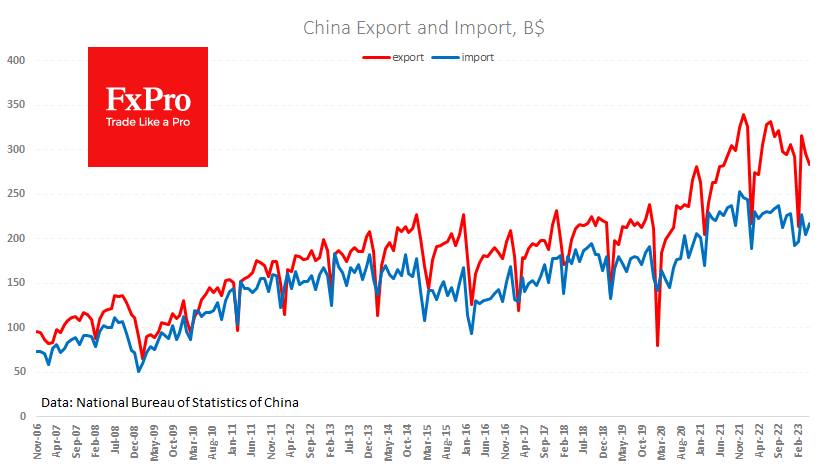
China's exported fell -7.5% yoy in May, trade surplus shrank to USD 65.8B
In May, China's exports significantly contracted, defying expectations. The country's exports shrunk by -7.5% yoy to USD 283.5B, which was far below expectation of -0.4% yoy contraction. This marks the second-lowest export value since May 2022, with the only lower figure being the seasonally affected USD 213.8B recorded in February. Imports also contracted by -4.5% yoy to USD 217.7B, outperforming the forecasted 8.0% yoy contraction.
However, the most striking observation comes in the form of China's trade surplus. It fell sharply from USD 90.2B to USD 65.8B, defying the predicted figure of USD 94.2B. This represents the lowest level since the COVID-driven decline observed in April 2022.
OECD upgrades global growth outlook, advocates for restrictive monetary policies
In the latest Economic Outlook, OECD has slightly upgraded global growth forecasts, and stressed the need for central banks to maintain restrictive monetary policies to curtail inflation.
OECD now projects global economic expansion at 2.7%, a slight upgrade from its previous forecast of 2.6% in March. The US and China, the world's two largest economies, saw their growth forecasts for 2023 nudged upwards by 0.1%, to 1.6% and 5.4% respectively.
In Eurozone, growth forecast was modestly bumped up by 0.1 points to 0.9%. However, Germany, the zone's largest economy, saw a significant downgrade with zero growth now expected. UK, on the other hand, received a boost with OECD predicting 0.3% growth rather than an economic contraction. Japan's GDP growth forecast was slightly revised down to 1.3%.
Despite the optimistic revisions, OECD chief economist Clare Lombardelli underscored the challenges ahead in a commentary accompanying the report.
"The global economy is turning a corner but faces a long road ahead to attain strong and sustainable growth," Lombardelli stated. She added, "The recovery will be weak by past standards."
Highlighting the ongoing inflationary pressures globally, Lombardelli advocated for a continued restrictive monetary stance from central banks. "Central banks need to maintain restrictive monetary policies until there are clear signs that underlying inflationary pressures are abating," she urged.
USD/JPY Mid-Day Outlook
Daily Pivots: (S1) 139.16; (P) 139.57; (R1) 140.05; More...
USD/JPY is still extending the consolidation from 140.90 and intraday bias stays neutral for the moment. With 138.22 minor support intact, further rally is expected. On the upside, break of 140.90 will resume larger rise from 127.20 to 142.48 fibonacci level. However, considering bearish divergence condition in 4 hour MACD, break of 138.22 will confirm short term topping, and turn bias back to the downside for 55 D EMA (now at 136.35).
In the bigger picture, rise from 127.20 is seen as the second leg of the corrective pattern from 151.93 high. Stronger rally would be seen to 61.8% retracement of 151.93 to 127.20 at 136.34. Sustained break there will pave the way back to retest 151.93. On the downside, however, break of 133.73 support will argue that the pattern could have started the third leg through 127.20 low.
Economic Indicators Update
| GMT | Ccy | Events | Actual | Forecast | Previous | Revised |
|---|---|---|---|---|---|---|
| 01:30 | AUD | GDP Q/Q Q1 | 0.20% | 0.30% | 0.50% | 0.60% |
| 03:00 | CNY | Trade Balance (USD) May | 65.8B | 94.2B | 90.2B | |
| 05:00 | JPY | Leading Economic Index Apr P | 97.60% | 98.30% | 97.50% | 97.70% |
| 05:45 | CHF | Unemployment Rate M/M May | 2.00% | 1.90% | 1.90% | |
| 06:00 | EUR | Germany Industrial Production M/M Apr | 0.30% | 0.80% | -3.40% | -2.10% |
| 06:45 | EUR | France Trade Balance (EUR) Apr | -9.7B | -7.7B | -8.0B | -8.4B |
| 07:00 | CHF | Foreign Currency Reserves (CHF) May | 734B | 732B | ||
| 08:00 | EUR | Italy Retail Sales M/M Apr | 0.20% | 0.40% | 0.00% | |
| 12:30 | USD | Trade Balance (USD) Apr | -74.6B | -75.3B | -64.2B | -60.6B |
| 12:30 | CAD | Labor Productivity Q/Q Q1 | -0.60% | 0.00% | -0.50% | |
| 12:30 | CAD | Trade Balance (CAD) Apr | 1.9B | 0.1B | 1.0B | 0.2B |
| 14:00 | CAD | BoC Interest Rate Decision | 4.50% | 4.50% | ||
| 14:30 | USD | Crude Oil Inventories | 1.2M | 4.5M |
China’s Weak Foreign Trade Spurs Further Yuan Weakening
Further signs of a slowdown in China came from the trade balance. The foreign trade data published in the morning was noticeably weaker than expected.
Dollar-denominated exports fell by 7.5% YoY despite a more than 4.5% weakening of the Chinese yuan against the dollar during this time.
Imports fell by 4.5% y/y, declining against the previous year for nine of the last ten months.
The trade surplus narrowed in May to $65.8bn against expectations of $95bn, a sharp dip instead of an uptrend.
After this report, it is unsurprising that the People’s Bank of China had urged state banks to lower interest rates to stimulate domestic demand earlier in the day. Given the shallow inflation (starkly contrasting to most of the world), there is still plenty of room for stimulus.
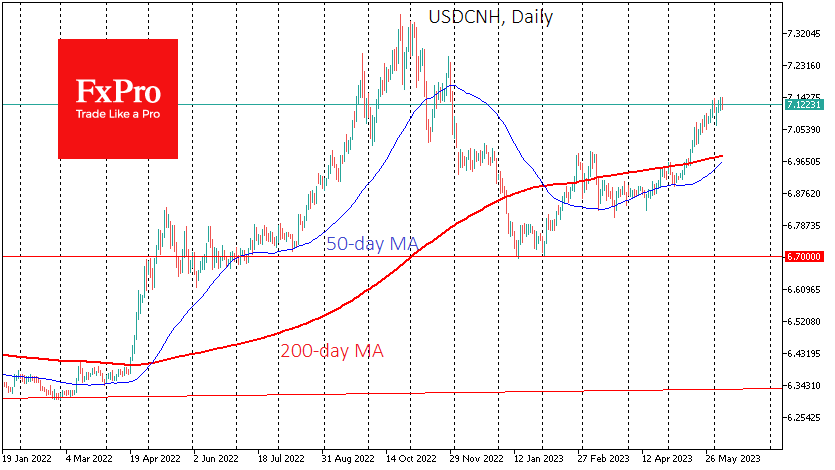
A separate trend is the renminbi, which has been retreating methodically against the dollar for the last eight weeks, roughly following the trend of last year and leaving the renminbi 7% below levels from a year ago.
If the authorities maintain the gradual weakening of their currency, this could support the competitiveness of Chinese exports. However, if no improvement in export dynamics is visible, further pressure on the renminbi should be expected. If the PBC tries to maintain a 7% weakening of the renminbi against the level of a year earlier, the USDCNH could rise to 7.8 in October.
AUD/USD Rises to 1-month High, Shrugs Off Soft GDP
- AUD/USD powers to 1-month high
- Australian GDP dips to 0.2%
- RBA expected to deliver more rate hikes
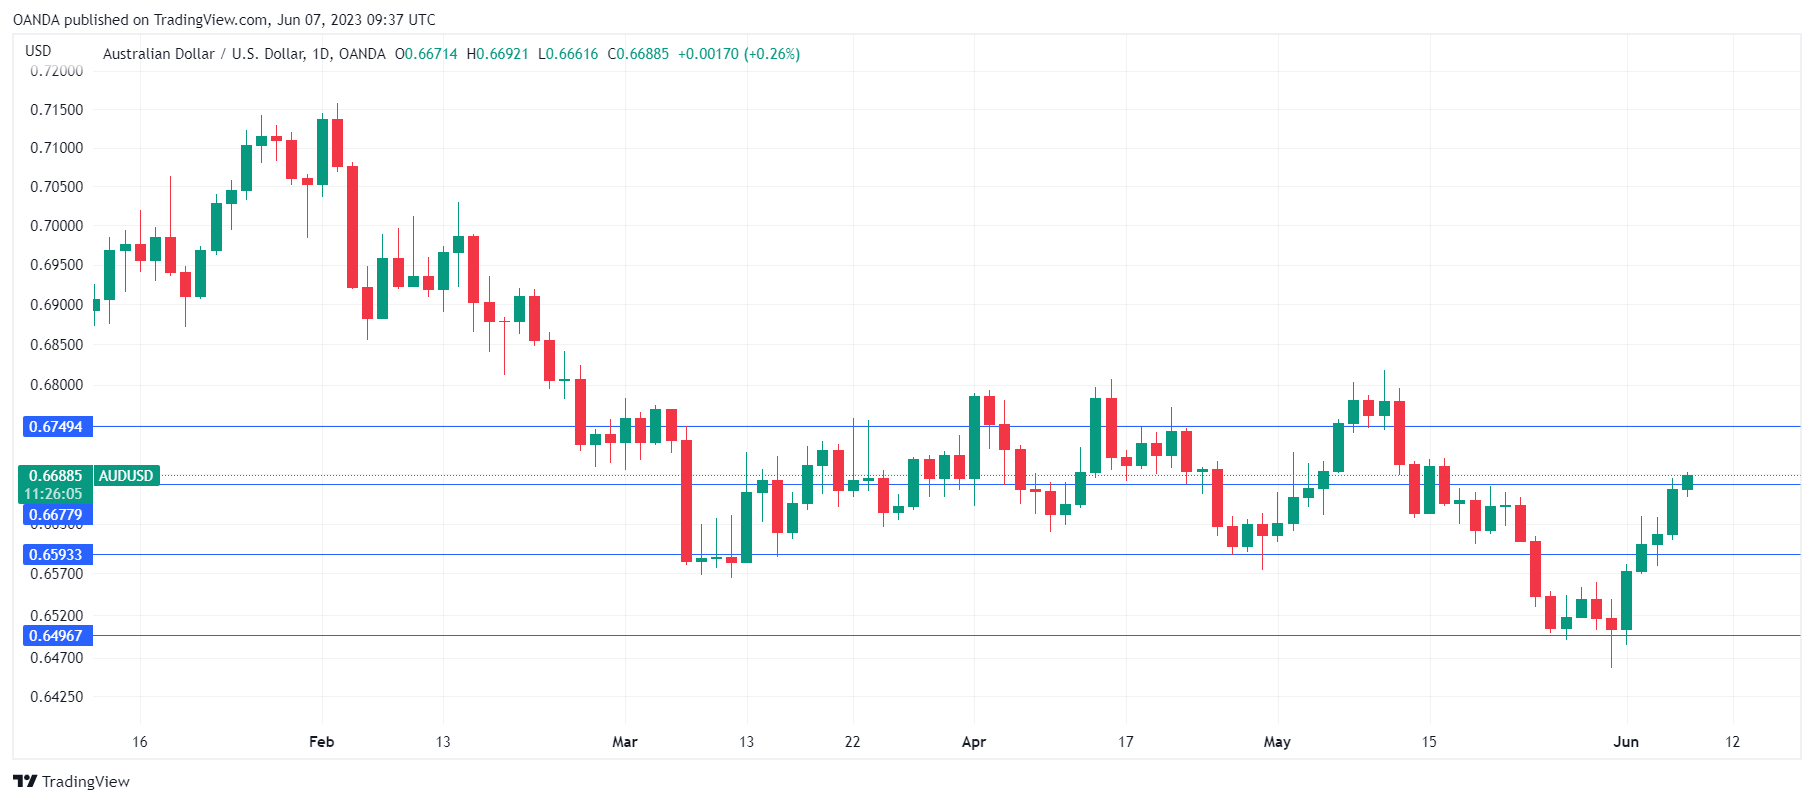
The Australian dollar has extended its rally on Wednesday. AUD/USD is trading at 0.6689, up 0.28%. Today’s weak GDP report and soft Chinese trade data haven’t spoiled the party, as the Australian dollar is up 1.2% this week.
Australian GDP slips
Australia’s GDP slowed to 0.2% in the first quarter, down from 0.6% in Q4 2022 and missing the consensus of 0.3%. On an annual basis, GDP fell to 2.3%, following a 2.7% gain in Q4 2022 and shy of the consensus of 2.4%.
The economy is cooling down, and that really shouldn’t come as a surprise. The cost of living crisis, rising interest rates and weaker demand have taken a bite out of economic activity. China’s reopening has faltered, as May trade data showed a decline in exports and imports. This is bad news for Australian exporters, as their largest market is China.
The GDP report was released just hours after the RBA announced a 25-basis point rate hike. The RBA has surprised the markets with two straight rate hikes as it wages a relentless war against inflation, which isn’t coming down fast enough for the central bank. Governor Lowe reiterated after the decision that the RBA would do whatever it takes to bring inflation back down to its 2-3% target, from the current 7%.
Core inflation has been stickier than expected and that means that more rate hikes can be expected. The cash rate is currently at 4.10% and the RBA has looked at different scenarios in which the cash rate peaked at 4.8%. The RBA may not actually move to that level, as the danger of a recession would be high, but there’s little doubt that more rate hikes are on the way.
AUD/USD Technical
- AUD/USD is testing resistance at 0.6677. Above, there is resistance at 0.6749
- There is support at 0.6568 and 0.6496
EURCAD Heads Towards Its Winter Lows
EURCAD is marking its sixth week of losses, falling by more than 4.0% since creating a bearish double top structure around a two-year high of 1.5111.
The pair is currently eyeing the key base of 1.4257, where the price pivoted higher in January and February. The 38.2% Fibonacci retracement of the previous upleg is also making this area important to watch ahead of the BoC rate decision due today at 14:00 GMT. It's worthy to note that the 200-day simple moving average is in short distance too.
A continuation below the 1.4200 round level could develop into a sharp sell-off that might last till the 50% Fibonacci level of 1.3993. The constraining zone of 1.3870 could be the next destination if the bears stay in power.
Conversely, a close above this week’s resistance of 1.4400 could navigate the price towards the 20-day simple moving average (SMA). Some congestion could also occur nearby, between the 23.6% Fibonacci of 1.4583 and the 1.4642 barricade, where the 50-day SMA is converging. If the latter proves easy to pierce through, with the price breaching the 1.4740 handle too, the recovery could expand towards the broken ascending trendline seen around 1.4900.
All in all, EURCAD is still in bearish territory, though with the pair approaching a familiar support zone and the technical picture sending oversold signals, an upside correction cannot be ruled out.
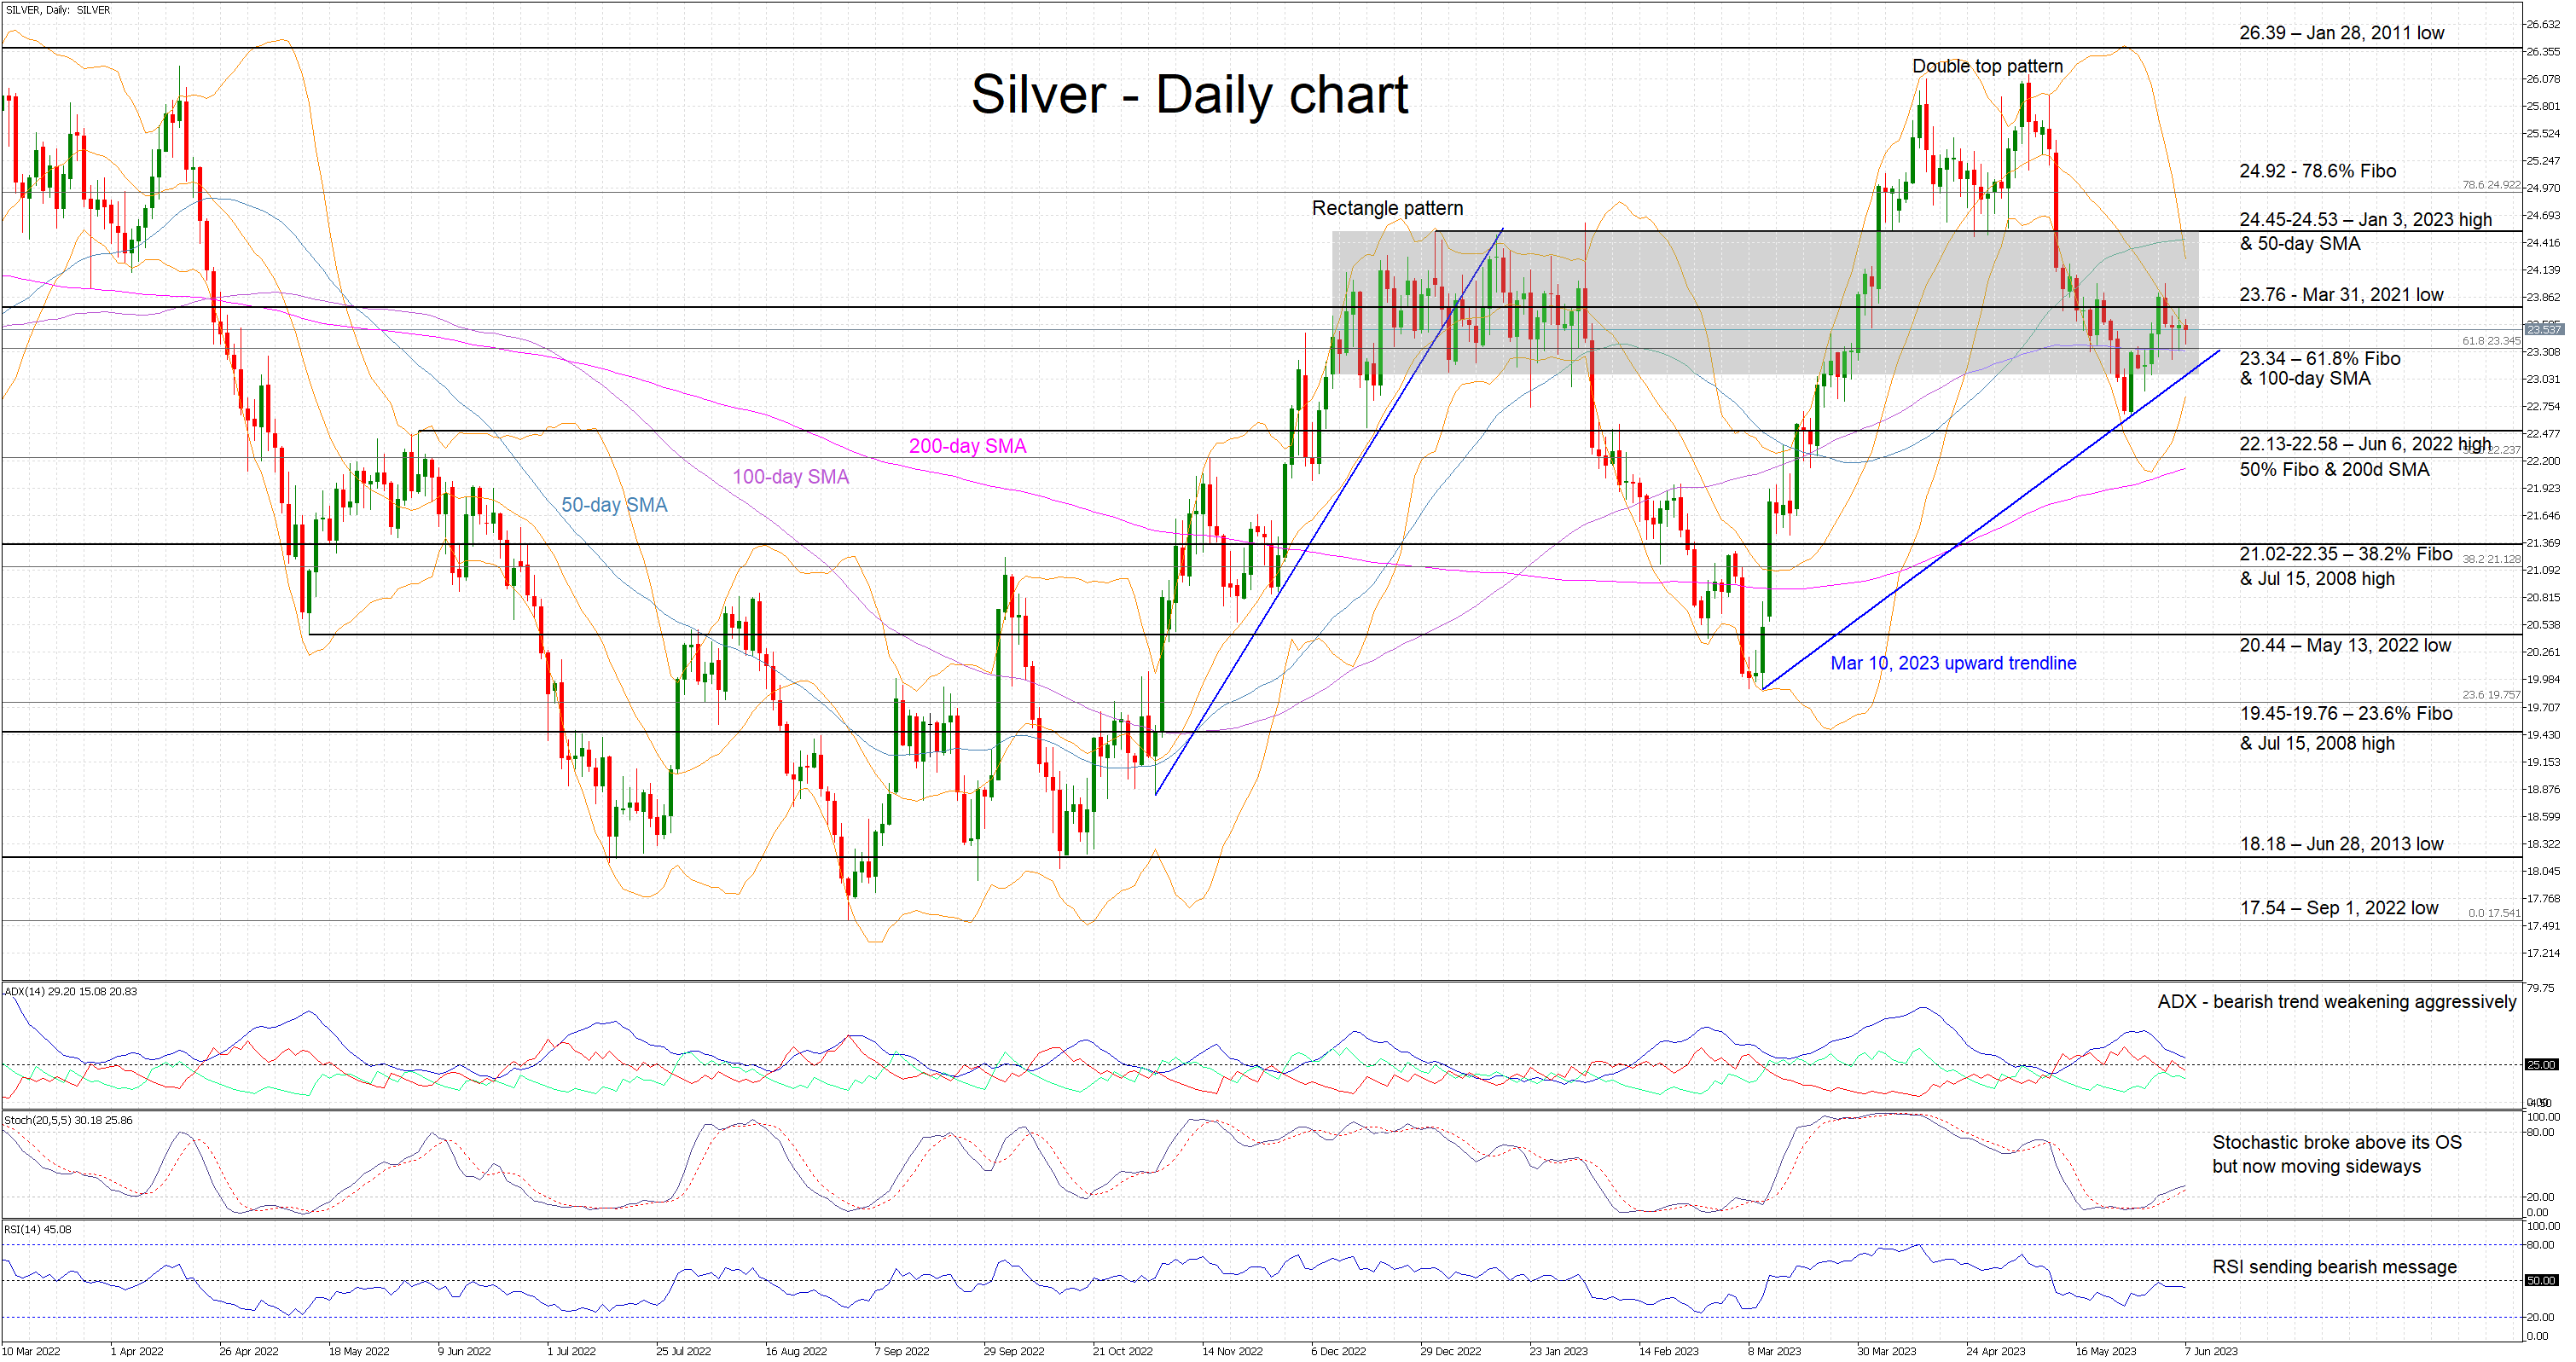
Silver Back Inside Its Early 2023 Rectangle
Silver is edging lower today as market participants weigh their options after the sizeable correction. The recent double top pattern achieved its theoretical target of 22.90 and thus does not appear to exert bearish pressure anymore. Silver has actually returned inside its December 2022-February 2023 rectangle, hence pointing to a range-trading phase.
The bears are keen on another sell-off, but the momentum indicators are sending a very mixed signal at this stage. The Average Directional Movement Index (ADX) is slightly above its 25-threshold and pointing to a weakening bearish trend. The RSI is hovering below its 50-midpoint and the stochastic oscillator is trading sideways, a tad above its oversold territory. In addition, the relative tightening of the Bollinger bands could be seen as an extra sign of the potential consolidation inside the aforementioned rectangle.
Amidst this environment, the bears appear to be targeting the 23.34 level populated by the 61.8% Fibonacci retracement of March 8, 2022 – September 1, 2022 downtrend and the 100-day simple moving average (SMA) respectively. Should they manage to break this level, they would then come up against the busy 22.13-22.58 area. This range is defined by the June 6, 2022 high, the 50% Fibonacci retracement and the 200-day SMA.
On the other hand, the bulls are anxiously trying to recover part of their recent losses. A successful break for the key 23.76 level would potentially help them build some momentum as they set their eyes on the 24.45-24.53 range. This is important from a short-term perspective as it is also the upper boundary of the recent rectangle. A decisive break could be a significant win for the bulls as they would then aim for the 78.6% Fibonacci retracement at 24.92.
To conclude, silver bears enjoyed the impressive decline, but they now have to fight even harder to maintain these gains, with 23.76 being the first key level.
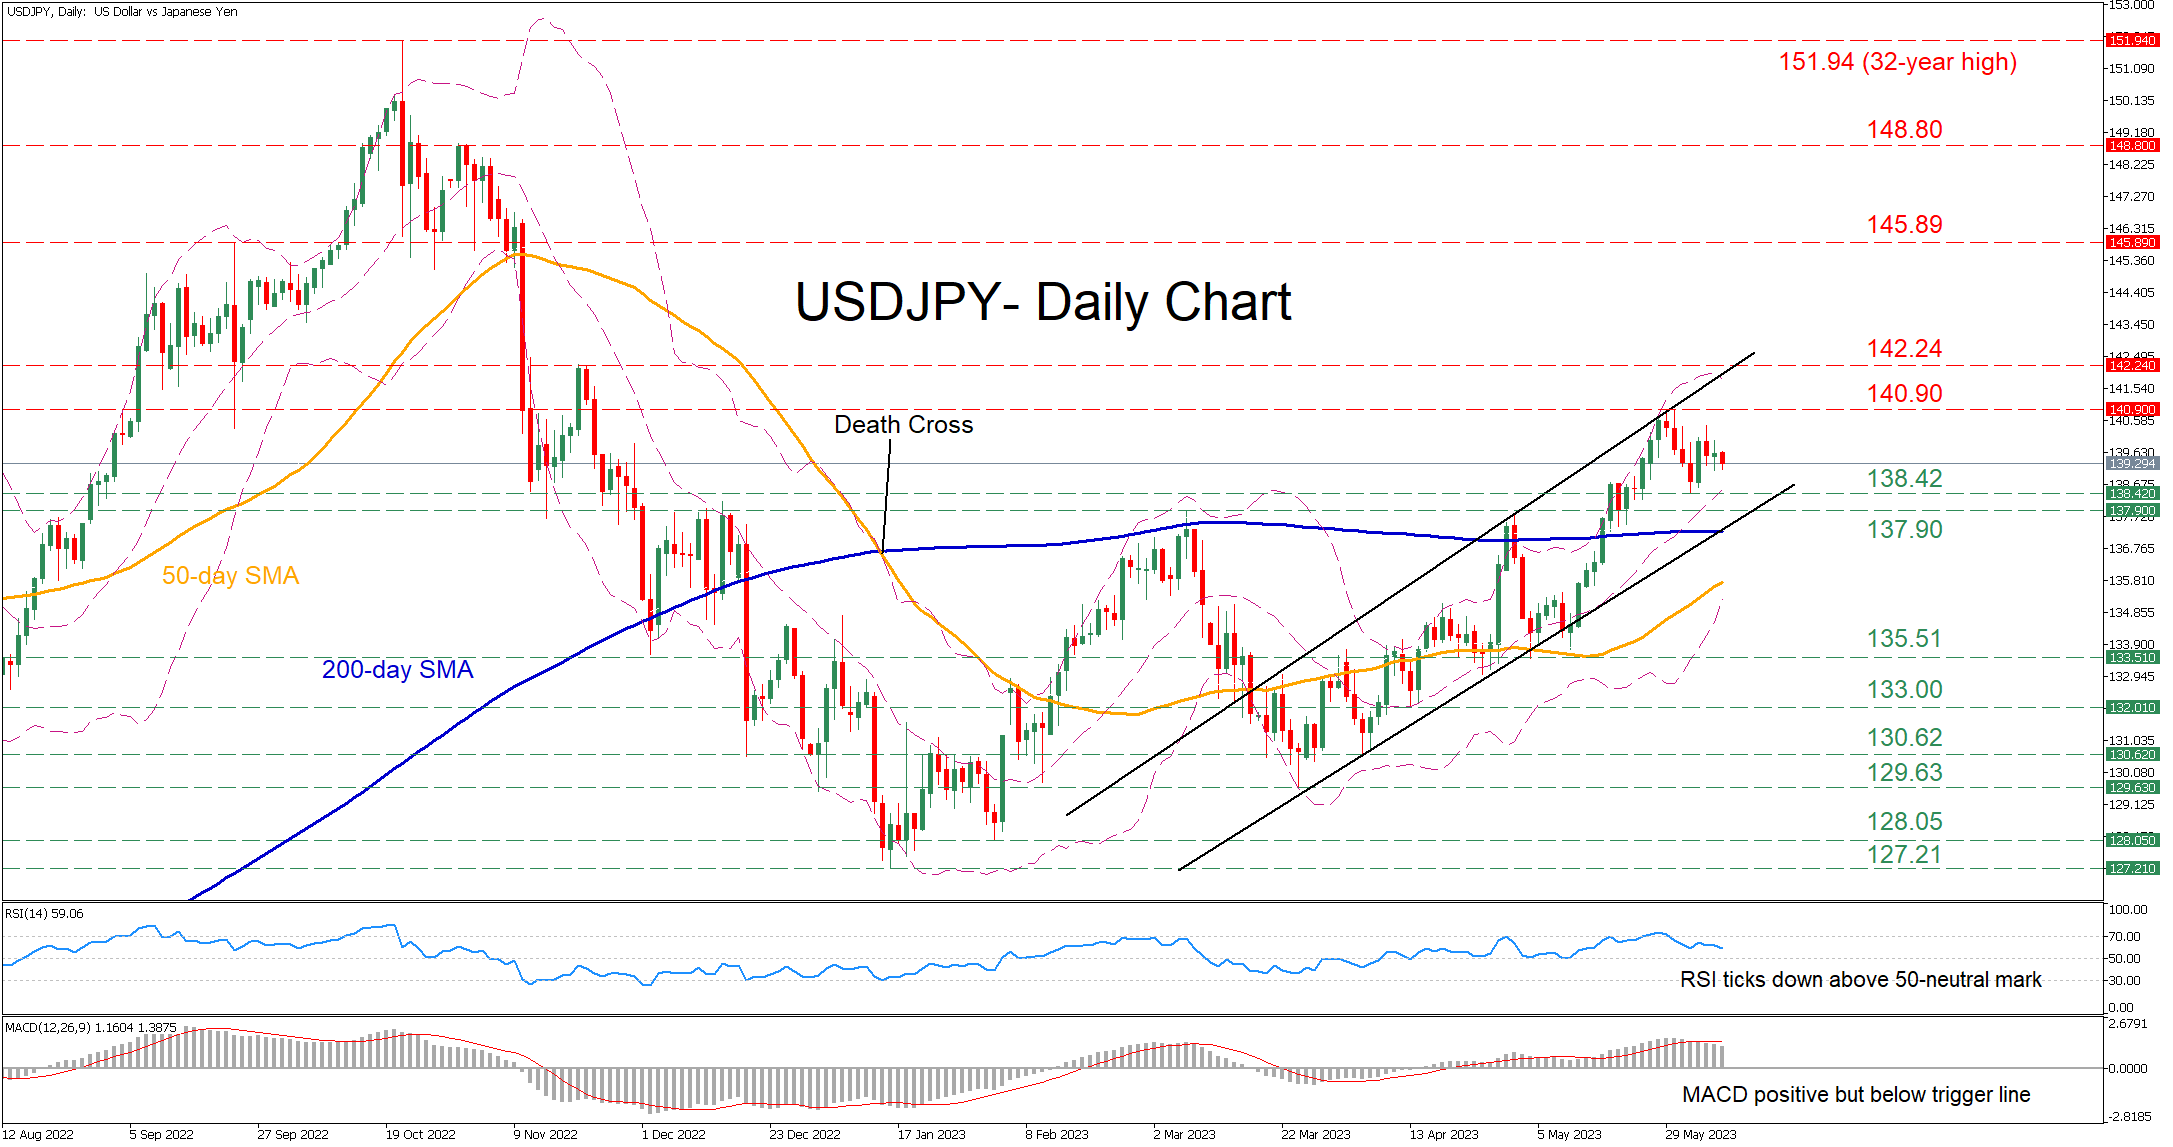
USDJPY Eases After Hitting Upper Limit of Ascending Channel
USDJPY has been trading within an upward sloping channel since mid-March, crossing above crucial technical levels and posting consecutive higher highs. However, the pair has been trading sideways in the past few sessions after its advance got rejected in the upper end of the bullish pattern.
The momentum indicators currently suggest that buying forces are subsiding. Specifically, the RSI is ticking downwards but remains above its 50-neutral mark, while the MACD dropped beneath its red signal line in the positive territory.
Should buyers try to push the price higher, initial resistance could be met at the six-month high of 140.90. Violating that zone, the pair could ascend towards the November 2022 resistance of 142.24 or higher to test the September peak of 145.89. Failing to halt there, the 148.80 hurdle could cap the pair’s upside.
Alternatively, should the uptrend lose steam and the price reverse lower, the recent support of 138.42 could act as the first line of defense. If that floor collapses, the bears might aim for the March high of 137.90 before the spotlight turns to 135.31. Further declines could then cease at the 133.00 support territory.
Overall, USDJPY seems to be experiencing a consolidation period after its latest advance got rejected, but the pair remains stuck within its medium-term ascending channel. Therefore, unless the bullish pattern gets violated to the downside, the uptrend will most likely resume.
Is EURJPY Losing its Shine?
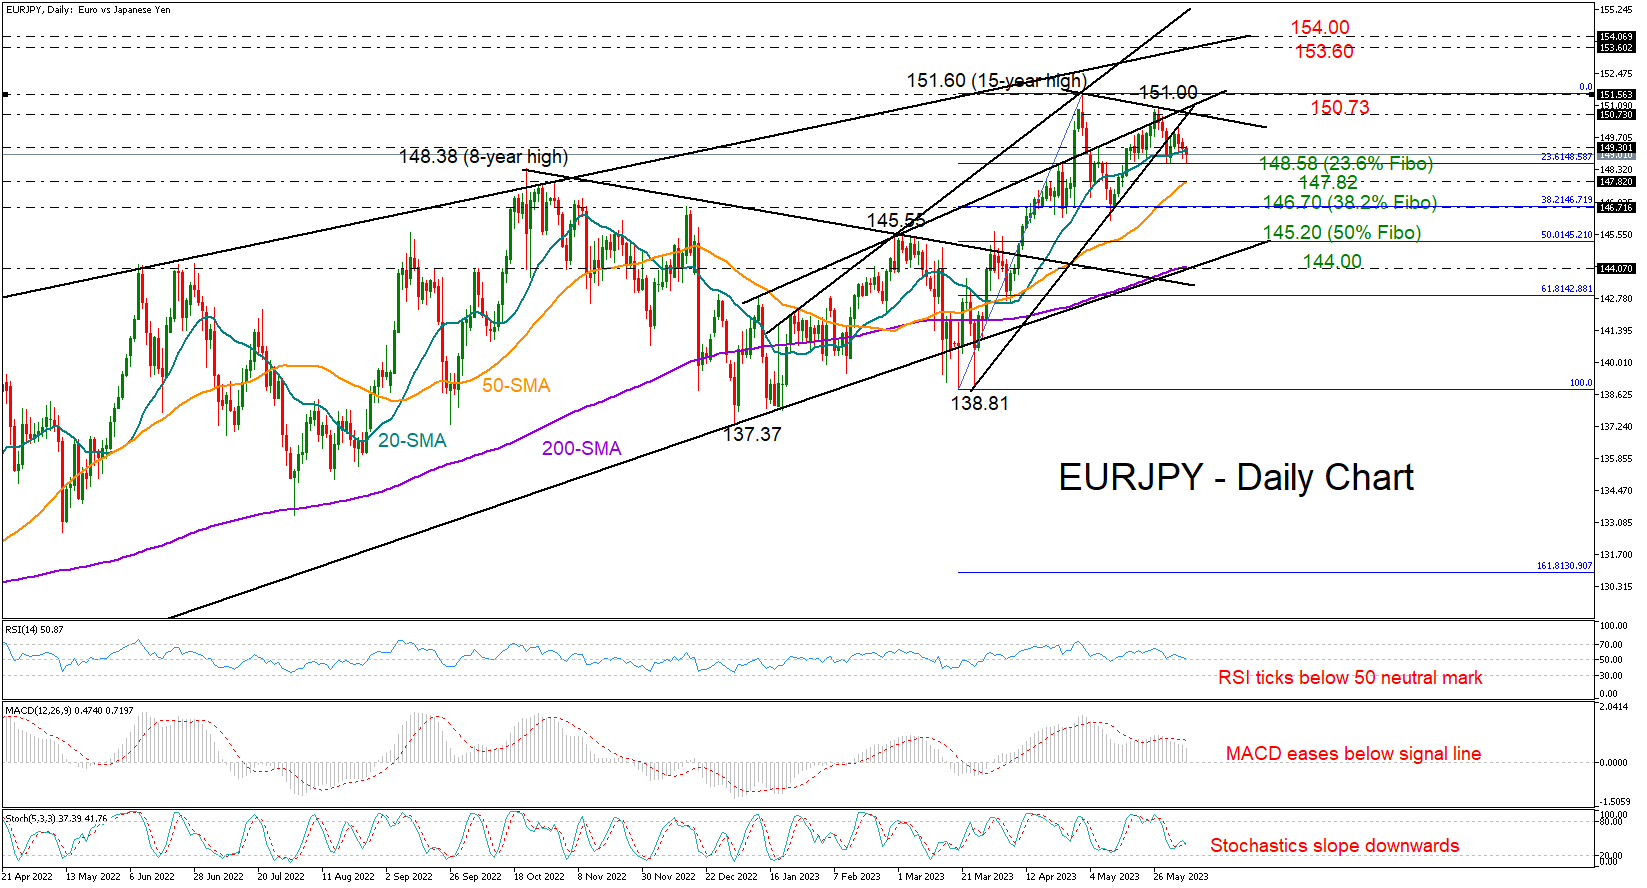
EURJPY has been declining over the past three days, stopping at the 148.58 zone that has been preventing upside and downside movements since April. The 23.6% Fibonacci retracement of the 138.81-151.60 upleg is adding extra credibility to the region.
Spring’s upward structure seems to be cracking given the lower high of 151.00 that preceded the latest bearish correction. That said, the rising simple moving averages (SMAs) have yet to reflect a weakening trend.
Meanwhile, the momentum indicators remain negatively charged, with the RSI set to enter the bearish region below its 50 neutral mark. That might be a warning sign that selling appetite could persist in the coming sessions. Yet, traders might wisely wait for a clear close below 148.58, and perhaps beneath the 50-day SMA at 147.82, before targeting the 38.2% Fibonacci level of 146.70. Another step lower would downgrade the short- and medium-term picture, likely activating a quick downfall towards the 50% Fibonacci mark of 145.20.
Should the bulls lift the price back above the 20-day SMA, they may initially get congested within the 150.73-151.60 region, where a couple of trendlines are located. Surpassing that wall, the positive trend could continue towards the long-term resistance line from August 2020 at 153.60.
In a nutshell, EURJPY seems to be losing its shine as the upward pattern in the price has started to lean on the downside. A step below 148.58, and more notably a close beneath 147.82, could activate fresh selling orders.