

Sample Category Title
EUR/JPY Daily Outlook
Daily Pivots: (S1) 149.07; (P) 149.55; (R1) 150.45; More....
Range trading continues in EUR/JPY and intraday bias remains neutral first. On the downside, below 148.58 will extend the corrective pattern from 151.60 with another falling leg. Deeper fall would be seen to 146.12 support and possibly below. On the upside, however, above 151.05 will target 151.60 high. Firm break there will resume larger up trend to 153.64 projection level.
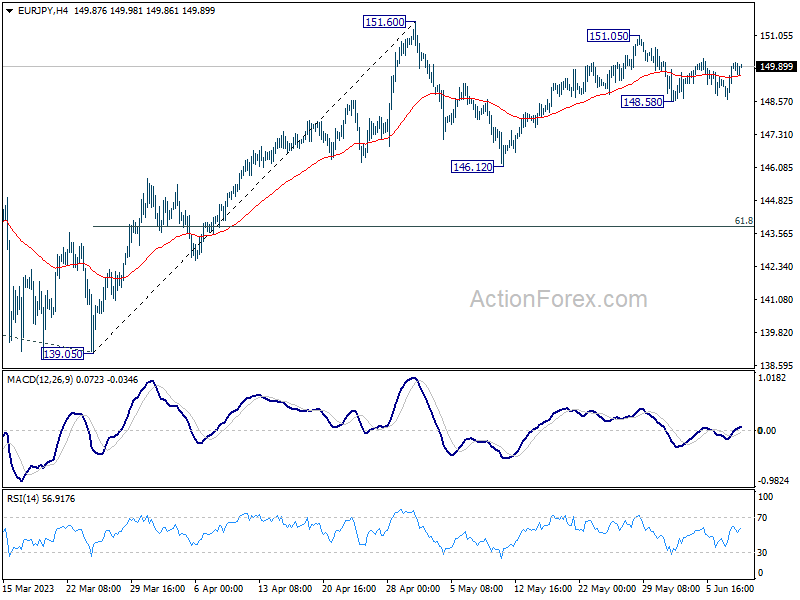
In the bigger picture, rise from 114.42 (2020 low) is in progress. Next target is 61.8% projection of 124.37 to 148.38 from 138.81 at 153.64. Sustained break there will pave the way to 100% projection at 162.82. For now, medium term outlook will remain bullish as long as 139.05 support holds, even in case of deep pull back.
AUDUSD Rebounds Strongly But 200-day Caps Upside
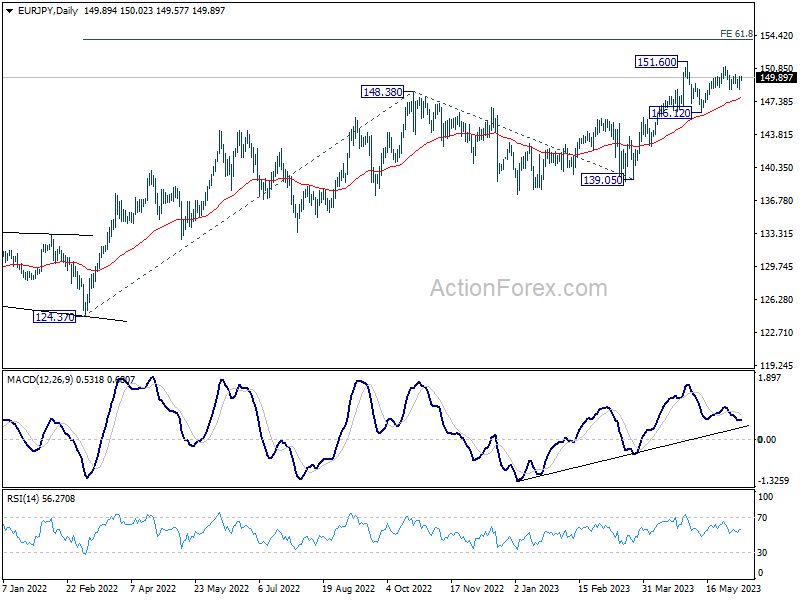
AUDUSD had been trending lower after peaking at the upper end of its rectangle pattern in early May. Although the pair managed to recover firmly from its 2023 low of 0.6457 on the back of an unexpected 25 basis points hike by the RBA, its advance got rejected by the 200-day simple moving average (SMA).
The momentum indicators are reflecting a cautiously positive tone. The RSI has flatlined above its 50-neutral mark, while the MACD is strengthening above its red signal line but remains in the negative zone.
Should buyers manage to push the price above the 200-day SMA, they could then attack the recent resistance of 0.6716. Surpassing that zone, the pair might face 0.6817, which is the upper boundary of its recent rangebound pattern. A break above that region may open the door for 0.6920 before 0.7030 gets tested.
On the flipside, bearish actions could send the price to test the 0.6622 support area. If that barricade fails, the spotlight could turn to 0.6590 before the pair challenges 0.6563. Failing to halt there, the price could descend towards the 2023 bottom of 0.6457.
Overall, AUDUSD recouped significant ground from its 2023 lows, but it has a long way to go till its short-term picture turns bullish. For that scenario to materialize, the pair must initially conquer the 200-day SMA.
US 30 Cash Index at Inflection Point
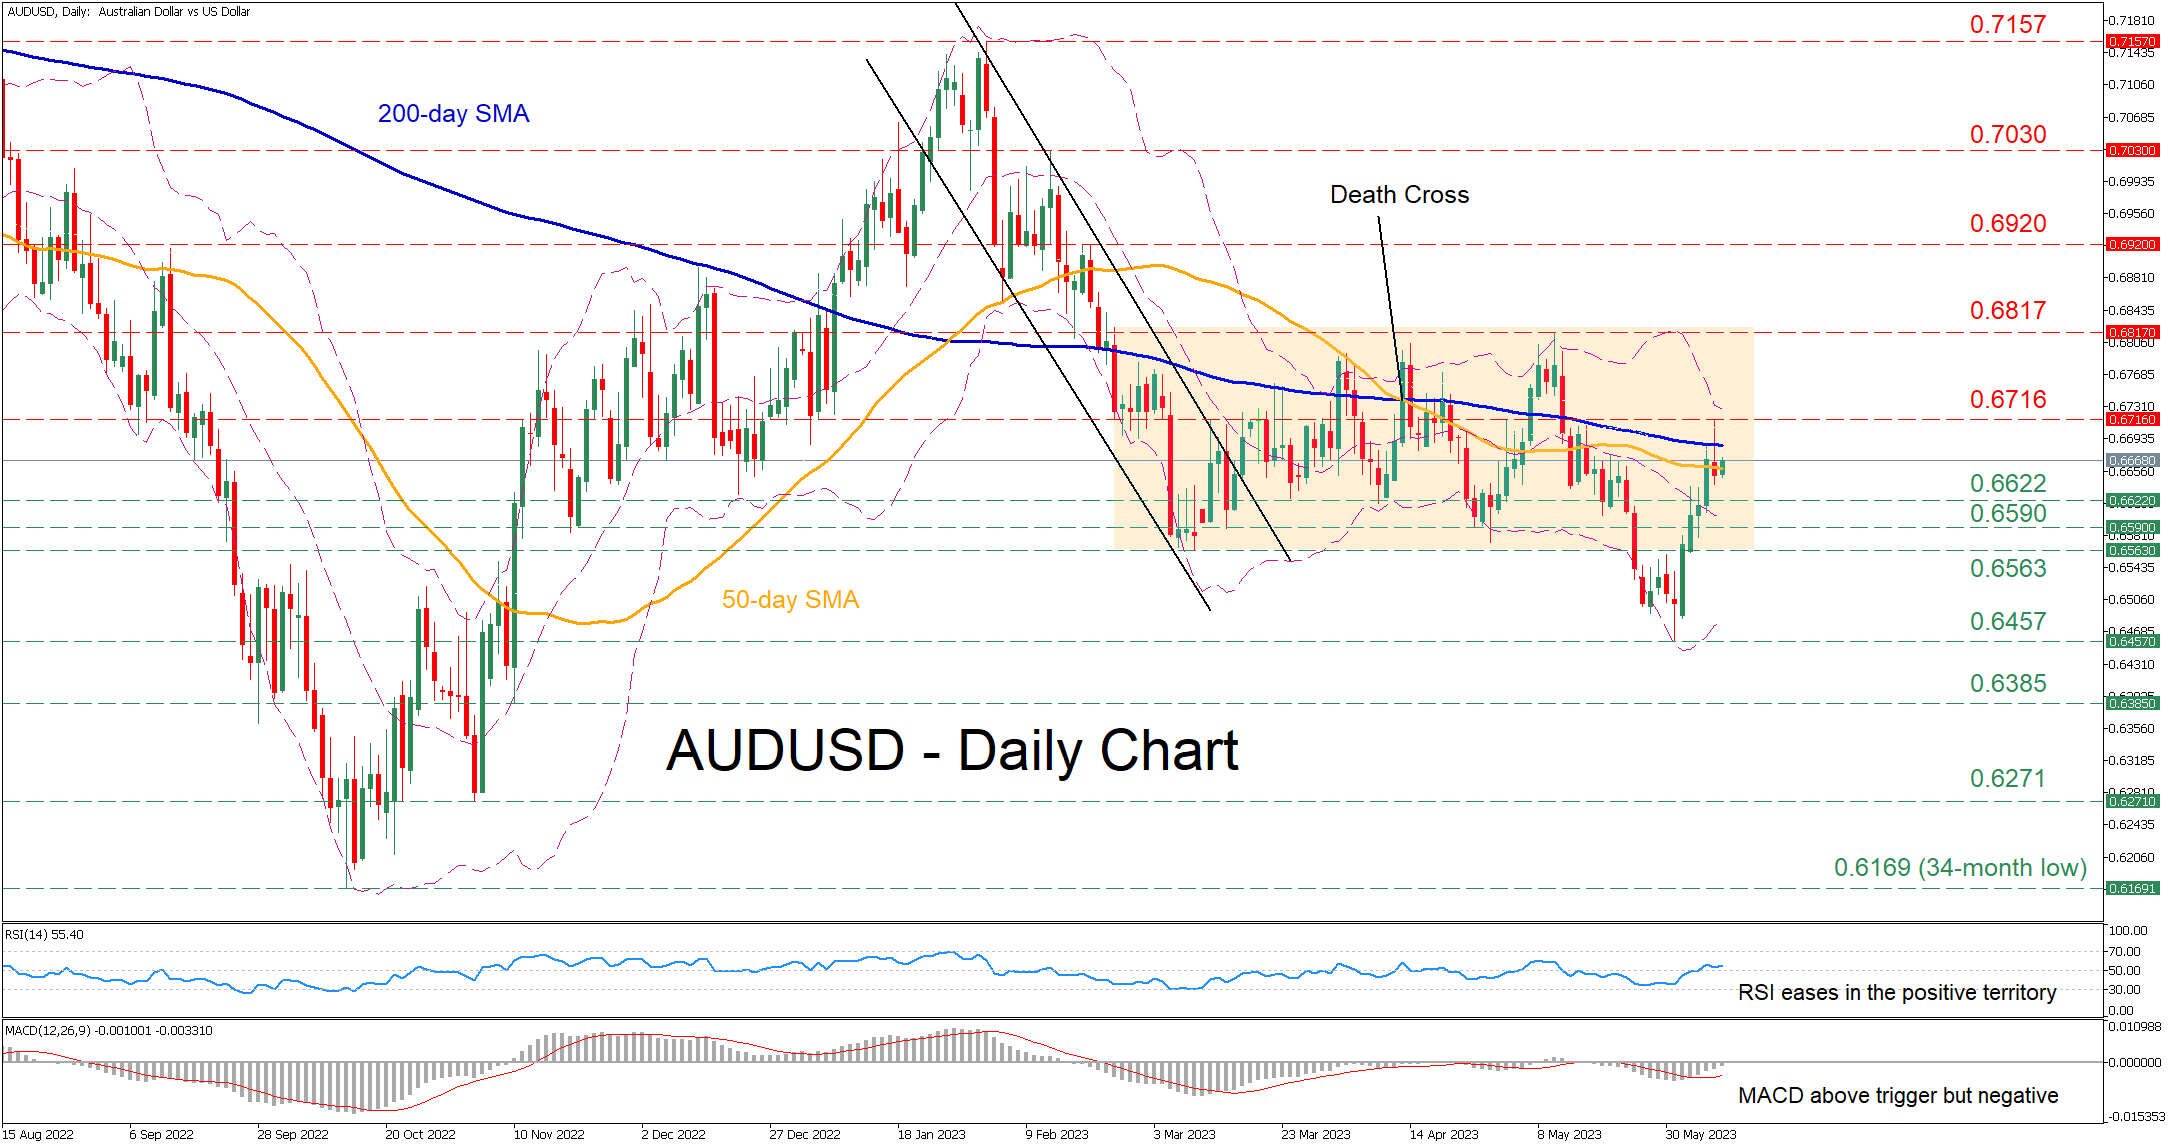
The US 30 cash index is hovering around 33,518 and conforming to the recent series of lower highs. On the downside, the October 13, 2023 upward sloping trendline appears to be acting as a strong support. The US 30 index has essentially entered a range-trading phase as market participants are trying to figure out their next move, especially as other US stock indices rally aggressively.
With the Average Directional Movement Index (ADX) confirming this trendless market and the RSI trading almost at its 50-threshold, the onus falls on the stochastic oscillator to give some sort of a hint. This indicator has just entered its overbought territory, where it can stay for a while before signaling the next possible US 30 index move.
Should the bulls decide to regain market control and retest the August 16, 2022 high at 34,280, they would firstly have to break the 33,518-33,754 area populated by the 61.8% Fibonacci retracement of the January 5, 2022 – October 3, 2022 downtrend, and the October 1, 2021 low. Even higher, the twin December 13, 2022 and May 10, 2021 highs at 34,930 and 35,091 respectively would clearly test the bulls’ resolve.
On the other hand, the bears would be keen on a break of the 33,317-33,483 area defined by the 50- and 100-day simple moving averages (SMAs). They would then come up against the October 13, 2023 upward sloping trendline, which stands a tad above the busy 33,767-33,028 area that is set by the June 21, 2021 low, the 50% Fibonacci retracement and the 200-day SMA respectively.
To sum up, the repeated failures at 34,280 appear to have confused the US 30 bulls. The current range-trading mode is an opportunity for them to formulate their strategy, especially as the path of least resistance appears to favour the bears.
CAD Recoups Losses
USD/CAD grinds major support
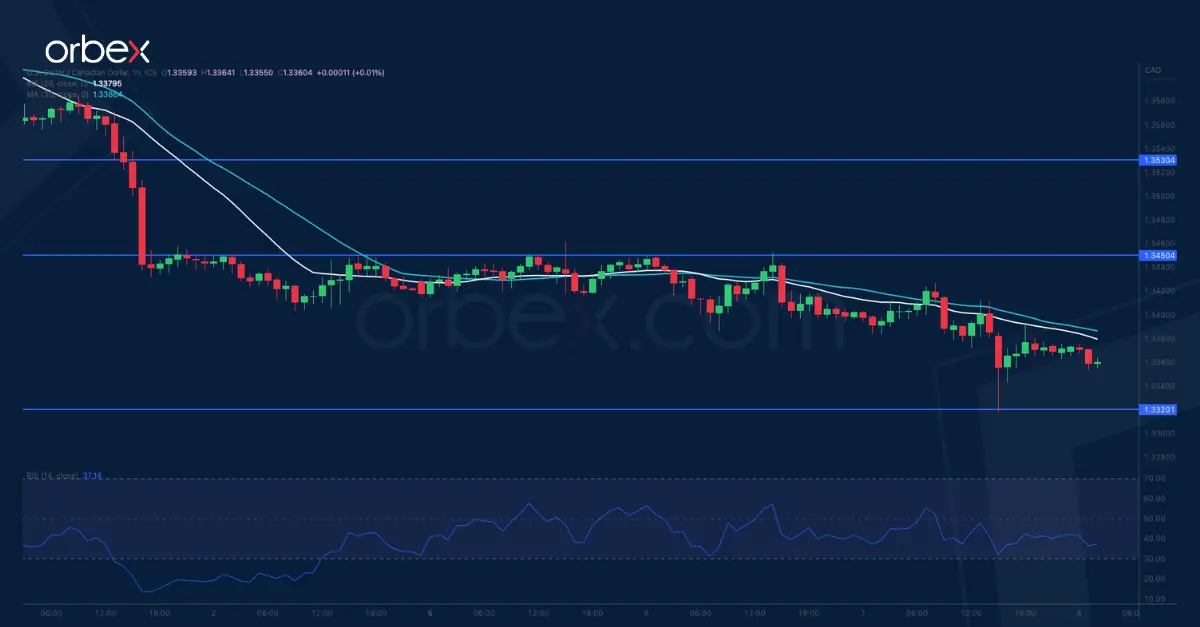
The Canadian dollar soared as the BoC resumed its tightening campaign with another 25-basis point rate hike. A drop below 1.3500 has broken the pair’s upward momentum and prompted short-term bulls to bail out. The double bottom at 1.3320 on the daily chart is a critical floor to keep the greenback afloat as its breach would expose November’s low of 1.3230, a close call for a bearish reversal to 1.3000. 1.3450 is the first resistance and then the bulls must clear the supply zone around 1.3530 before a bounce could take hold.
XAU/USD hits resistance
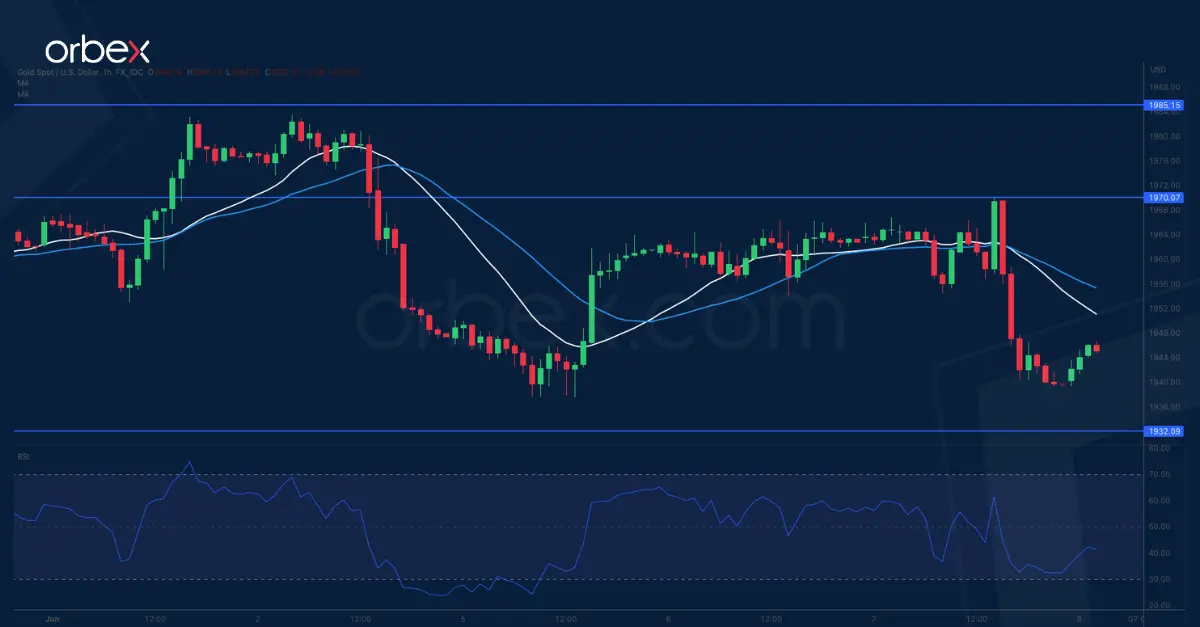
Gold slides as traders price for more US Fed rate hikes following the BoC’s hawkish turn. Sentiment is struggling to remain upbeat from the medium-term perspective as the price continues to give up its gains from the March rally. A limited bounce has met strong resistance at 1985 which sits at the confluence of a former demand zone on the daily chart and the 20-day SMA. A fall below 1932 would trigger a new round of sell-off to 1870. 1970 is a fresh resistance and the bulls must clear 1985 before they can hope for a recovery.
US Oil bounces back
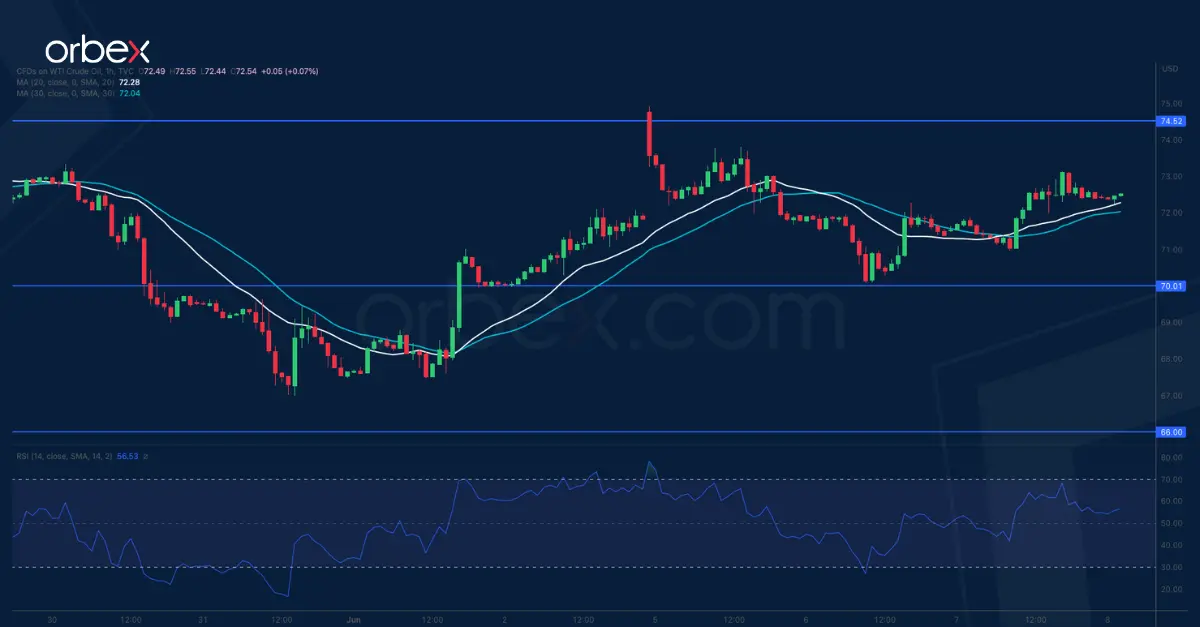
WTI crude bounces higher over Saudi Arabia's decision on more output cuts. The price has found support at the psychological level of 70.00 at the base of the latest breakout rally. The bounce suggests that buyers may have made their way back from a double bottom (66.00) on the daily chart. A break above the previous swing high of 74.50 may attract momentum buyers and put the commodity on a bullish trajectory with 80.00 as a potential target. On the downside, a slip below 70.00 would again expose the floor at 66.00.
Eager to Find If Core Bonds Remain in Sell-off Mode
Markets
The Bank of Canada yesterday joined the Reserve Bank of Australia in starting a second leg of the policy normalization cycle after a premature pause (see below). Monetary policy just wasn’t sufficiently restrictive enough to bring supply and demand back in balance and return inflation sustainably to the 2% target. The Fed gets a free analysis as it contemplates engineering its own pause at next week’s meeting: US economic growth is slowing, although consumer spending remains surprisingly resilient and the labour market is still tight. On top financial conditions have tightened back to those seen before the failures in the US and Switzerland. Have it your way Powell and co, but don’t mind the “told ya” afterwards. US Treasuries sold off after the BoC decision which was only 50% discounted in Canadian money markets. Interestingly, the very long end of the curve underperformed. At the front end, investors remain convinced (rightly so) that the Fed won’t alter earlier guidance of pausing the rate hike cycle. At the long end, US real rates were responsible for the move rather than inflation expectations. This might imply a repricing of how high the natural interest rate in the US will be in coming years, boosting the case for “higher for longer” instead of “a higher peak rate” for now. US yields eventually added 7.7 bps (2-yr) to 13.6 bps (10-yr). German Bunds followed US Treasuries lower with German yields rising 8-9 bps for tenors up to 10-yr and by 5 bps at the very long end of the curve. US stock markets obviously didn’t welcome the higher real rates, losing up to 1.3% for Nasdaq. The dollar failed to benefit with European rates trailing the move. EUR/USD again closed almost unaltered near 1.07. EUR/GBP was also nearly unchanged in the end at 0.86.
Asian risk sentiment was mixed this morning and doesn’t offer much guidance for the start today. The May UK RICS housing price balance unexpectedly increased, extending a bottoming out process in place since the start of the year. House price developments show a similar pattern in other countries/economies regions as well and might eventually weigh in central bank decision making processes. The eco calendar is razor thin further out with only US weekly jobless claims. We are eager to find if core bonds remain in sell-off mode in the run-up to/putting pressure on Fed/ECB policy meetings next week.
News Headlines
The Bank of Canada yesterday resumed its hiking cycle by raising the policy rate by 25 bps to 4.75%, the highest in 22 year. The BoC also continues its quantitative tightening. The Canadian central bank had paused its hiking cycle since January to assess the impact of previous tightening on prices and activity. However, Q1 growth was stronger than expected (3.1% Q/Qa). The BoC acknowledged that consumer spending was surprisingly strong and broad-based. Demand for services, but also for interest sensitive goods increased. Recently, even housing activity had picked up again. The labour market remains strong. Concluding: excess demand is more persistent than expected. Inflation in April ticked up to 4.4%. The BoC expects inflation to ease to around 3% in summer, but with core inflation holding in the 3.5-4% range and excess demand to continue, concerns increased that CPI could get stuck above the 2% target, justifying the case for additional tightening. The 2-yr Canadian government bond yield jumped almost 20 bps (4.58%). Markets expect an additional rate hike in July or at the latest in September. The loonie initially strengthened from near USD/CAD 1.34 to the 1.333 area, but currently again trades in the 1.3365 area.
The National Bank of Poland left its policy rate unchanged at 6.75% on Tuesday. At the press conference yesterday, governor Glapinski held a (modestly) dovish tone. The NBP governor expects inflation (also core) to continue to decline quickly in the coming months and the decline in prices is spreading across categories beyond food and energy. Inflation is developing along that path the NBP expected and might slow to single digit levels in September. If the central bank can be sure that inflation will continue to fall in the coming quarters, this opens the opportunity for rate cuts. The NBP governor sees a good chance for the economy to make a soft landing, avoiding a recession. In this respect, he expects real wages to be positive from H2 2023. Markets discount the start of rate cuts in autumn. After testing the strongest levels against the euro since mid-2021, the zloty lost modest ground to EUR/PLN 4.49.
Higher Yields Amid Surprise Hike from Bank of Canada
Market movers today
It will be another quiet data day in terms of economic data. US weekly jobless claims are due.
In Sweden, the SNDO publishes May figures for the Swedish budget balance, see more below.
The 60 second overview
Germany: Hard data for the German manufacturing sector was less bleak than recent PMIs as industrial production increased 0.3% mom in April. It was a smaller increase than expected, but at the same time March was revised higher. Soft data continues to suggest weak months ahead, though.
OECD: The OECD delivered yet another fairly rosy outlook for the global economy. A slowdown on the horizon without many repercussions for the labour market, but also with a continued too high inflation pressure. We agree that a gradual slowdown largely seems like the most likely scenario, even if risks to the growth outlook are largely skewed to the downside. However, the 23/24 growth outlook of 0.9/1.5% for the euro area and 1.6/1.0% for the US still seems too optimistic to us.
Bank of Canada hiked its overnight rate to a 22-year high of 4.75% yesterday, reflecting our view that monetary policy was not sufficiently restrictive. This was the first hike since January and markets price in another hike next month. US treasury yields traded higher on the back of the decision with 10-years 9 bps higher, which also spilled over to Europe.
Equities: Equities were mixed on Wednesday. Stoxx 600 -0.2%, S&P 500 -0.4% but small cap Russell 2000 surged 1.8%. Alike the past week, sector performance has grown to new sectors. Energy, real estate and industrials were some of the outperformers yesterday. We see the increased breadth as a good signal for the strength of this bull market. Another strong signal is the VIX which remained at ultra-low levels of 14 (!) yesterday. It is very seldom that volatility drops this low in a short-lasting equity rally.
FI: We have now seen two central banks raising rates unexpectedly - Royal Bank of Australia (RBA) and Bank of Canada (BoC). They both tightened monetary policy with a rate hike of 25bp citing higher inflation (RBA) and overheating economy (BoC). Next week we have both the Federal Reserve as well as ECB, where the Federal Reserve is expected to pause, while ECB is expected to hike with 25bp.
FX: CAD rallied after Bank of Canada surprised markets and hiked policy rates. EUR/USD continues to hover around the 1.07 level - mind the upcoming tightening of USD liquidity conditions for a potential trigger for a move lower. Scandies continue to trade on a weak footing with EUR/SEK flirting with the 11.70 level.
Credit: Credit markets were relatively quiet yesterday though with a slight widening tendency. iTraxx Xover closed 3.5bp wider and Main 0.8bp.
Nordic macro
The SNDO publishes May figures for the Swedish budget balance. Their own forecast from two weeks ago indicates a surplus of SEK23.2bn. The 2023 full-year forecast was revised higher to a deficit of SEK15bn (up from SEK42bn) as tax revenues have surprised positively thus far into the year.
Surprise BoC Hike Fuels Hawks Around the World
Uh oh. The surprise 25bp hike from the Bank of Canada (BoC) yesterday sent shockwaves across the financial markets. BoC decision to resume its rate hikes after a two-meeting pause and the surprise 25bp from the Reserve Bank of Australia (RBA) a day earlier fueled the central bank hawks around the world and boosted the Federal Reserve (Fed) rate hike expectations as well.
Now it’s important to note that the US Fed isn’t a fan of this kind of surprises, so the pricing of expectations before meetings are generally accurate. Activity on Fed funds futures now gives around one third chance of a 25bp hike at June meeting, and a two thirds chance for at least a 25bp hike when the FOMC meets in July.
As a result, the US 2-year yield, which captures the Fed rate expectations is under a renewed pressure above the 4.50% mark, while the US 10-year yield is around 3.80%.
If the Fed expectations become more hawkish, we will likely see the 2-year yield headed to 5%, but the upside potential in the 10-year yield is much less, as the aggressive rate hikes coming from once-too-patient-but-now-impatient policymakers will push the world economy into a deeper chaos in H2, Higher recession odds for a potentially deeper recession will inevitably resurface and further widen the gap between the 2 and 10-year papers.
What does Russell 2000 try to tell us?
The surprise RBA and BoC hikes, and the rising yields are bearish for stock valuations. The TSX gave back 0.36% yesterday, the S&P500 rebounded lower by a similar amousummer’sm last summer peak levels, while the rate-sensitive Nasdaq dived 1.75%, as the overbought names of the past weeks, like Nvidia for example, were rapidly sold to lock in profits. Nvidia lost more than 3% yesterday.
But the Russell 2000, which has underperformed the S&P500 and Big Tech stocks since the bank crisis, jumped almost 2.50% yesterday after a 2.70% gain recorded the day before. According to the Bear Traps Report, there have been only two days since 1990 when the S&P500 gained less than 0.25% and the Russell 2000 jumped more than 2.5%.
Note that, the Russell 200 rally doesn’t mean that small caps could better weather the rising rates, on the contrary, small companies are more vulnerable to the rising rates and tightening credit conditions, but the surprise small cap rally could be a sign that the rally in Big Tech has certainly gone too far, and there is some rebalancing happening in the portfolios.
FX and commo
The US dollar consolidates near the highest levels since mid-March, but hawkish bets for other major central banks keep the dollar’s upside potential limited at the current levels. The EURUSD remains bid around the 1.07 level, Cable bulls aim at the 50-DMA, near 1.2460, for a further rise toward the 1.25 mark, while the USDJPY finds sellers at the 140 level. The data released this morning hinted at a higher Japanese trade surplus in April, while the Q1 growth was revised higher.
In Turkey, the lira lost 7% against the US dollar yesterday, as the Treasury and Finance Ministry, under the leadership of freshly appointed Mehmet Simsek asked the central bank to wane its FX interventions. Interventions apparently resumed after the USDTRY hit the 23 mark, yet the recent jitters in the Turkish lira is a sign that Turkey will abandon its costly and unsustainably FX interventions. The risks for USDTRY are tilted to the upside and the pair could easily jump to 30/35 if left trade free.
Elsewhere, gold is also under the pressure of rising yields and strong US dollar. The price of an ounce is testing the 100-DMA, near the $1940 level, to the downside and the selloff could accelerate if support is taken out. The next reasonable target for gold bears is $1905, the major 38.2% Fibonacci retracement on November to May rally, and which should distinguish between the actual positive medium term trend, and a bearish reversal.
In energy, US crude recovered past the $73pb yesterday as the EIA data revealed a surprise 500K barrels decline in US crude inventories last week. But rising rates, tightening financial conditions and rising recession worries are bearish for oil, which – on top – failed to capitalize on OPEC output cut earlier this week. Risks remain tilted to the downside. Expect strong resistance into the 50-DMA, which stands a touch below the $75pb level, with a possible return below the $70pb level.
Technical Outlook and Review
DXY:
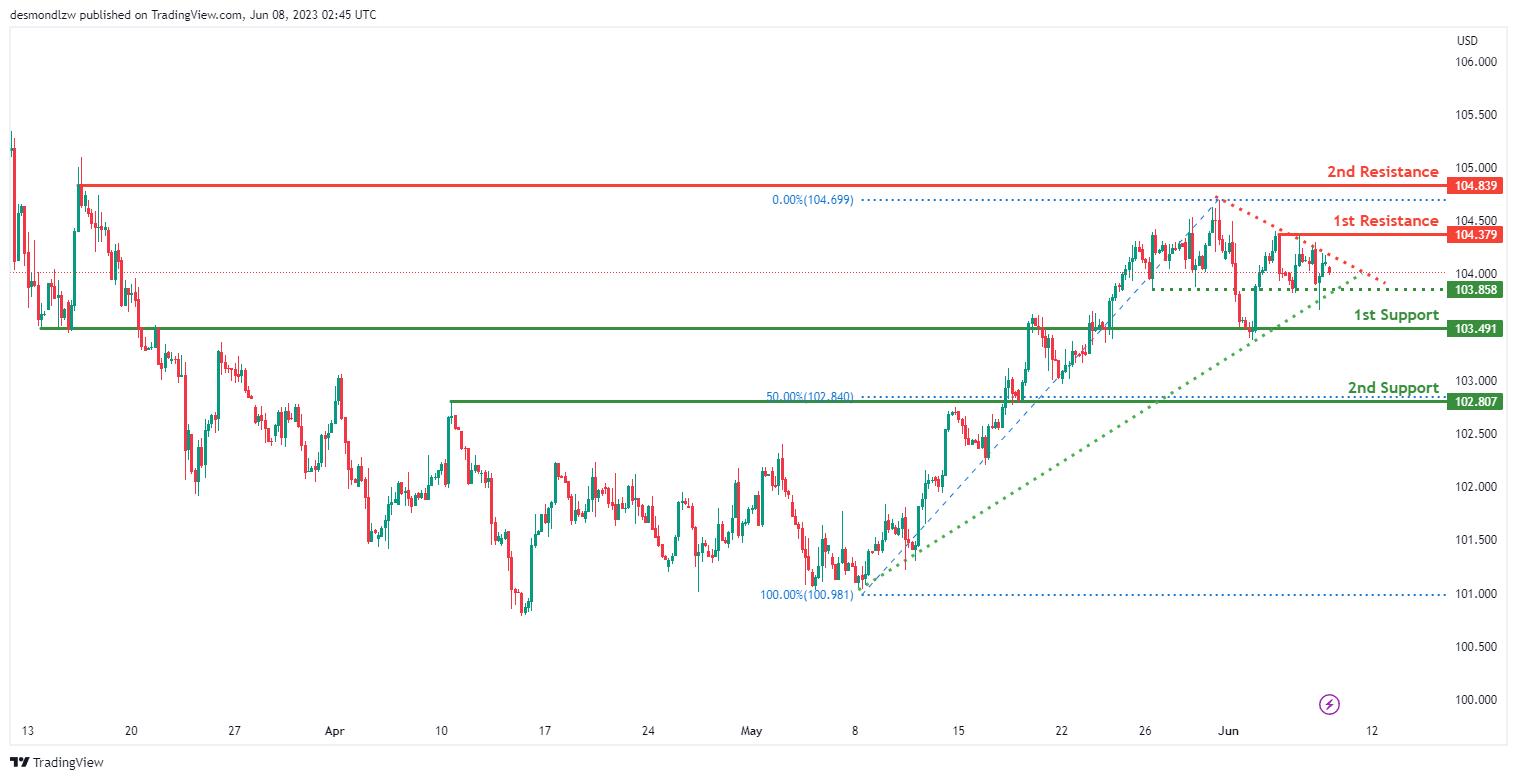
The DXY (US Dollar Index) chart currently shows a neutral momentum, suggesting a lack of clear direction in the market.
Considering this neutral momentum, the price could potentially fluctuate between the first support level at 103.49 and the first resistance level at 104.37.
The first support at 103.49 is identified as an overlap support, while the second support at 102.80 serves as a pullback support, coinciding with the 50% Fibonacci retracement.
On the upside, the first resistance at 104.37 is a multi-swing high resistance, and the second resistance at 104.83 acts as a swing high resistance.
Additionally, the intermediate support at 103.85 serves as a pullback support.
Furthermore, the chart displays a symmetrical triangle pattern, representing a period of consolidation. A breakout above the upper trendline could indicate a bullish breakout, while a breakdown below the lower trendline may suggest a bearish breakdown.
EUR/USD:
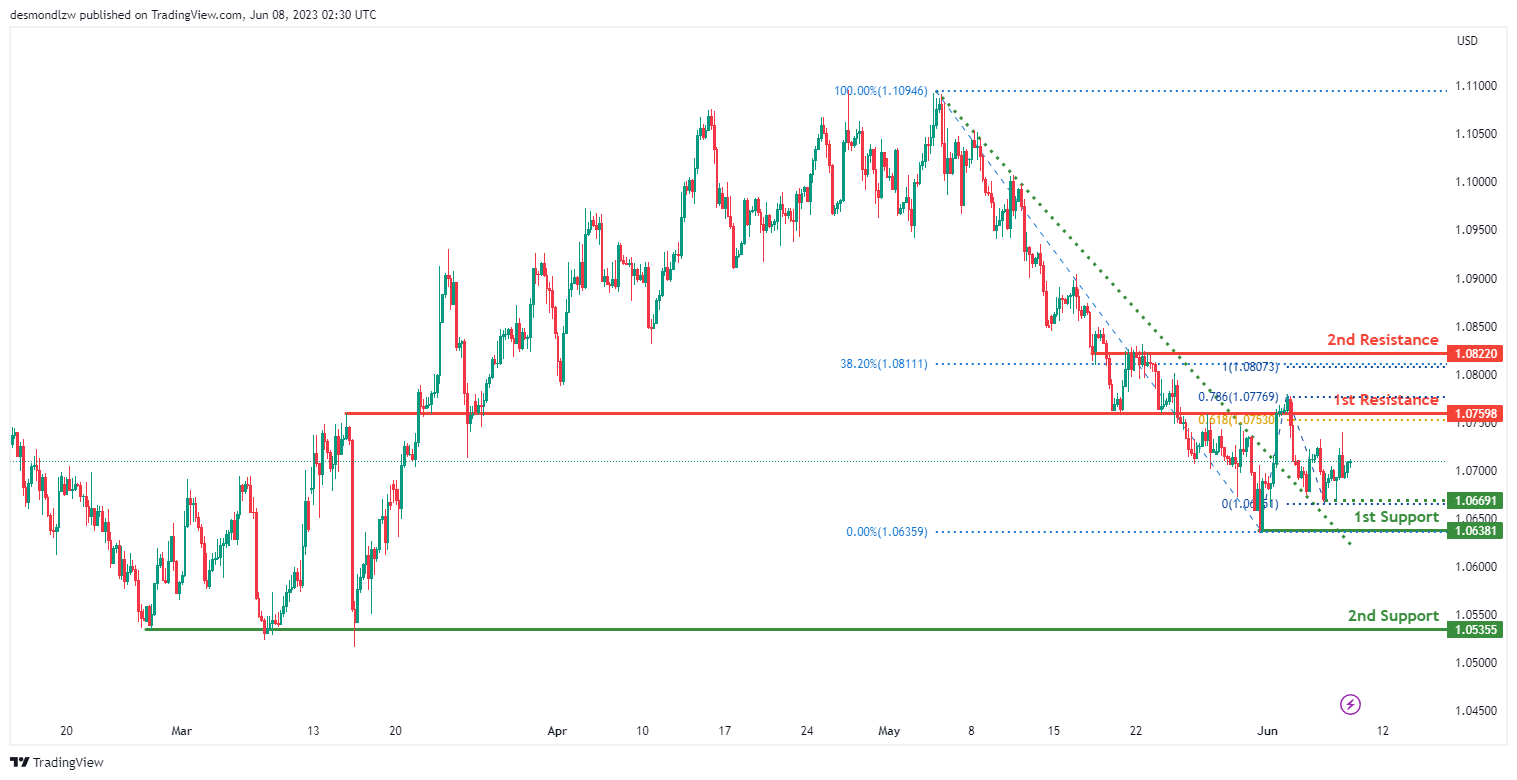
The EUR/USD chart currently demonstrates bullish momentum as the price broke above a descending resistance line, indicating a potential bullish move.
Considering this momentum, there is a possibility that the price may continue its upward trend towards the first resistance level at 1.0759. This level is identified as an overlap resistance and is supported by the 61.80% Fibonacci projection.
Support levels include the first support at 1.0638, representing a swing low support, and the second support at 1.0535, acting as a multi-swing low support.
Furthermore, the second resistance level at 1.0822 is recognized as an overlap resistance and aligns with the 38.20% Fibonacci retracement and 100% Fibonacci projection, making it a notable level to watch.
An intermediate support level at 1.0669 is also identified as a multi-swing low support, adding to its significance.
GBP/USD:
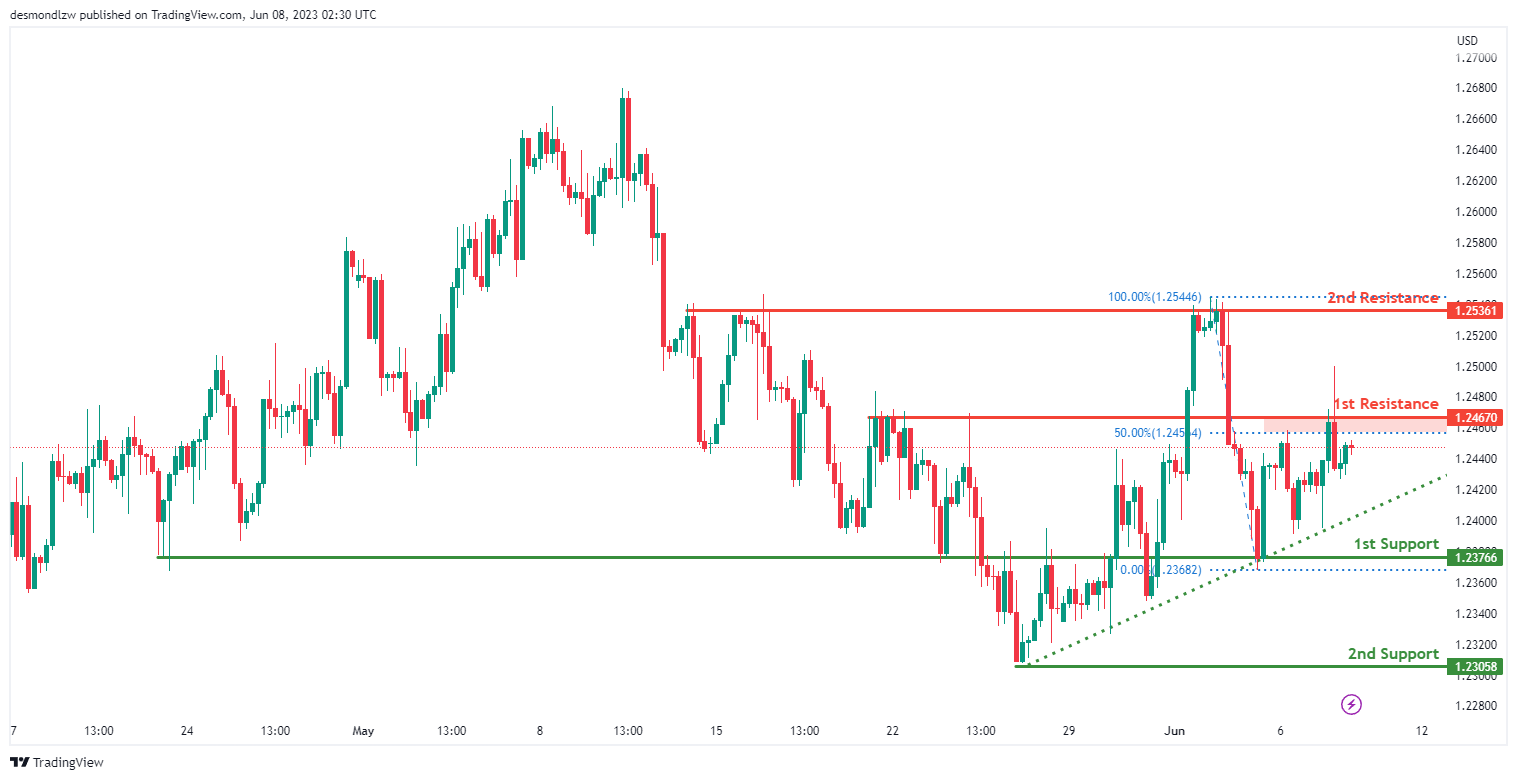
The GBP/USD chart currently demonstrates bullish momentum as the price remains above a major ascending trend line, suggesting the potential for further upward movement.
Considering this momentum, there is a possibility that the price may continue its bullish trend towards the first resistance level at 1.2467. This level is identified as an overlap resistance and is supported by the 50% Fibonacci retracement.
Support levels include the first support at 1.2376 and the second support at 1.2305, both representing swing low supports.
Furthermore, the second resistance level at 1.2536 is recognized as a multi-swing high resistance, adding to its significance as a potential barrier to further upward price movement.
USD/CHF:
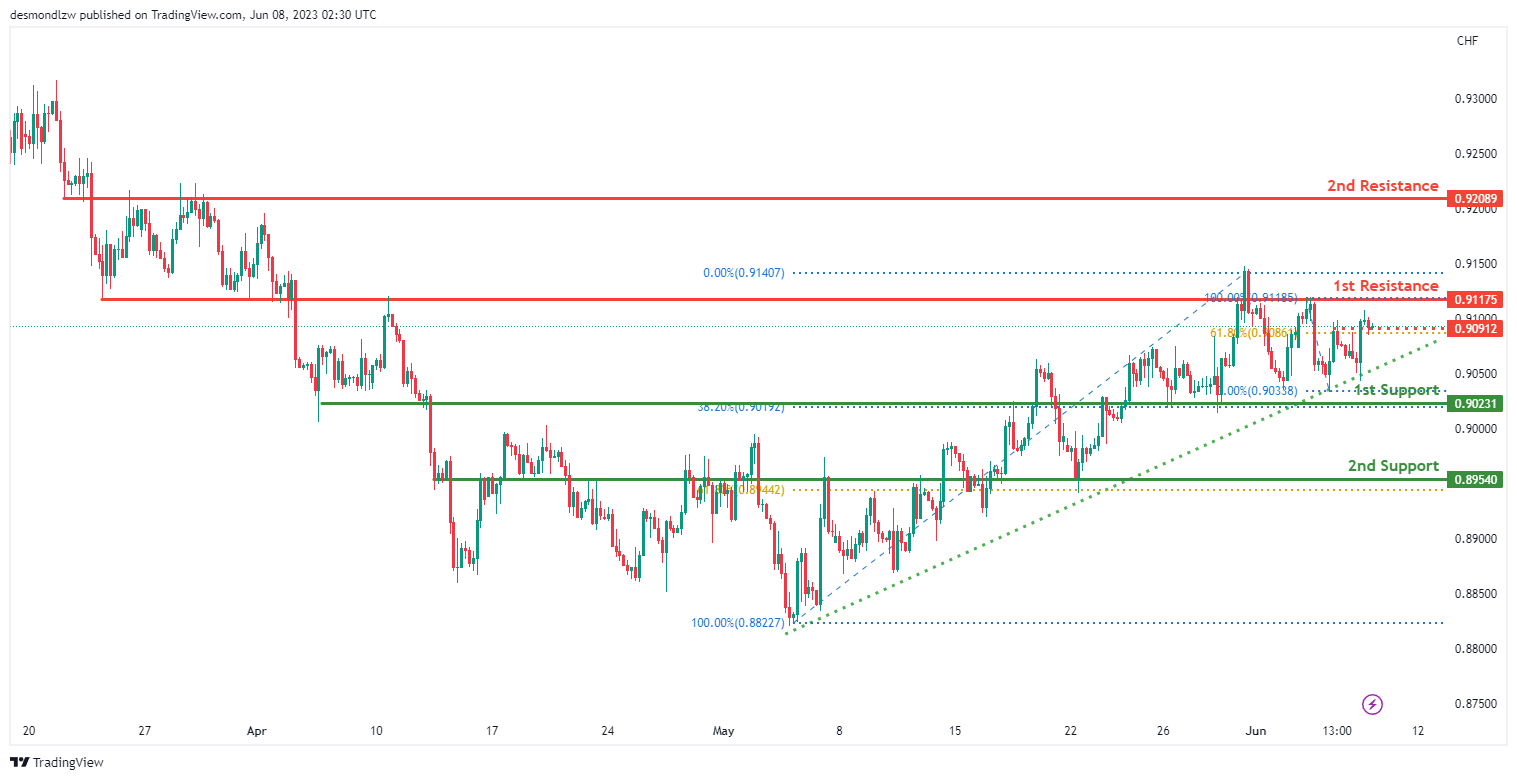
The USD/CHF chart demonstrates a bullish momentum, with the price above a major ascending trend line, suggesting the potential for further upward movement.
Considering this momentum, there is a possibility that the price could continue its bullish trend towards the first resistance level at 0.9117, which is identified as an overlap resistance.
Support levels include the first support at 0.9023 and the second support at 0.8954. The latter support level aligns with the 61.80% Fibonacci retracement, adding to its significance.
Furthermore, an intermediate resistance level at 0.9091 is recognized as a multi-swing high resistance, further reinforcing its importance.
USD/JPY:
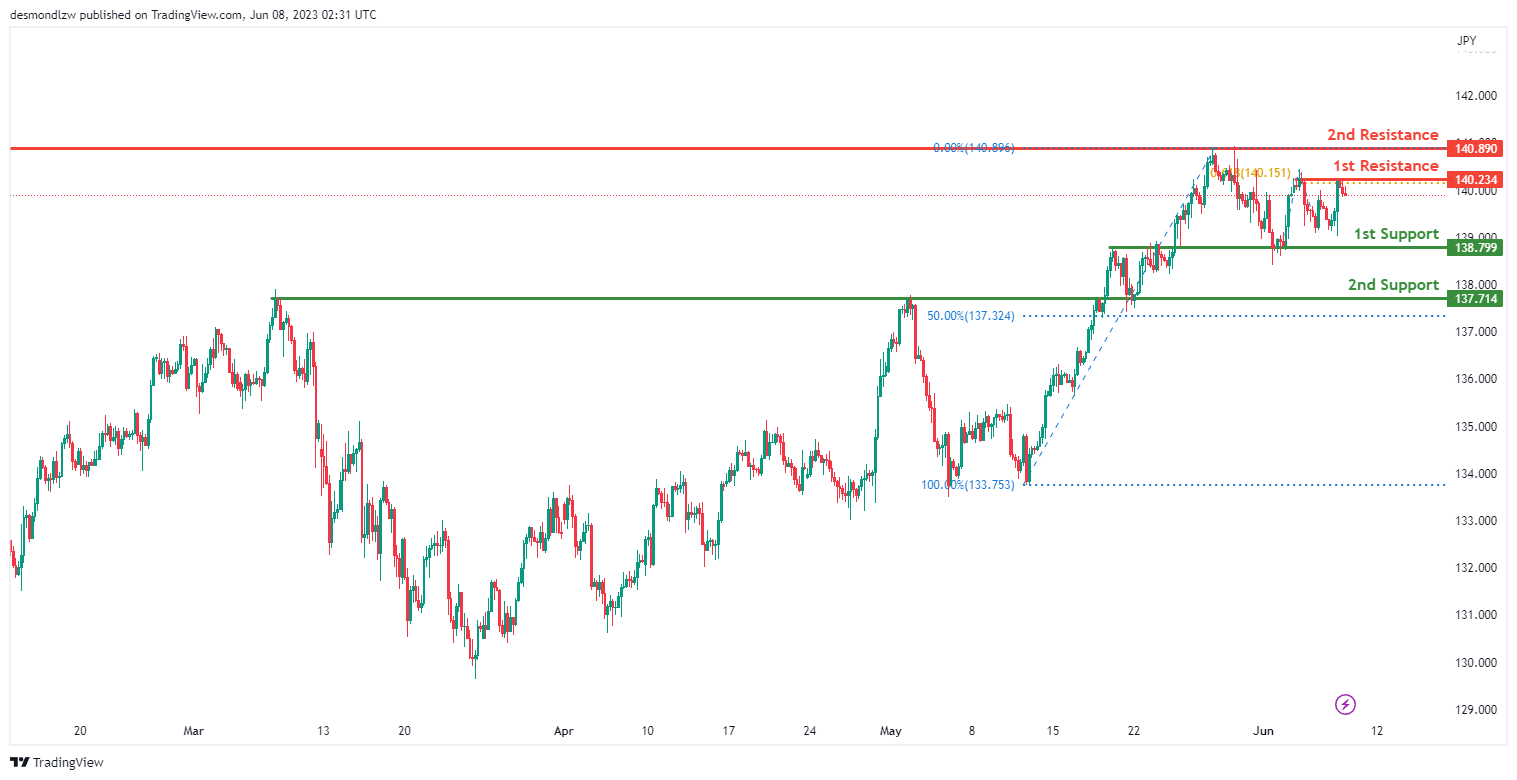
The USD/JPY chart currently indicates a neutral momentum, suggesting a lack of a clear trend in the market.
Given this neutral momentum, it is possible that the price could fluctuate within a range between the first support level at 138.79, which is an overlap support, and the first resistance level at 140.23. The resistance level is notable as a multi-swing high resistance and aligns with the 61.80% Fibonacci projection.
Additional support can be found at the second support level of 137.71, which coincides with the 50% Fibonacci retracement, potentially providing further price stability.
Furthermore, the second resistance level at 140.89 serves as a pullback resistance, potentially limiting upward price movements.
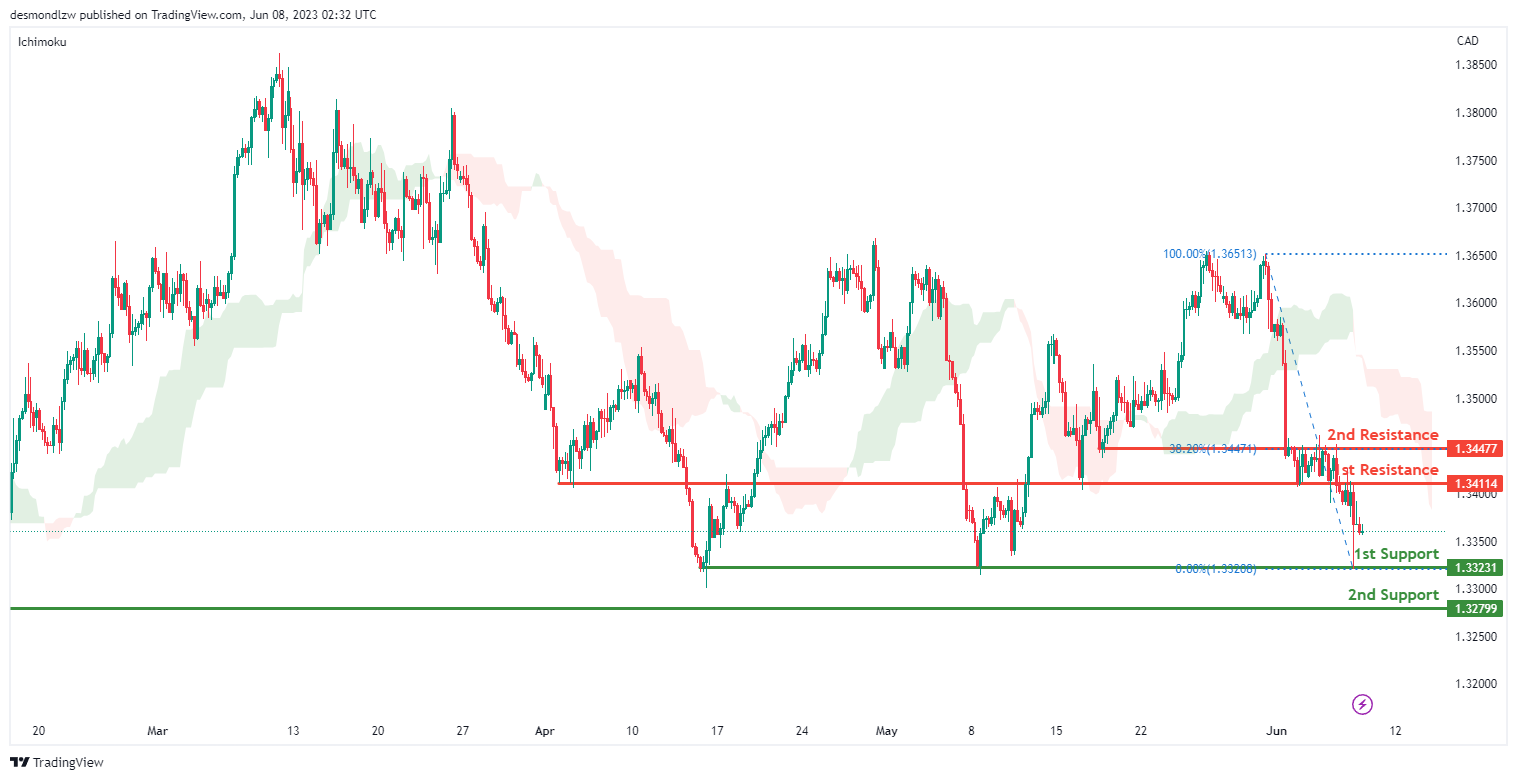
USD/CAD:
The USD/CAD chart currently demonstrates a bearish momentum, indicating a downward trend in the market.
Contributing to this bearish momentum is the fact that the price is below the bearish Ichimoku cloud, which suggests negative sentiment and potential for further downside movement.
In light of this bearish momentum, there is a possibility that the price could continue its downward trend towards the first support level at 1.3323. This level is recognized as a multi-swing low support, potentially attracting buyers to enter the market.
Furthermore, the second support level at 1.3279 also acts as a multi-swing low support, reinforcing its significance as a potential price level where buyers may provide support.
On the other hand, the first resistance level at 1.3411 is identified as an overlap resistance, potentially acting as a barrier to upward price movements.
Additionally, the second resistance level at 1.3447 is an overlap resistance and aligns with the 38.20% Fibonacci retracement level, further adding to its significance.
AUD/USD:
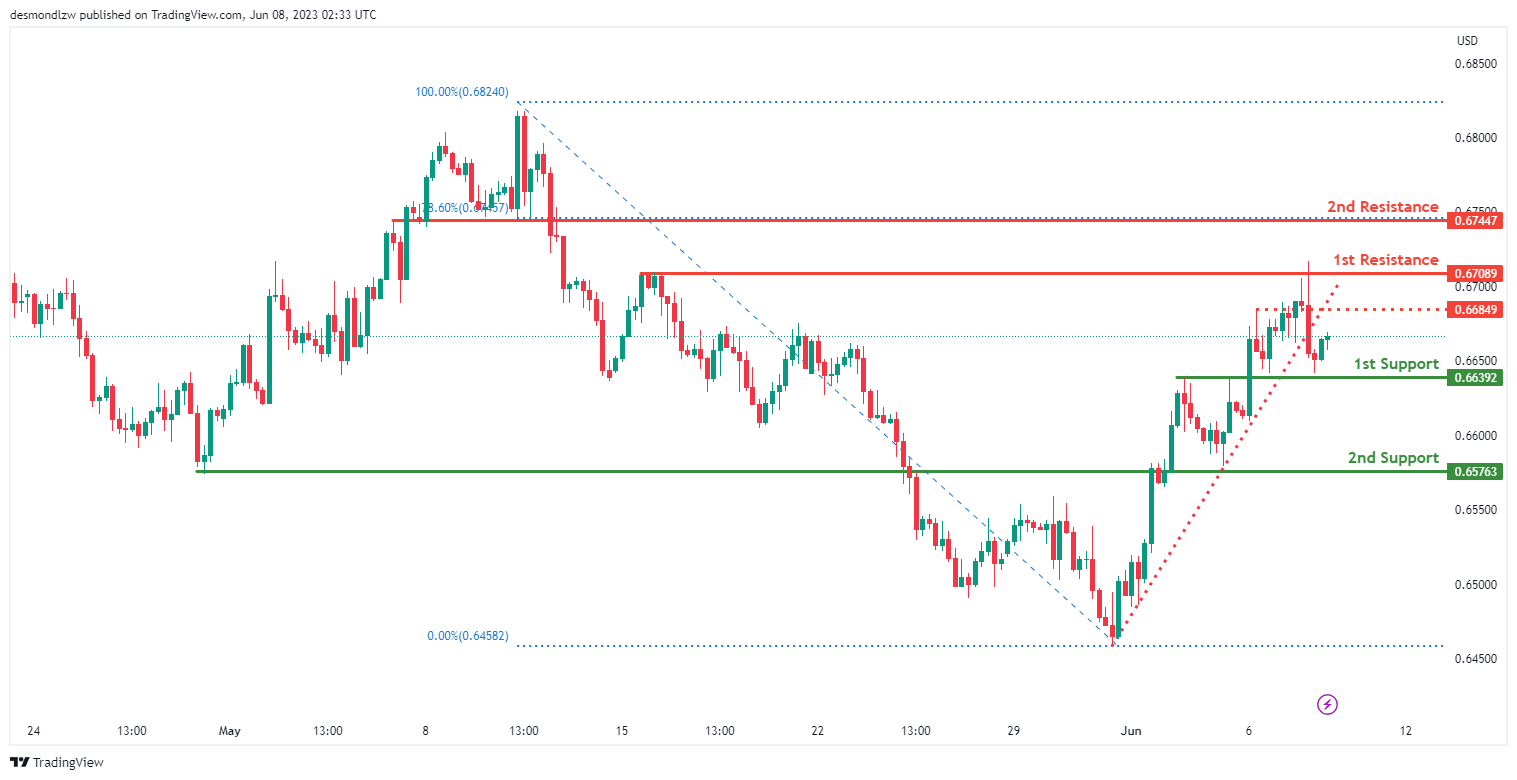
The AUD/USD chart currently exhibits a bearish momentum, indicating a downward trend in the market.
The momentum is driven by the price breaking below an ascending support line, triggering a potential bearish move.
In the short term, there is a possibility for the price to rise towards the first resistance level at 0.6708 before reversing off it and dropping towards the first support level at 0.6639.
The first support level at 0.6639 is identified as an overlap support, potentially providing a price level where buyers may enter the market.
Similarly, the second support level at 0.6576 also acts as an overlap support, further reinforcing its significance as a potential area where buyers could step in.
On the upside, the first resistance level at 0.6708 is recognized as a multi-swing high resistance.
Additionally, the second resistance level at 0.6744 serves as a pullback resistance and aligns with the 78.60% Fibonacci retracement level, adding to its importance.
NZD/USD
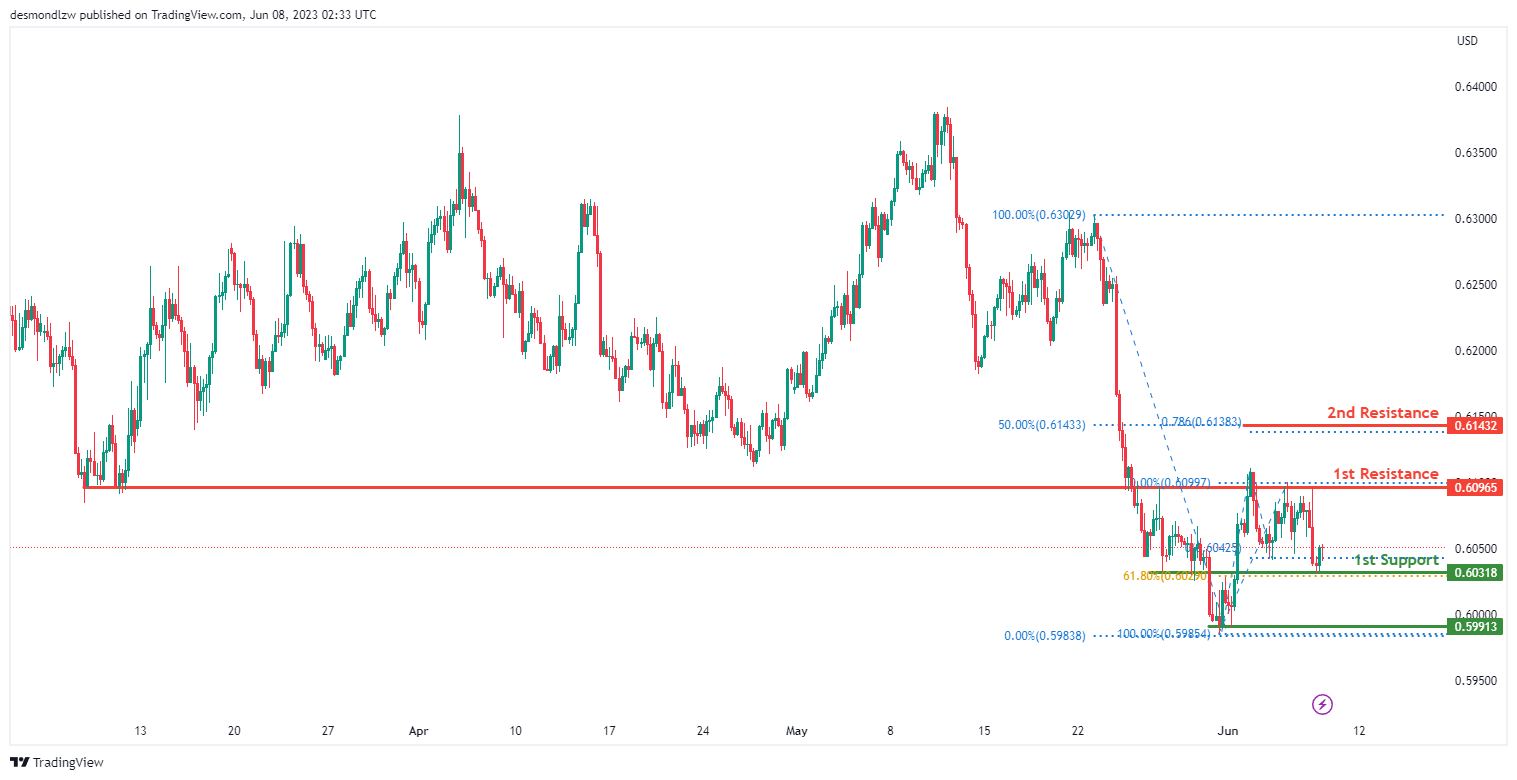
The NZD/USD chart currently demonstrates bullish momentum, indicating an upward trend in the market.
There is a potential for the price to continue its bullish movement towards the first resistance level at 0.6096.
The first support level at 0.6031 is recognized as an overlap support and is reinforced by the 61.80% Fibonacci retracement level.
Furthermore, the second support level at 0.5991 serves as a multi-swing low support.
On the upside, the first resistance level at 0.6096 is identified as an overlap resistance.
Additionally, the second resistance level at 0.6143 represents a Fibonacci confluence, aligning with both the 50% Fibonacci retracement level and the 100% Fibonacci projection.
DJ30:
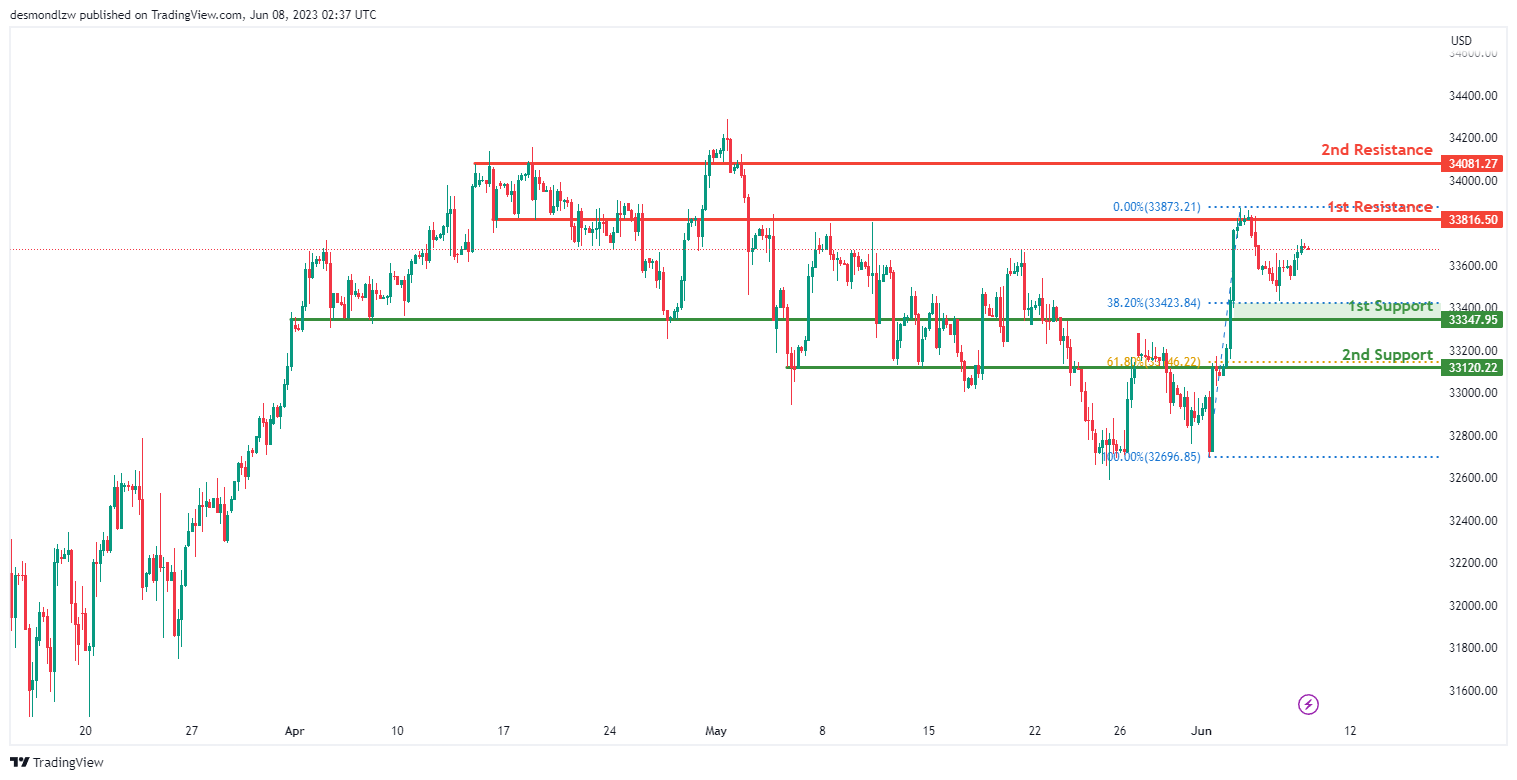
The DJ30 (Dow Jones Industrial Average) chart currently exhibits bullish momentum, indicating an upward trend in the market.
There is a possibility for the price to continue its bullish movement towards the first resistance level at 33816.50.
The first support level at 33347.95 is identified as an overlap support and aligns with the 38.20% Fibonacci retracement level, providing potential buying pressure.
Additionally, the second support level at 33120.22 is recognized as an overlap support and corresponds to the 61.80% Fibonacci retracement level, further reinforcing its significance as a potential price floor.
On the upside, the first resistance level at 33816.50 is identified as an overlap resistance.
Furthermore, the second resistance level at 34081.27 serves as a pullback resistance.
GER30:
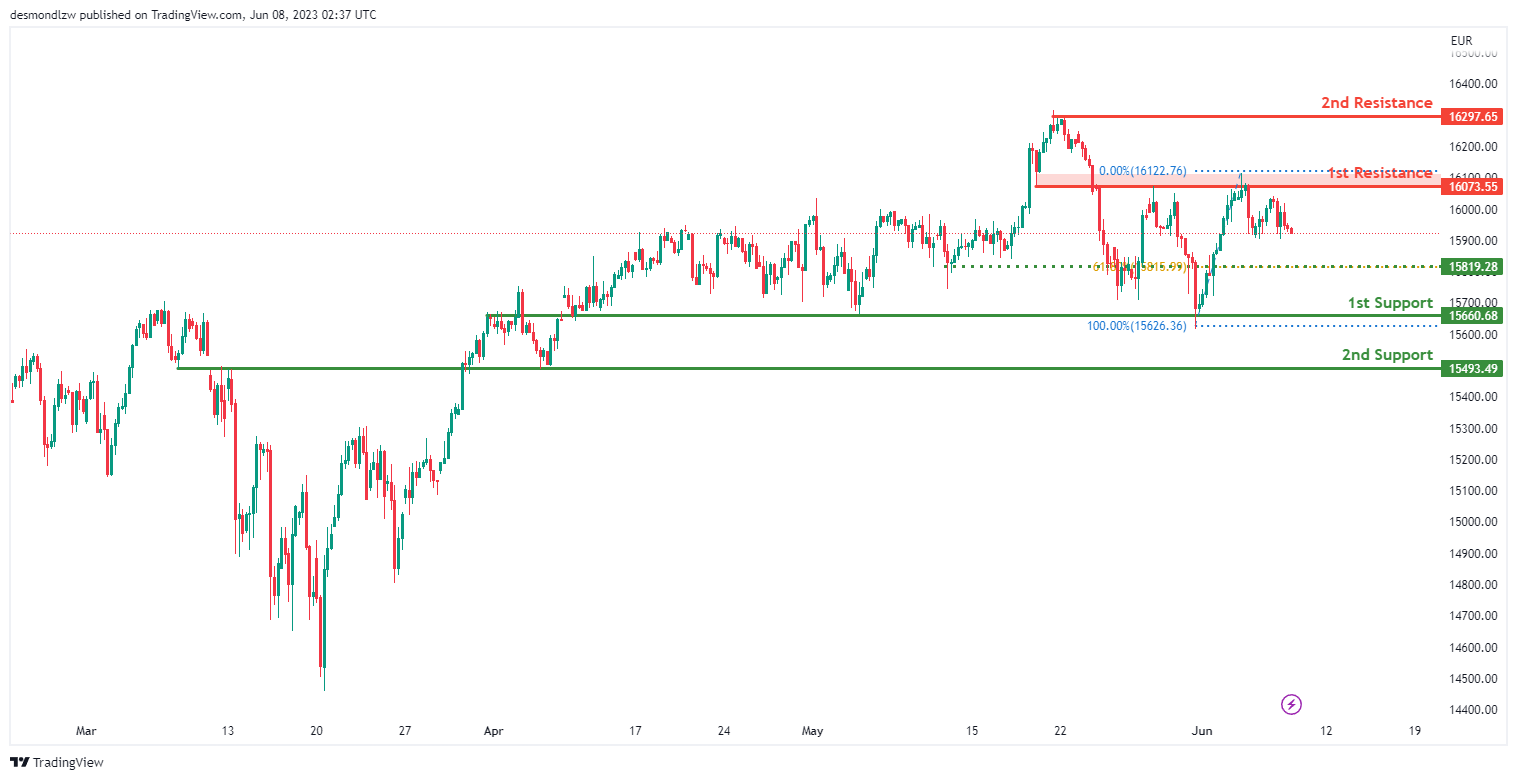
The GER30 (DAX 30) chart currently demonstrates bearish momentum, indicating a downward trend in the market.
There is a potential for the price to continue its bearish movement towards the first support level at 15660.68.
The first support level at 15660.68 is identified as an overlap support, indicating a significant area where buyers may step in.
Additionally, the second support level at 15493.49 is recognized as an overlap support, further reinforcing its importance as a potential price floor.
On the upside, the first resistance level at 16023.55 is identified as an overlap resistance.
Furthermore, the second resistance level at 16297.65 serves as a multi-swing high resistance.
US500
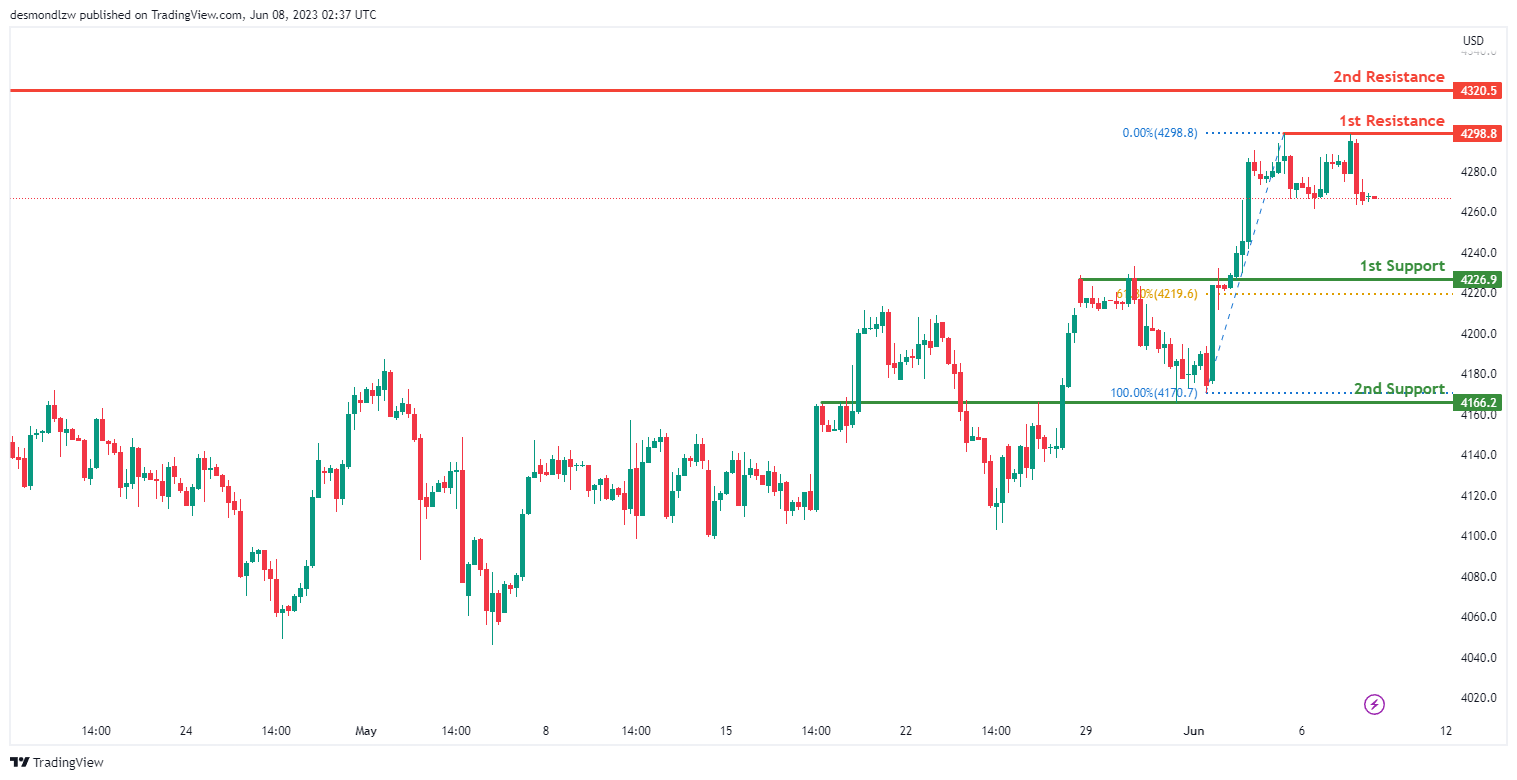
The US500 (S&P 500) chart currently exhibits bearish momentum, indicating a downward trend in the market.
There is a potential for the price to continue its bearish movement towards the first support level at 4226.90. This level is identified as pullback support and aligns with the 61.80% Fibonacci retracement, adding to its significance.
Additionally, the second support level at 4166.20 is recognized as an overlap support, further reinforcing its importance as a potential price floor.
On the upside, the first resistance level at 4298.80 is identified as a multi-swing high resistance.
Furthermore, the second resistance level at 4320.50 serves as a swing high resistance.
BTC/USD:
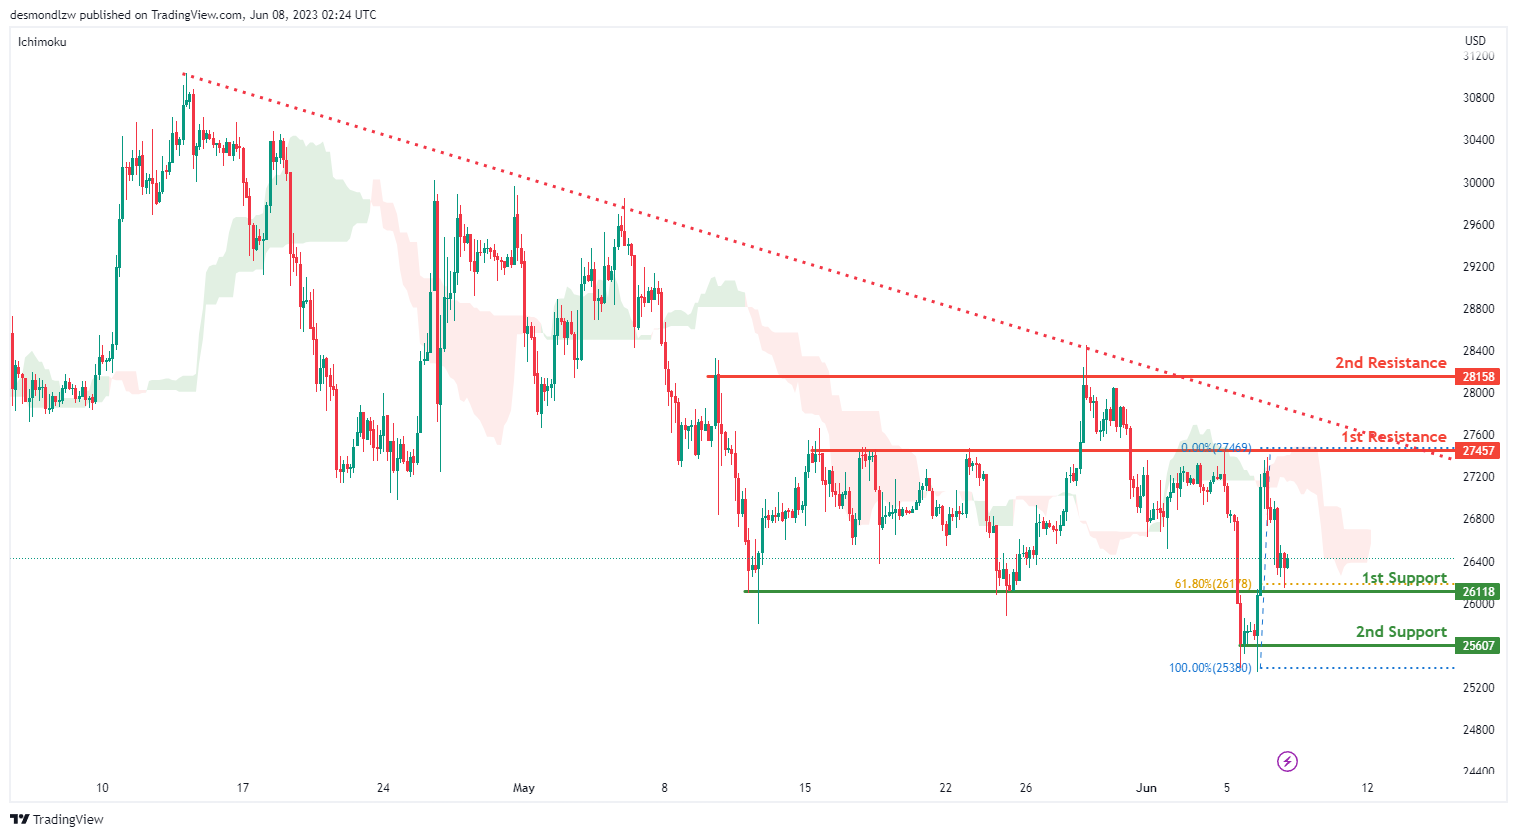
The BTC/USD (Bitcoin/US Dollar) chart currently demonstrates bearish momentum, suggesting a downward trend in the market.
There is a possibility for the price to experience a short-term rise towards the first resistance level at 27457 before reversing off it and dropping towards the first support level.
The first support level at 26118 is identified as an overlap support and aligns with the 61.80% Fibonacci retracement level, reinforcing its significance as a potential area where buyers may provide support.
Furthermore, the second support level at 25607 is recognized as a multi-swing low support, adding to its importance as a potential price level where buyers may step in.
On the upside, the first resistance level at 27457 is identified as an overlap resistance.
Additionally, the second resistance level at 28158 serves as a multi-swing high resistance.
ETH/USD:
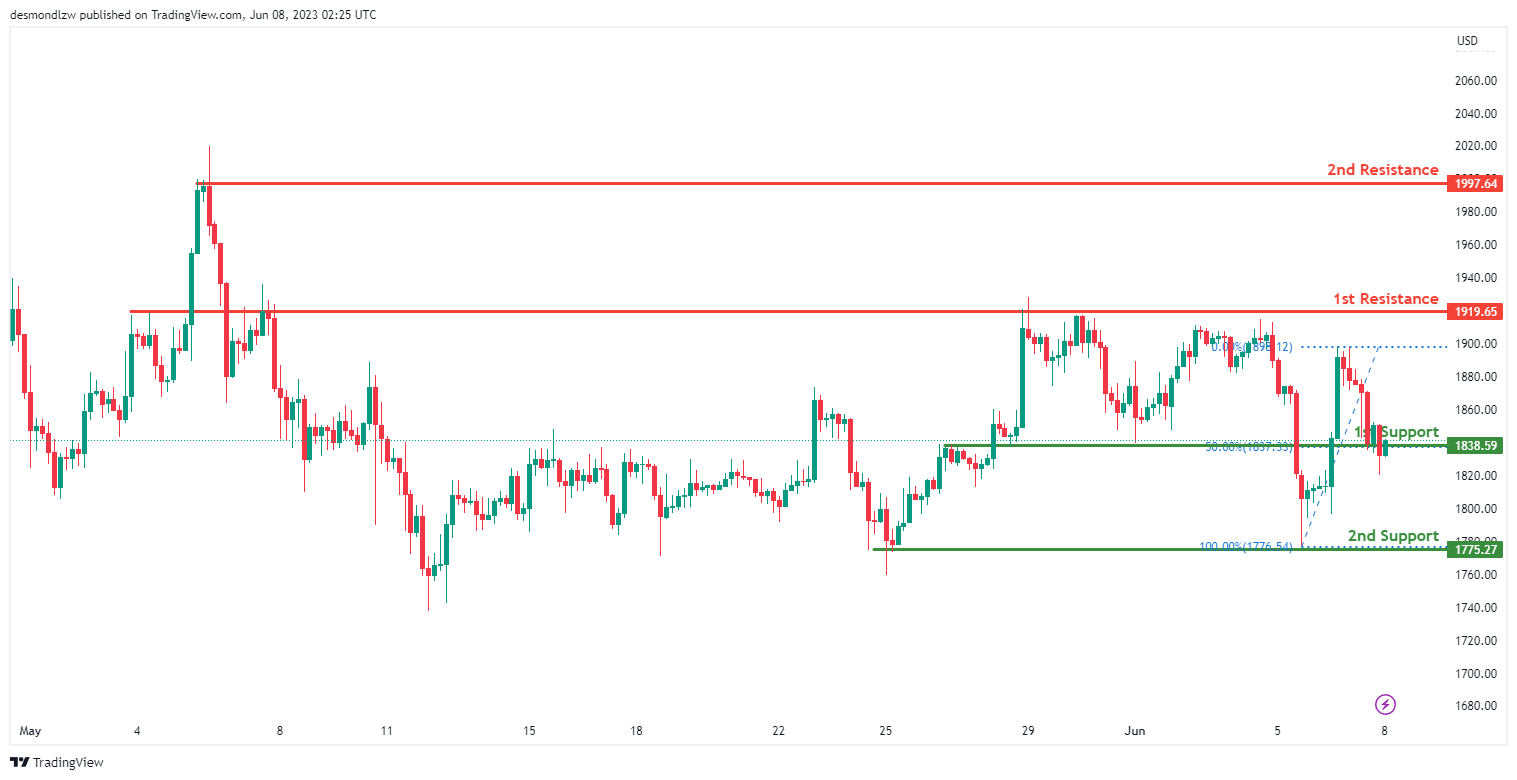
The ETH/USD (Ethereum/US Dollar) chart currently exhibits bullish momentum, indicating an upward trend in the market.
There is a potential for the price to experience a bullish bounce off the first support level at 1838.59 and head towards the first resistance level.
The first support level is identified as an overlap support and coincides with the 50% Fibonacci retracement level, strengthening its significance as a potential area where buyers may provide support.
Furthermore, the second support level at 1775.27 is recognized as a multi-swing low support, adding to its importance as a potential price level where buyers may step in.
On the upside, the first resistance level at 1919.65 is identified as an overlap resistance.
Additionally, the second resistance level at 1997.65 serves as a swing high resistance.
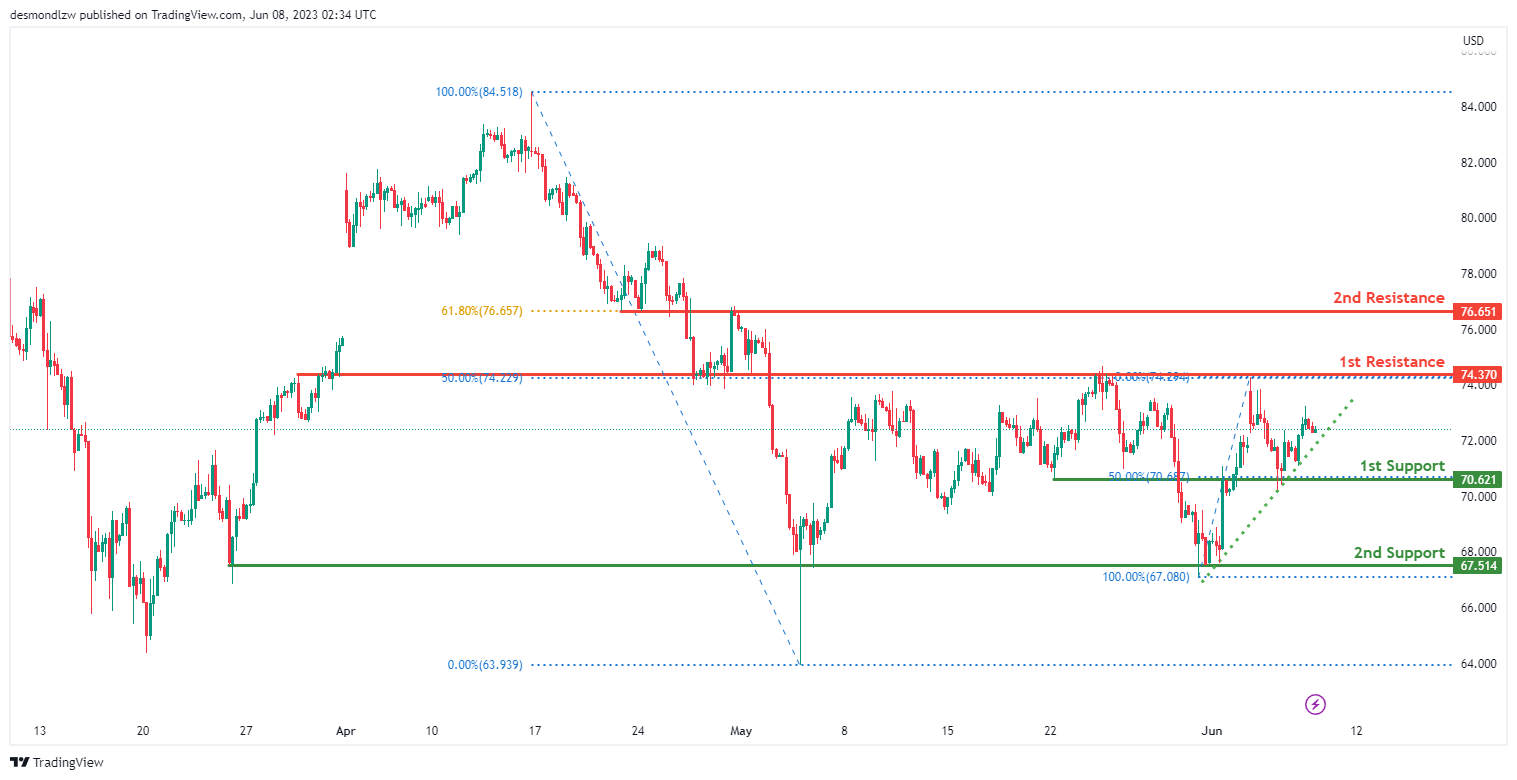
WTI/USD:
The WTI (West Texas Intermediate) chart currently demonstrates bullish momentum, indicating an upward trend in the market.
The price is above a major ascending trend line, suggesting further bullish momentum may be expected.
There is a potential for the price to experience a bullish bounce off the first support level at 70.62 and head towards the first resistance level.
The first support level is identified as an overlap support and aligns with the 50% Fibonacci retracement level, adding to its significance as a potential area where buyers may provide support.
Furthermore, the second support level at 67.51 is recognized as a multi-swing low support, reinforcing its importance as a level where buyers may step in.
On the upside, the first resistance level at 74.37 is identified as an overlap resistance.
Additionally, the second resistance level at 76.65 serves as an overlap resistance and coincides with the 61.80% Fibonacci retracement level, further enhancing its significance.
XAU/USD (GOLD):
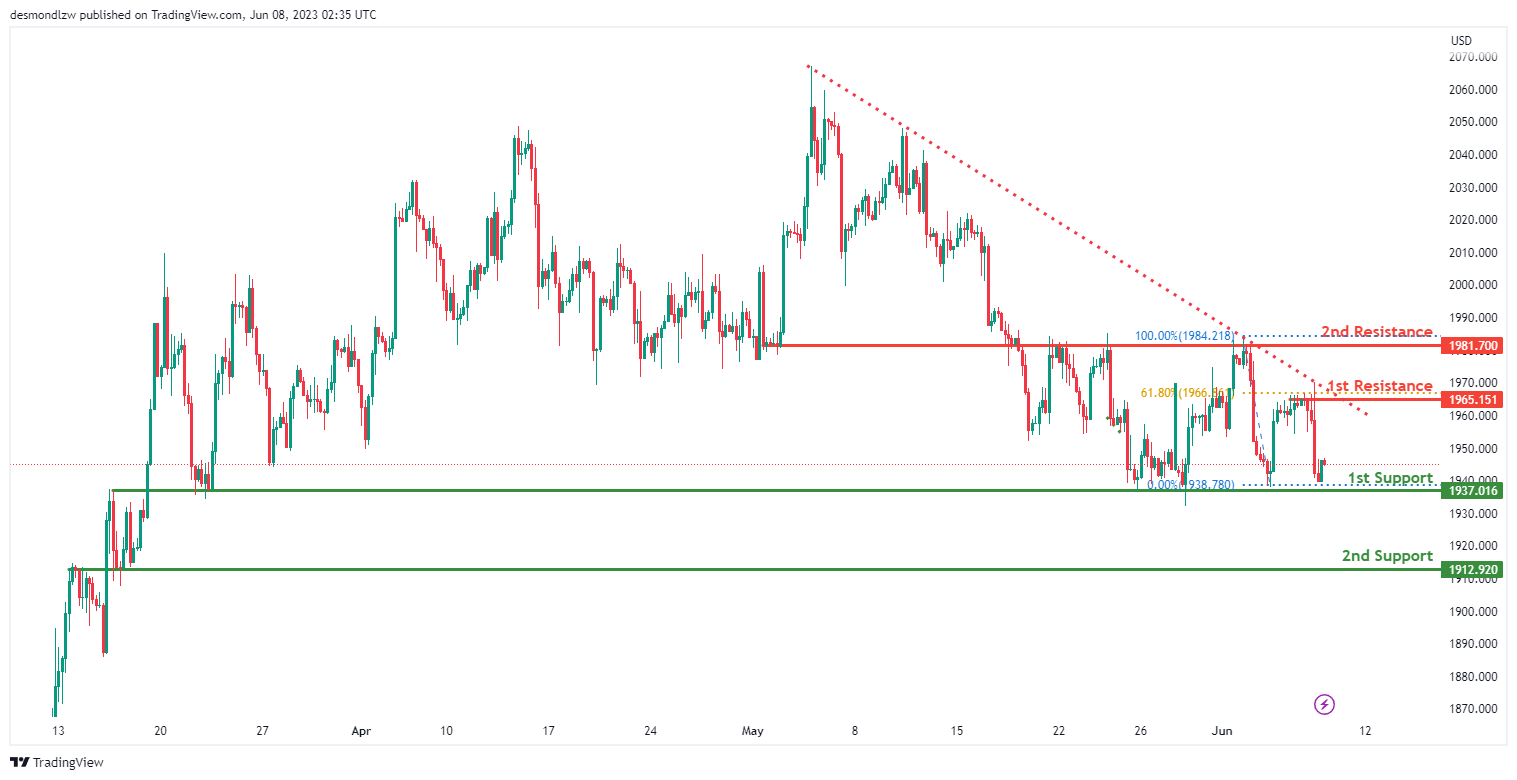
The XAU/USD (Gold/US Dollar) chart currently shows bearish momentum, indicating a downward trend in the market.
The price is below a major descending trend line, suggesting the presence of bearish momentum.
There is a potential for the price to experience a temporary rise towards the first resistance level in the short term before reversing off it and dropping towards the first support level.
The first support level at 1937.01 is identified as an overlap support, potentially providing a level where buyers may step in.
Furthermore, the second support level at 1912.92 is recognized as an overlap support, further reinforcing its significance as a potential area of buying interest.
On the upside, the first resistance level at 1965.15 is identified as a multi-swing high resistance and aligns with the 61.80% Fibonacci retracement level.
Additionally, the second resistance level at 1981.70 is an overlap resistance.
GBP/JPY Daily Outlook
Daily Pivots: (S1) 173.21; (P) 173.82; (R1) 174.98; More...
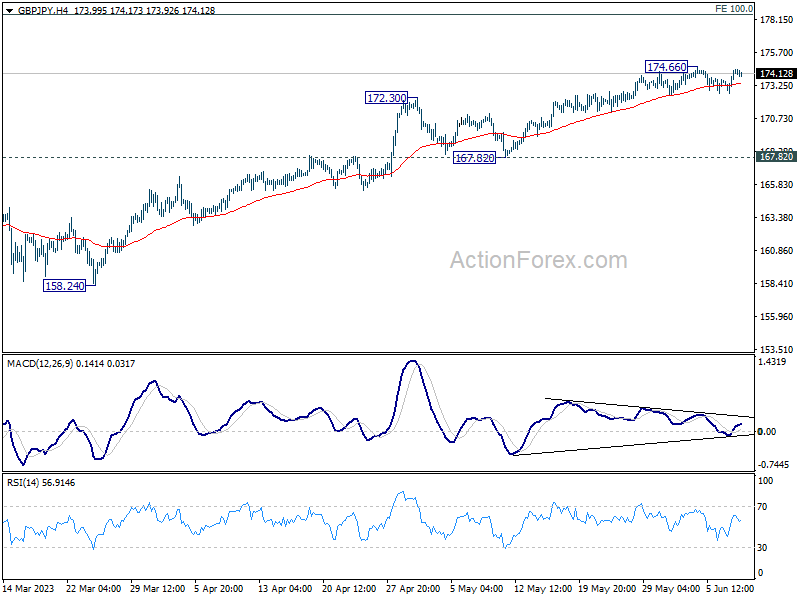
GBP/JPY is staying in consolidation from 174.66 and intraday bias remains neutral first. Deeper pull back cannot be ruled out, but outlook will stay bullish as long as 167.82 support holds. On the upside, break of 174.66 will resume larger up trend to 100% projection of 148.93 to 172.11 from 155.33 at 178.51.
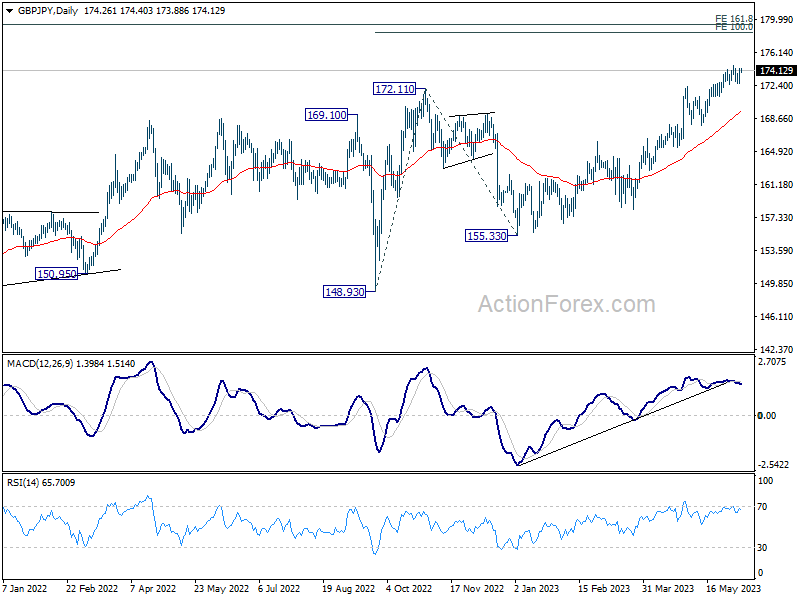
In the bigger picture, up trend from 123.94 (2020 low) is extending. Next target will be 161.8% projection of 122.75 (2016 low) to 156.59 (2018 high) from 123.94 at 178.69. For now, medium term outlook will remain bullish as long as 165.99 resistance turned support holds, even in case of deep pull back.
Currency Markets Hold Steady, AUD and CAD Strong, JPY Eyes Yields
The global forex markets are in a state of relative tranquillity today, as the dust begins to settle following two central bank surprises. With a light economic calendar on the horizon, trading activity is predicted to stay muted. Australian Dollar currently retains its pole position, closely pursued by its Canadian counterpart. However, with the release of Friday's job data, the latter has the potential to clinch the top spot for the week. New Zealand Dollar finds itself at the other end of the spectrum as the week's poorest performer, followed by Dollar and then Swiss Franc. Euro is mixed together with Yen.
Technically, though, there is risk of a more violent move in Yen today and tomorrow, subject to development in treasury yields. US 10-year yield received notable support from 55 D EMA (now at 3.602) and recovered notably this week. The development keeps near term bullish bias intact. Break of 3.859 resistance will confirm resumption of whole rise from 3.253. Further break of trend line resistance will solidify upside momentum to 4.091 resistance next. If realized, Yen pairs could follow in tandem, in particular, with USD/JPY breaking through 140.90.
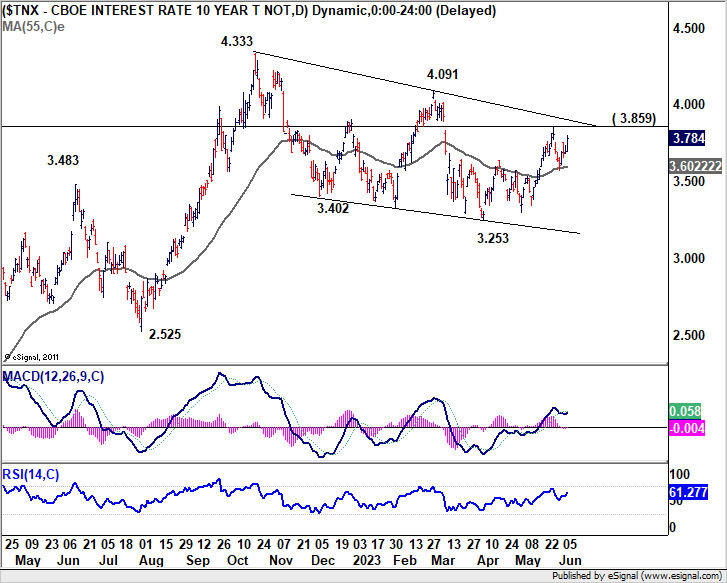
In Asia, Nikkei closed down -0.86%. Hong Kong HSI is down -0.04%. China Shanghai SSE is up 0.55%. Singapore Strait Times is down -0.22%. Japan 10-year JGB yield is up 0.436 at 0.0174. Overnight, DOW rose 0.27%. S&P 500 dropped -0.38%. NASDAQ dropped -1.29%. 10-year yield rose 0.085 to 3.784.
Top mover AUD/NZD on track to 1.1085, what next?
AUD/NZD is currently the biggest mover for the week, trading up around 1%. Near term rally from 1.0556 accelerated further after surprised RBA rate hike earlier in the week. At the same time, market participants are also factoring in the possibility of further rate hikes from RBA.
In a recent Reuters poll, a snapshot of economists' expectations reveals a divide: 16 out of 26 expect RBA to hit the pause button in August, while 10 predict another 25bps hike. Looking beyond, a majority (20 out of 26) anticipate another 25bps increase by the end of September.
There's a consensus among the major local banks - ANZ, CBA, and NAB - that a pause in July is likely, while Westpac is bracing for another 25bps bump. All four banks foresee a terminal rate of 4.35% by the close of September. However, given the uncertainty that even RBA is grappling with regarding the road ahead, these forecasts are subject to revision ahead of each upcoming meeting.
Contrarily, the question of whether RBNZ rate has already peaked at the current 5.50% is under debate. Views are split on the prospect of a further 25bps hike in August.
Technically, this week's rally should confirm that AUD/NZD's correction from 1.1085 has completed with three waves down to 1.0556. Near term outlook will stay bullish as long as 1.0881 support holds. Next target is 1.1086 resistance. Firm break there will resume whole rise from 1.0469 (2022 low) to 100% projection of 1.0469 to 1.1085 from 1.0556 at 1.1172.
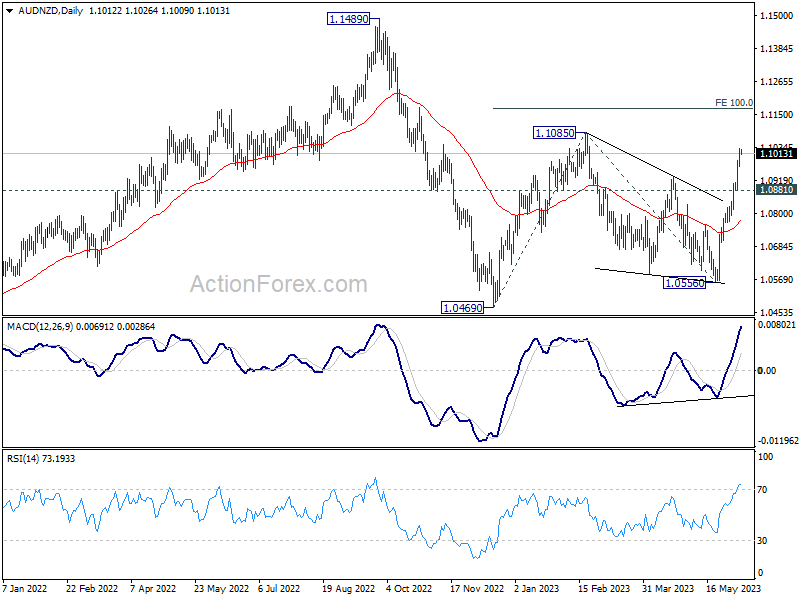
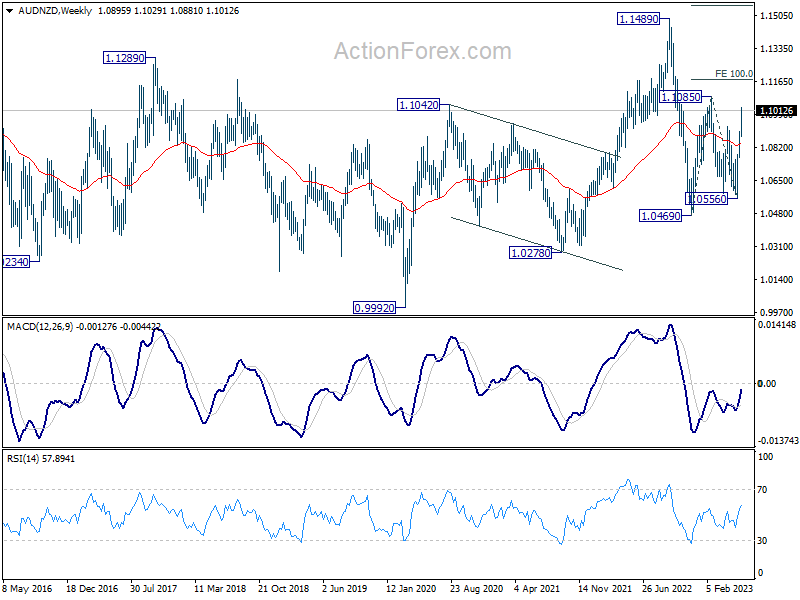
The second half of the year will likely be marked by whether AUD/NZD can hurdle this key 1.1172 projection level. Rejection at this level could frame the rise from 1.0469 as merely a corrective move, and potentially set the stage for a later resumption of overall decline from 2022 high of 1.1489 at a later stage However, a decisive break above 1.1172 could catalyze a more substantial upside move, potentially retesting 1.1489 high.
The outcome will largely hinge on the future steps of RBA and RBNZ post their next move.
USD/CAD and EUR/CAD eyeing important cluster support levels
Canadian Dollar is currently the second best performer of the week after yesterday's surprised 25bps rate hike by BoC to 4.75%. Most economists see the move after a 2-meeting pause as a "restart" of the tightening cycle rather than a "one-off". Another rate hike is now generally expected in July to bring interest rate to 5.00% level.
The biggest question is whether 5.00% is "sufficiently restrictive" enough to bring supply and demand back into balance and return inflation to 2% target. It's a big unknown for the markets as well as BoC.
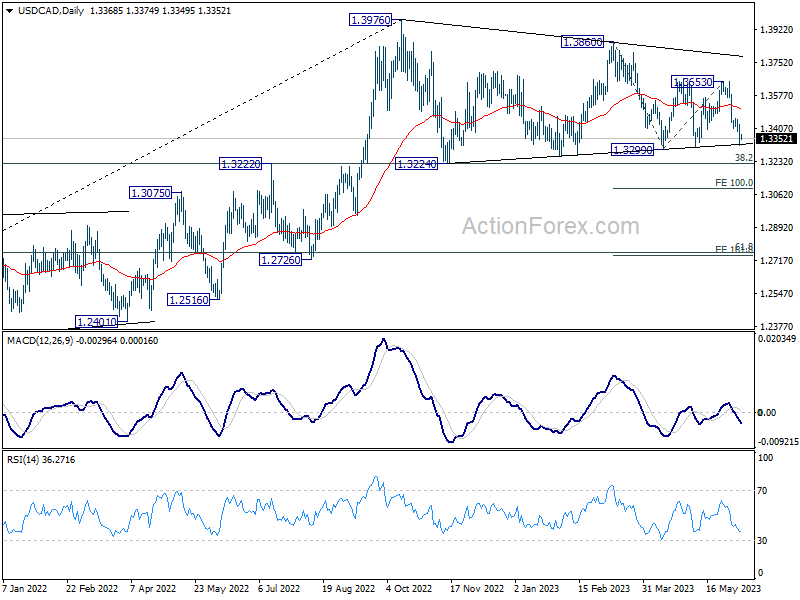
Technically, while Canadian Dollar is strong this week, tough resistance levels lie just ahead. The key level is 1.3224 cluster support, with 38.2% retracement of 1.2005 to 1.3976 at 1.3233. Price actions from 1.3976 could still be considered a sideway corrective pattern as long as 1.3224/33 holds. That is, larger up trend would remain intact.
However, firm break of 1.3299 support would risk downside acceleration to push USD/CAD through 1.3224/33 decisively. 100% projection of 1.3860 to 1.3299 from 1.3653 at 1.3092 would be the immediate target, with risk of even deeper decline in the medium term.
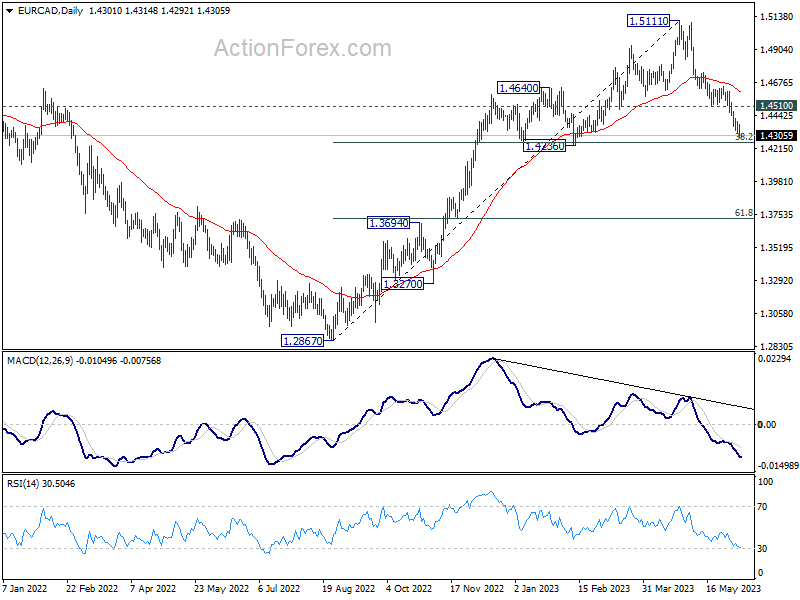
As for EUR/CAD, it's now quickly approaching the key zone of 1.4236 cluster support (38.2% retracement of 1.2867 to 1.5111 at 1.4254). There is still prospect of a bounce from the zone. Break of 1.4510 minor resistance will suggest that the corrective fall from 1.5111 has completed and bring stronger rebound back to 55 D EMA (now at 1.4601) and above.
However, sustained decisive break of 1.236 could trigger further downside acceleration to 61.8% retracement at 1.3724, even just as a deep corrective move.
Looking ahead
Eurozone will release Q1 GDP final in European session. US will publish jobless claims and wholesale inventories later in the day.
GBP/JPY Daily Outlook
Daily Pivots: (S1) 173.21; (P) 173.82; (R1) 174.98; More...
GBP/JPY is staying in consolidation from 174.66 and intraday bias remains neutral first. Deeper pull back cannot be ruled out, but outlook will stay bullish as long as 167.82 support holds. On the upside, break of 174.66 will resume larger up trend to 100% projection of 148.93 to 172.11 from 155.33 at 178.51.
In the bigger picture, up trend from 123.94 (2020 low) is extending. Next target will be 161.8% projection of 122.75 (2016 low) to 156.59 (2018 high) from 123.94 at 178.69. For now, medium term outlook will remain bullish as long as 165.99 resistance turned support holds, even in case of deep pull back.
Economic Indicators Update
| GMT | Ccy | Events | Actual | Forecast | Previous | Revised |
|---|---|---|---|---|---|---|
| 22:45 | NZD | Manufacturing Sales Q1 | -2.80% | -0.40% | ||
| 23:01 | GBP | RICS Housing Price Balance May | -30% | -37% | -39% | |
| 23:50 | JPY | GDP Q/Q Q1 F | 0.70% | 0.40% | 0.40% | |
| 23:50 | JPY | GDP Deflator Y/Y Q1 F | 2.00% | 2.00% | 2.00% | |
| 23:50 | JPY | Bank Lending Y/Y May | 3.40% | 3.10% | 3.20% | |
| 23:50 | JPY | Current Account (JPY) Apr | 1.90T | 1.38T | 1.01T | |
| 01:30 | AUD | Trade Balance (AUD) Apr | 11.16B | 14.0B | 15.27B | 14.82B |
| 05:00 | JPY | Eco Watchers Survey: Outlook May | 55 | 54.1 | 54.6 | |
| 09:00 | EUR | Eurozone GDP Q/Q Q1 F | 0.00% | 0.10% | ||
| 09:00 | EUR | Eurozone Employment Change Q/Q Q1 F | 0.60% | 0.60% | ||
| 12:30 | USD | Initial Jobless Claims (Jun 2) | 235K | 232K | ||
| 14:00 | USD | Wholesale Inventories Apr F | -0.20% | -0.20% | ||
| 14:30 | USD | Natural Gas Storage | 115B | 110B |