Sample Category Title
EUR/USD Mid-Day Outlook
Daily Pivots: (S1) 1.0665; (P) 1.0703; (R1) 1.0736; More...
Intraday bias in EUR/USD stays neutral for the moment. On the upside, break of 1.0778 resistance will resume the rebound from 1.0634 short term bottom to 55 D EMA (now at 1.0813). Sustained break there could pave the way back to retest 1.1094 high. On the downside, however, break of 1.0634 will resume the corrective decline from 1.1094. Deeper fall should then be seen to 1.0515 cluster support, 38.2% retracement of 0.9534 to 1.1094 at 1.0498.
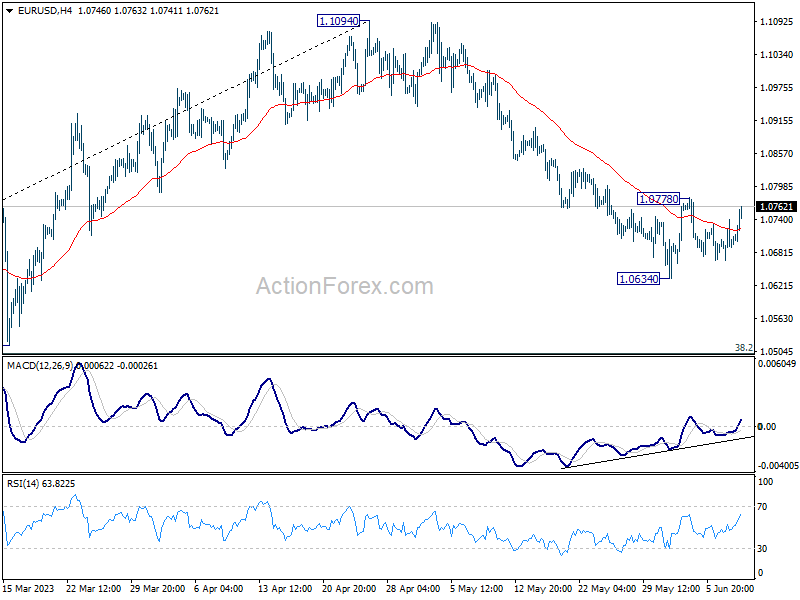
In the bigger picture, as long as 1.0515 support holds, rise from 0.9534 (2022 low) would still extend higher. Sustained break of 61.8% retracement of 1.2348 (2021 high) to 0.9534 at 1.1273 will solidify the case of bullish trend reversal and target 1.2348 resistance next (2021 high).
Dollar Down after Poor Jobless Claims, More Downside?
Dollar falls broadly in early US session after much worse than expected jobless claims data. But it's so far still holding largely in range. Market pricing on whether Fed would hike on June 14 continues to flip-flop (at around 30% for a 25bps hike). For the week, Kiwi is the second worst, after Dollar, followed by Sterling. Aussie remains the strongest one, but Swiss Franc jumped to the second place, followed by Canadian. Euro and Yen are mixed, a bit of the soft side.
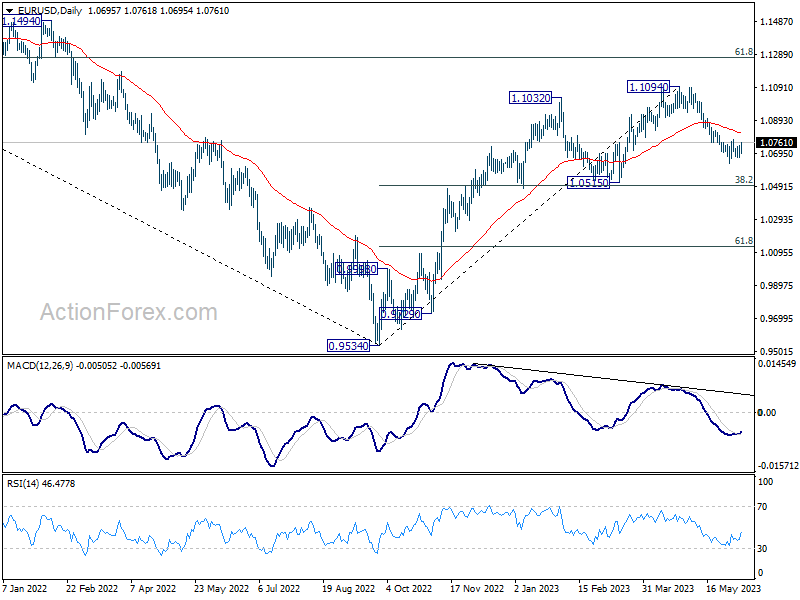
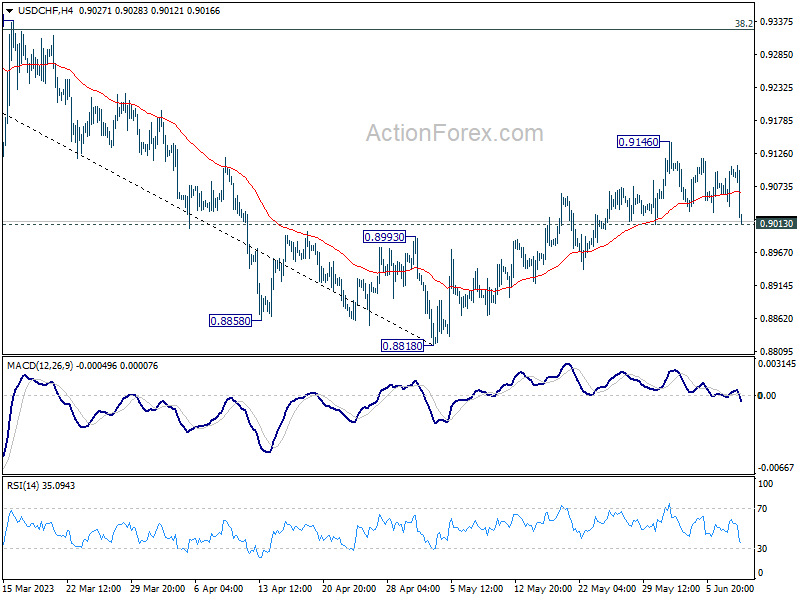
Technically, with today's selloff in Dollar, focuses is back on near term support levels, including 0.9013 minor support in USD/CHF, 138.22 support in USD/JPY, 1.0778 resistance in EUR/USD and 1.2543 resistance in GBP/USD. Break of any of these levels could be a signal of more weakness in the greenback. Let's see how it goes.
In Europe, at the time of writing, FTSE is down -0.02%. DAX is up 0.06%. CAC is up 0.28%. Germany 10-year yield is down -0.0316 at 2.427. Earlier in Asia, Nikkei is down -0.85%. Hong Kong HSI rose 0.25%. China Shanghai SSE rose 0.25%. Singapore Strait Times rose 0.22%. Japan 10-year JGB yield rose notably by 0.0234 to 0.442.
US initial jobless claims rose to 261k, highest since Oct 2021
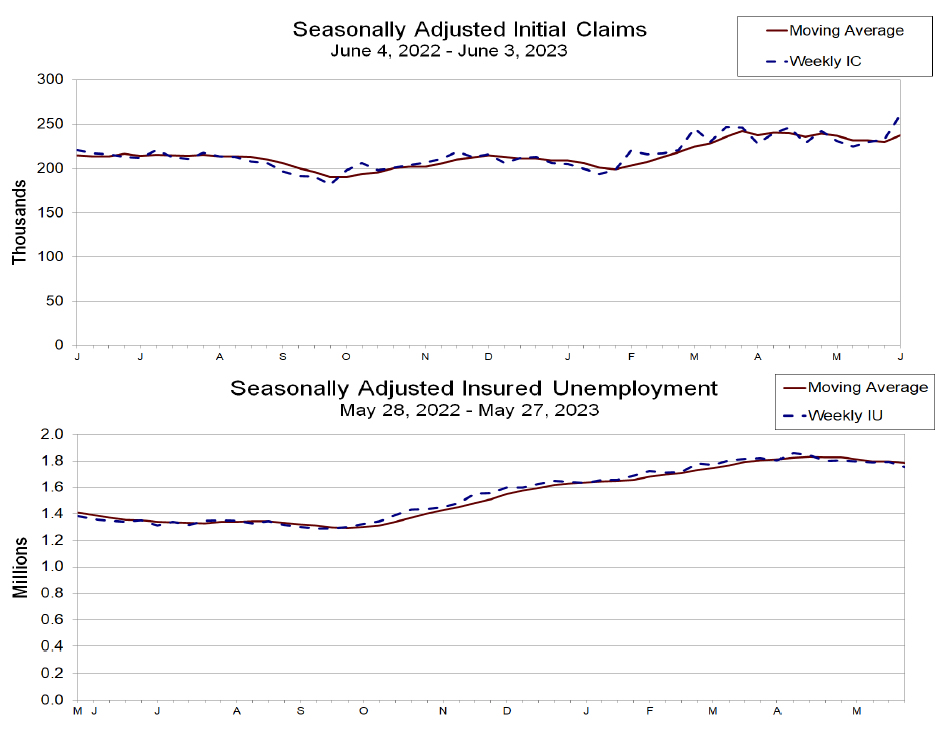
US initial jobless claims rose 28k to 261k in the week ending June 3, well above expectation of 235k. That's also the highest level since October 30, 2021, when it was 264k. Four-week moving average of initial claims rose 7.5k to 237k.
Continuing claims dropped -37k to 1757k in the week ending May 27. Four-week moving average of continuing claims dropped -12.5k to 1785k.
Gold recovering after poor US job data, but bounded in range
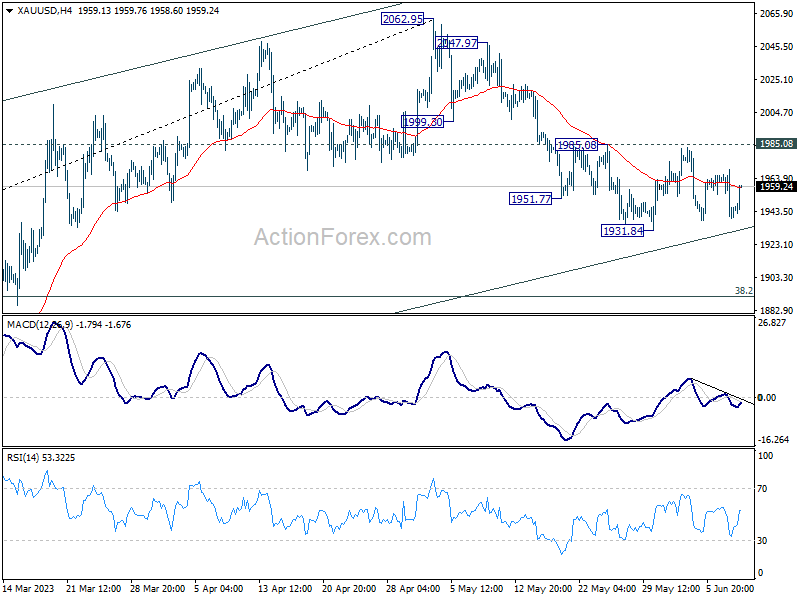
Gold recovered notably in early US session, following the selloff in Dollar on much worse than expected US jobless claims data.
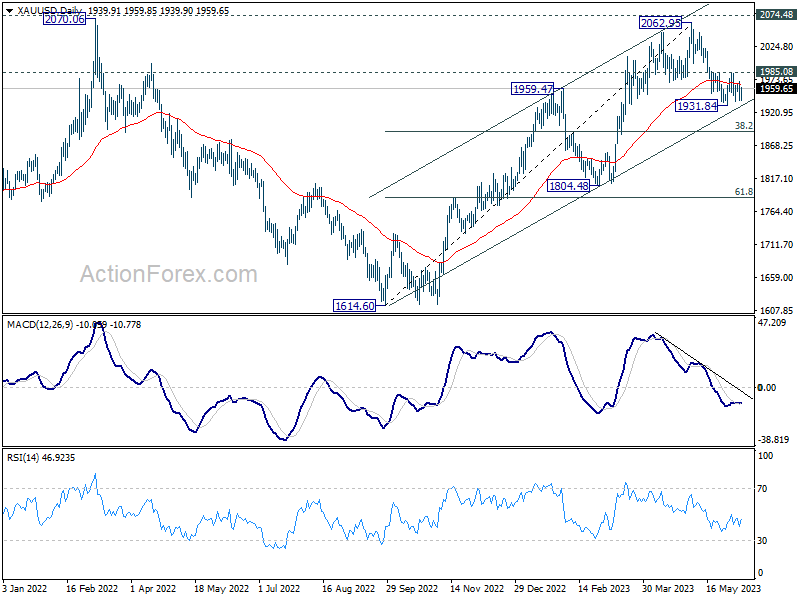
But after all, Gold is just seen as extending the consolidation pattern from 1931.84 short term bottom. That is, another fall remains in favor. Break of 1931.84 support will firstly confirm resumption of whole fall from 2062.95. Secondly, that should also have medium term channel support firmly taken out. In this case, Gold should target 38.2% retracement of 1614.60 to 2062.95 at 1891.68.
However, break of 1985.08 resistance will argue that the channel support is defended, and maintains medium term bullishness. Stronger rise should then be seen to retest 2062.95, even further to 2074.48 high.
SNB Jordan: It's really important to bring inflation down to price stability level
Swiss National Bank Chairman Thomas Jordan said today "It's really important to bring Swiss inflation to a level of price stability."
He added that inflation is more persistent that the bank thought, adding that there are signs of second and third round effects.
Jordan also emphasized that it would not be a good idea to wait for inflation to rise and then have to raise interest rates.
"When inflation remains under 2% for a long time, we don't have a problem," Jordan noted.
EUR/USD Mid-Day Outlook
Daily Pivots: (S1) 1.0665; (P) 1.0703; (R1) 1.0736; More...
Intraday bias in EUR/USD stays neutral for the moment. On the upside, break of 1.0778 resistance will resume the rebound from 1.0634 short term bottom to 55 D EMA (now at 1.0813). Sustained break there could pave the way back to retest 1.1094 high. On the downside, however, break of 1.0634 will resume the corrective decline from 1.1094. Deeper fall should then be seen to 1.0515 cluster support, 38.2% retracement of 0.9534 to 1.1094 at 1.0498.
In the bigger picture, as long as 1.0515 support holds, rise from 0.9534 (2022 low) would still extend higher. Sustained break of 61.8% retracement of 1.2348 (2021 high) to 0.9534 at 1.1273 will solidify the case of bullish trend reversal and target 1.2348 resistance next (2021 high).
Economic Indicators Update
| GMT | Ccy | Events | Actual | Forecast | Previous | Revised |
|---|---|---|---|---|---|---|
| 22:45 | NZD | Manufacturing Sales Q1 | -2.80% | -0.40% | ||
| 23:01 | GBP | RICS Housing Price Balance May | -30% | -37% | -39% | |
| 23:50 | JPY | GDP Q/Q Q1 F | 0.70% | 0.40% | 0.40% | |
| 23:50 | JPY | GDP Deflator Y/Y Q1 F | 2.00% | 2.00% | 2.00% | |
| 23:50 | JPY | Bank Lending Y/Y May | 3.40% | 3.10% | 3.20% | |
| 23:50 | JPY | Current Account (JPY) Apr | 1.90T | 1.38T | 1.01T | |
| 01:30 | AUD | Trade Balance (AUD) Apr | 11.16B | 14.0B | 15.27B | 14.82B |
| 05:00 | JPY | Eco Watchers Survey: Outlook May | 55 | 54.1 | 54.6 | |
| 09:00 | EUR | Eurozone GDP Q/Q Q1 F | -0.10% | 0.00% | 0.10% | |
| 09:00 | EUR | Eurozone Employment Change Q/Q Q1 F | 0.60% | 0.60% | 0.60% | |
| 12:30 | USD | Initial Jobless Claims (Jun 2) | 261K | 235K | 232K | 233K |
| 14:00 | USD | Wholesale Inventories Apr F | -0.20% | -0.20% | ||
| 14:30 | USD | Natural Gas Storage | 115B | 110B |
Gold recovering after poor US job data, but bounded in range
Gold recovered notably in early US session, following the selloff in Dollar on much worse than expected US jobless claims data.
But after all, Gold is just seen as extending the consolidation pattern from 1931.84 short term bottom. That is, another fall remains in favor. Break of 1931.84 support will firstly confirm resumption of whole fall from 2062.95. Secondly, that should also have medium term channel support firmly taken out. In this case, Gold should target 38.2% retracement of 1614.60 to 2062.95 at 1891.68.
However, break of 1985.08 resistance will argue that the channel support is defended, and maintains medium term bullishness. Stronger rise should then be seen to retest 2062.95, even further to 2074.48 high.
SNB Jordan: It’s really important to bring inflation down to price stability level
Swiss National Bank Chairman Thomas Jordan said today "It's really important to bring Swiss inflation to a level of price stability."
He added that inflation is more persistent that the bank thought, adding that there are signs of second and third round effects.
Jordan also emphasized that it would not be a good idea to wait for inflation to rise and then have to raise interest rates.
"When inflation remains under 2% for a long time, we don't have a problem," Jordan noted.
US initial jobless claims rose to 261k, highest since Oct 2021
US initial jobless claims rose 28k to 261k in the week ending June 3, well above expectation of 235k. That's also the highest level since October 30, 2021, when it was 264k. Four-week moving average of initial claims rose 7.5k to 237k.
Continuing claims dropped -37k to 1757k in the week ending May 27. Four-week moving average of continuing claims dropped -12.5k to 1785k.
AUD/USD Hits One-Month High, Chinese Inflation Eyed
-
- AUD/USD hits one-month high
- Lowe warns inflation is too high
- China releases inflation on Friday
The Australian dollar has bounced back on Thursday after losing ground on Wednesday. AUD/USD is trading at 0.6681, up 0.42% on the day. The Australian dollar touched a high of 0.6690 on Wednesday, its highest level in a month.
Lowe warns inflation is too high
The RBA surprised the markets with a rate hike on Wednesday, noting that inflation had unexpectedly risen in April and GDP in the first quarter was higher than the RBA had predicted. The RBA statement said that more tightening might be needed “to ensure that inflation returns to target in a reasonable timeframe”.
Lowe was even more candid in remarks at a public engagement on Wednesday, saying that the Bank has been patient in the battle to get inflation back to the 2-3% target “but our patience has a limit and the risks are testing that limit.” Lowe appeared to be referring to the upside risk in inflation, and he could be hinting at a “higher and longer” stance with rate policy until inflation returns closer to target. Inflation has peaked, but at the current level of 7%, Lowe may be sending a message that inflation is falling far too slowly and he’s prepared to keep raising rates, even if this results in a hard landing for the economy.
China will release inflation data on Friday. Inflation is projected to rise to 0.3% in May, up from 0.1% in April. An improvement from the April reading would reduce concerns that China could be facing disinflation and may have to respond by cutting interest rates. On Wednesday, China released soft trade data, which showed exports fell by 7.5%. This has raised doubts about China’s economic recovery. The Australian dollar, which is highly sensitive to Chinese data, lost ground following the release.
AUD/USD Technical
- AUD/USD continues to test resistance at 0.6677. Above, there is resistance at 0.6749
- There is support at 0.6568 and 0.6496
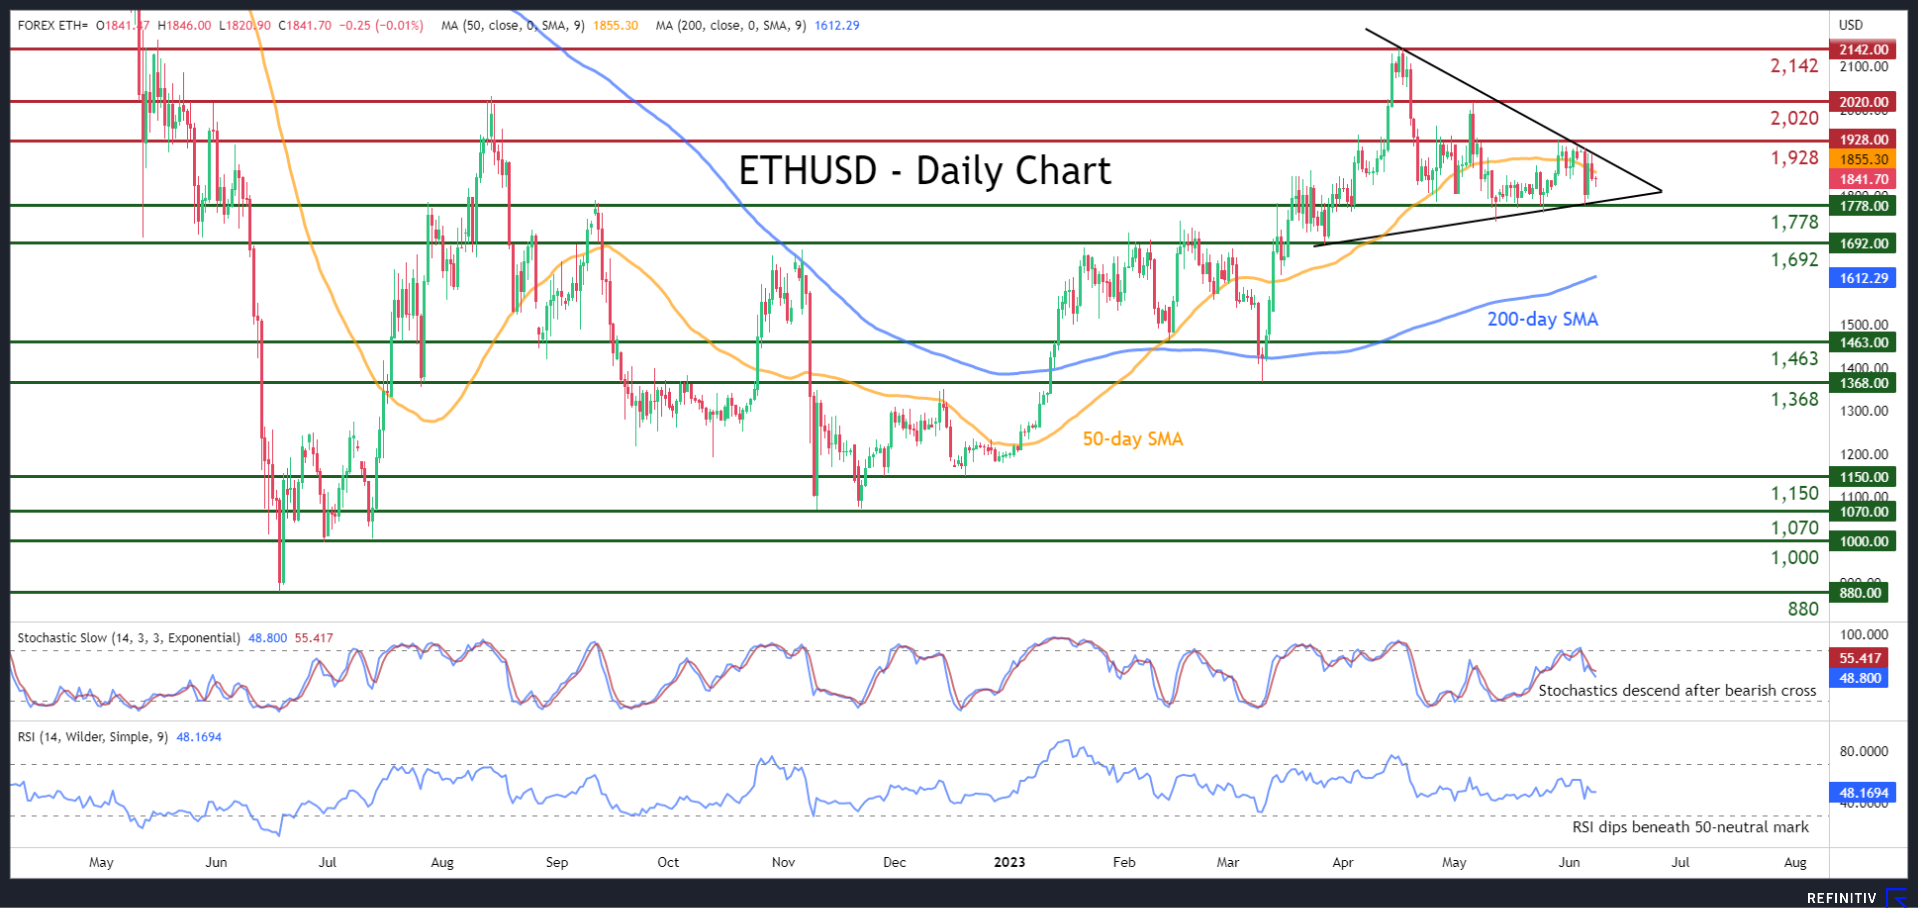
ETHUSD Remains Directionless Around 50-day SMA
ETHUSD (Ethereum) has been trading sideways in the past two months, hovering around its 50-day simple moving average (SMA). Moreover, the digital coin has been forming a symmetrical triangle pattern, indicating that a breakout could occur soon.
The momentum indicators currently suggest that near-term risks are tilted to the downside. Specifically, the stochastic oscillator is descending after posting a bearish cross, while the RSI dipped below its 50-neutral mark.
Should sellers try to push the price lower, the recent support of 1,778 could act as the first line of defense. Dipping beneath that wall, the price might slide towards 1,692 before the February support of 1,463 gets tested. A violation of the latter could set the stage for the March low of 1,368.
On the flipside, bullish actions could propel the price towards 1,928, which is the upper end of the price’s recent sideways trajectory. Conquering this barricade, the bulls might aim for the 2,020 hurdle. Failing to halt there, the price could then ascend to challenge the 1-year high of 2,142.
Overall, ETHUSD seems to be in a consolidation phase, but the formation of a symmetrical triangle suggests that this calm might not last much longer.
Cryptocurrencies Under Renewed Pressure
Market picture
The cryptocurrency market capitalisation fell 1.8% to $1.1 trillion over the last 24 hours as risky assets lost traction, dragging the Nasdaq lower. Markets were surprised by interest rate hikes in Australia and Canada, raising the chances of a similar move from the Fed next week.
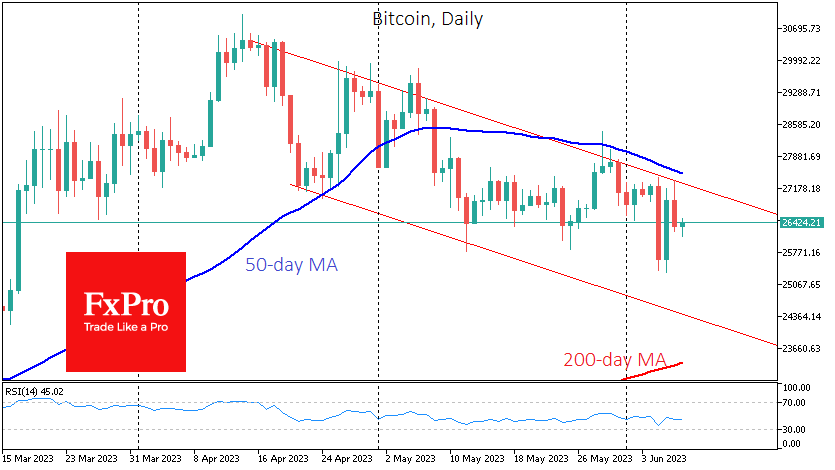
Bitcoin is trading near $26.4K, down 1.5% in 24 hours, a level that has acted as support over the past three months. On Wednesday, the price reversed as it approached its 50-day moving average. This was triggered by a sell-off in the Nasdaq 100, which lost 1.75% on the day. The technical picture remains quite bearish, with Bitcoin remaining within a two-month downtrend channel, setting up an imminent drop towards $25K to test more significant support.
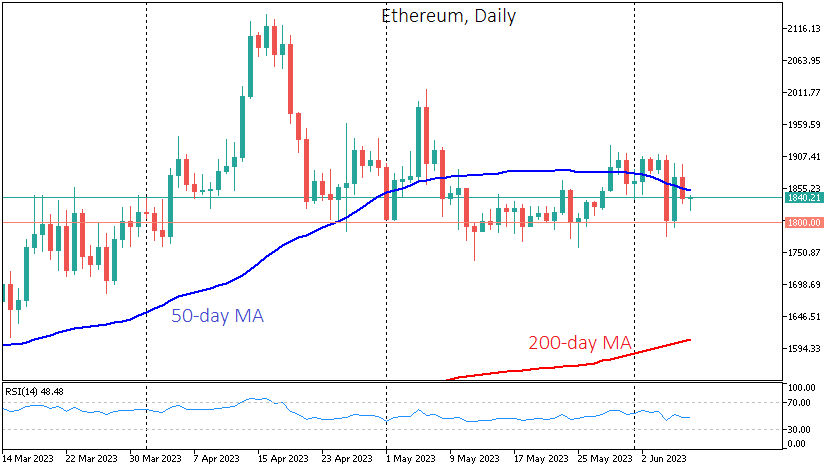
Interestingly, Ethereum feels more confident and continues to find support on dips below 1800, although the 50-day average still acts as resistance.
According to CoinGecko, median trading volume on decentralised cryptocurrency exchanges (DEX) has more than quadrupled in the past two days amid an SEC lawsuit against Binance and Coinbase. The outflow from Binance was nearly $800 million, while Coinbase’s outflow was around $600 million.
News background
The SEC has issued a regulatory order to freeze the accounts of Binance.US. Representatives of the site insist that all user funds are safe.
Bank of America downgraded Coinbase shares to “underperform” following the SEC lawsuit, which could threaten the exchange’s business model.
Timothy Massad, the former CFTC chairman, believes the future of the crypto industry hinges on the outcome of the SEC’s case against exchanges Binance and Coinbase.
The number of cryptocurrency companies on Forbes’ Fintech 50 list fell from nine to five last year. The market value of cryptocurrencies has fallen by $1.4 trillion over the year amid the collapse of FTX, Genesis, BlockFi, Three Arrows Capital and other cryptocurrency companies.
USD/CAD: Canadian Dollar Under Increased Pressure after BOC Hawkish Hike
The USDCAD pair is holding firmly in red for the third straight day and near one-month low, posted on Wednesday after a BOC hawkish hike.
The Bank of Canada surprised markets by raising interest rate by 25 basis points to 4.75%, the highest in 22 years, after being on hold since January and evaluating the impact of previous tightening cycle, in which the central bank raised borrowing cost eight times to 4.50% since March 2022.
Noting that underlying inflation remains stubbornly high, the central bank expressed strong concerns about prolonged elevated price pressures and said that monetary policy was not sufficiently restrictive to push inflation towards 2% target.
Markets understood the comments from BOC as hawkish signal and boosted expectations for another hike next month, offering more support to Canadian dollar.
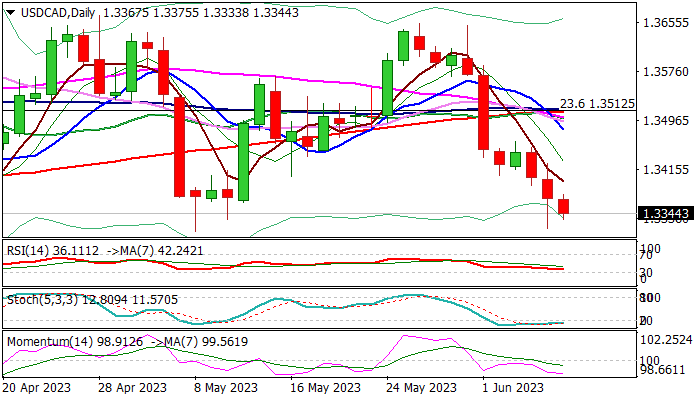
Daily chart shows bears fully in play with rising negative momentum and MA’s forming a number of bear-crosses, aiming at key near-term supports at 1.3314/01 (May8 / Apr 14 lows) break of which to open way towards pivots at 1.3224/1.3190 (Fibo 38.2% of 1.2006/1.3977 / Nov 15 low / weekly Ichimoku cloud base) which also mark the floor of larger range since November.
Oversold conditions on daily chart warn of possible headwinds on approach to 1.3320/00 zone, with limited upticks to be capped under 1.3460 lower top and offer better selling opportunities.
Res: 1.3396; 1.3460; 1.3480; 1.3510.
Sup: 1.3320; 1.3301; 1.3262; 1.3224.
BTC/USD Analysis: Test of Important Breakout Amid Scary News
The cryptocurrency market is shaken by claims from the SEC. The lawsuits by the US financial regulator against the world's largest cryptocurrency exchange Binance and its head Changpeng Zhao have added to the lawsuits against the Coinbase exchange, whose shares are traded on Nasdaq. In response, Coinbase representatives said that the exchange has no plans to ban the trading of crypto assets that the SEC considers securities, and does not plan to phase out staking services.
Cryptocurrency market participants anxiously monitor incoming news:
→ Hearings are scheduled for June 14 on the SEC request to freeze Binance.US assets.
→ A division of Binance.US has drastically reduced the number of cryptocurrency pairs available for trading.
→ Coinbase does not see the risk of losing customers or banking partners; the exchange has more than $5 billion on its balance sheet, available to maintain operations and pay legal fees.
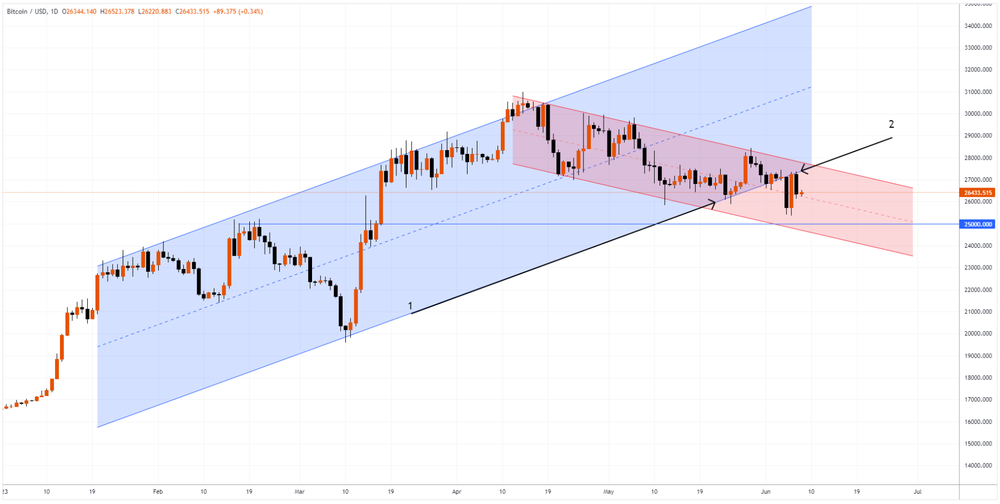
Meanwhile, an important breakout test took place on the BTC/USD chart. The price of BTC/USD bounced several times (in late May and early June) from the lower border of the trend channel (1), which has been in effect since the beginning of 2023. But after the news about the lawsuits from the SEC against Binance, it had a bearish breakdown, and yesterday its test was formed on the chart – the price of BTC/USD turned down from the breakdown zone above USD 27k. The bearish breakout test suggests that the price of BTC/USD may continue to decline — consider a scenario in which it, moving within the red descending channel in the face of negative news, can reach an important psychological level of USD 27k.