

Sample Category Title
Cliff Notes: Inflation’s Cost
Key insights from the week that was.
Q1 GDP for Australia came in broadly as anticipated at 0.2%, 2.3%yr. Household spending managed to lift by only 0.2% in Q1 after a similarly weak 0.3% gain in Q4. This was despite another fall in the savings ratio from 4.4% to 3.7% – freeing up roughly $2bn in funding for expenditure – as elevated inflation, interest rates and fiscal drags eroded nominal earnings and saw household’s real disposable income fall by 0.3% in the quarter to be 4% lower over the year.
As interest rates continue to rise and inflation only slowly abates, real discretionary spending capacity will remain under pressure. Regarding other areas of the domestic economy, conditions for investment were supportive in the quarter, a rise in construction work and equipment spending leading a 2.9% increase in new business investment overall. Note though, the outlook for investment is clouded given emerging weakness in household demand and global uncertainties.
On trade, Australia’s current account surplus widened from $11.7bn in Q4 (revised down from $14.1bn) to $12.3bn in Q1. This was primarily driven by an improvement in the trade surplus, up $2.1bn in the quarter upon sustained strength in Australia’s terms of trade which rose 2.8% in Q1. In real terms however, the lift in import volumes (+3.2%) outpaced exports (+1.8%), leading net exports to subtract from GDP growth in Q1, -0.2ppts.
The RBA’s decision to raise the cash rate by 25bps this week, which came as a surprise to markets, highlight’s the Board’s concern over inflation risks proving persistent as well as the implications for the economy if they do. Providing more colour around the decision, Governor Lowe delivered a speech the following day, highlighting four key areas critical for the RBA’s navigation of the ‘narrow path’. These include, the global economy, household spending, unit labour costs and inflation expectations.
The Board still believes it can lower inflation whilst maintaining the economic gains from earlier expansionary policy, but the risks are considerable. Given their decision in June and associated communications, we now expect a further 25bp cash rate increase in July to 4.35%. Another move in August is a possibility depending on the data’s evolution. Rate cuts will have to wait until 2024.
The RBA wasn’t the only central bank to surprise this week – the Bank of Canada also raised its policy rate by 25bps to 4.75%, ending the pause which started in January. The stronger-than-expected Q1 GDP print of 3.1% annualised, with a “surprisingly strong and broad-based” contribution from household consumption, led policymakers to believe that a further rate hike was warranted to rein in excess demand. Strong core inflation also contributed to the decision as the bank expressed concern that “CPI inflation could get stuck materially above the 2% target”. Forward guidance was scant but, having been wrong-footed in June, market participants are now pricing in additional tightening, with a hike fully priced by September and a 50/50 chance of another by year end.
South of the border in the US, the ISM non-manufacturing survey weakened to 50.3 in May – a whisker above the neutral threshold and around six points below the five-year pre-COVID average. There was a broad-based fall in the sub-indices, with ‘backlog of orders’ and ‘new orders’ falling the most. Most notably though, the employment sub-index fell below 50, signalling a modest reduction in headcount at service firms. This is consistent with the uptick reported for initial claims this week and the reduction in hours found by the establishment survey last week; however, it is a stark contrast to the outsized 339k gain in nonfarm payrolls also reported by the BLS’ establishment survey.
The US trade deficit meanwhile widened to $74.6 billion in April as a result of both weaker exports and stronger imports which recovered much of the weakness seen last month. On the exports side, industrial supplies and consumer foods both saw a sizeable downshift. Exports to Germany contracted – an unsurprising result given Germany and the Euro Area overall are now estimated to have experienced a mild recession during Q4 and Q1. Exports to China also fell, but not by as much.
Reversing our perspective and moving a month forward in time to May, China’s trade surplus narrowed to US$65.8bn as exports weakened and imports rose. Exports to the US have declined on a year ago basis every month since August 2022. Offsetting growth in demand has however come from Asia, momentum that is likely to be sustained through 2023. Imports are expected to strengthen further following a pick-up in construction. Residential sales have already jumped higher and starts will follow. As these projects begin, demand for key inputs such as iron ore and timber will grow. China’s post-COVID consumer recovery is also likely to result in an increase in consumption of imported goods and services. This is good news for our region as Chinese visitors support tourism across Asia and Oceania.
USD/JPY Could Correct Lower Toward 138.00
Key Highlights
- USD/JPY started a downside correction from the 141.00 resistance.
- A key bearish trend line is forming with resistance near 140.00 on the 4-hour chart.
- EUR/USD is attempting a recovery wave above the 1.0780 level.
- GBP/USD climbed higher above the 1.2500 resistance zone.
USD/JPY Technical Analysis
The US Dollar started a downside correction from the 140.90 zone against the Japanese Yen. USD/JPY traded below the 140.00 level to move into a short-term bearish zone.
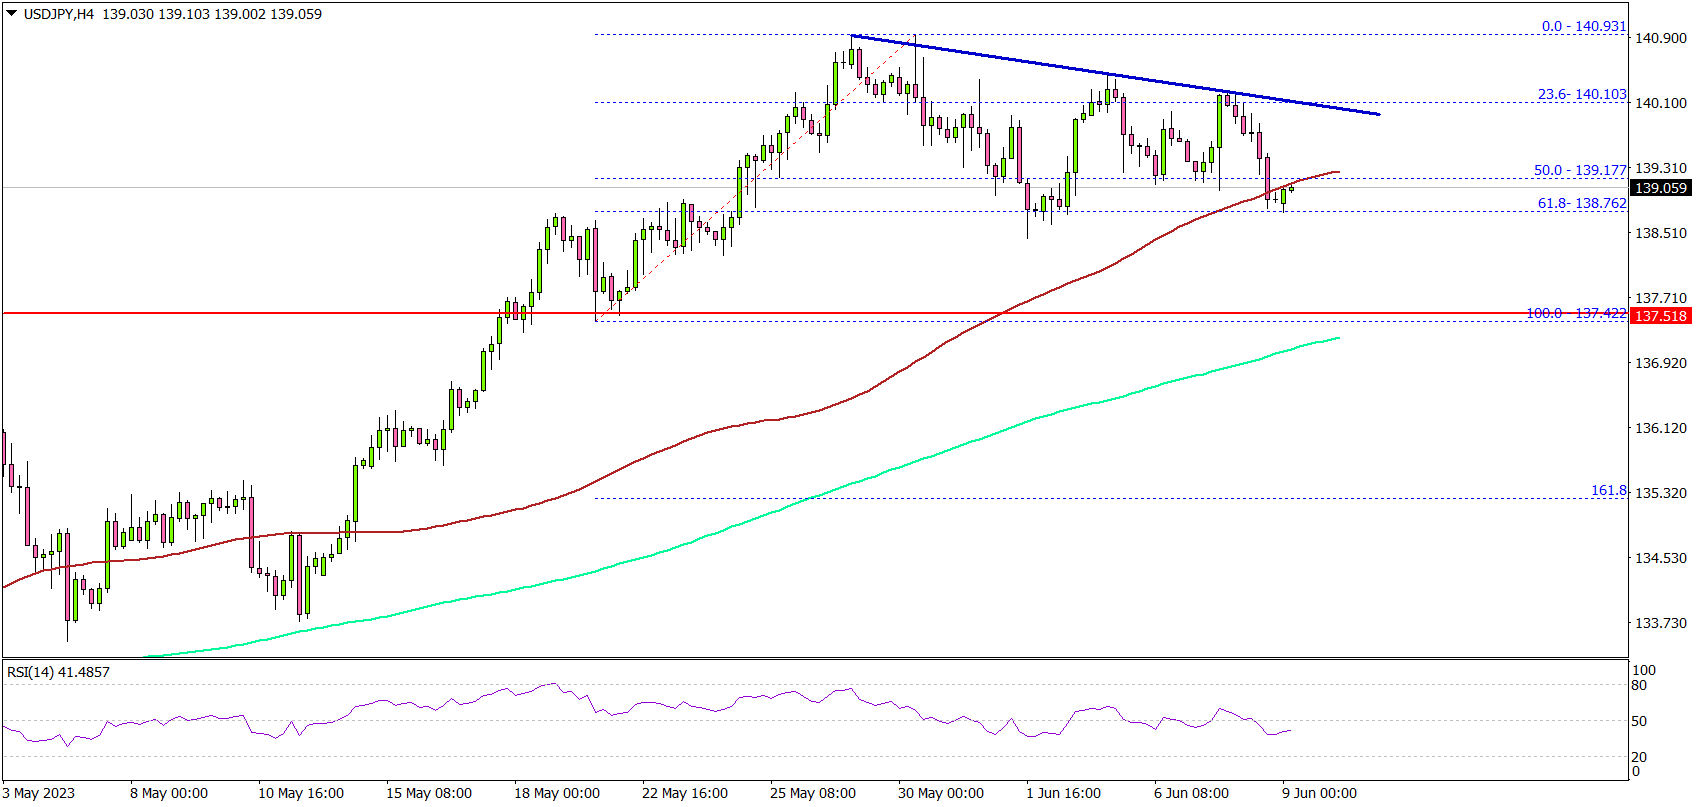
Looking at the 4-hour chart, the pair traded below the 139.50 support. There was a move below the 50% Fib retracement level of the upward move from the 137.42 swing low to the 140.93 high.
The pair tested the 100 simple moving average (red, 4 hours). There is also a bearish trend line forming with resistance near 140.00 on the same chart. Immediate support is near the 138.20 level. The next major support is near the 137.50 level.
If there is a downside break below the 137.50 support, the pair could decline toward the 137.00 support. If there is a fresh increase, the pair could face resistance near 140.00.
The first major resistance is near the 140.20 level. If there is a move above the 140.20 resistance, the pair could drift toward 141.00.
Looking at EUR/USD, the pair started a decent increase above the 1.0750 resistance and there could be a move above the 1.0820 resistance.
Economic Releases
- Canada’s employment Change for May 2023 – Forecast 23.2K, versus 41.4K previous.
- Canada’s Unemployment Rate for May 2023 - Forecast 5.1%, versus 5.0% previous.
Dow Futures (YM) Rallying Higher as Impulse
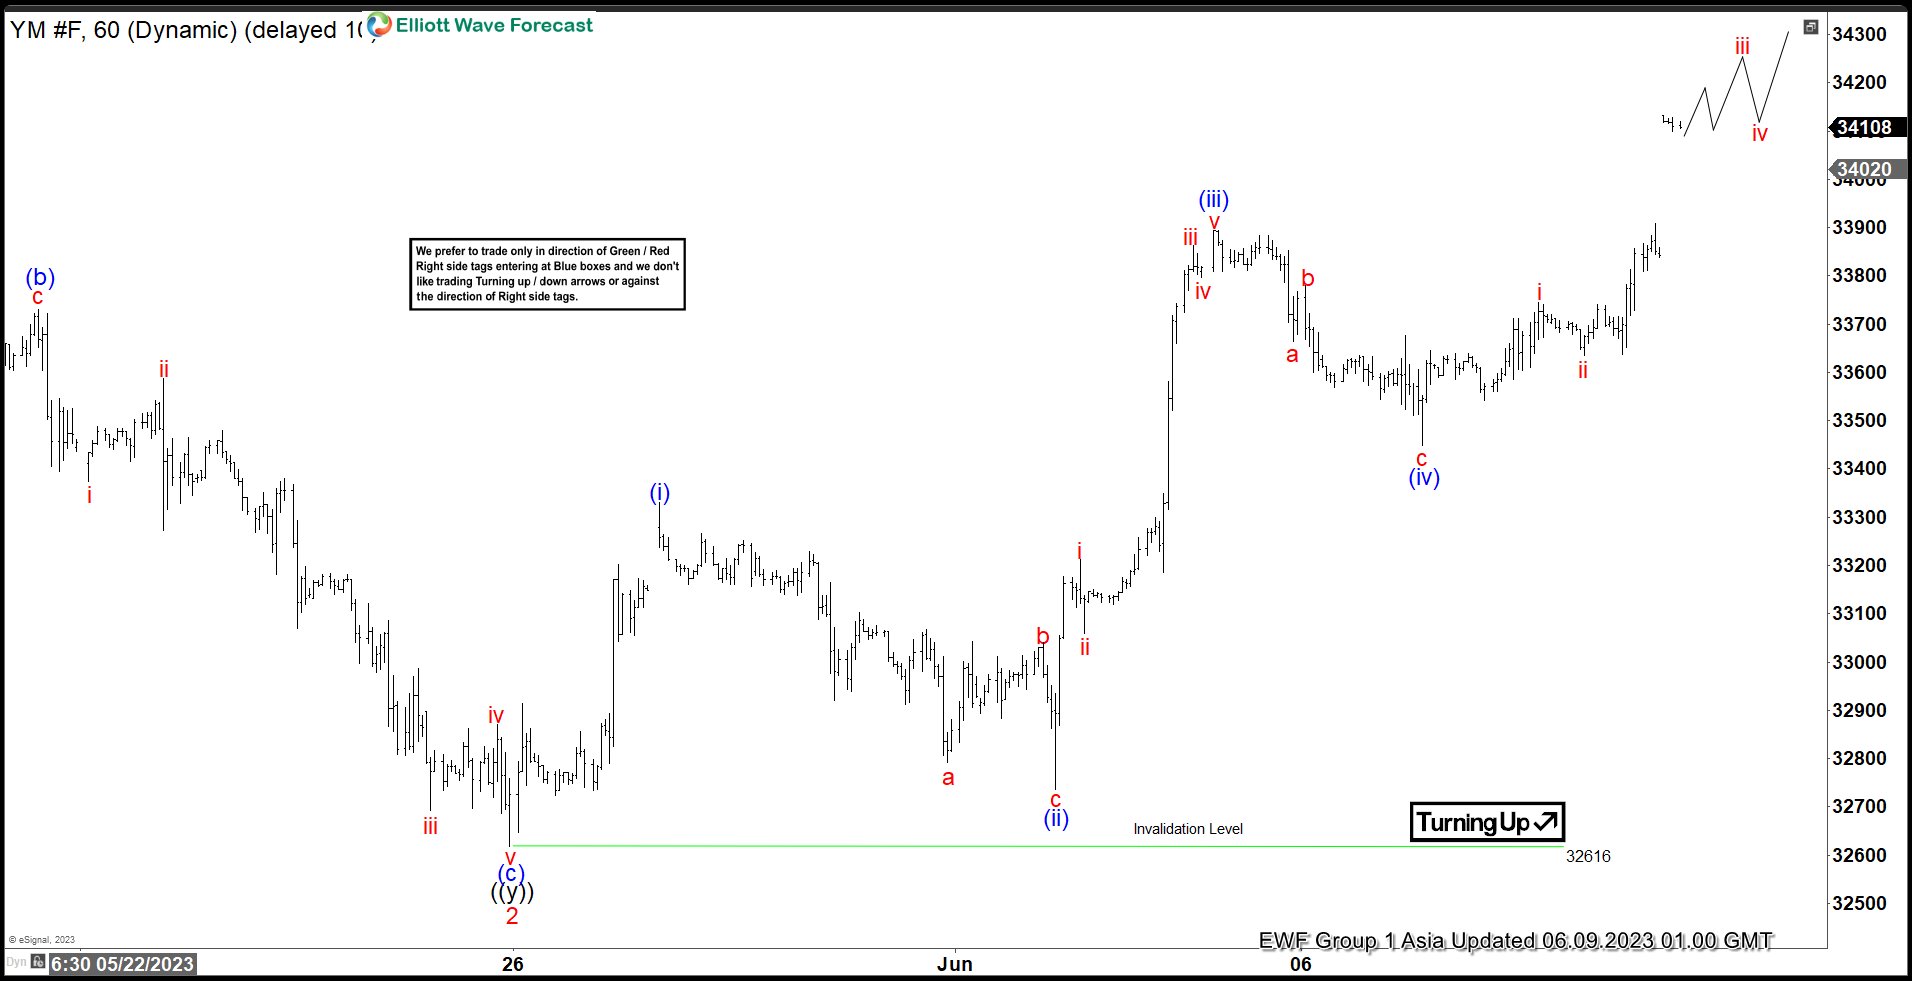
Short Term Elliott Wave in Dow Futures (YM) suggests rally from 3.15.2023 low is in progress as a 5 waves impulse Elliott Wave structure. Up from 3.15.2023 low, wave 1 ended at 34363 and pullback in wave 2 ended at 32619. The Index has turned higher in wave 3 with internal subdivision as another 5 waves in lesser degree. Up from wave 2, wave (i) ended at 3330 and dips in wave (ii) ended at 32737. Up from wave (ii), wave i ended at 33212 and pullback in wave ii ended at 33060. Wave iii ended at 33863, wave iv ended at 33797, and wave v ended at 33894 which completed wave (iii).
Pullback in wave (iv) ended at 33448 as a zigzag structure. Down from wave (iii), wave a ended at 33665, wave b ended at 33780 and wave c lower ended at 33448. This completed wave (iv). Wave (v) of ((i)) is currently in progress. Up from wave (iv), wave i ended at 33745 and pullback in wave ii ended at 33635. Expect the Index to extend higher a few more highs to end wave v of (v) of ((i)). Then it should pullback in wave ((ii)) to correct cycle from 5.25.2023 low in 3, 7, or 11 swing before the rally resumes. Near term, as far as pivot at 32616 low stays intact, expect dips to find support in 3, 7, 11 swing for further upside.
Dow Futures (YM) 1 Hour Elliott Wave Chart
YM Elliott Wave Video
https://www.youtube.com/watch?v=FMnW-0WtdkY
USDCHF Wave Analysis
- USDCHF reversed from pivotal resistance level 0.9100
- Likely to fall to support level 0.8940
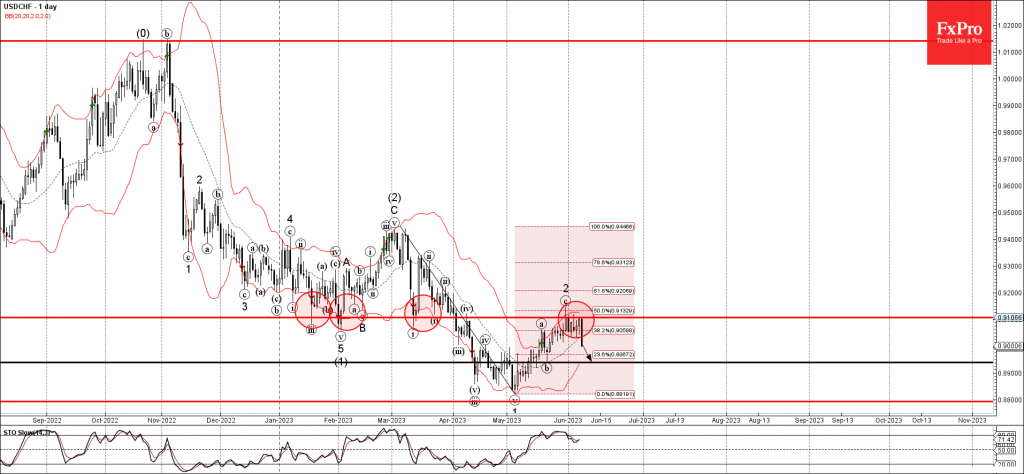
USDCHF recently reversed down sharply from the pivotal resistance level 0.9100 (former strong support from January to March), coinciding with the upper daily Bollinger Band.
The downward reversal from the resistance level 0.9100 continues the active short-term impulse wave 3, which belongs to wave (3) from the start of March.
Given the clear daily downtrend, USDCHF can be expected to fall further toward the next support level 0.8940 (low of the previous minor correction (b)).
EURCAD Wave Analysis
- EURCAD reversed from support level 1.4280
- Likely to rise to resistance level 1.4500
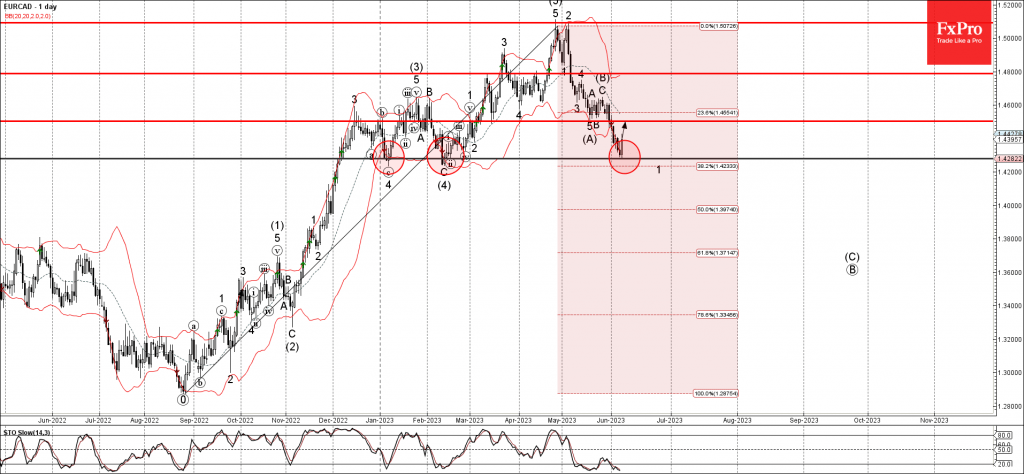
EURCAD recently reversed up from the key support level 1.4280 (which stopped the previous corrections 4 and (4) in January and February respectively).
The upward reversal from the support level 1.4280 stopped the two of the active downward impulse waves – 1 and (C).
Given the strongly bullish euro sentiment and the oversold daily Stochastic, EURCAD can be expected to rise further toward the next resistance level 1.4500 (former support from the middle of May).
Fed Preview: On Hold
Fed Preview: On Hold
- We expect the Fed to maintain rates unchanged next week, markets price in a modest 25% probability of a 25bp hike.
- Focus will be on communication around potential hike in July & the updated dots. The Fed is unlikely to close the door for hikes, but we doubt they will materialize.
- We see downside risks to consensus expectations for May CPI, and forecast +0.2% m/m (4.2% y/y) for headline & +0.3% m/m (5.2% y/y) for core.
Markets have focused on the renewed uptick in macro momentum, which has resurfaced fears of inflation turning more persistent. But we doubt the rise in leading indicators will be sustained, and see evidence of underlying inflation continuing to gradually ease.
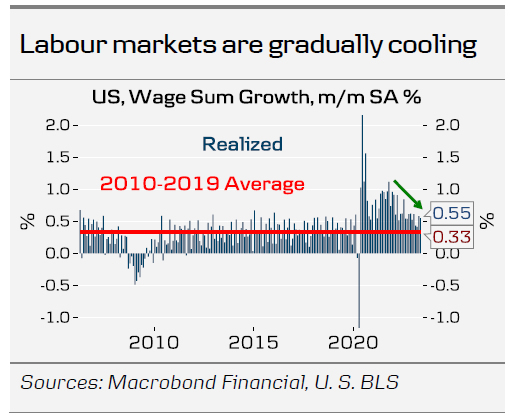
While the May NFP surprised markedly to the upside, the underlying details were much weaker. Employment growth is heavily concentrated on sectors such as leisure & hospitality, which have for a long time suffered from labour shortages. As labour force participation is recovering, employment rises even if broader labour demand is weakening. But importantly, supply-driven employment growth is not inflationary, rather the opposite.
The number of employed workers declined by 310k, which together with labour force growth of 130k suggests that slack is finally forming into labour markets. As such, wage sum growth remains on a downtrend, and our preferred measure of underlying inflation, core services CPI & ex. housing & health care, has also stabilized in the last two releases.
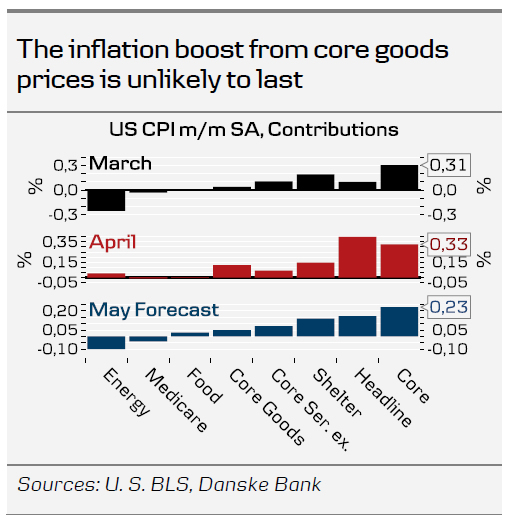
We expect the May CPI, released just ahead of the FOMC meeting, to slow down to 0.2% m/m (4.2% y/y) driven by negative contribution from energy prices. We also forecast Core CPI to continue cooling to 0.3% m/m (5.2% y/y). Manufacturing PMI price indices and used car prices suggest that the April uptick in core goods CPI will not be sustained, while we also look for continuing gradual slowdown in core services and shelter components.
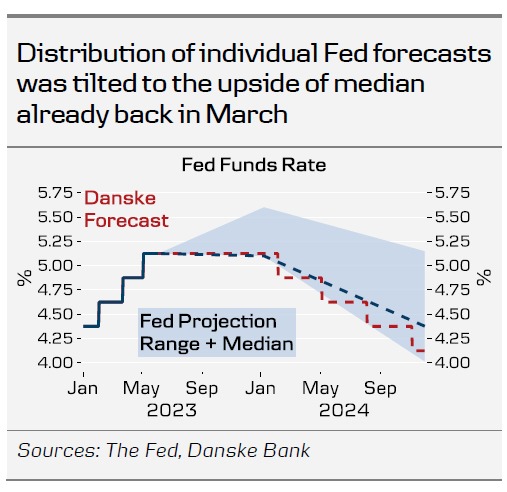
Markets are pricing in a larger (75-80%) probability for a hike in July. Notably, it would only require two individual FOMC participants to shift their 2023 rate projections higher to lift the median 'dot' to 5.25-5.50%, which could spark a hawkish initial reaction in the markets. We still think the bar for restarting hikes in July will be high unless inflation pressures clearly accelerate over summer, which we consider unlikely. Private consumption has so far remained markedly resilient compared to the plunge in real disposable income, but with excess savings soon depleted, we think growth backdrop will remain weak.
Negative signals from longer-lead monetary indicators combined with the risk of tightening liquidity conditions over summer will further discourage rate hikes when inflation has already turned lower. Consumers' inflation expectations have continued declining, and currently hover around 4-5%, suggesting that holding nominal rates at 5% will maintain monetary policy stance sufficiently restrictive.
We make no changes to our forecasts, and expect the Fed to maintain rates at the current level for the remainder of the year. A pause could pose near-term upside risks to EUR/USD, but we still maintain a bearish view on the cross towards H2.
ECB Preview – Looking Beyond Next Week
The ECB meeting next week will be a peculiar one, with a risk of no market reaction. On the one hand, the decision has already been well telegraphed (25bp hike and APP reinvestments to end from 1 July) and on the other hand guidance (with new staff projections) is likely a 'one-sided' risk for markets. Hawkish tunes from Lagarde on the back staff projections is at risk of being largely disregarded by markets.
ECB's stance and market pricing are more harmonious for policy hikes than what we have seen during the past year and after the June meeting we find it challenging for markets to price in more than 40bp of additional until we get close to the July meeting.
We continue to expect ECB to hike to 4% by September, but risks may be slightly skewed to 3.75% in July as the burden of proof have been reversed. We expect ECB to guide for further tightening although providing a non-committal statement as they stay data dependent.
US Dollar at Crucial Zone: What Next?
Let's dive into the recent debt ceiling saga in the US and its implications for the economy, deficit, and inflation. The good news is that a new debt deal is on the horizon, saving us from a potential default on June 5. Phew! This deal will impact the economy by providing stability and avoiding a financial catastrophe. It should also help keep the deficit in check, preventing further debt accumulation. As for inflation, the deal aims to address the budget outlook, which could impact inflation rates. However, we'll need to monitor future developments to see how things play out and ensure the US finds solid financial footing. Stay tuned for updates and keep your trading strategies adaptable. Happy trading!
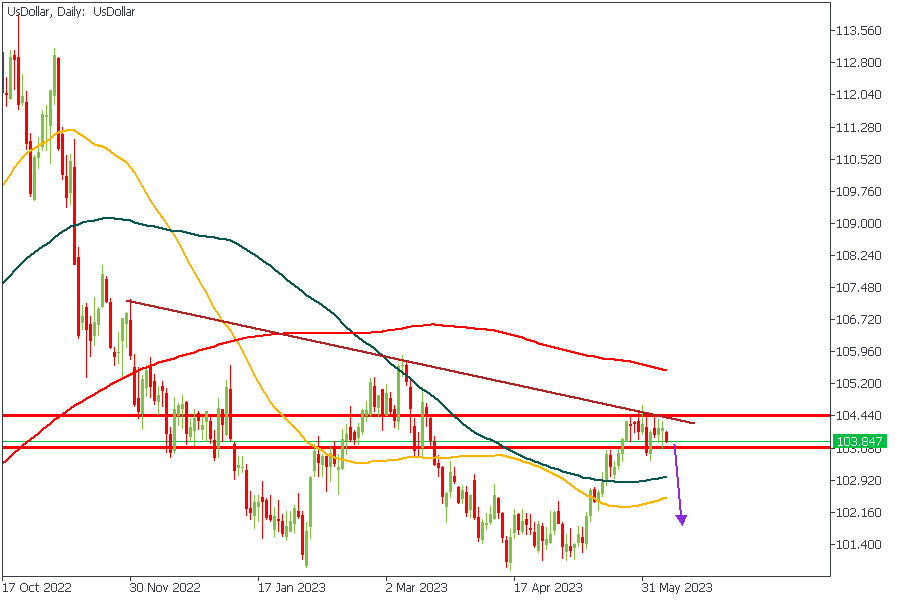
US DOLLAR - Daily Timeframe
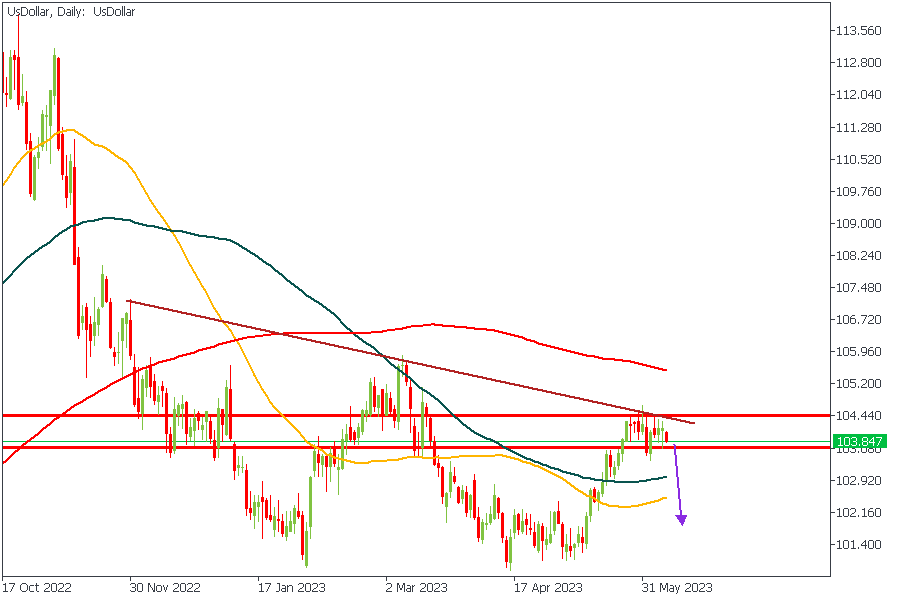
The rejection from the trendline resistance has been clearly established, but we’re yet to see the price trade clear of the pivot zone. Looking at the scenario, my sentiment is bearish based on the following factors;
- Trendline resistance
- Pivot zone acting as supply
- The moving average array is bearish
Analyst’s Expectations:
- Direction: Bearish
- Target: 103.252
- Invalidation: 104.249
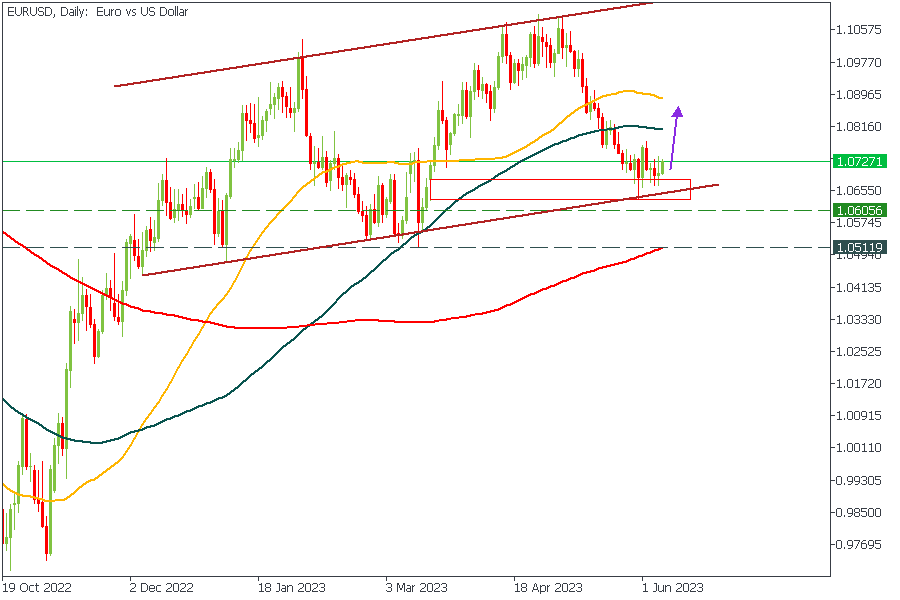
EURUSD - Daily Timeframe
EURUSD has been rejected from the demand zone and the trendline support. Based on the additional confluence from the bullish moving average array, I will uphold my bullish sentiment on EURUSD until the US Dollar reverses its structure. As long as the US Dollar indicates a bearish price action, I will remain bullish on the EURUSD.
Analyst’s Expectations:
- Direction: Bullish
- Target: 1.08481
- Invalidation: 1.06599
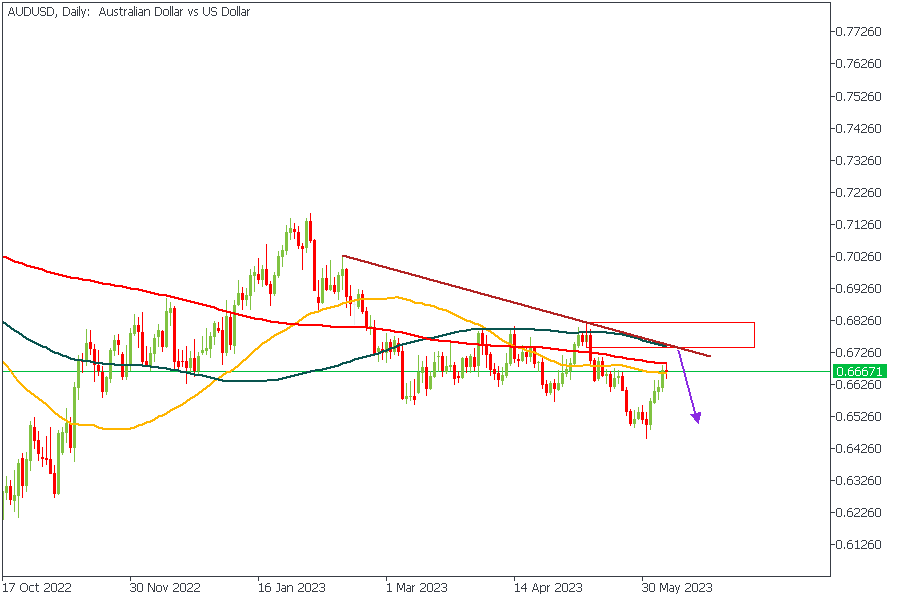
AUDUSD - Daily Timeframe
AUDUSD has not yet reached the major resistance zone I have in mind. However, pending the time, I will aim for a clear break of structure (BoS) in the 1Hour timeframe to consolidate my bearish sentiment. The confluences for this trade are;
- Resistance trendline
- Rally-base-drop supply zone
- The bearish array of the moving averages
- 200-Day moving average resistance
Analyst’s Expectations:
- Direction: Bearish
- Target: 0.65435
- Invalidation: 0.68251
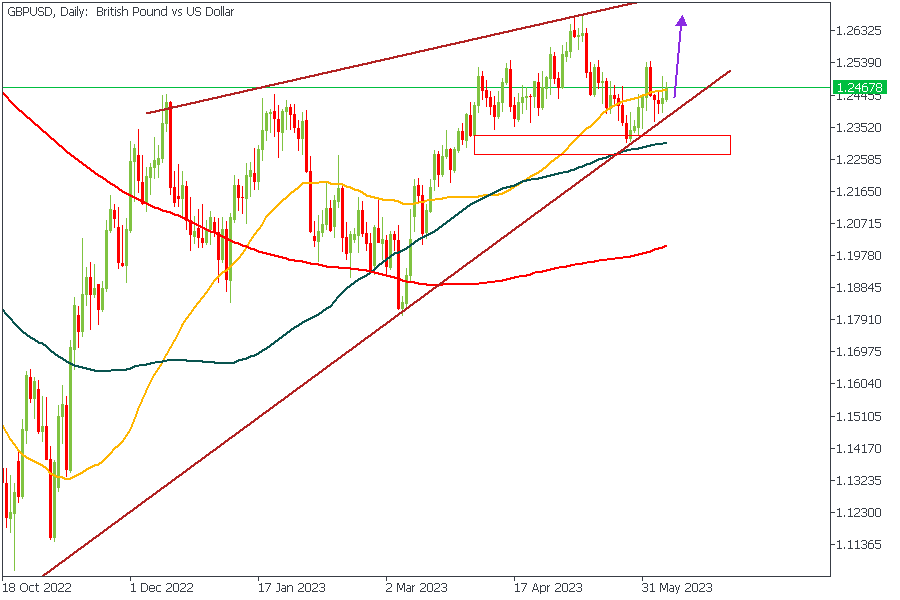
GBPUSD - Daily Timeframe
GBPUSD is trading within a rising wedge and has recently seen a clear rejection from the rally-base-rally demand zone and the moving average support. The moving average array also looks clearly bullish, and the 100-Day moving average provided ample support to confirm bullish sentiment.
Analyst’s Expectations:
- Direction: Bullish
- Target: 1.25740
- Invalidation: 1.23679
CONCLUSION
The trading of CFDs comes at a risk. Thus, to succeed, you have to manage risks properly. To avoid costly mistakes while you look to trade these opportunities, be sure to do your due diligence and manage your risk appropriately.
SEC Crackdown and the Future of Crypto
Are you aware of the recent crackdown by the SEC on major cryptocurrency exchanges, Binance US and Coinbase? Surprisingly, savvy Bitcoin traders seem unfazed, as options-based implied volatility metrics indicate. It appears that the lawsuits were anticipated and already factored into the market. Implied volatility reflects investors' expectations of price turbulence, but little evidence of heightened concern exists. Bitcoin's implied volatility has increased slightly since the SEC news, mainly in short-duration options. The impact seems more significant on alternative cryptocurrencies rather than Bitcoin and Ethereum. While the SEC's actions have affected certain altcoins, bitcoin has experienced relatively stable daily price moves. Stay vigilant and watch market developments as you navigate the exciting world of forex trading!
US DOLLAR - Daily Timeframe
The rejection from the trendline resistance has been clearly established, but we’re yet to see the price trade clear of the pivot zone. My sentiment is bearish based on the following factors;
- Trendline resistance
- Pivot zone acting as supply
- The moving average array is bearish
Analyst’s Expectations:
- Direction: Bearish
- Target: 103.252
- Invalidation: 104.249
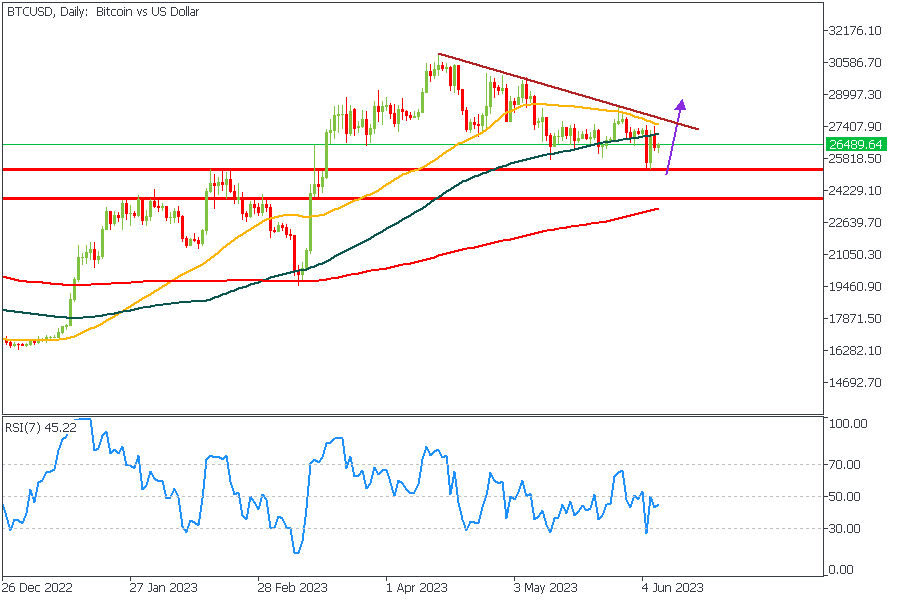
BTCUSD - Daily Timeframe
BTCUSD has been rejected from the pivot zone; however, more convincing is needed. Considering the confluence from the 200-Day moving average support, bullish moving average array, as well as the possibility of the RSI being oversold, I will patiently wait for the price to retest the pivot zone once more and then take a trigger from the lower timeframe change of structure.
Analyst’s Expectations:
- Direction: Bullish
- Target: 27618.24
- Invalidation: 24068.47
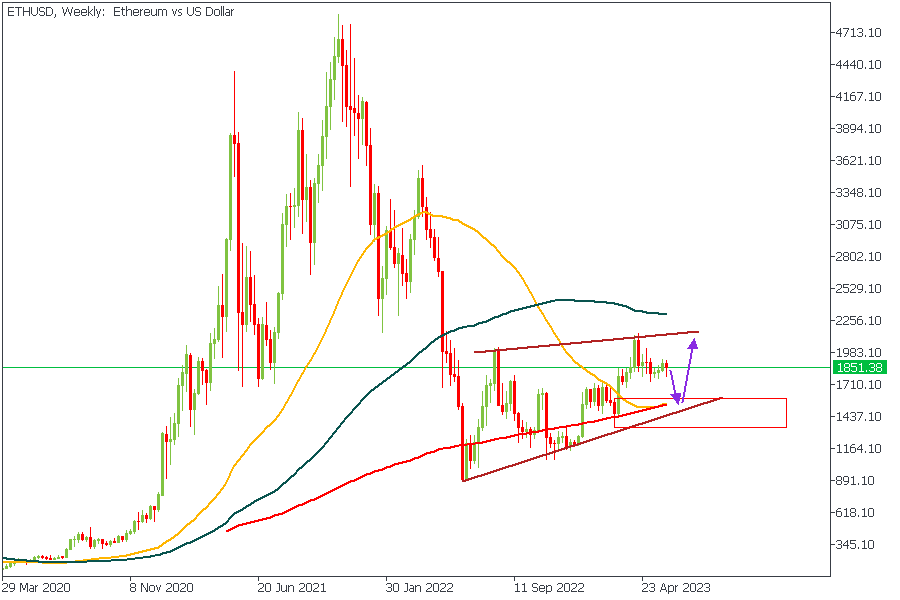
ETHUSD - Weekly Timeframe
Ethereum requires a bit of patience because the price is currently trading within a wedge pattern, and there hasn’t been a breakout of the wedge yet to signal a clear direction. However, I have a few factors pointing to the possibility of bullish price action in the nearest future, including;
- Support trendline
- Drop-base-rally demand zone
- 50-Day moving average support
- 200-Day moving average support
Analyst’s Expectations:
- Direction: Bullish
- Target: 1996.36
- Invalidation: 1341.44
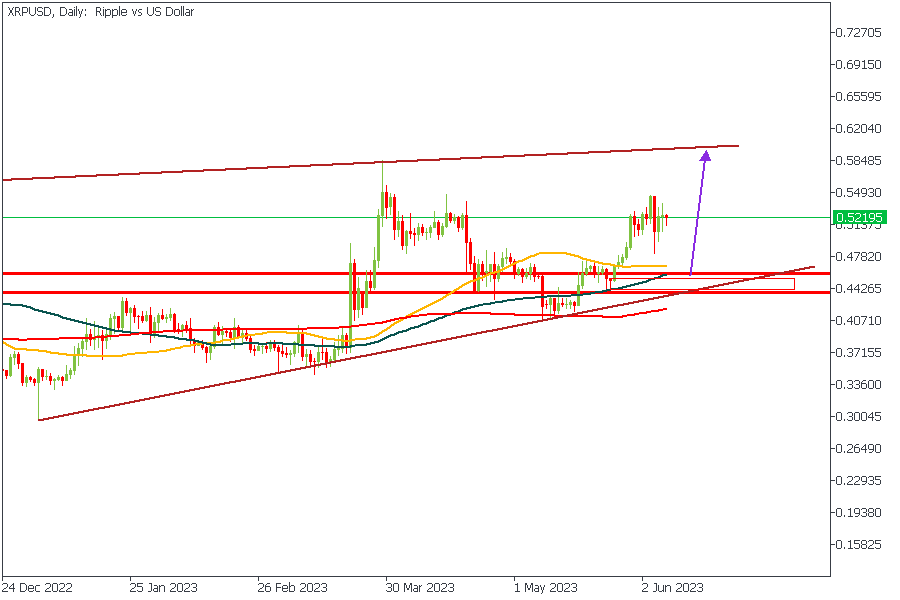
XRPUSD - Daily Timeframe
XRPUSD is trading within a rising wedge with the possibility of a retest of the trendline support. The moving average array also looks bullish, and the 50, 100, and 200 Day moving averages provided ample support to confirm bullish sentiment.
Analyst’s Expectations:
- Direction: Bullish
- Target: 0.55081
- Invalidation: 0.43797
CONCLUSION
The trading of CFDs comes at a risk. Thus, to succeed, you have to manage risks properly. To avoid costly mistakes while you look to trade these opportunities, be sure to do your due diligence and manage your risk appropriately.