

Sample Category Title
GBP/USD Daily Outlook
Daily Pivots: (S1) 1.2475; (P) 1.2518; (R1) 1.2603; More...
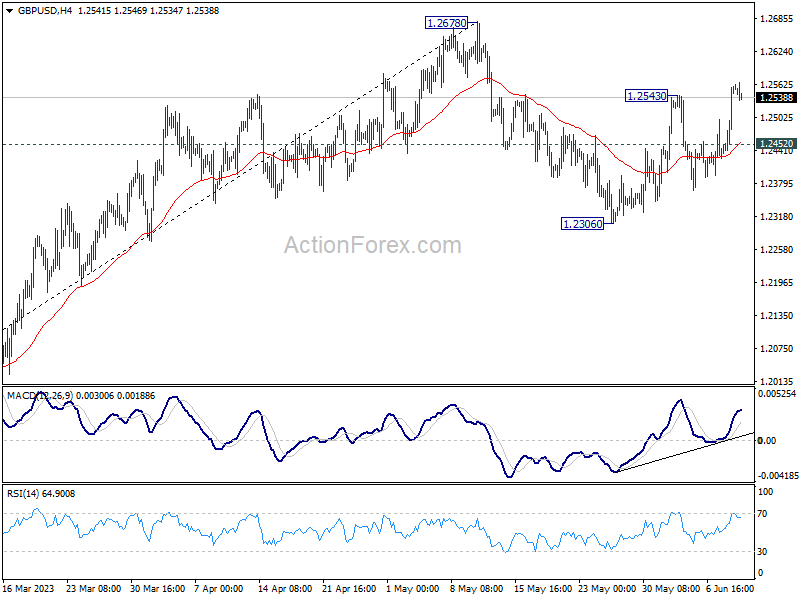
Break of 1.2543 resistance indicates resumption of the rebound from 1.2306. Intraday bias in GBP/USD is back on the upside for retesting 1.2678 high next. However, break of 1.2452 minor support will turn bias back to the downside, to extend the pattern from 1.2678 with another falling leg through 1.2306 support.
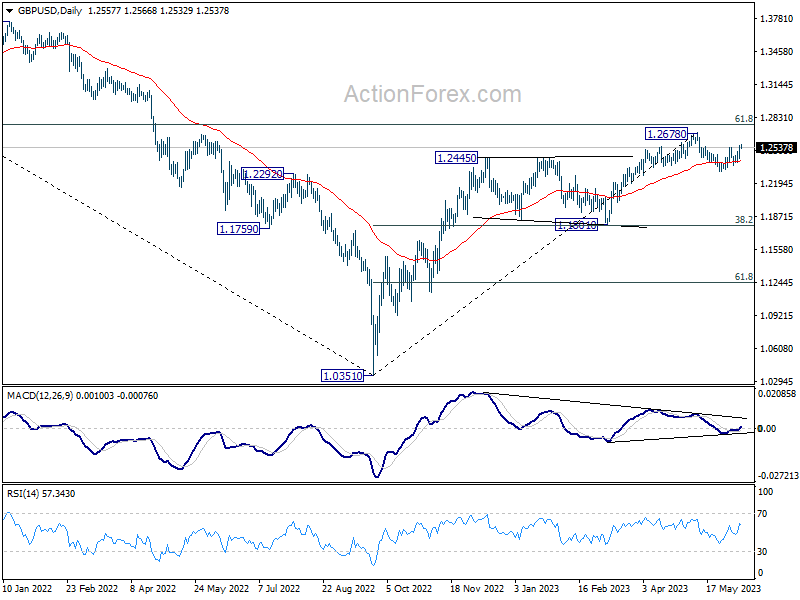
In the bigger picture, as long as 1.1801 support holds, rise from 1.0351 medium term bottom (2022 low) is expected to extend further. Sustained break of 61.8% retracement of 1.4248 (2021 high) to 1.0351 at 1.2759 will add to the case of long term bullish trend reversal. However, firm break of 1.1801 will indicate rejection by 1.2759, and bring deeper decline, even as a correction.
USD/CHF Daily Outlook
Daily Pivots: (S1) 0.8951; (P) 0.9029; (R1) 0.9070; More...
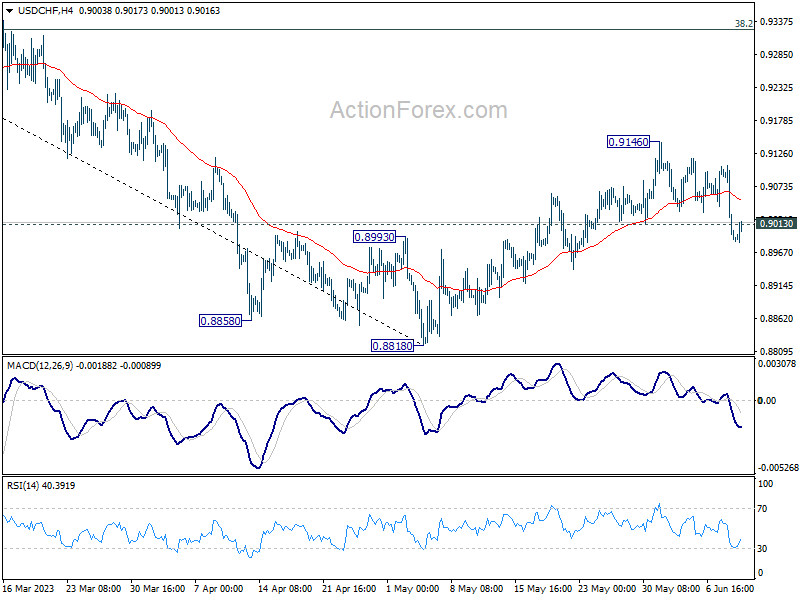
Break of 0.9013 support now suggests that USD/CHF's corrective recovery from 0.8818 has completed at 0.9146. Intraday bias is back on the downside to 0.8818 and possibly below. But strong support is still needed at around 0.8756 long term support to bring another rebound. Nevertheless, for now, risk still stay on the downside as long as 0.9146 resistance holds, in case of recovery.
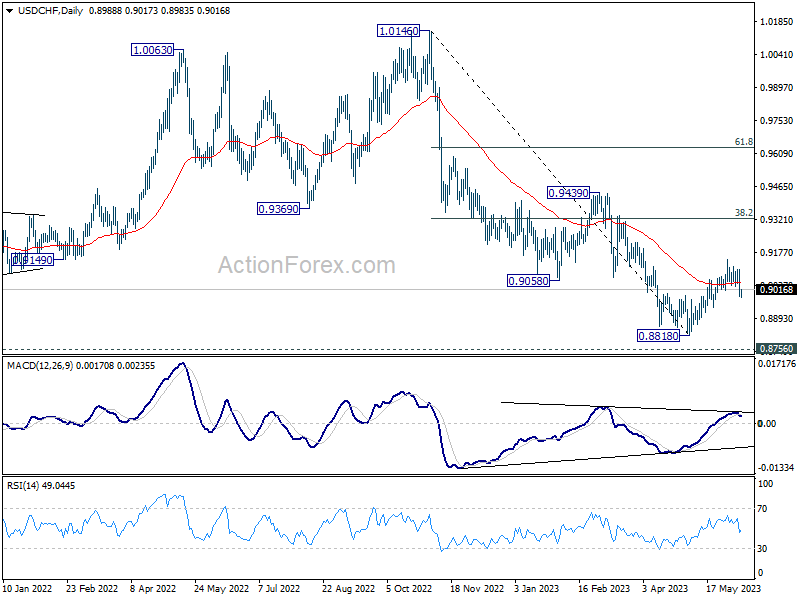
In the bigger picture, fall from 1.1046 (2022 high) is seen as a leg in the long term range pattern from 1.0342 (2016 high), which might have completed at 0.8818 already, just ahead of 0.8756 long term support. Sustained trading above 0.9058 support turned resistance should confirm medium term bottoming. Further break of 0.9439 resistance will confirm bullish trend reversal.
USD/JPY Daily Outlook
Daily Pivots: (S1) 138.41; (P) 139.32; (R1) 139.82; More...
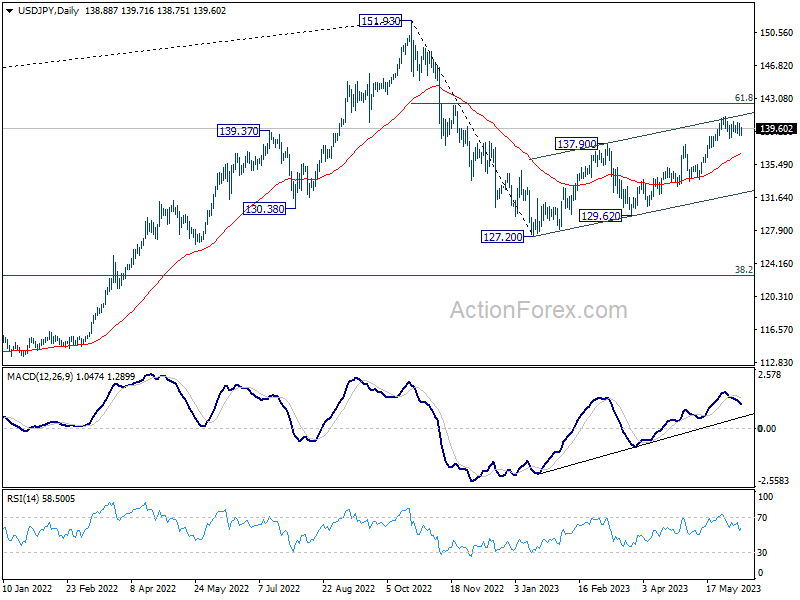
USD/JPY is still bounded in consolidation from 140.90 and intraday bias stays neutral first. With 138.22 minor support intact, further rally is expected. On the upside, break of 140.90 will resume larger rise from 127.20 to 142.48 fibonacci level. However, considering bearish divergence condition in 4 hour MACD, break of 138.22 will confirm short term topping, and turn bias back to the downside for 55 D EMA (now at 136.70).
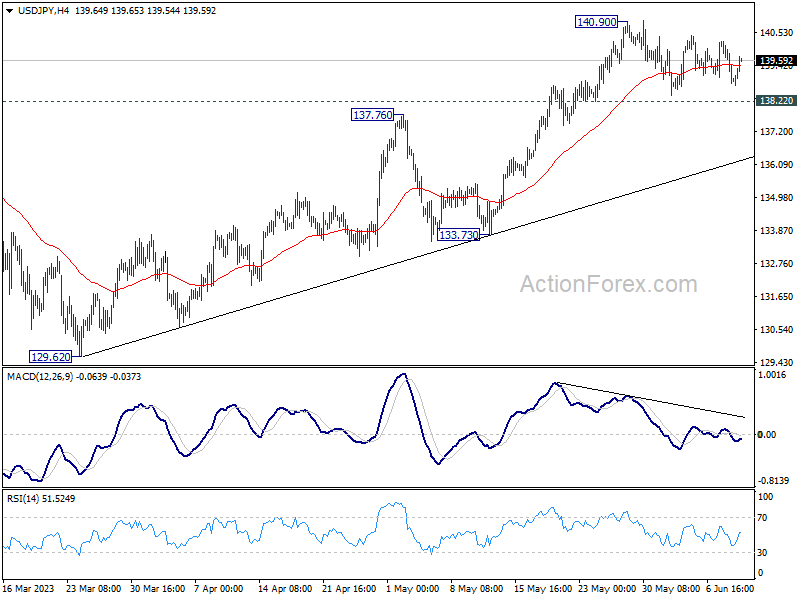
In the bigger picture, rise from 127.20 is seen as the second leg of the corrective pattern from 151.93 high. Stronger rally would be seen to 61.8% retracement of 151.93 to 127.20 at 136.34. Sustained break there will pave the way back to retest 151.93. On the downside, however, break of 133.73 support will argue that the pattern could have started the third leg through 127.20 low.
EUR/CHF Daily Outlook
Daily Pivots: (S1) 0.9669; (P) 0.9715; (R1) 0.9742; More...
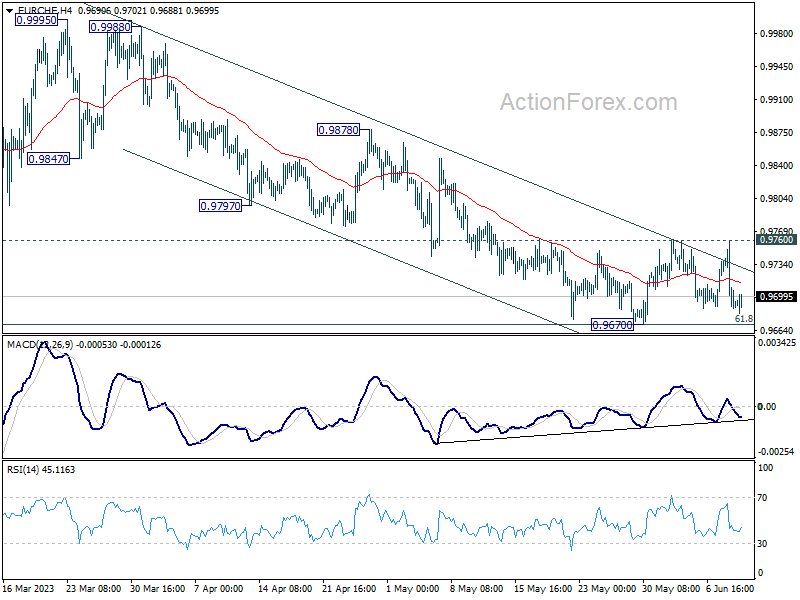
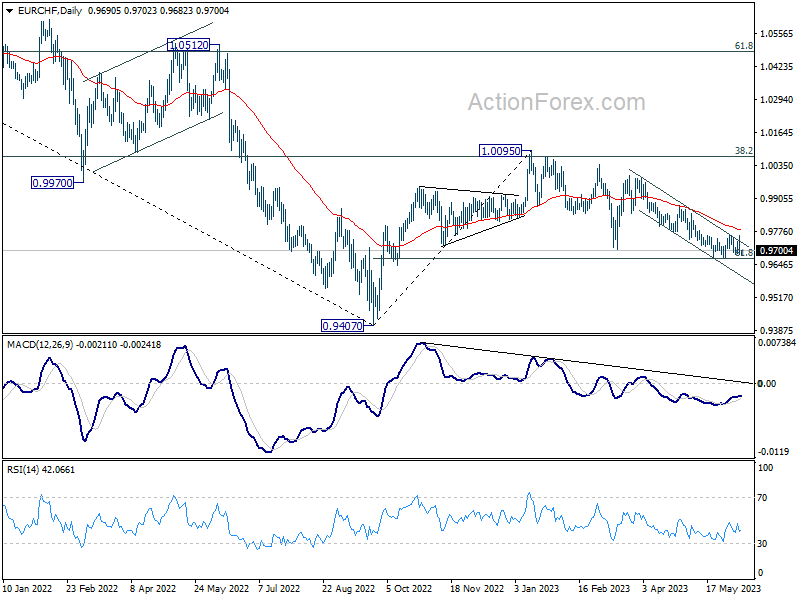
Intraday bias in EUR/CHF remains neutral for the moment. On the upside, firm break of 0.9760 resistance should confirm short term bottoming after hitting 61.8% retracement of 0.9407 to 1.0095 at 0.9670. Intraday bias will be back on the upside for 0.9878 resistance next. However, sustained break of 0.9670 will extend the whole decline from 1.0095 towards 0.9407 low instead.
In the bigger picture, prior rejection by 38.2% retracement of 1.1149 to 0.9407 at 1.0072 suggests that medium term outlook is staying bearish. The pair is also capped below 55 W EMA (now at 0.9938). Down trend from 1.2004 (2018 high) is not completed yet and is in favor to resume through 0.9407 at a later stage. However, decisive break of 1.0095 resistance will raise the chance of bullish trend reversal. Rise from 0.9407 should then target 1.0505 cluster resistance (2020 low at 1.0505, 61.8% retracement of 1.1149 to 0.9407 at 1.1484).
EUR/GBP Daily Outlook
Daily Pivots: (S1) 0.8574; (P) 0.8594; (R1) 0.8605; More....
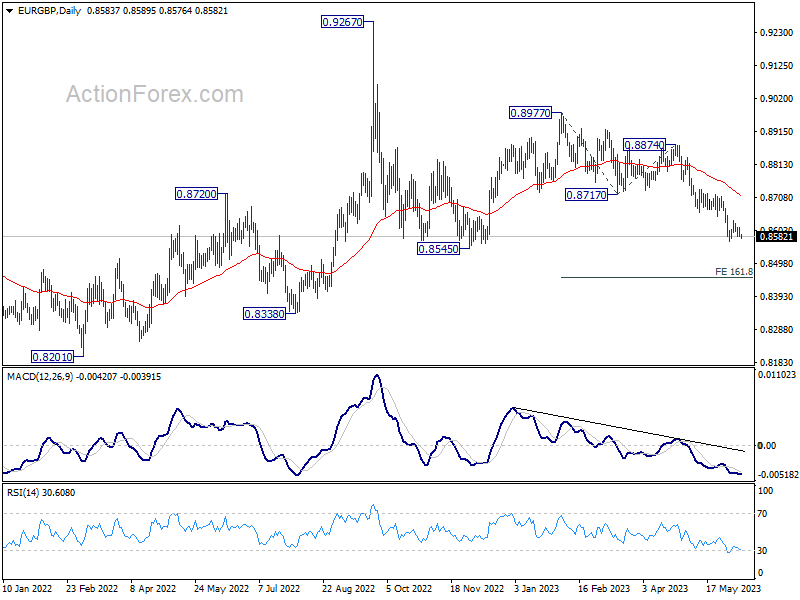
Intraday bias in EUR/GBP stays neutral as consolidation from 0.8566 is in progress. Upside of recovery should be limited by 0.8660 support turned resistance and bring another fall. Break of 0.8566 will resume the fall from 0.8977, and target 161.8% projection of 0.8977 to 0.8717 from 0.8874 at 0.8453. Nevertheless, firm break of 0.8660 will confirm short term bottoming, and turn bias back to the upside for stronger rebound.
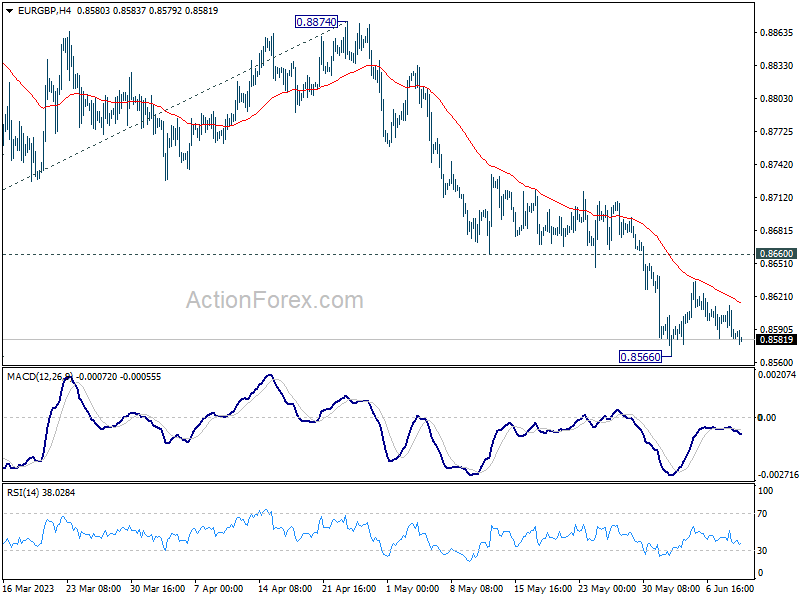
In the bigger picture, current development argues that whole decline from 0.9267 (2022 high) is still in progress. This is part of the long term range pattern from 0.9499 (2020 high). Deeper fall would be seen through 0.8545 support. This will now remain the favored case as long as 0.8717 support turned resistance holds.
EUR/AUD Daily Outlook
Daily Pivots: (S1) 1.6021; (P) 1.6056; (R1) 1.6093; More...
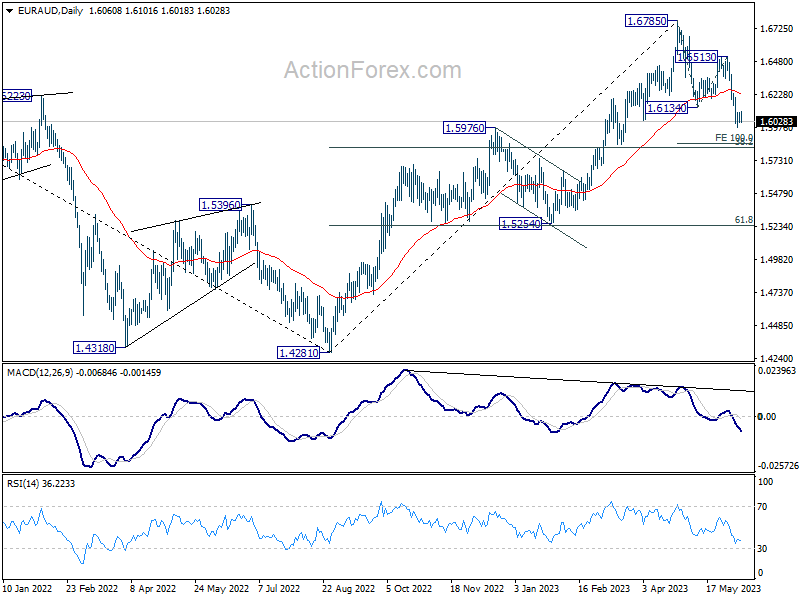
Intraday bias in EUR/AUD stays neutral for the moment. Risk will stay on the downside as long as 1.6513 resistance holds. Below 1.5976 will resume the fall from 1.6785 to 100% projection of 1.6785 to 1.6134 from 1.6513 at 1.5862.
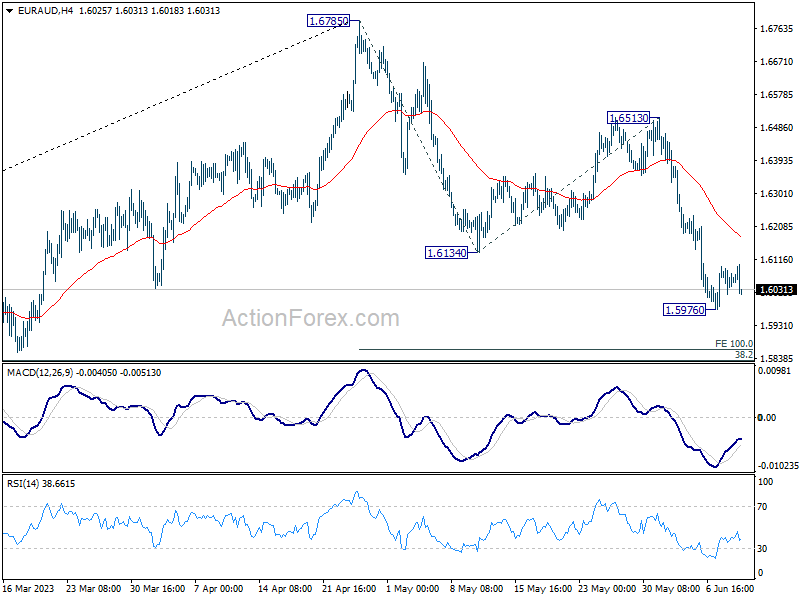
In the bigger picture, a medium term top is possibly in place at 1.6785 already, on bearish divergence condition in D MACD. Fall from there is seen as correcting whole up trend from 1.4281 (2022 low). Deeper decline is expected as long as 1.6513 resistance holds, to 38.2% retracement of 1.4281 to 1.6785 at 1.5828. Strong support could be seen there to complete the first leg of the corrective pattern.
EUR/JPY Daily Outlook
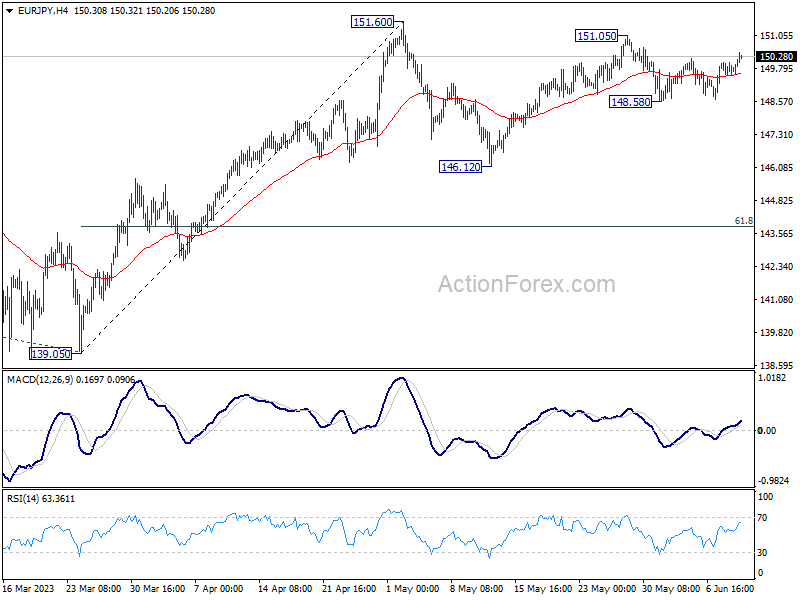
Daily Pivots: (S1) 149.58; (P) 149.81; (R1) 150.04; More....
Intraday bias in EUR/JPY stays neutral at this point. On the upside, above 151.05 will target 151.60 high. Firm break there will resume larger up trend to 153.64 projection level. On the downside, below 148.58 will extend the corrective pattern from 151.60 with another falling leg. Deeper fall would be seen to 146.12 support and possibly below.
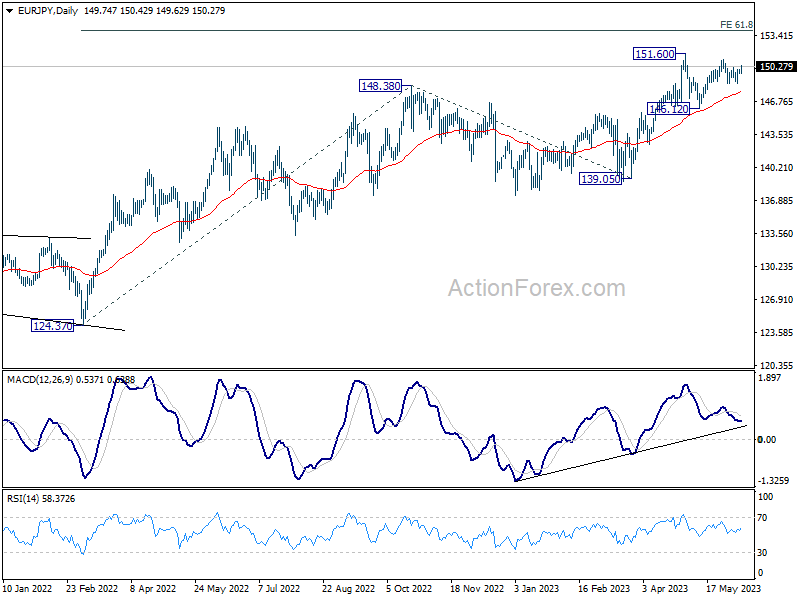
In the bigger picture, rise from 114.42 (2020 low) is in progress. Next target is 61.8% projection of 124.37 to 148.38 from 138.81 at 153.64. Sustained break there will pave the way to 100% projection at 162.82. For now, medium term outlook will remain bullish as long as 139.05 support holds, even in case of deep pull back.
AUD/JPY Technical: Rallied to 6-month High
- AUD/JPY has staged a bullish breakout from its major descending channel and traded back above its 200-day moving average.
- Short-term momentum remains positive supported by the 1-hour RSI oscillator.
- Key short-term support to watch for AUD/JPY is at 92.70.
The ongoing 11-week up move from the 24 March 2023 low of 86.06 seen in the AUD/JPY has been reinforced by several positive technical elements; the cross pair has rallied by 755 pips (+8.8%) from its 24 March 2023 low to today’s current intraday level of 93.60 (6-month high) at this time of the writing.
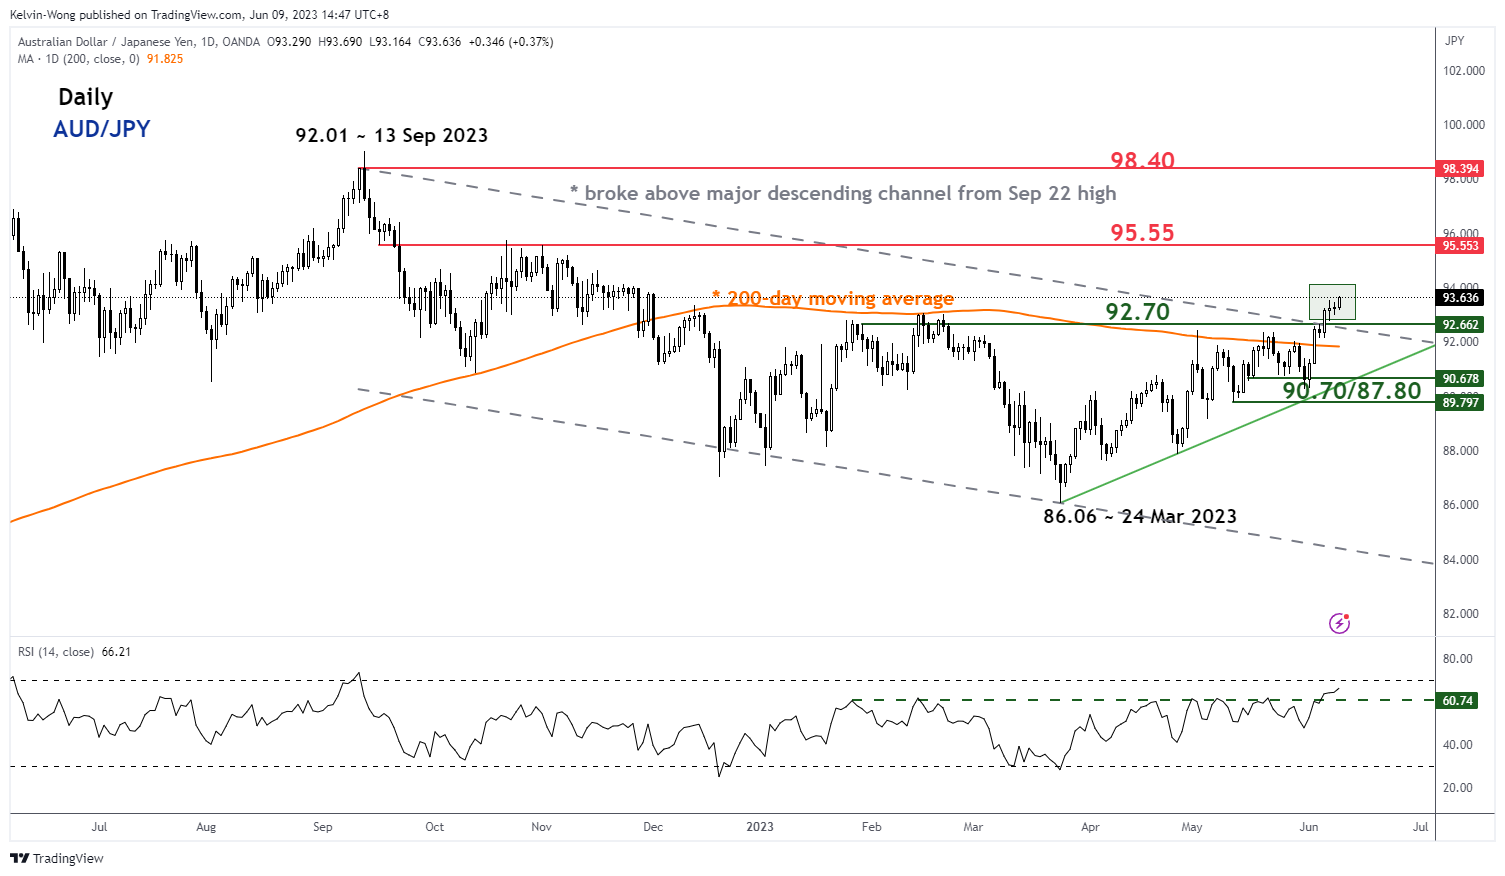
Fig 1: AUD/JPY medium-term trend as of 9 Jun 2023 (Source: TradingView, click to enlarge chart)
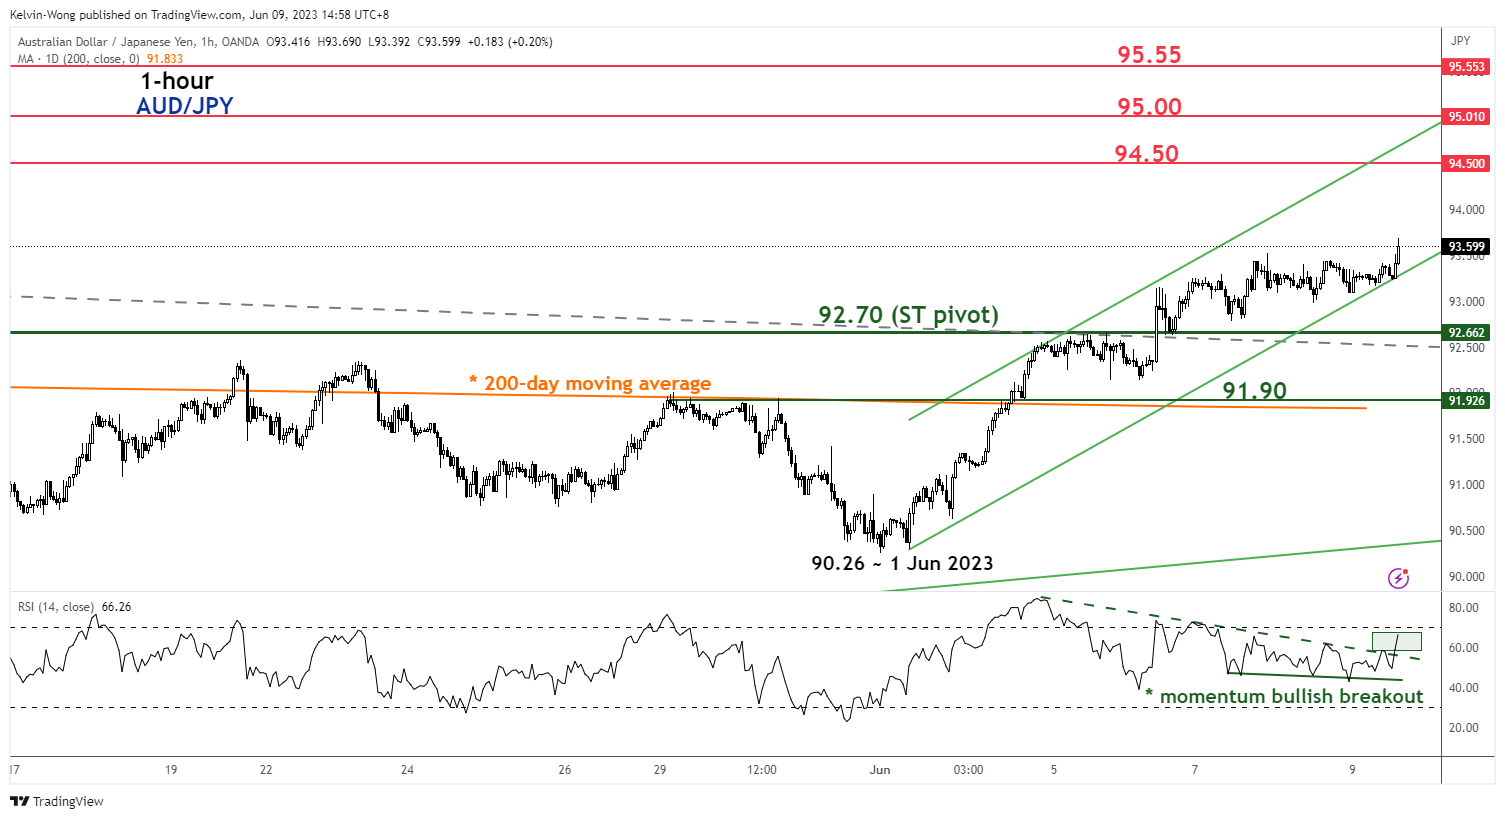
Fig 2: AUD/JPY minor short-term trend as of 9 Jun 2023 (Source: TradingView, click to enlarge chart)
Bullish breakout from the major descending channel from September 2022 high
AUD/JPY has managed to exit from the upper boundary (resistance) of the major descending channel on 6 June 2023 and so far, traded above it which now turns into a pull-back support at 92.70. These observations suggest that the AUD/JPY may be in undergoing a potential new leg of medium-term up move (refer to daily chart)
Short-term momentum remains positive
As seen from the 1-hour chart, the price actions of AUD/JPY have started to evolve within a minor ascending channel in place since the 1 June 2023 low of 90.26 coupled with a momentum bullish breakout condition seen in the 1-hour RSI oscillator.
The next intermediate resistances stand at 94.50 and 95.00 (the upper boundary of the minor ascending channel). However, failure to hold above the 92.70 key short-term pivotal support negates the bullish tone to expose the next support at 91.90 (also the 200-day moving average).
GBPJPY at 7-Year High; Bulls Look Tired
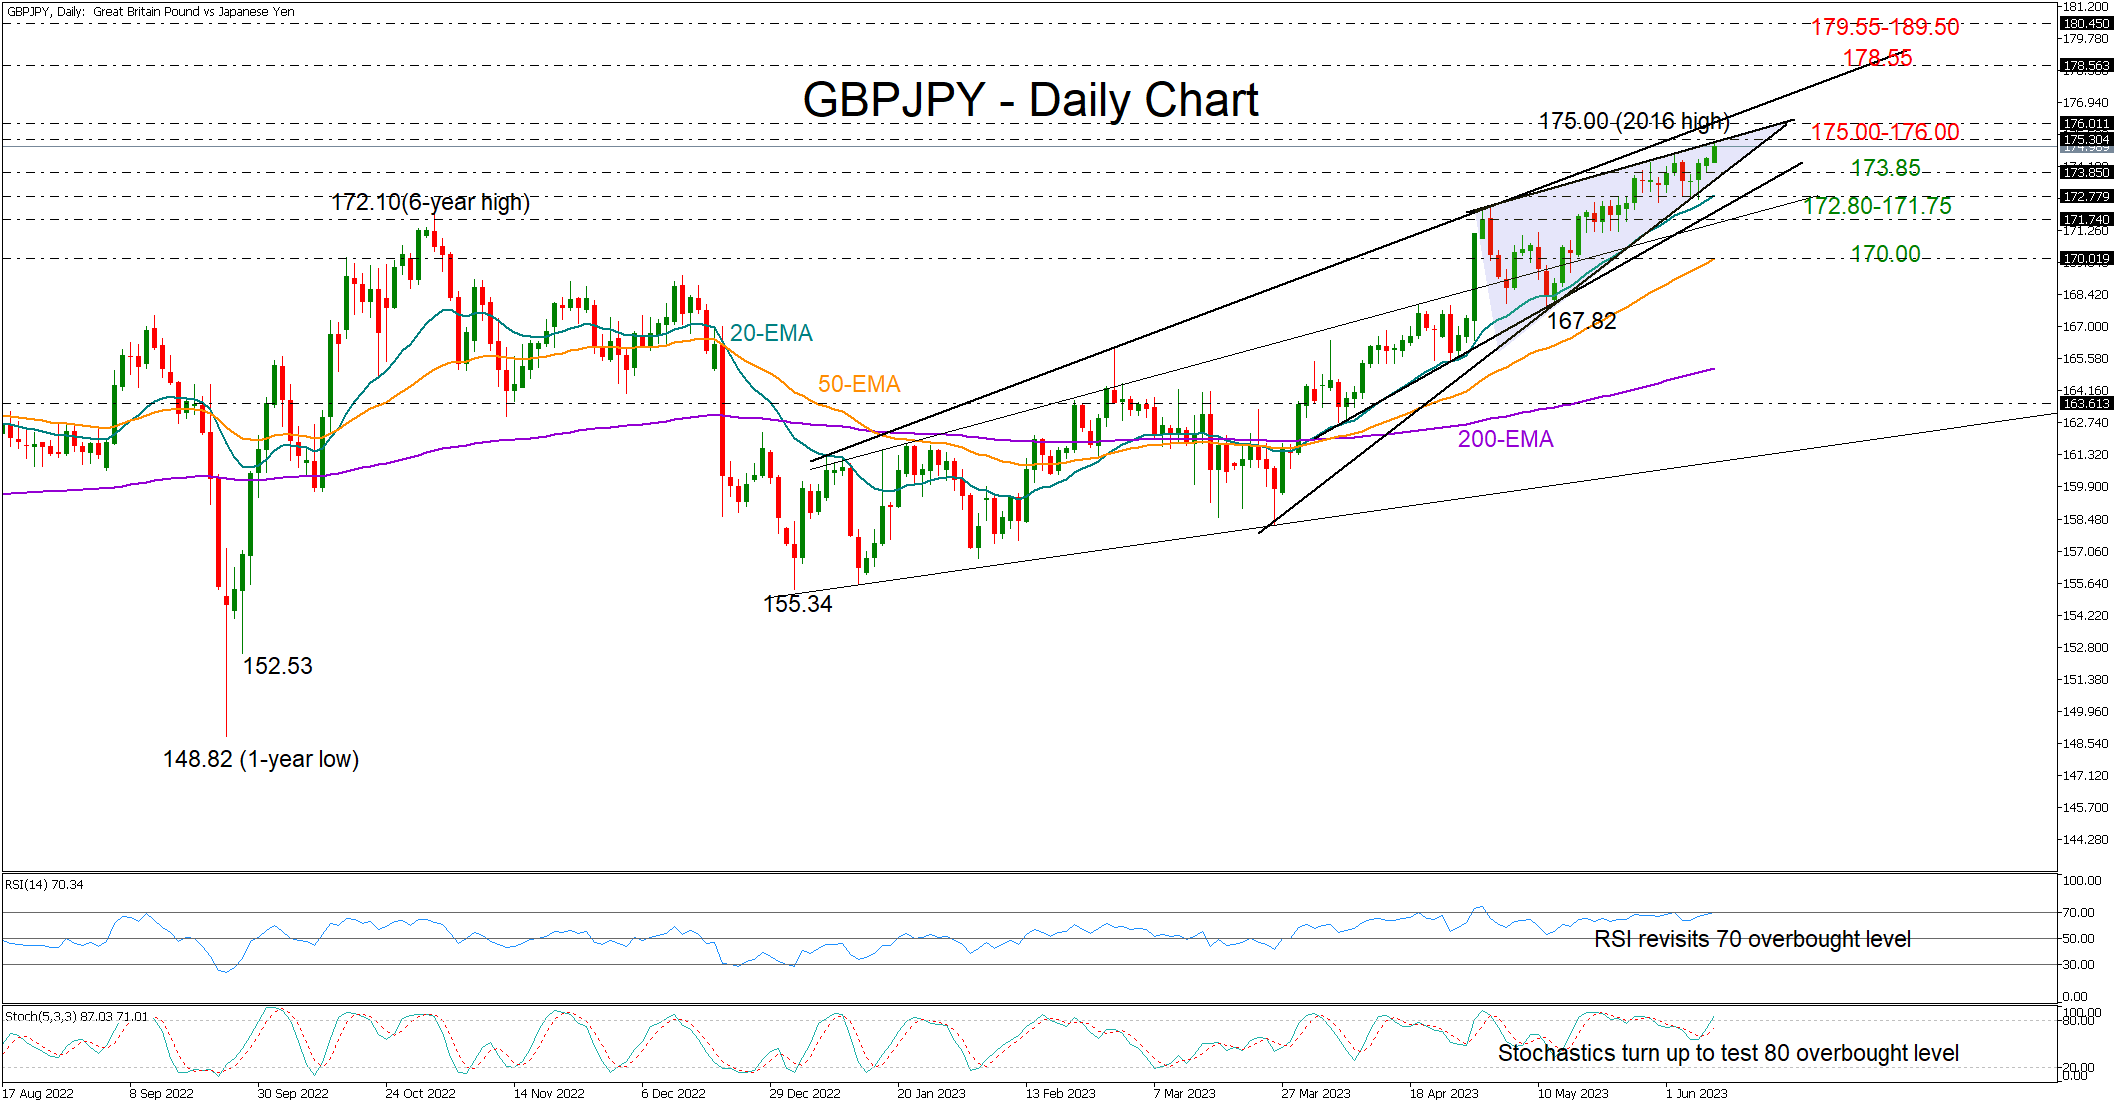
GBPJPY picked up steam to extend its uptrend towards the 2016 high of 175.00 and further above its exponential moving averages (EMAs) early on Friday.
The RSI and the stochastic oscillator are hinting at overbought conditions in all timeframes, warning that the bullish wave in the price is nearing a peak. The pair also seems to be trading within a rising wedge triangle, increasing the risk of a bearish correction.
Nevertheless, the clear positive trajectory in the price might keep buyers active in the short term, especially if the 175.00-176.00 wall, which includes the triangle’s upper band and the resistance trendline from January, collapses. If that proves to be the case, the rally could accelerate towards the 178.55 barrier or higher to the 179.55-180.50 constraining zone last active in 2015-2016.
Should the pair exit the rising wedge on the downside (173.85), it may initially seek support somewhere within the 172.80-171.75 area, where the 20-day EMA and a couple of trendlines are placed. Falling lower, the next pivot could occur near the 50-day EMA and the 170.00 psychological mark, a break of which could see a continuation towards the previous low of 167.82.
In brief, GBPJPY has a bullish outlook, although the momentum indicators warn of some caution. A sustainable bounce above the 175.00-176.00 territory is required to add fresh impetus to the price.
AUD/NZD and EUR/GBP Weekly Chart Outlook
AUD/NZD is facing major resistance near the 1.0985 zone. EUR/GBP broke a crucial support at 0.8720 and might continue to move lower.
Important Takeaways for AUD/NZD and EUR/GBP Analysis
- The Aussie Dollar started a recovery wave from the 1.0600 support against the New Zealand Dollar.
- There is a key bullish trend line forming with support near 1.0600 on the weekly chart of AUD/NZD at FXOpen.
- EUR/GBP started a major decline from the 0.9000 resistance zone.
- It traded below a major bullish trend line with support near 0.8720 on the weekly chart at FXOpen.
AUD/NZD Technical Analysis
On the weekly chart of AUD/NZD at FXOpen, the pair found support near 1.0500. The Aussie Dollar formed a base above the 1.0600 pivot level against the New Zealand Dollar.
There was a decent increase above the 23.6% Fib retracement level of the downward move from the 1.1489 swing high to the 1.0479 low. Earlier this year, the pair even pumped above the 1.0920 resistance zone.
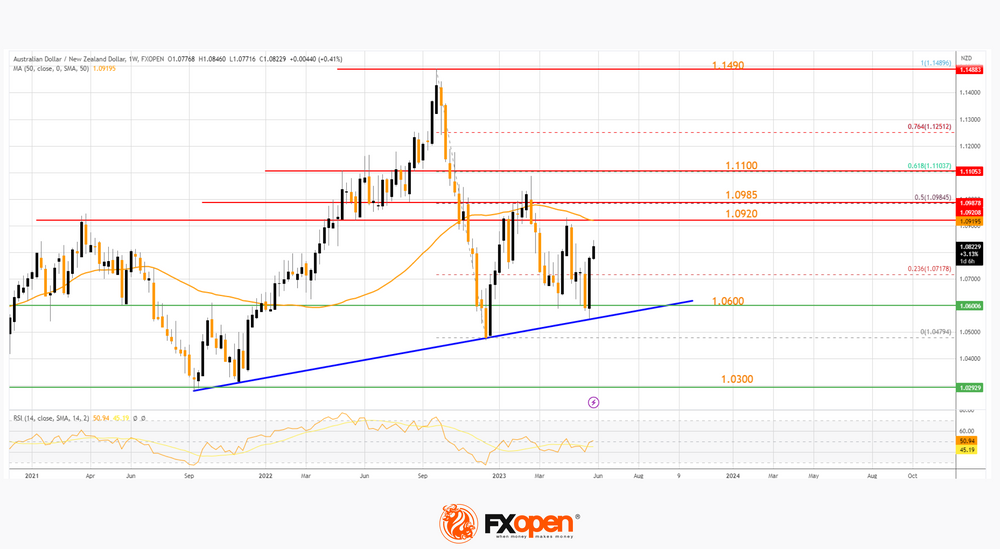
However, the bears were active near the 50% Fib retracement level of the downward move from the 1.1489 swing high to the 1.0479 low. The pair declined and revisited the 1.0600 support. It is again moving higher toward the 50-week simple moving average at 1.0920.
On the AUD/NZD chart, the pair could struggle to surpass 1.0920 and 1.0985. Only a successful daily close above 1.0985 might start a strong increase. The next major resistance sits near the 1.1100 level.
On the downside, the first major support is near a key bullish trend line at 1.0600. The next major support is near the 1.0300 level, below which the pair may perhaps extend its decline toward the 1.0150 level. Any more losses might call for a move toward the 1.0000 level.
EUR/GBP Technical Analysis
On the weekly chart of EUR/GBP at FXOpen, the pair started a major decline from the 0.9000 zone. The Euro declined below the 0.8880 pivot level to move into a bearish zone against the British Pound.
More importantly, it traded below a major bullish trend line with support near 0.8720. The pair is now trading below the 50-week simple moving average and the 50% Fib retracement level of the upward move from the 0.8202 swing low to the 0.9236 high.
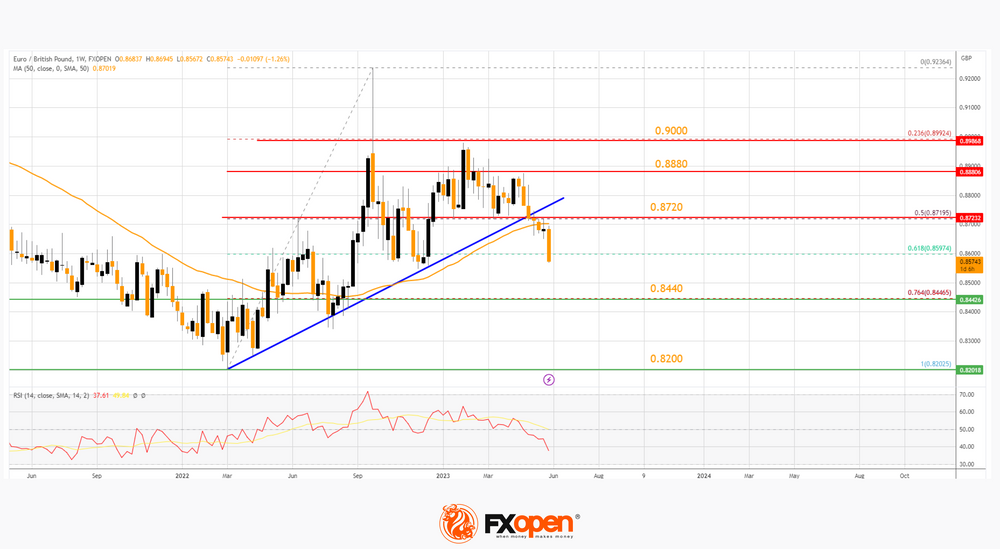
It seems like the pair might continue to move lower toward the 0.8440 support considering the RSI dipped below 50. It coincides with the 76.4% Fib retracement level of the upward move from the 0.8202 swing low to the 0.9236 high.
The next major support is near 0.8200, below which EUR/GBP might decline toward the 0.8000 support zone. Any more losses could open the doors for a drop toward the 0.8000 level.
Immediate resistance on the EUR/GBP chart is near the 50-week simple moving average at 0.8720. The next major resistance on the upside is near the 0.8880 level.
A successful close above 0.8880 could start a solid upward move toward the 0.9200 resistance. Any more gains might send the pair toward the 0.9500 level.