Sample Category Title
USD/CHF Mid-Day Outlook
Daily Pivots: (S1) 0.8951; (P) 0.9029; (R1) 0.9070; More...
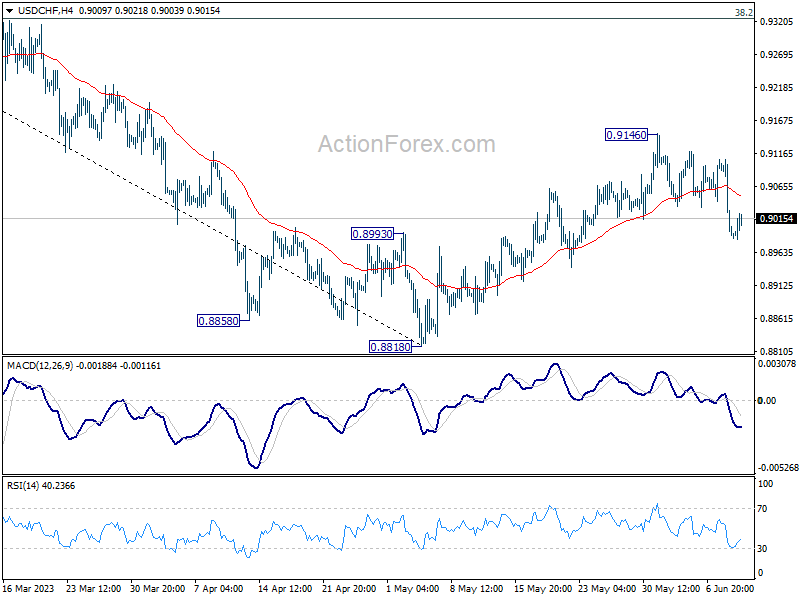
Intraday bias in USD/CHF stays mildly on the downside for the moment. Corrective recovery from 0.8818 could have completed at 0.9146 already. Deeper fall would be seen back to 0.8818 and possibly below. But strong support is still needed at around 0.8756 long term support to bring another rebound. Nevertheless, for now, risk still stay on the downside as long as 0.9146 resistance holds, in case of recovery.
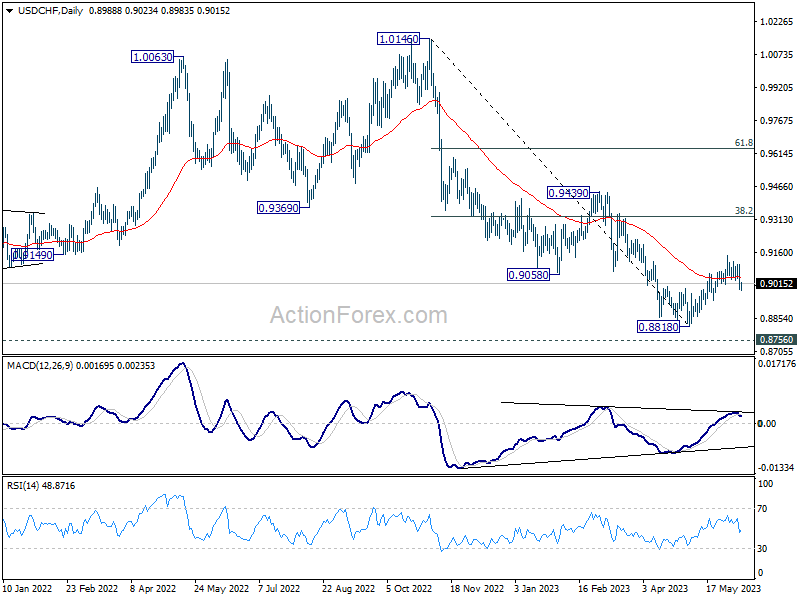
In the bigger picture, fall from 1.1046 (2022 high) is seen as a leg in the long term range pattern from 1.0342 (2016 high), which might have completed at 0.8818 already, just ahead of 0.8756 long term support. Sustained trading above 0.9058 support turned resistance should confirm medium term bottoming. Further break of 0.9439 resistance will confirm bullish trend reversal.
USD/JPY Mid-Day Outlook
Daily Pivots: (S1) 138.41; (P) 139.32; (R1) 139.82; More...
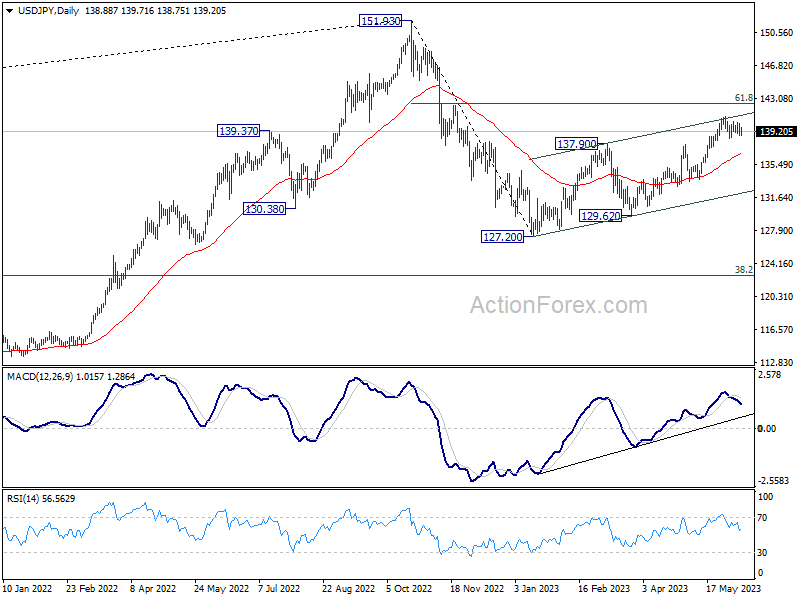
Sideway trading continues in USD/JPY and intraday bias remains neutral at this point. With 138.22 minor support intact, further rally is expected. On the upside, break of 140.90 will resume larger rise from 127.20 to 142.48 fibonacci level. However, considering bearish divergence condition in 4 hour MACD, break of 138.22 will confirm short term topping, and turn bias back to the downside for 55 D EMA (now at 136.70).
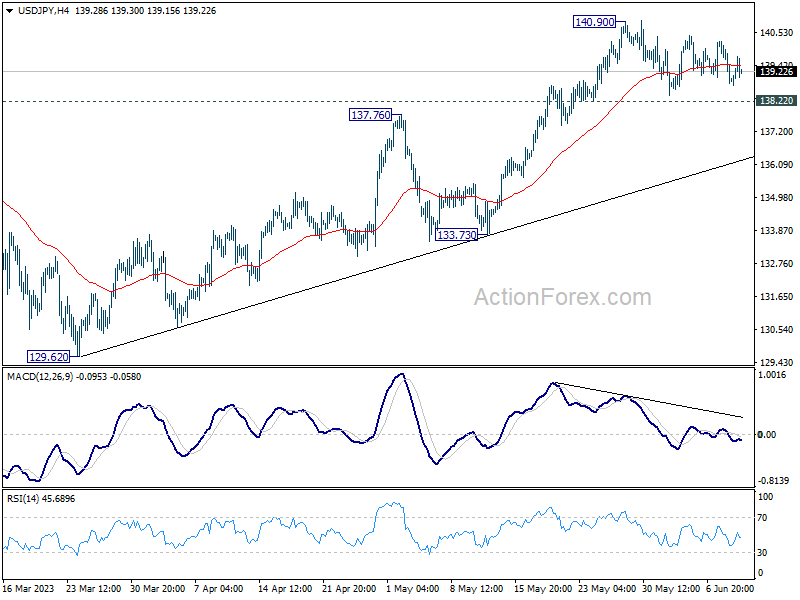
In the bigger picture, rise from 127.20 is seen as the second leg of the corrective pattern from 151.93 high. Stronger rally would be seen to 61.8% retracement of 151.93 to 127.20 at 136.34. Sustained break there will pave the way back to retest 151.93. On the downside, however, break of 133.73 support will argue that the pattern could have started the third leg through 127.20 low.
Yen Staying Generally Weak, Canadian Shrugs Poor Job Data
Yen remains the worst performer for the day, but selloff appears to have slowed somewhat. Meanwhile, Euro and Swiss Franc are also softening, thanks to selling against Sterling. Canadian Dollar is mixed for now, with muted reaction to worse than expected job data from Canada. While the data doesn't add to the case for another rate hike by BoC in July, the eventual outcome will still very much depend on the next around of economic projections. Meanwhile, Australian and New Zealand Dollars are the better performers today. US Dollar turned mixed digesting some of this week's losses.
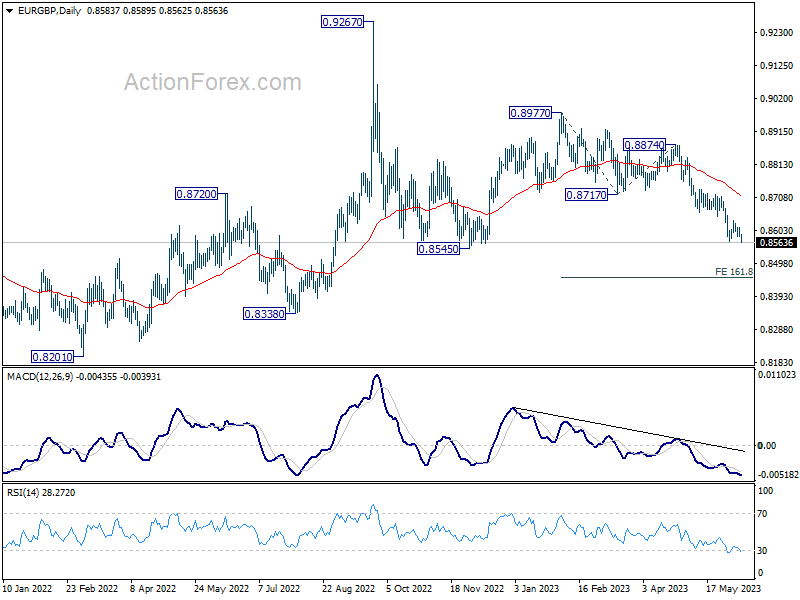
Technically, EUR/GBP is finally resuming recent decline from 0.8977. Next target is 0.8545 support and then 161.8% projection of 0.8977 to 0.8717 from 0.8874 at 0.8453. The question is whether the selloff in EUR/GBP would spread to other Euro pairs. In particular, attention would be on whether EUR/CHF could break through 0.9670 support to resume larger decline.
In Europe, at the time of writing, FTSE is down -0.51%. DAX is down -0.16%. CAC is down -0.29%. Germany 10-year yield is down -0.026 at 2.379. Earlier in Asia, Nikkei rose 1.97%. Hong Kong HSI rose 0.47%. China Shanghai SSE rose 0.55%. Singapore Strait Times rose 0.01%. Japan 10-year JGB yield dropped -0.0070 to 0.435.
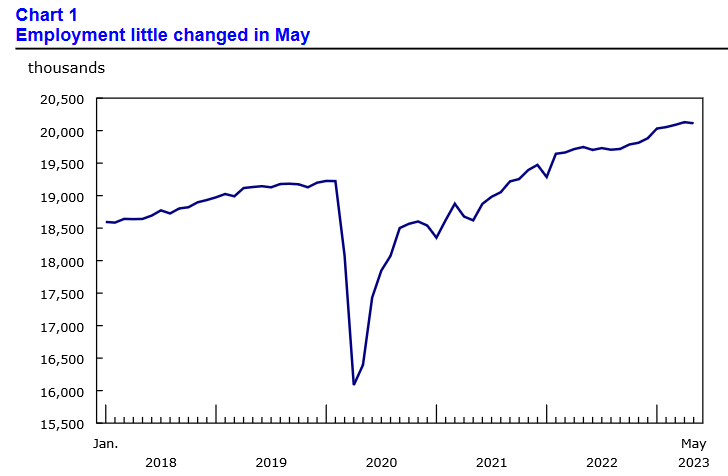
Canada employment down -17.3k in May, unemployment rate rose to 5.2%
Canada employment dropped -17.3k, or -0.1% mom in May, worse than expectation of 21.2k growth. That compared to average 33k monthly growth from February to April. Employment was down -30k in the services-producing sector, and up 23k in the goods-producing sector.
Employment rate dropped -0.3% to 62.1%, reflecting strong population growth of 83k in the month.
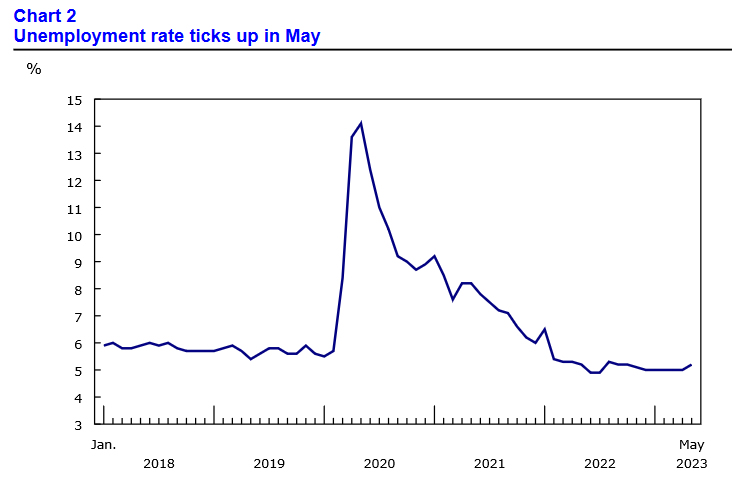
Unemployment rate rose from 5.0% to 5.2%, above expectation of 5.1%. That's the first monthly increase since August 2022.
BoJ to persist with monetary easing amid inflation uncertainty, says Ueda
BoJ is committed to maintaining its monetary easing policy as it seeks to sustainably achieve its 2% inflation target, stated BOJ Governor Kazuo Ueda in a parliamentary address.
He acknowledged, "There's still some distance to sustainably and stably achieve our 2% inflation target. As such, we will patiently maintain our monetary easing policy."
Ueda explained that the central bank's strategy is to initiate a positive cycle in which inflation-adjusted wages will start to rise.
However, he also indicated that BOJ anticipates core consumer inflation to dip below 2% target in the latter half of the fiscal year. Despite this projection, Ueda expressed that there remains a substantial degree of uncertainty surrounding the inflation outlook.
One key factor he highlighted is corporate price-setting behaviour, which he stated was "somewhat overshooting expectations."
China CPI ticked up to 0.2% yoy in May, but PPI down -4.6% yoy
China CPI ticked up slightly from 0.1% yoy to 0.2% yoy in May, above expectation of 0.1% yoy. Core CPI, which excludes volatile food and energy prices, slowed from 0.7% yoy to 0.6% yoy.
Food price rose 1.0% yoy, up from prior month's 0.4% yoy. However, price for industrial consumer products dropped -1.7% yoy, worse than April's -1.5% yoy. On a month-on-month basis CPI dropped -0.2% mom, deeper than April's -0.1% mom.
PPI dropped from -3.60% yoy to -4.6% yoy, below expectation of -3.9% yoy. That's also the steepest decline in seven years since May 2016.
Dong Lijuan, an NBS statistician, said the consumer inflation picked up marginally with the gradual recovery in consumer demand, while the fall in factory-gate prices was affected by declining international commodity prices, weak demand for industrial products at both home and abroad, as well as a high comparison base in the previous year.
USD/JPY Mid-Day Outlook
Daily Pivots: (S1) 138.41; (P) 139.32; (R1) 139.82; More...
Sideway trading continues in USD/JPY and intraday bias remains neutral at this point. With 138.22 minor support intact, further rally is expected. On the upside, break of 140.90 will resume larger rise from 127.20 to 142.48 fibonacci level. However, considering bearish divergence condition in 4 hour MACD, break of 138.22 will confirm short term topping, and turn bias back to the downside for 55 D EMA (now at 136.70).
In the bigger picture, rise from 127.20 is seen as the second leg of the corrective pattern from 151.93 high. Stronger rally would be seen to 61.8% retracement of 151.93 to 127.20 at 136.34. Sustained break there will pave the way back to retest 151.93. On the downside, however, break of 133.73 support will argue that the pattern could have started the third leg through 127.20 low.
Economic Indicators Update
| GMT | Ccy | Events | Actual | Forecast | Previous | Revised |
|---|---|---|---|---|---|---|
| 23:50 | JPY | Money Supply M2+CD Y/Y May | 2.70% | 2.50% | 2.50% | 2.60% |
| 01:30 | CNY | CPI Y/Y May | 0.20% | 0.10% | 0.10% | |
| 01:30 | CNY | PPI Y/Y May | -4.60% | -3.90% | -3.60% | |
| 08:00 | EUR | Italy Industrial Output M/M Apr | -1.90% | 0.10% | -0.60% | |
| 12:30 | CAD | Capacity Utilization Q1 | 81.90% | 82.20% | 81.70% | |
| 12:30 | CAD | Net Change in Employment May | -17.3K | 21.2K | 41.4K | |
| 12:30 | CAD | Unemployment Rate May | 5.20% | 5.10% | 5.00% |
Gold Loses Pace Near Key Barrier
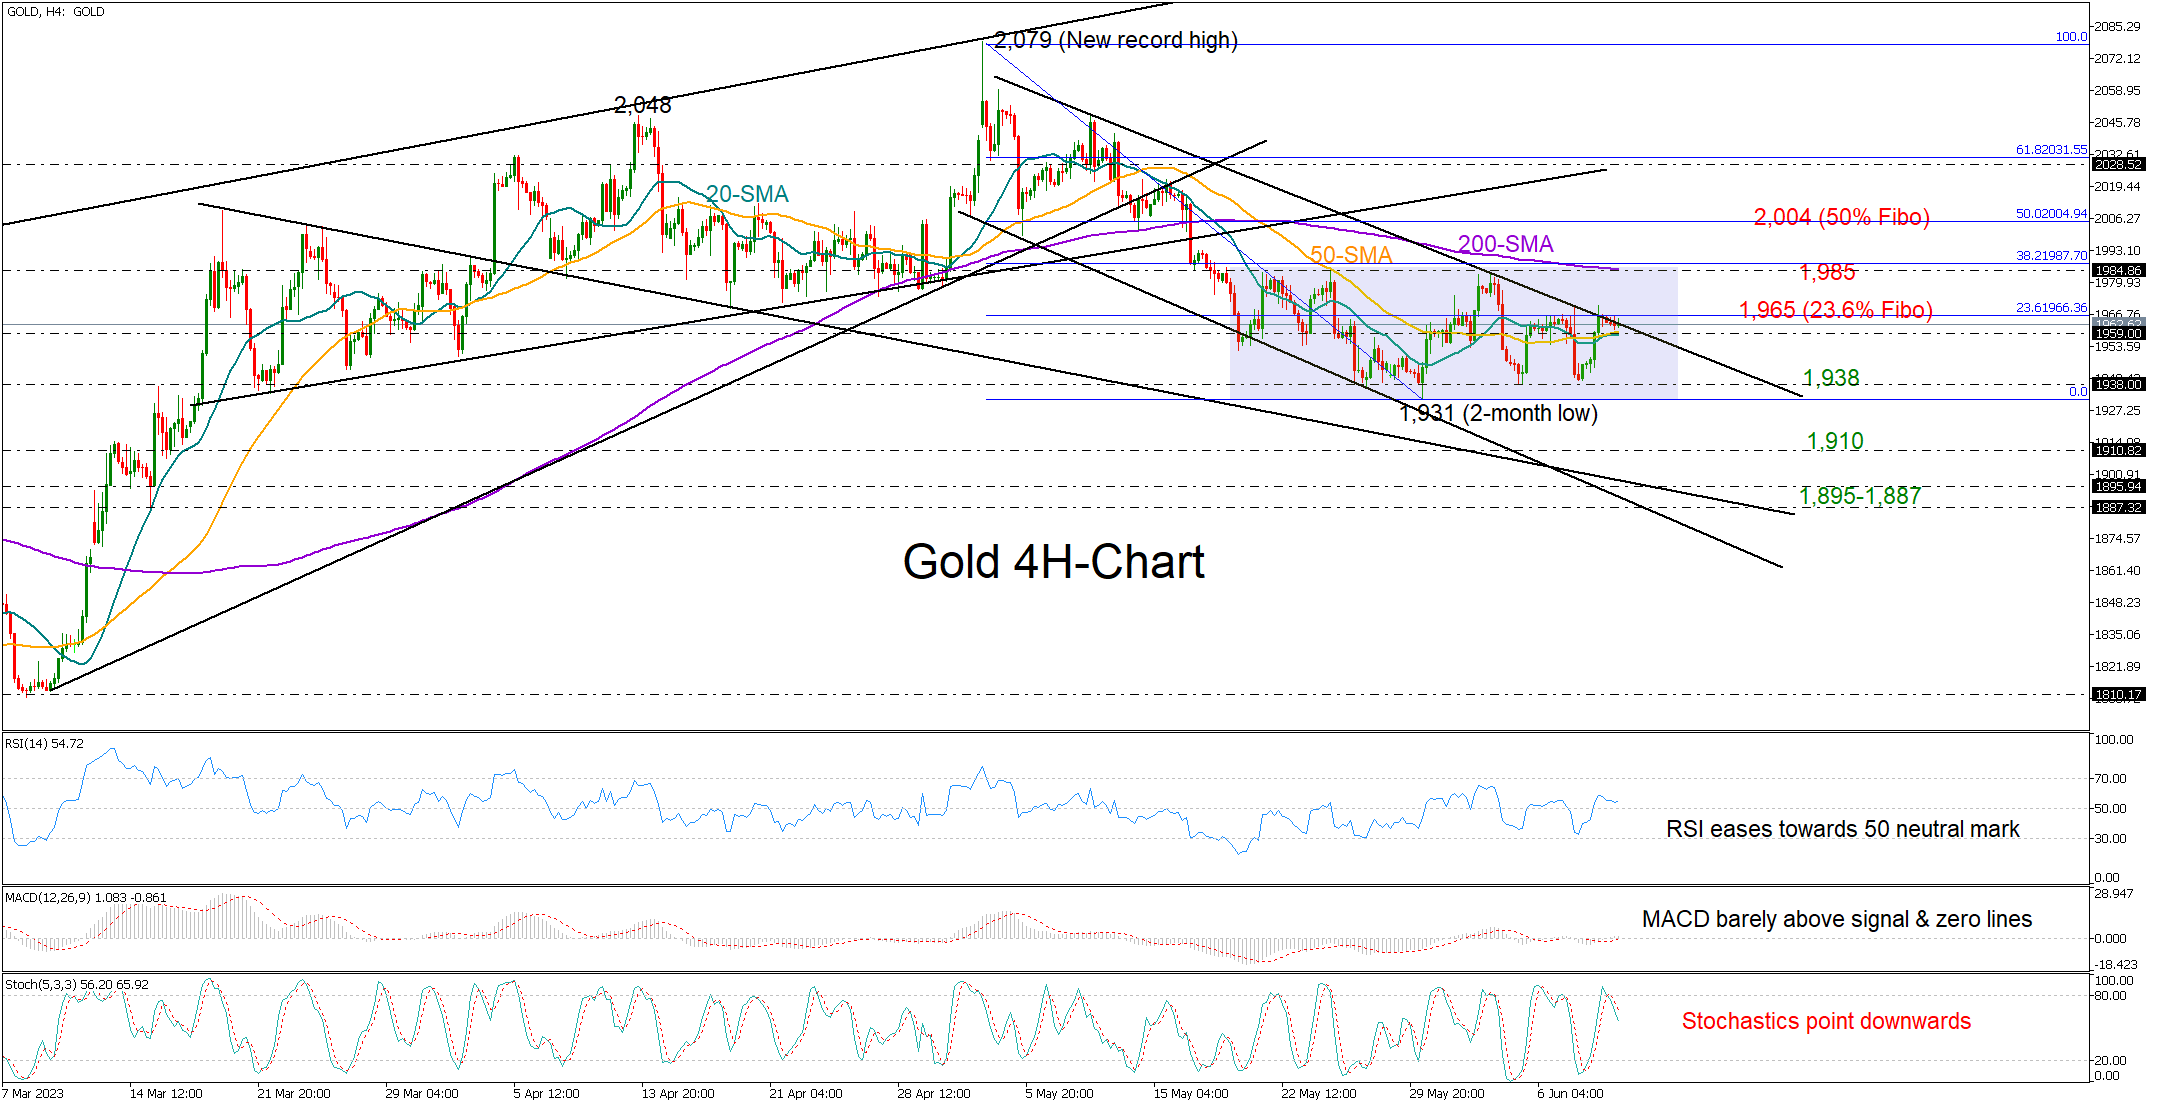
Gold got stuck around the resistance trendline that has been blocking bullish actions over the past month at 1,963 following another strong bounce near the 1,938 floor.
The technical indicators in the four-hour chart provide no clear direction. Hence, traders may wisely wait for the price to close above the trendline and the 23.6% Fibonacci retracement level of the latest downfall near 1,965 before they target the 200-period simple moving average (SMA) at 1,985. A greater rally could challenge the 2,000 psychological mark.
If the bears retake control below the 20- and 50-period SMAs at 1,960, the door will open again for the 1,938 base. Failure to bounce there could prompt a fast decline towards the 1,910 restrictive zone, while slightly lower, the 1,895-1,887 region might be another key spot to watch given its constraining role in the first quarter, and the presence of two restrictive lines in the neighborhood.
Overall, caution is necessary as gold is trading near a key resistance territory. A move above 1,965 could provide fresh impetus to the precious metal, though only an advance above 1,985 would boost the price out of the short-term range.
Dollar Index: Bearish Tech Picture vs Bullish Fundamentals
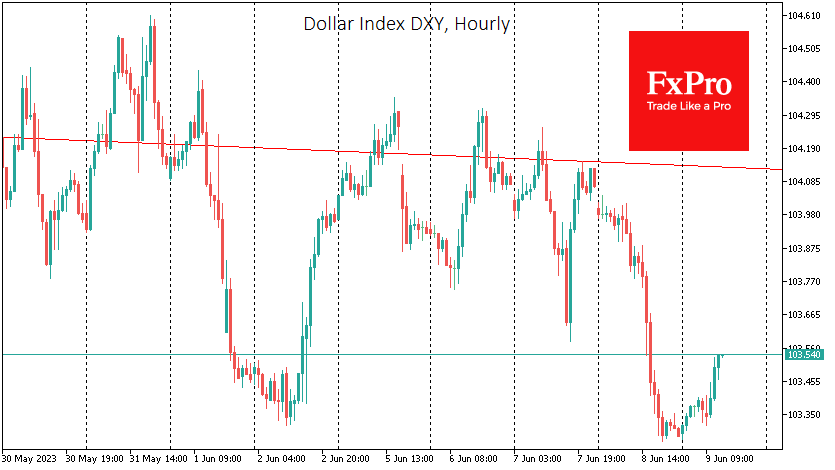
The dollar index lost about 0.7% on Thursday, briefly bouncing back under 103.3. The dollar’s rise against a basket of major currencies stalled late last month and has been trending lower since early June. A situation has developed in which fundamentals are bullish for the dollar, while technical analysis of the medium-term trend favours a decline.
The resolution of the debt ceiling problem forces the US Treasury to return to debt markets with placements. Such actions drain liquidity from the financial system and often cause the dollar to strengthen, as investors prefer US government debt to stocks and bonds of many other governments. And the latest announcements from Treasury Secretary Yellen are setting up near-record placements. What makes the situation unprecedented is that the monetary policy has been stimulative in previous episodes of large auctions: a sharp contrast with the 5% key rate and the Fed selling funds off the balance sheet.
Since the beginning of June, the US Treasury has raised a net capital of $139bn. This is a lot, but because of the accumulated pent-up demand and the buffer built up, we have not seen a noticeable pull into the dollar or a significant sell-off in equity markets. But demand will be saturated, and available liquidity will be depleted, which should work to the dollar’s advantage and is a headwind for equity and commodity markets.
At the same time, the chart picture is still against the dollar. The DXY has been forming a sequence of declining local highs and lows over the past two weeks. It is also easy to see a series of lower peaks on the daily timeframes. Globally, this trend has been in force since last September but has been in the form of a downward channel since December.
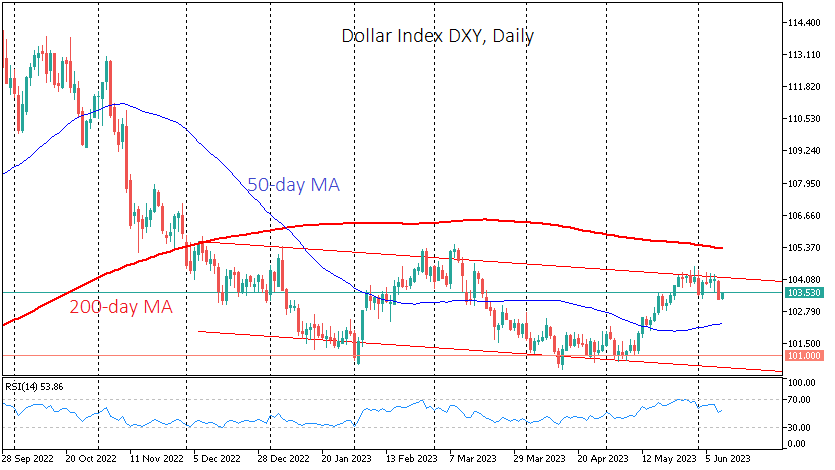
In this latest trend, the DXY, having reversed from the upper boundary at the end of May, is now heading towards support below 100.5.
Also in favour of a further decline in the dollar over the next couple of weeks is the return of the RSI from overbought territory, often accompanied by a more substantial pullback.
A bearish “technical” scenario looks quite realistic if the US Treasury does not rush to test the financial system by vacuuming up market liquidity but rather gently probes the ground. There is room for manoeuvre for the US government, as taxes will flow into the Treasury accounts in the coming weeks.
Canada employment down -17.3k in May, unemployment rate rose to 5.2%
Canada employment dropped -17.3k, or -0.1% mom in May, worse than expectation of 21.2k growth. That compared to average 33k monthly growth from February to April. Employment was down -30k in the services-producing sector, and up 23k in the goods-producing sector.
Employment rate dropped -0.3% to 62.1%, reflecting strong population growth of 83k in the month.
Unemployment rate rose from 5.0% to 5.2%, above expectation of 5.1%. That's the first monthly increase since August 2022.
Bitcoin’s Continued Struggle for the Long-term Trend; Ethereum More Optimistic
Market picture
The crypto market capitalisation has been virtually unchanged over the past 24 hours, remaining near 1.1 trillion. Bitcoin is marginally higher, up 0.1%, while Ethereum is down 0.3%. Top altcoins show more amplitude, ranging from a 3.2% drop (Cardano) to a 1% gain (Polygon).
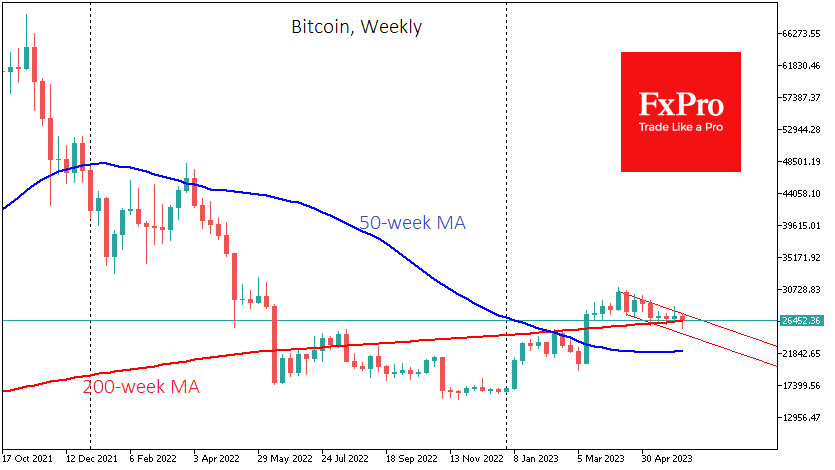
Bitcoin is trading near $26.5K – in the middle of the previous day’s trading range and just above the psychologically important 200-week moving average. A break below this level could trigger a deeper decline to $24.5K (previous high) or even $22.2K (50-week moving average).
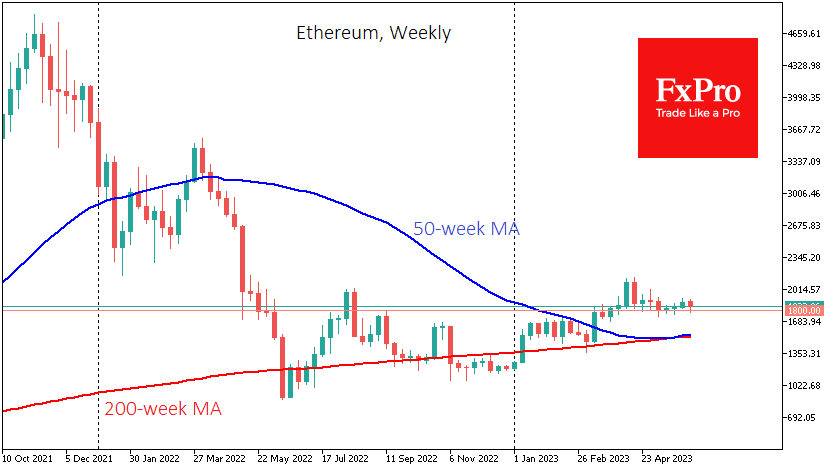
In Ethereum, the 50-week moving average has crossed up from the 200-week moving average, and a price above this crossover would indicate a continuation of the bullish trend.
News background
Gary Gensler, SEC chief, said his agency intends to refrain from relaxing its crypto market policies. According to him, digital assets should be registered as securities and regulated under the laws already in place in the US. At the same time, the SEC has not recognised BTC and ETH as securities.
Details of the SEC’s case against Binance have been revealed. According to the regulator, Binance and Binance.US transferred more than $12 billion to the accounts of Changpeng Zhao. In addition, the exchange helped circumvent US sanctions. The CEO of Binance himself called the allegations false, claiming that the amount on Binance.US was around $2 billion.
The Coinbase exchange has no plans to discontinue stake services or make listing adjustments due to the SEC claims, Coinbase CEO Brian Armstrong said. He noted that Coinbase Earn’s stacking programme generates about 3% of the exchange’s total net revenue.
The European Union has called for stricter rules on cryptocurrency advertising on social media. The European Consumer Organisation (BEUC) has filed a complaint with the European Commission against popular resources and pushing for controls on promoting cryptocurrency products at the EU level.
The UK’s Financial Conduct Authority (FCA) has finalised new, stricter rules for promoting and advertising cryptocurrencies in the country. The new rules are due to come into force on 8 October.
USD/CAD Daily Outlook
Daily Pivots: (S1) 1.3332; (P) 1.3360; (R1) 1.3386; More....
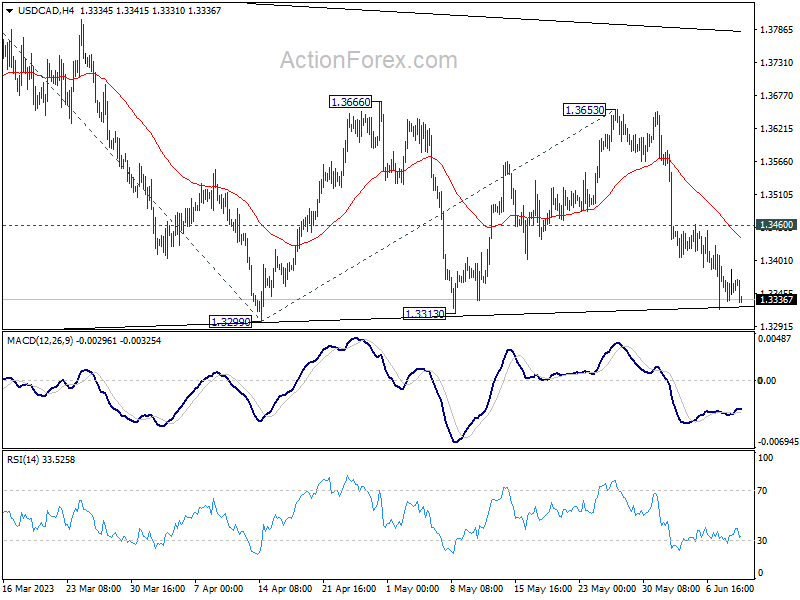
Intraday bias in USD/CAD stays on the downside for the moment, with focus on 1.3299 support. Strong support could still be seen there to rebound. Break of 1.3460 minor resistance will turn bias back to the upside for 1.3653 resistance, to extend the triangle consolidation pattern from 1.3976. However, sustained break of 1.3299 will indicate that larger corrective fall is underway, and target 100% projection of 1.3860 to 1.3299 from 1.3653 at 1.3092.
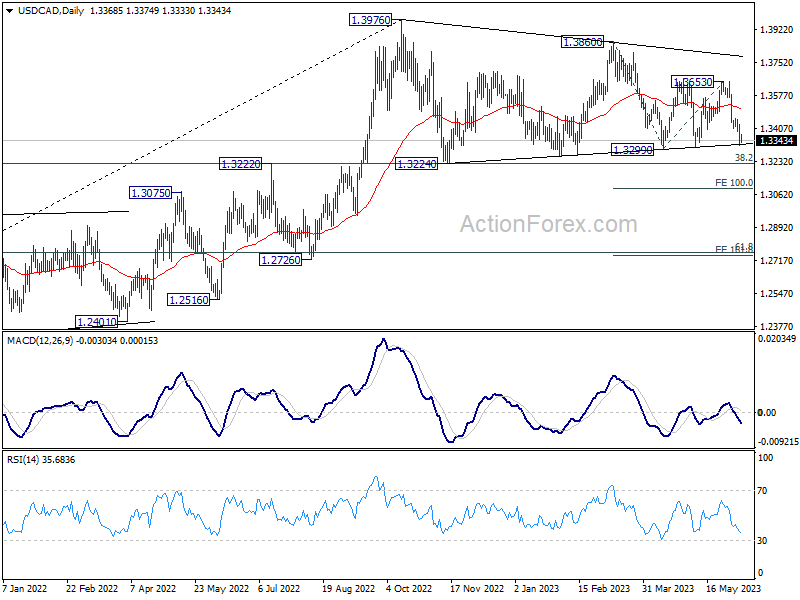
In the bigger picture, rise from 1.2005 (2021 low) is expected to resume through 1.3976 after consolidation from there completes. On decisive break of 1.3976, next target will be 1.4667/89 long term resistance zone. This will remain the favored case as long as 38.2% retracement of 1.2005 to 1.3976 at 1.3233 holds. However, sustained break of 1.3233 will pave the way to 61.8% retracement at 1.2758.
AUD/USD Daily Report
Daily Pivots: (S1) 0.6673; (P) 0.6695; (R1) 0.6739; More...
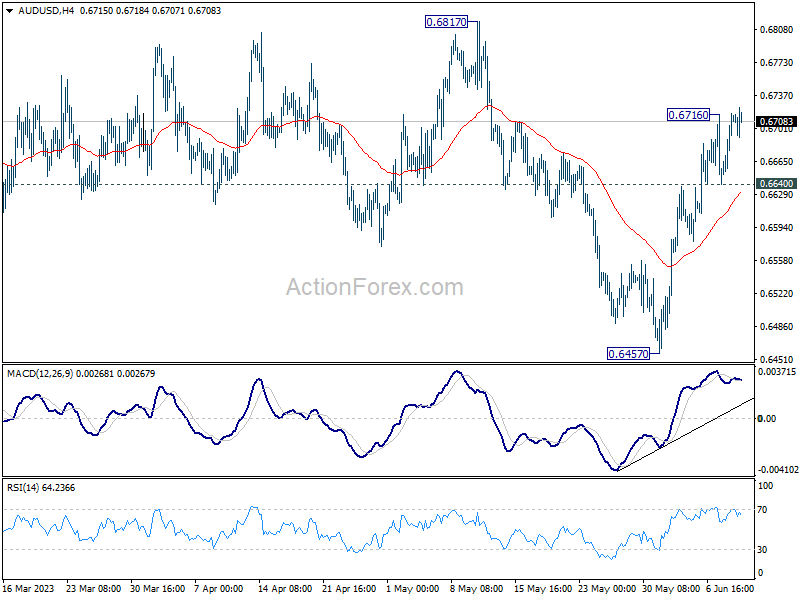
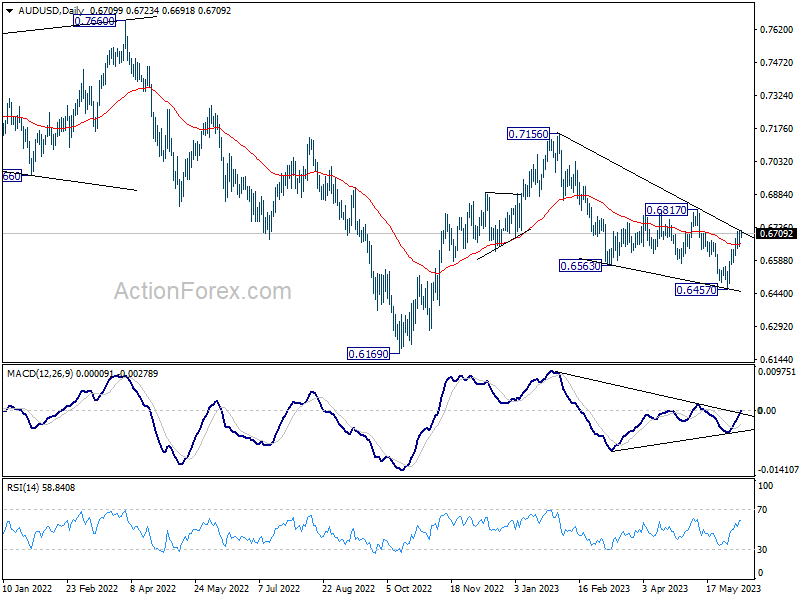
Intraday bias in AUD/USD is back on the upside as rebound from 0.6457 is resuming. Further rise would be seen to test 0.6817 key structural resistance. On the downside however, break of 0.6640 minor support will turn bias back to the downside for retesting 0.6457 low again.
In the bigger picture, rejection by 55 W EMA (now at 0.6811) keeps medium term outlook bearish. Current development suggests that down trend from 0.8006 (2021 high) is possibly still in progress. Retest of 0.6169 (2022 low) should be seen next. Firm break there will confirm down trend resumption. For now, this will remain the favored case as long as 0.6817 resistance holds.
EUR/USD Daily Outlook
Daily Pivots: (S1) 1.0724; (P) 1.0755; (R1) 1.0815; More...
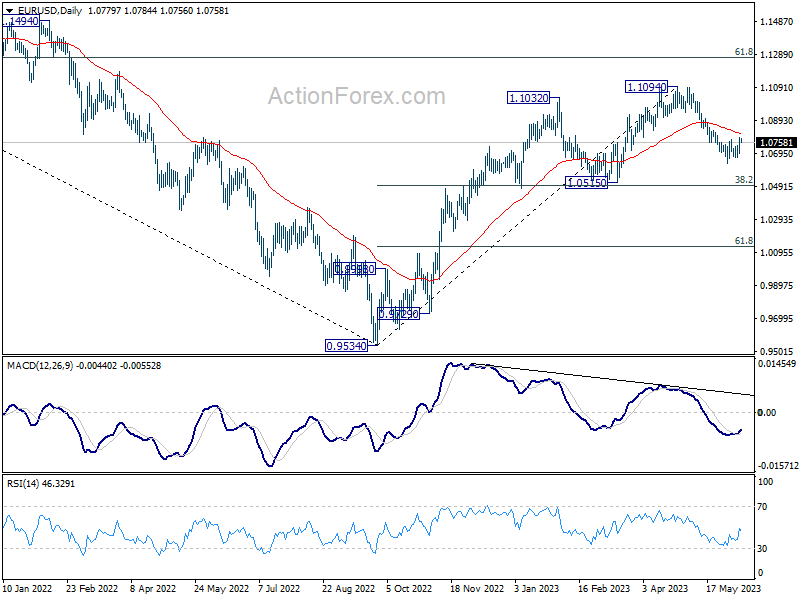
EUR/USD's rebound from 1.0634 resumed by breaking 1.0778 resistance. Intraday bias is back on the upside. Sustained trading above 55 EMA (now at 1.0813) will pave the way back to retest 1.1094 high. Nevertheless, break of 1.0700 minor support should resume the fall from 1.1094 through 1.0634 support.
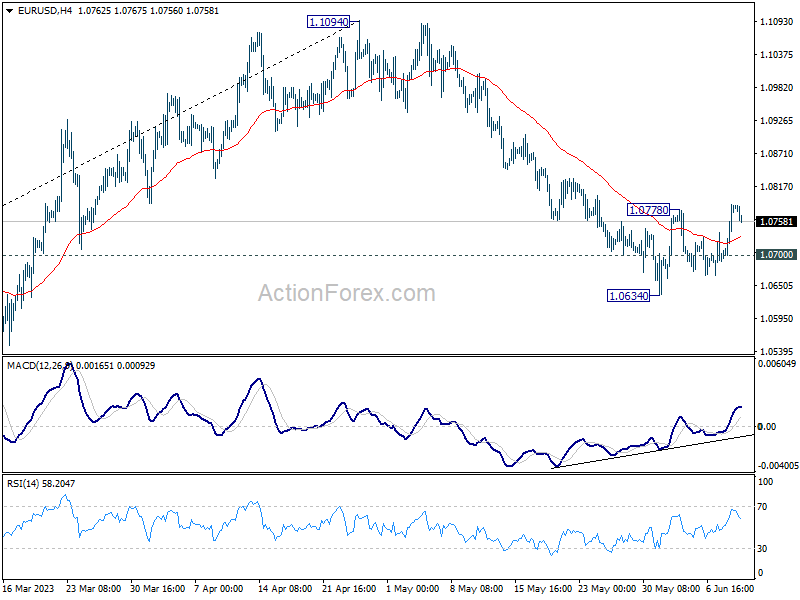
In the bigger picture, as long as 1.0515 support holds, rise from 0.9534 (2022 low) would still extend higher. Sustained break of 61.8% retracement of 1.2348 (2021 high) to 0.9534 at 1.1273 will solidify the case of bullish trend reversal and target 1.2348 resistance next (2021 high).