

Sample Category Title
USDCAD Challenges Symmetrical Triangle’s Base
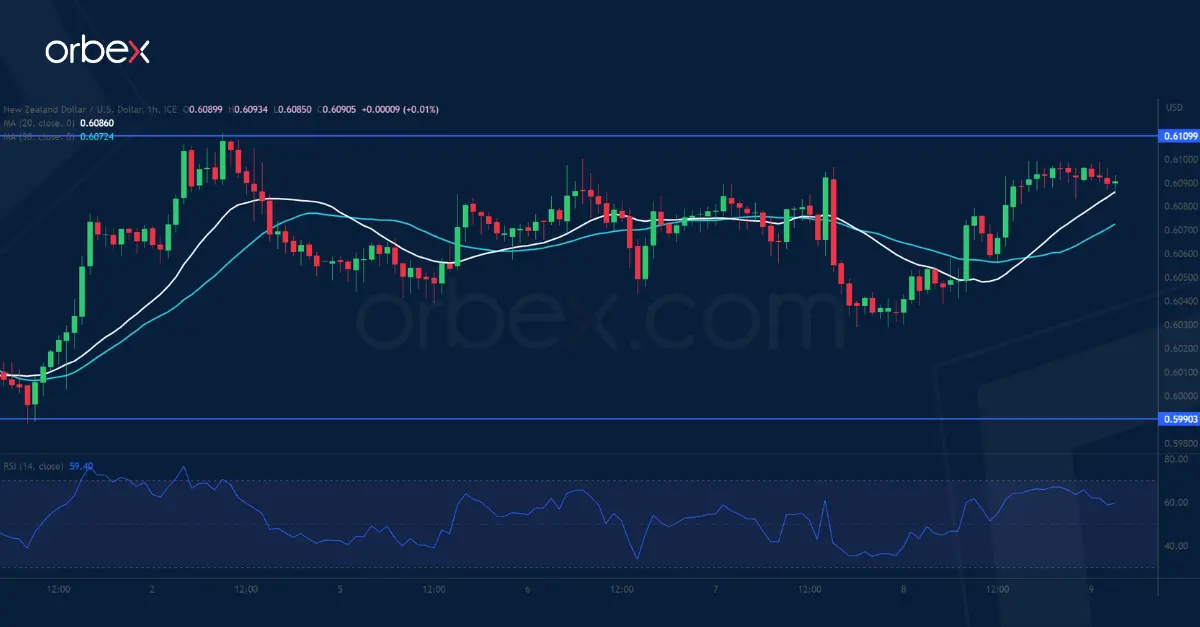
USDCAD has been generating a structure of lower highs but higher lows after peaking at the 2023 high of 1.3860 in mid-March. Even though the price broke below the base of the symmetrical triangle pattern following the unanticipated rate hike by the BoC, it failed to decisively close below it and post a lower low.
The momentum indicators currently suggest that near-term risks remain tilted to the downside. Specifically, the RSI descends below the 50-neutral mark, while the MACD is softening below both zero and its red signal line.
Should the decline resume, initial support could be met at the June bottom of 1.3319. Piercing that wall, the pair could retreat towards the 2023 low of 1.3262. Further declines could then come to a halt at the November 2022 support of 1.3225.
On the flipside, if the price bounces off the base of the symmetrical triangle, the bulls might aim for the recent resistance of 1.3460. A break above that zone could trigger an advance towards the 1.3550 resistance. Even higher, the April peak of 1.3666 could prove to be a tough one for the price to overcome.
In brief, USDCAD attempted to break its symmetrical triangle to the downside for the first time in the past two months, but the latter continues to hold its ground. Should the price manage to close below this barrier, the recent downtrend is likely to accelerate.
Swiss Franc Soars on SNB Warning, US Jobless Claims
- SNB’s Jordan hints at a June rate hike
- US jobless claims jump
- Swiss franc climbs 1.2%
The Swiss franc is showing limited movement on Friday, trading at 0.8998. On Thursday, the Swissie surged higher, gaining 1.2%.
SNB’s Jordan signals more rate hikes are coming
It seems that Swiss National Bank head Thomas Jordan doesn’t miss an opportunity to warn the markets that inflation is too high in Switzerland. Just a week ago, Jordan stated that if core inflation became entrenched above 2%, it would be difficult to bring it back below this level. Jordan was even more explicit in his remarks on Thursday, warning that inflation “is more persistent than we initially thought” and that with rates at a low 1.5%, it wasn’t a good idea to keep rates low and face higher inflation later.
Jordan’s remarks were a clear signal that the SNB plans to raise rates at the June 22nd meeting. The Swiss franc jumped after the comments, climbing 1% and punching above the symbolic 0.90 line for the first time in two weeks.
Like other central banks, inflation has become the number one priority for the SNB, even though inflation is much lower than in the other major economies. The SNB, once known for its negative rates, has been aggressive, raising rates by 225 points in the current tightening cycle. Higher rates have pushed the Swiss franc higher, which the SNB would rather avoid as an expensive Swiss franc hurts the export sector. Still, this is the price the central bank is willing to pay in order to curb inflation back to below the 0-2% target.
US jobless claims jump
In the US, unemployment claims were higher than expected, leading to the US dollar beating a hasty retreat against its major rivals. It’s only one report, but there have been signs of cracks in the labour market, such as a spike in the unemployment rate. The Fed meets next week, and the unemployment claims could provide support for a pause, which is weighing on the US dollar.
USD/CHF Technical
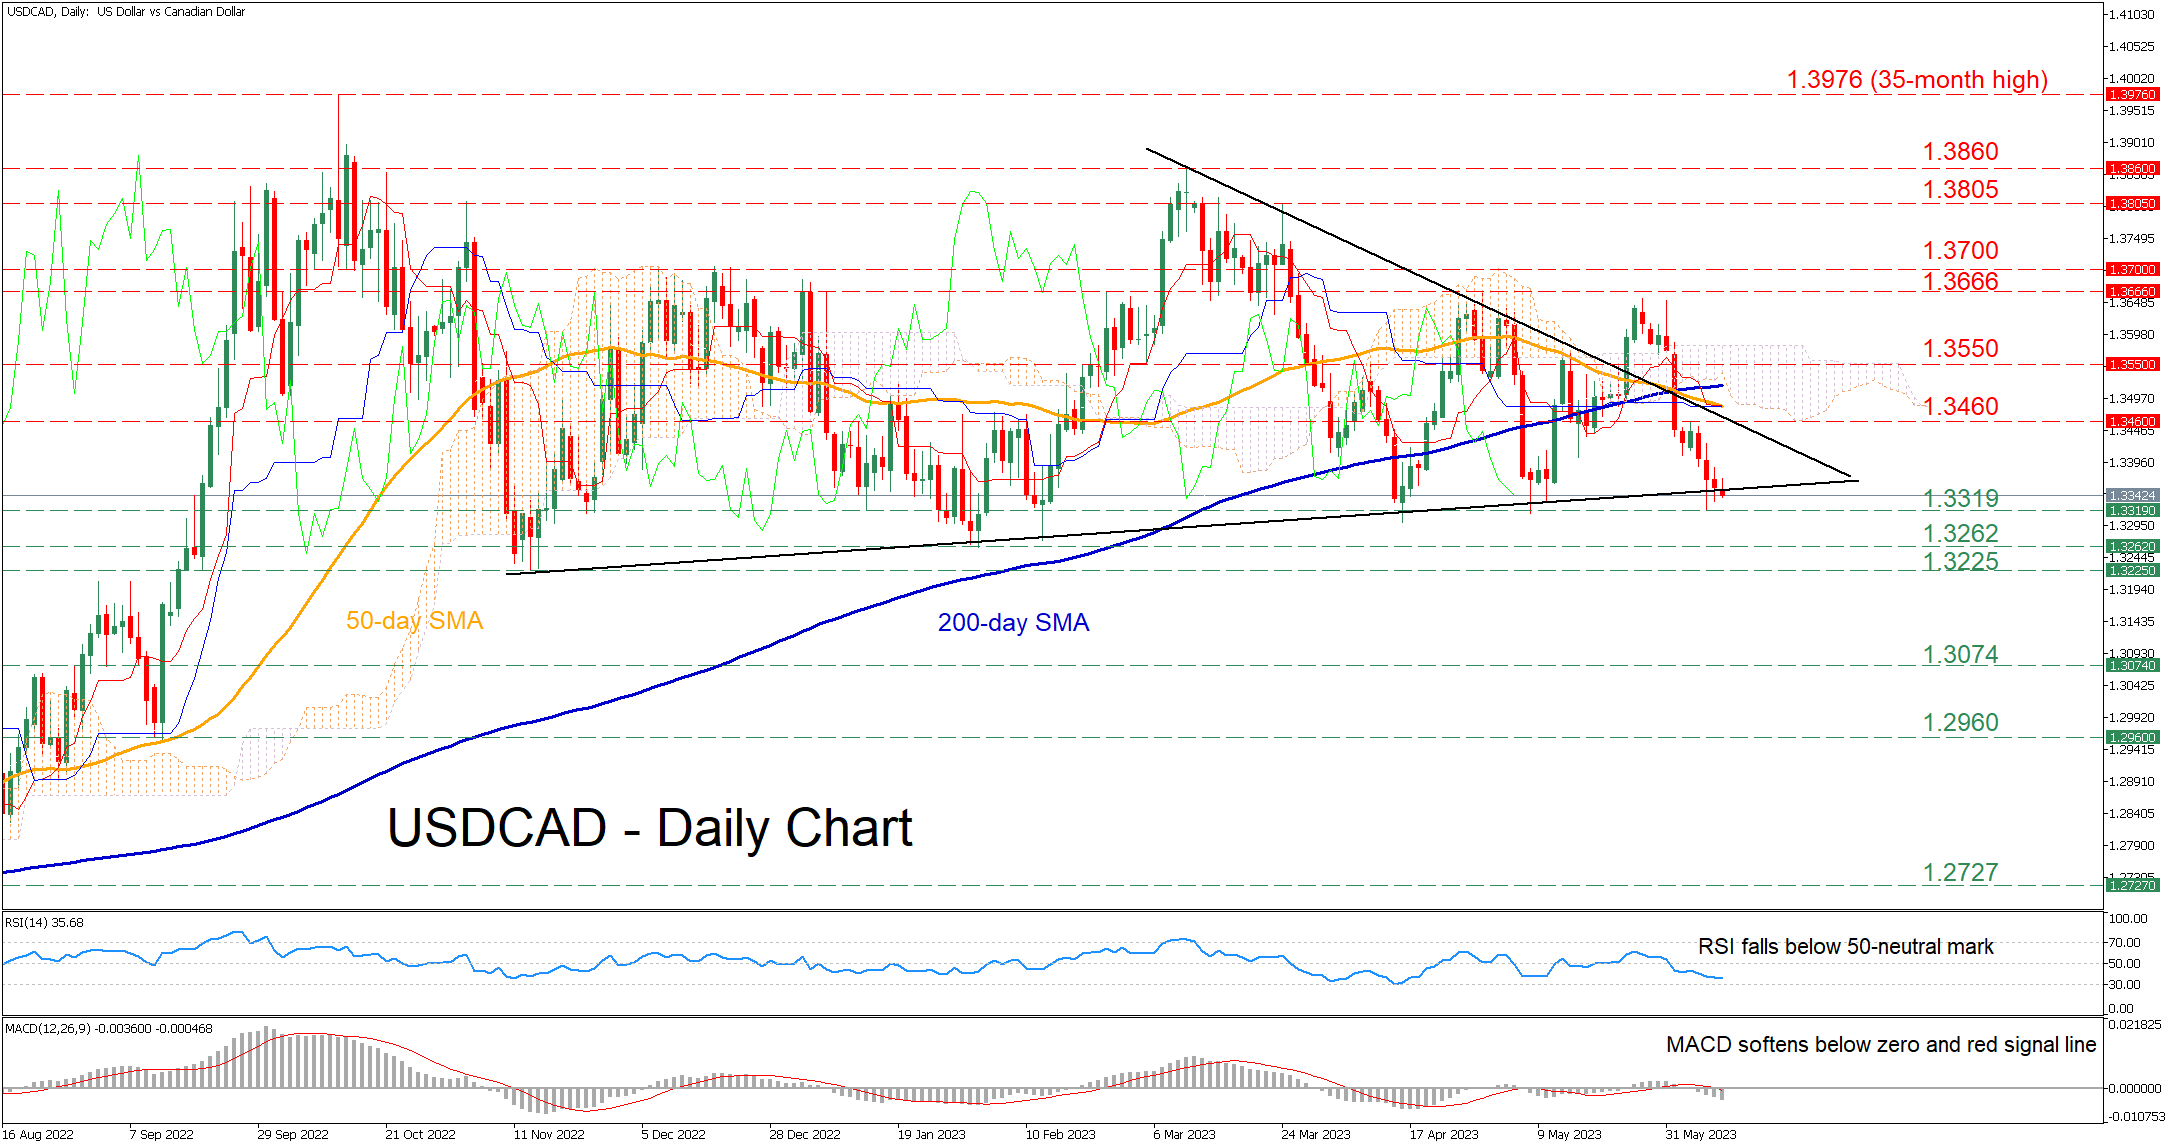
- USD/CHF is testing support at 0.9103. Below, there is support at 0.9022
- 0.9156 and 0.9237 are the next resistance lines
Chinese Markets Unmoved By This Morning’s Price Data
Markets
US weekly jobless claims, of all things, was responsible for yesterday’s main market move. Applications rose from 233k to 261k, more than the 235k expected. It triggered a US bond rally which dragged European peers higher as well. While it doesn’t change expectations for a pause at next week’s Fed meeting, it did offer a bit of contrast following the Bank of Canada and the Reserve Bank of Australia earlier this week. Both were a hawkish reminder that tightening cycles after leaving rates unchanged one or more times indeed can be resumed. US yields dropped between 3.9 and 8.5 bps with the belly of the curve outperforming. German yields fell 4.2-5.4 bps. The US dollar slipped. DXY (trade-weighted) lost territory, from 104.06 at the open to 103.34 in the close. EUR/USD moved beyond intermediate resistance between 1.0735/1.076 to close around 1.078. GBP/USD spillover effects pushed EUR/GBP lower for the day too. The pair finished at 0.858, near the June lows. Risk appetite was healthy, especially in the US. The tech-heavy Nasdaq rose about 1% and remains close to its year-to-date highs.
Asian stocks mostly trade in the green. Japan outperforms after the Nikkei index pulled back from a 30-year high over the past two days. Chinese markets are unmoved by this morning’s price data (see below). Stocks trade flat, the Chinese yuan trades a tad weaker as speculation for more monetary policy support builds. South Korea’s won outperforms Asian peers (USD/KRW drops to 1292.45, the lowest since April). Currencies in the G10 area trade muted. The Japanese yen is today’s laggard. Core bonds hover near yesterday’s closing levels and we don’t expect clear directional trading to materialize later today. The economic calendar contains no critical US or European releases although the Canadian labour market report sure is worth mentioning after the BoC’s unexpected rate increase. The looming weekend and, more importantly, next week’s ECB and Fed meetings are likely to keep investors in other markets than the Canadian sidelined in the run-up. To that end we have no strong view on the dollar and euro either. After surpassing a first hurdle yesterday, eyes are on the 1.08 big figure from a technical point of view. But the actual topside reference to look at is 1.0942 (50% recovery on the 2021-2022 EUR/USD decline). Sterling has held near the recent highs all week. Next week though some interesting economic data is scheduled for release, including the labour market report and the April industrial update.
News and views
China May price data published this morning suggested little stress on the country’s demand/supply balance, evidence of a rather sluggish economic recovery and reviving calls for monetary stimulus. CPI inflation rose marginally to 0.2% Y/Y from 0.1% in May. Prices declined 0.2% M/M from April. Consumer goods prices were 0.3% lower compared to the same period last year. Services inflation slowed to 0.9% Y/Y from 1.0%. On the producer side of the economy, outright deflationary trends even deepened with PPI declining 0.9% M/M. Factory gate prices in May were 4.6% lower than in the previous month last year (was -3.9% Y/Y in April), the deepest decline since February 2016, with price declines broadly visible across subcategories. The disinflationary environment and calls for more stimulus for now had only modest impact on the yuan with USD/CNY gaining only slightly to 7.122. Admittedly, the dollar this week also lost some momentum overall.
Turkish President Erdogan appointed Hafize Gaye Erkan as the new head of the Turkish central bank to replace Sahap Kavcioglu, who supported Erdogan’s view by reducing interest rates even as inflation skyrocketed. The appointment is seen as a potentially resulting to a more orthodox policy. The move comes after Erdogan earlier this week named Mehmet Simsek as finance Minister who is also seen as supporting a more market-friendly approach. Markets now look out whether the change in the country’s economic management will lead to a more conventional approach, with the CBRT raising interest rates as an important pointer for such a policy change. This morning, the lira holds at all-time lows against the dollar USD/TRY 23.465 and the euro (EUR/TRY 25.39).
Soft Chinese Inflation Boosts Dovish PBoC Bets
The faster than expected jump in US initial jobless claims threw some cold water on the heated hawkish Federal Reserve (Fed) pricing yesterday. Initial jobless claims rose 261K last week, versus around 233K expected by analysts. That was the highest level since October 2021. But continuing claims fell, making yesterday’s data look less convincing about the tightening conditions in the US jobs market. On a side note, US companies announced more layoffs in the first 5 months of this year than in all of last year. And boy, we need the US jobs market to give up some strength so that the Fed could stop hiking the rates, otherwise, the major central banks will continue hiking pitilessly and that means chaos for the world economy in the coming months.
This is what the widening spread between the US 2 and 10-year yield tells us since a year now. The 2-10-year proportion of the US yield curve inversed sometime in June last year and since then it is inverted. But I guess equity traders had time to get used to the inverted curve, and simply ignore it. Because yesterday’s bad news – on the initial jobless claims – boosted appetite in US stocks. The S&P500 flirted with the 4300 mark, again, and the index is up by more than 20% since the last October dip, meaning that the S&P500 stocks stepped into the bull market regardless of the tightening Fed, rising yields, and the inverted yield curve.
The US dollar fell yesterday, as the jump in US initial jobless claims scaled the hawkish Fed expectations slightly back after two shock rate hikes from the Reserve Bank of Australia (RBA) and the Bank of Canada (BoC) had fueled them throughout the week and panicked the bulls who were hesitant to continue buying stocks at the current levels.
The softness of the US dollar, and the rally in the EURUSD to almost 1.0790 masked the sad growth figures revealed in the euro area yesterday, according to which the eurozone economy contracted by 0.1% in Q1, following a 0.1% contraction in Q1 of last year as well. That’s not a major contraction, and growth is expected to have resumed this quarter, meaning that yesterday’s morose GDP update will unlikely change the European Central Bank’s (ECB) mind regarding the next rate hikes in the eurozone.
But note that the rising eurozone yields will fall at around the same time as the biggest TLTRO maturing by the end of June, with, on top, the possibility of additional voluntary early repayments on TLTROs maturing in Dec 2023 and Mar 2024. Therefore, besides higher rates, the eurozone will suffer a cumulative negative liquidity impact of up to €625 billion during this quarter. And the ECB is currently not considering extending the terms of TLTRO loans. On the contrary, they are leaned to further wind down their balance sheet.
While the latter is positive for the euro – and you may have noticed that I am bullish on euro, the European stock markets will likely feel the pinch of lower ECB liquidity. The Stoxx 600 index has lost a bit of steam since May but remains at the highest levels since last April, so there is potential, in the mid run, for a downside correction toward the 435-440 area, which includes the major 38.2% Fibonacci retracement on October to May rally and the 200-DMA respectively. The impact of slowing Chinese demand is also a part of the factors that drive my conclusion toward softer European equities by the end of Q2. And even though a stronger euro helped the European stocks gain value over the past months, we could see the positive relationship between the euro and the European stocks soften. And before I forget, I keep my medium term EURUSD target unchanged at 1.12.
CBRT replaces its puppet banker
The Turkish lira was steady yesterday as Turkey continued burning its dollars to calm down the market’s nerves, but the USDTRY is pushing higher this morning again. On the wire, news that the Turkish central bank’s puppet banker is replaced by Ms. Hafize Gaye Erkan, who will likely return the bank toward a more conventional monetary policy. The latter will require higher interest rates, waning FX interventions, which will first lead to a further lira depreciation to catch up a year-and-a-half coma – an expensive coma – then hopefully stabilize the FX pricing at a market-determined level so that Turkey could again have a monetary policy. Until then, we will likely see waves of selloff as Turkish banks relax FX purchases. I am telling you, the lira will be shaken this summer, and inflation will likely top again
Subdued Chinese inflation calls for RRR and interest rate cuts
In China, the consumer prices rose slightly from the 26-month low of 0.1% to 0.2% YEAR-ON-YEAR! Producer prices fell 4.6% in May due to weakening demand and falling commodity prices. It was the 8th straight month of producer price deflation, worse than 4.3% expected analyst, much worse than 3.6% drop printed a month earlier.
The ultra-soft Chinese inflation numbers further fueled expectations that the People’s Bank of China (PBoC) will cut the RRR and interest rates sometime this summer. And note that yesterday already, six state-run banks cut deposit rates, setting the stage for broader rate cuts to come.
The combination of European recession, and subdued Chinese inflation figures got oil bears to sell the tops since yesterday. The price of a barrel of American crude tipped a toe below the $69, and risks remain tilted to the downside.
Strong Euro Area Wage Growth Adds Pressure on ECB
Market movers today
Norway. Today, focus will be on Scandi data releases. Norway's May CPI print is out and we believe core inflation has remained high at 6.2%, see more below.
Sweden. We also get a string of data from Sweden that provide us with better understanding of how the real economy is doing. A rebound in retail sales indicates that we could observe a similar pattern in household consumption for April. Production figures will also be of large interest: January and February figures looked promising, but March data showed a 1.1% month-on-month drop, see more below.
The 60 second overview
Wage pressures: ECB's favourite wage measure, euro area compensation per employee, increased 5.2% year-on-year in Q1. With the current momentum in mind, that is strong wage growth, not least considering that the March ECB staff projections had 5.3% wage growth for the year as a whole. This adds further pressure on the ECB.
US initial jobless claims ticked in higher than expected yesterday. As 261,000 filed a claim for unemployment benefits, up 28,000 from last week. Looking at a state level, no one in particular stands out, indicating this could be a clearer sign of a more broadly cooling labour market. The market also reacted by sending US treasury yields lower.
China: Producer price inflation declined more than expected to -4.6% in May, the lowest since early 2016. Food price inflation in particular slowed to 1.0%. This weighs further on consumer prices, which are barely increasing these days. This fuels speculation that we could see easing measures from the People's Bank of China soon.
FI: The global bond markets rebounded yesterday as bond yields declined and the periphery outperformed the core-EU markets. Bunds rallied some 5-6bp, while Treasures rallied some 7-8bp. The markets are looking forward to the ECB and FOMC meetings next week as well as US inflation data. Yesterday, we published our ECB review. We expect a rate hike of 25bp.
FX: NOK rallied and USD and CAD sold off yesterday amid relatively mixed risk sentiment. EUR/USD rose above 1.0750 and USD/JPY to 139. EUR/NOK fell close to 11.70 - the lowest in about two weeks.
Credit: After several days of continuously high activity in the primary market, issuance activity slowed markedly yesterday, with only one EUR transaction from French HY issuer Infopro. Secondary spreads were more or less unchanged, with iTraxx Xover and Main tightening marginally (1.6bp and 0.3bp, respectively).
Nordic macro
In Sweden, a string of April data is released today, providing further information on how Q3 started. Household consumption has been trending lower for two years, although it began at a high level due to the recovery after the significant drop in 2020. Retail sales showed an uptick in April, which should be interpreted as a rebound after the weak figure in March. However, a similar trend may be observed in household consumption as well.
Production figures will be of large interest; January and February figures looked promising, but March figures showed a 1.1% month-on-month drop. PMI for the manufacturing sector has continued to decline and is now at the lowest level seen in 2 years. It's important to note that the correlation between survey data and actual performance does not always align, so the figures will provide valuable information regarding the state of the economy.
Norwegian core inflation is still high but no longer seems to be accelerating. Behind the headline figure, however, we can see that while prices for domestic goods (including agricultural produce) are now falling, prices for services are clearly still rising, and prices for imported goods have also now begun to pick up sharply. This last factor is probably down to the decline in the NOK since the autumn, and there is much to suggest that it will remain weak for some time. Core inflation has likely remained high, and we expect it to be 6.2% year-on-year in May.
NZD/USD Attempts to Bounce
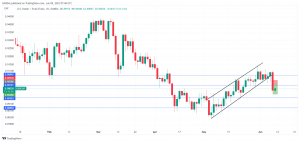
USD/JPY tests support
The Japanese yen clawed back losses after the Q1 GDP beat expectations. The price is consolidating its gains after clearing the major supply area of 138.00 from the daily chart. 138.60 over the 20-day SMA saw buying interests propelling the greenback above the psychological level of 140.00. A close above 140.40 is needed to force the remaining sellers out and trigger an extended rally to the next hurdle at 142.20. Failing that, a drop below 138.60 would expose 137.40 on the 30-day SMA which is the bulls’ second line of defence.
NZD/USD attempts to bounce
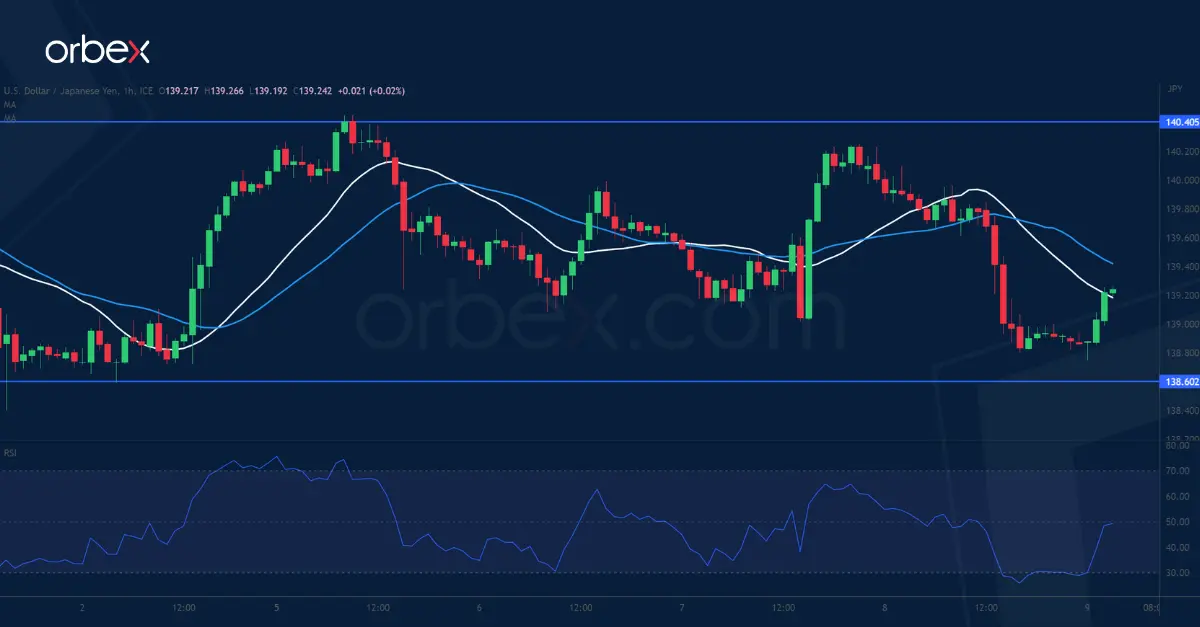
The US dollar slipped after last week’s jobless claims came out higher than expected. On the daily chart, a fall below the demand zone of 0.6100 and a bearish MA cross indicate a cautious mood. A bounce to the supply zone around 0.6110 has met stiff selling pressure. A bullish breakout may not mean that the kiwi would be out of the woods yet as sellers could be expected around the support-turned-resistance of 0.6200. The latest low of 0.5990 is an immediate support and its breach would cause a new round of sell-off.
S&P 500 hits 10-month high
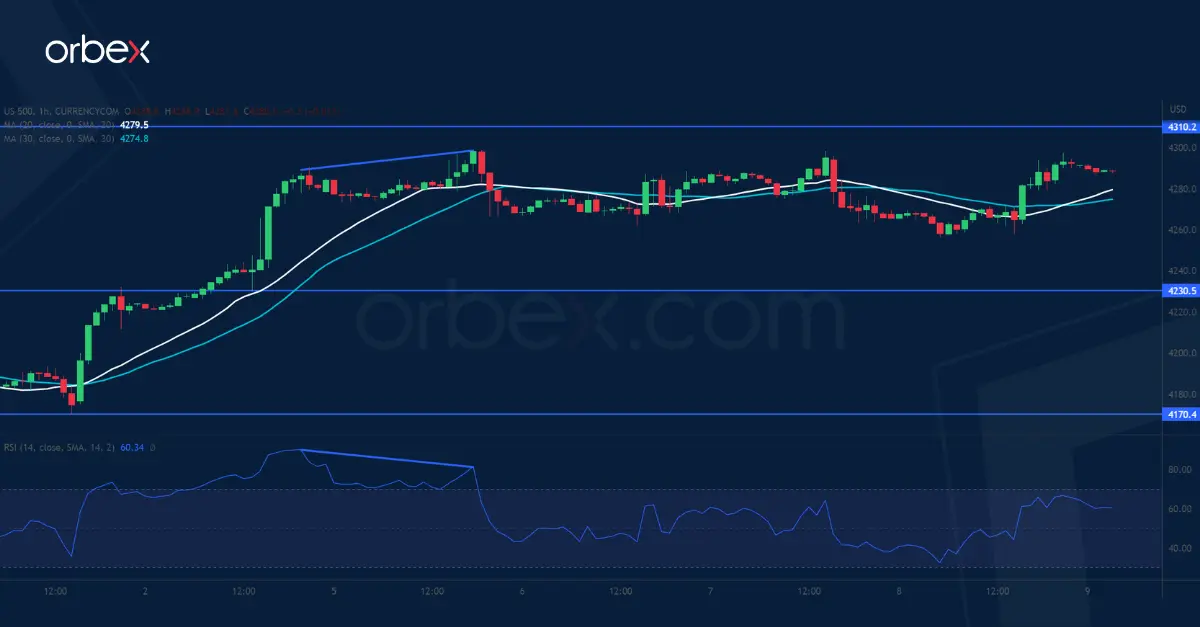
The S&P 500 inches higher thanks to a rebound in technology names. Sentiment is still overwhelmingly upbeat as the index grinds its 10-month high at 4310. A bullish breakout would trigger a new round of rally to 4400. However, a bearish RSI divergence indicates a loss of momentum in the rally and could foreshadow a retracement most likely to be driven by profit-taking. A break below the closest support of 4230 would be a confirmation and send the price to the next support at 4170 which coincides with the 30-day SMA.
Technical Outlook and Review
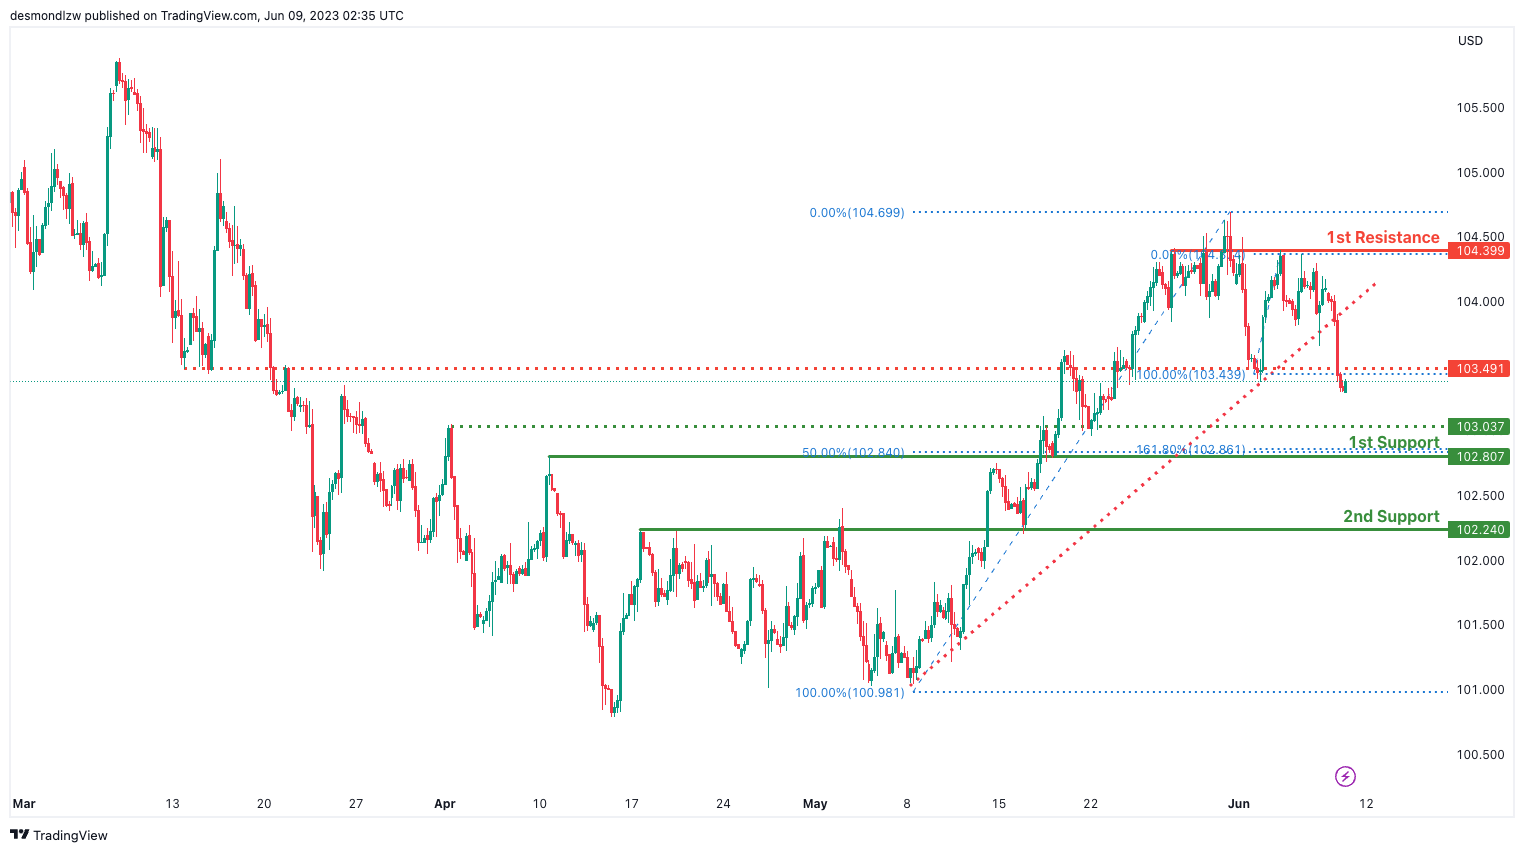
DXY:
The DXY (US Dollar Index) chart demonstrates a bearish momentum, supported by the fact that the price is currently below a significant descending trend line, indicating the potential for further bearish movement.
Considering this bearish scenario, there is a possibility for a continuation of the downward trend towards the first support level at 102.80. This level holds importance as it coincides with a 50% Fibonacci retracement level and acts as an overlap support level.
In the event of a further decline, the second support level at 102.24 can be seen as another relevant area of support, also functioning as an overlap support level.
On the other hand, if a reversal were to occur, the first resistance level at 104.39 serves as a significant obstacle, representing an overlap resistance level.
Additionally, there is an intermediate resistance level at 103.49, which acts as a pullback resistance, potentially impeding any upward movement.
Conversely, if the price were to experience a pullback, the intermediate support level at 103.03 could provide a temporary area of support.
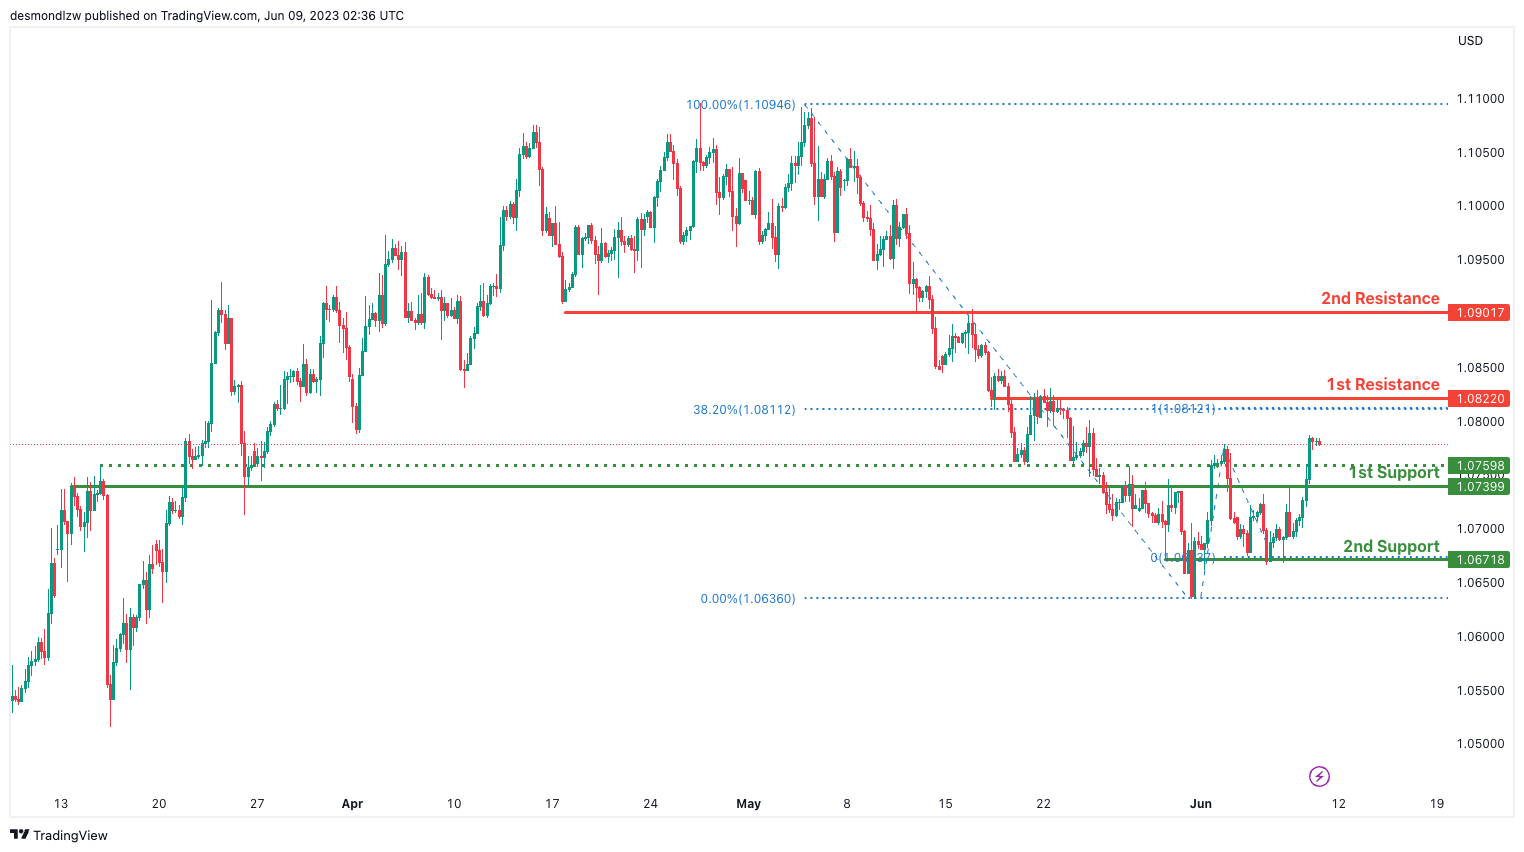
EUR/USD:
The EUR/USD chart is currently exhibiting bullish momentum, indicating an overall positive bias in price movement.
There is a potential for a bullish continuation towards the first resistance level at 1.0822, which is a significant area of overlap resistance. This level is further supported by the presence of a 38.20% Fibonacci retracement, making it a crucial level to watch for potential price resistance.
In case of a pullback, the first support level at 1.0739 acts as an important area of support, representing an overlap support level.
Similarly, the second support level at 1.0671 can be considered as another area of support, functioning as an overlap support level.
If the price were to sustain its upward momentum, the second resistance level at 1.0901 might act as a point of resistance, representing a pullback resistance level.
Additionally, there is an intermediate support level at 1.0759, which could provide temporary support during minor price retracements.
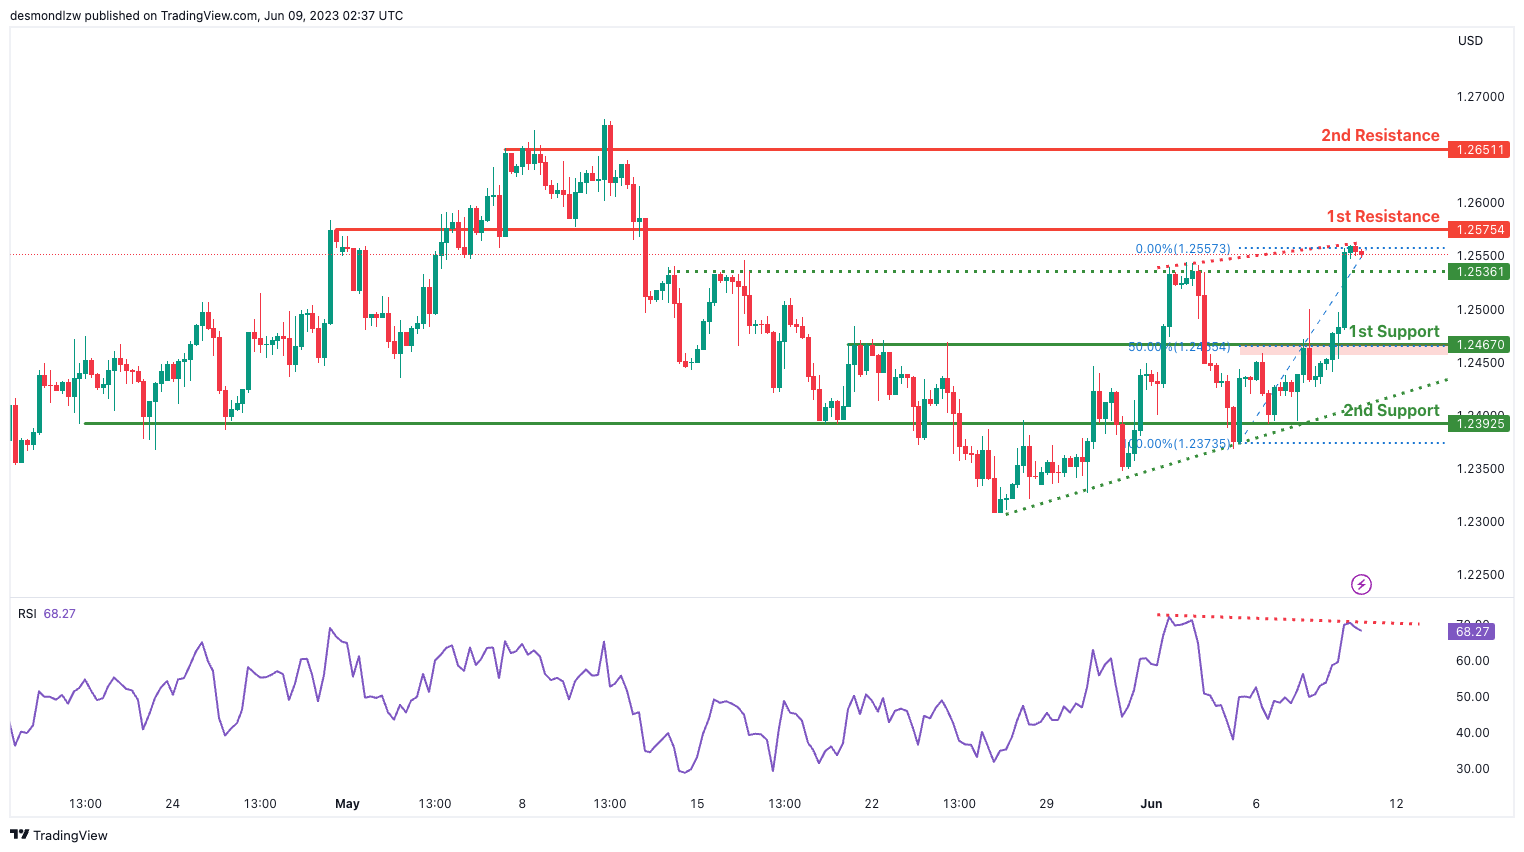
GBP/USD:
The GBP/USD chart currently shows bearish momentum, indicating a downward bias in price movement.
Despite the overall bearish momentum, it is worth noting that the price is above a major ascending trend line, which suggests the potential for further bullish momentum in the future.
In the short term, there is a possibility for the price to drop further towards the first support level at 1.2467 before potentially bouncing back and rising towards the first resistance at 1.2575.
The first support level at 1.2467 is significant as it coincides with a pullback support level and the 50% Fibonacci retracement, making it a strong area of support to watch.
If the price continues to decline, the second support level at 1.2392 can be considered as an additional area of support, representing an overlap support level.
On the upside, the first resistance level at 1.2575 acts as a pullback resistance, potentially causing the price to face selling pressure.
Similarly, the second resistance level at 1.2651 also acts as a pullback resistance, further reinforcing the potential for price reversal or a stall in upward movement.
It is worth noting that the RSI is displaying bearish divergence versus the price, indicating a potential reversal in the near future.
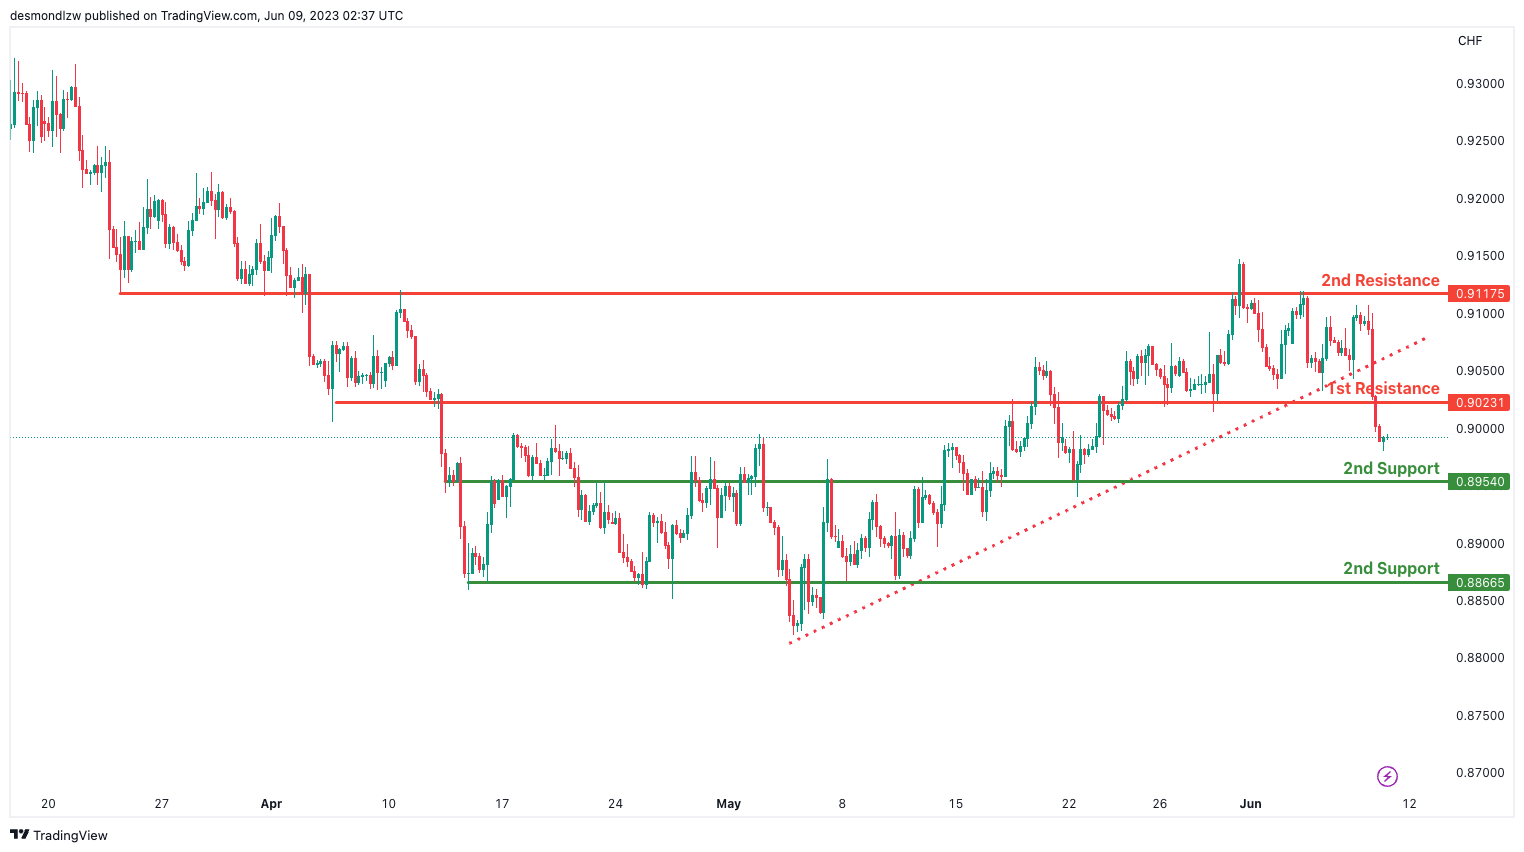
USD/CHF:
The USD/CHF chart currently exhibits bearish momentum, indicating a downward bias in price movement.
One of the factors contributing to this bearish momentum is the break below an ascending support line, which has triggered a potential bearish move.
In terms of potential price action, there is a possibility for the price to continue its bearish continuation towards the first support level at 0.8954.
The first support level at 0.8954 is significant as it represents an overlap support level, suggesting that it has previously acted as a support level and may do so again in the future.
If the bearish momentum persists, the second support level at 0.8866 can be considered as an additional area of support, also representing an overlap support level.
On the upside, the first resistance level at 0.9023 acts as a pullback resistance, potentially causing the price to face selling pressure.
Similarly, the second resistance level at 0.9117 represents an overlap resistance level, further reinforcing the potential for price reversal or a stall in upward movement.
USD/JPY:
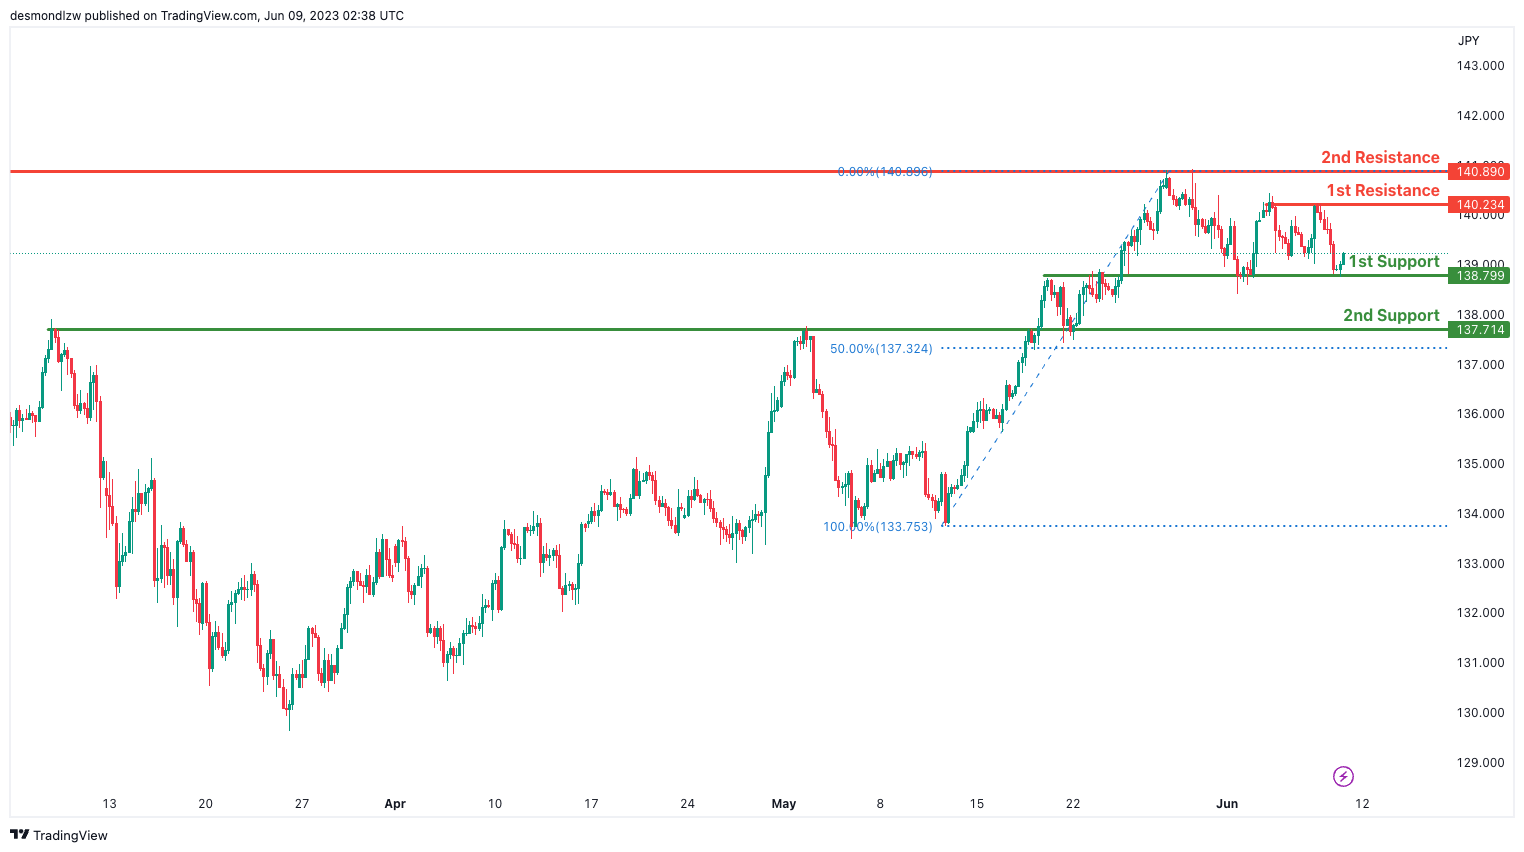
The USD/JPY chart currently demonstrates bullish momentum, indicating a positive bias in price movement.
There is a potential for a bullish continuation towards the first resistance level at 140.23.
The first support level at 138.79 is considered significant as it represents an overlap support level, indicating that it has previously acted as a support level and may provide support again in the future.
Additionally, the second support level at 137.71 is another overlap support level, further reinforcing its potential as a reliable area of support.
On the upside, the first resistance level at 140.23 is a multi-swing high resistance, suggesting that it has previously acted as a significant barrier to upward price movement.
Furthermore, the second resistance level at 140.89 is a swing high resistance, indicating its historical relevance in halting price advances.
USD/CAD:
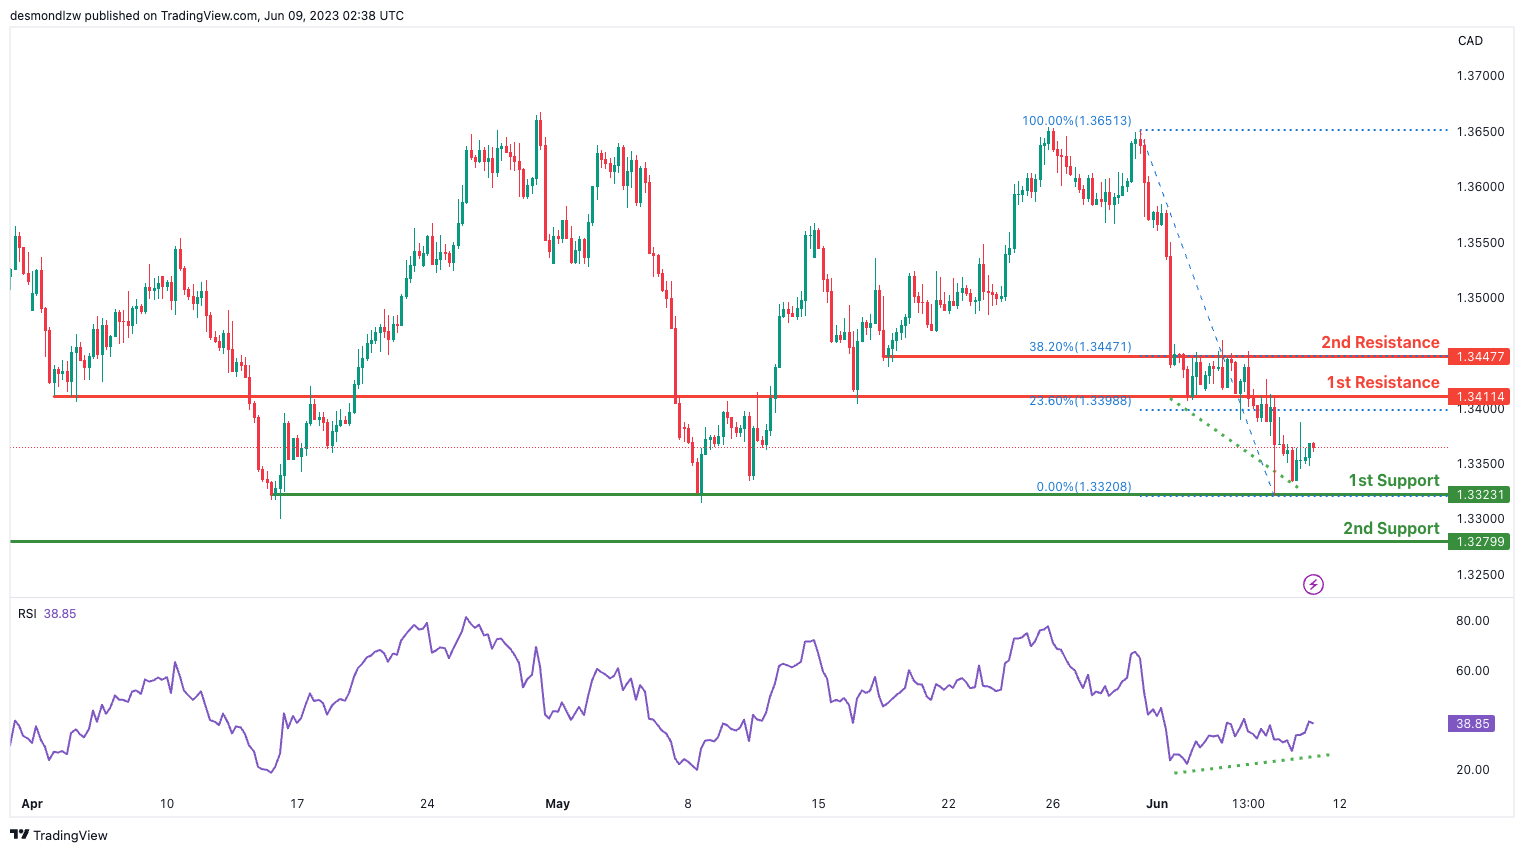
The USD/CAD chart currently exhibits bullish momentum, indicating a positive bias in price movement.
There is a potential for a bullish continuation towards the first resistance level at 1.3411.
The first support level at 1.3323 is significant as it represents a multi-swing low support, suggesting its historical importance as a level where buying interest has been observed.
Additionally, the second support level at 1.3279 is an overlap support, further reinforcing its potential as a reliable area of support.
On the upside, the first resistance level at 1.3411 is an overlap resistance, indicating that it has previously acted as a barrier to upward price movement. This level also coincides with the 23.60% Fibonacci retracement level, adding to its significance.
Furthermore, the second resistance level at 1.3347 is another overlap resistance, implying its historical relevance in limiting price advances. This level coincides with the 38.20% Fibonacci retracement level, providing additional confirmation.
Moreover, the bullish divergence observed in the RSI (Relative Strength Index) versus price indicates a potential reversal or increase in bullish momentum. This further supports the likelihood of a rapid incline in price.
AUD/USD:
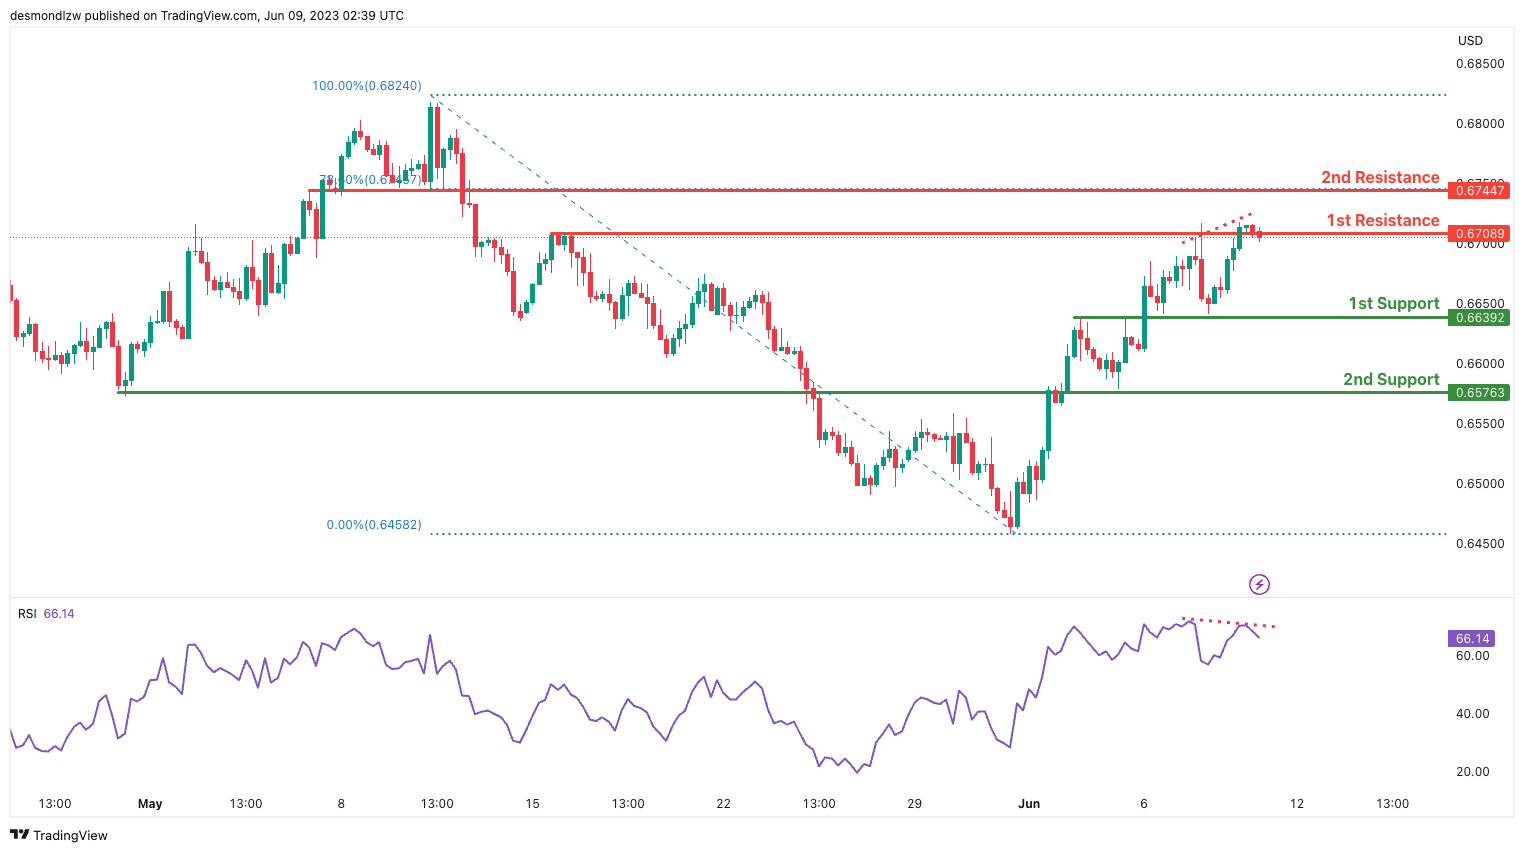
The AUD/USD chart currently exhibits bearish momentum, indicating a negative bias in price movement.
There is a potential for a bearish reaction off the first resistance level at 0.6708, leading to a drop towards the first support level at 0.6639.
The first support level at 0.6639 is an overlap support, indicating its historical significance as a level where buying interest has been observed in the past.
Similarly, the second support level at 0.6576 is another overlap support, further emphasizing its potential as a reliable area of support.
On the upside, the first resistance level at 0.6708 is a multi-swing high resistance, suggesting its historical importance in limiting upward price movements.
Furthermore, the second resistance level at 0.6744 is a pullback resistance and coincides with the 78.60% Fibonacci retracement level, adding to its significance as a potential barrier for price advances.
In addition, the bearish divergence observed in the RSI (Relative Strength Index) versus price suggests a possible reversal in the near future. This further supports the likelihood of a potential shift in momentum.
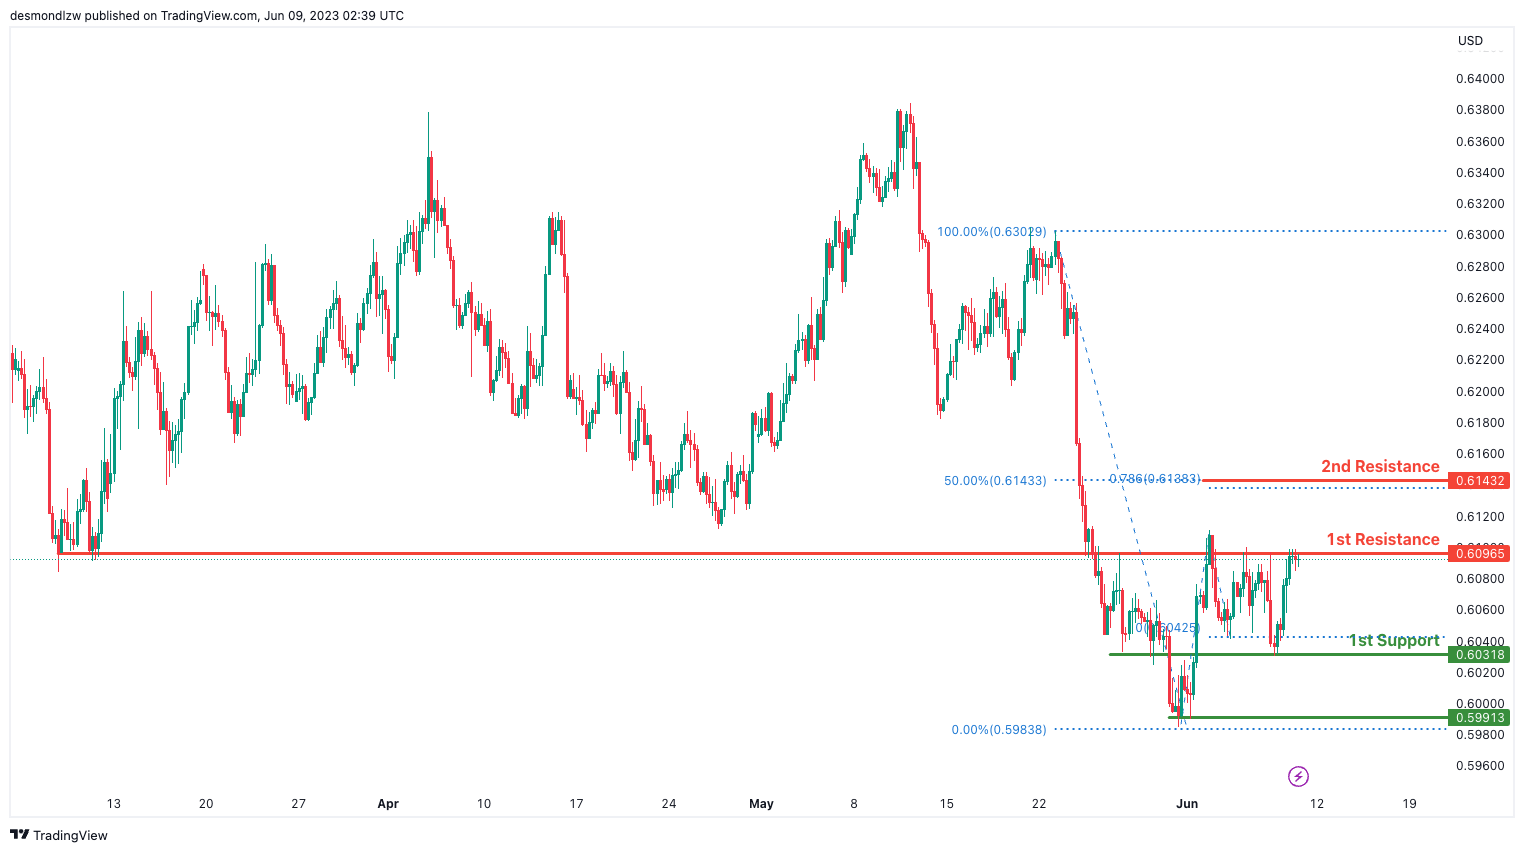
NZD/USD
The NZD/USD chart currently demonstrates bearish momentum, suggesting a negative bias in price movement.
There is a potential for a bearish continuation towards the first support level at 0.6031.
The first support level at 0.6031 is an overlap support, indicating its historical significance as a level where buying interest has been observed in the past.
Additionally, the second support level at 0.5991 is a multi-swing low support, further reinforcing its potential as a strong area of support.
On the upside, the first resistance level at 0.6096 is an overlap resistance, highlighting its historical importance in limiting upward price movements.
Furthermore, the second resistance level at 0.6143 demonstrates a Fibonacci confluence, as it coincides with both the 50% Fibonacci retracement level and the 78.60% Fibonacci projection level. This reinforces its significance as a potential area of resistance.
DJ30:
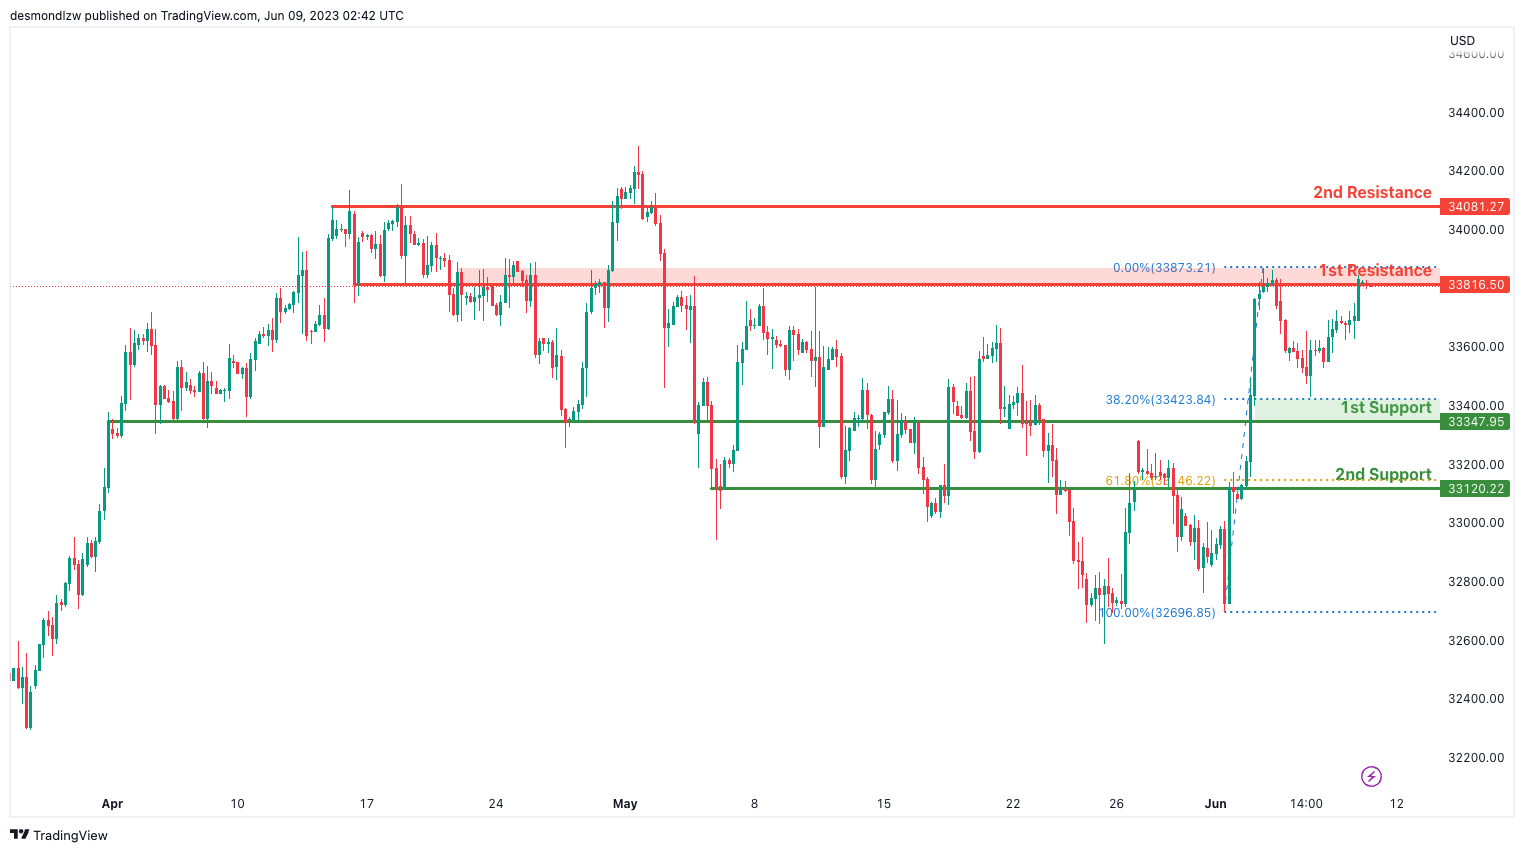
The DJ30 chart currently exhibits weak bearish momentum with low confidence, indicating a lack of strong directional bias in the market.
There is a potential for a bearish reaction off the first resistance level at 33816.50, which is an overlap resistance. This level has historically acted as a barrier to upward price movements.
On the downside, the first support level at 33347.95 is a pullback support, coinciding with the 38.20% Fibonacci retracement level. This level has the potential to provide a temporary bounce or reversal in price.
Additionally, the second support level at 33120.22 is a pullback support, aligning with the 61.80% Fibonacci retracement level. It further reinforces the potential for price to find support and reverse its downward momentum.
It is important to note that the overall momentum in the DJ30 chart is weak, indicating a lack of strong conviction in the bearish bias
GER30:
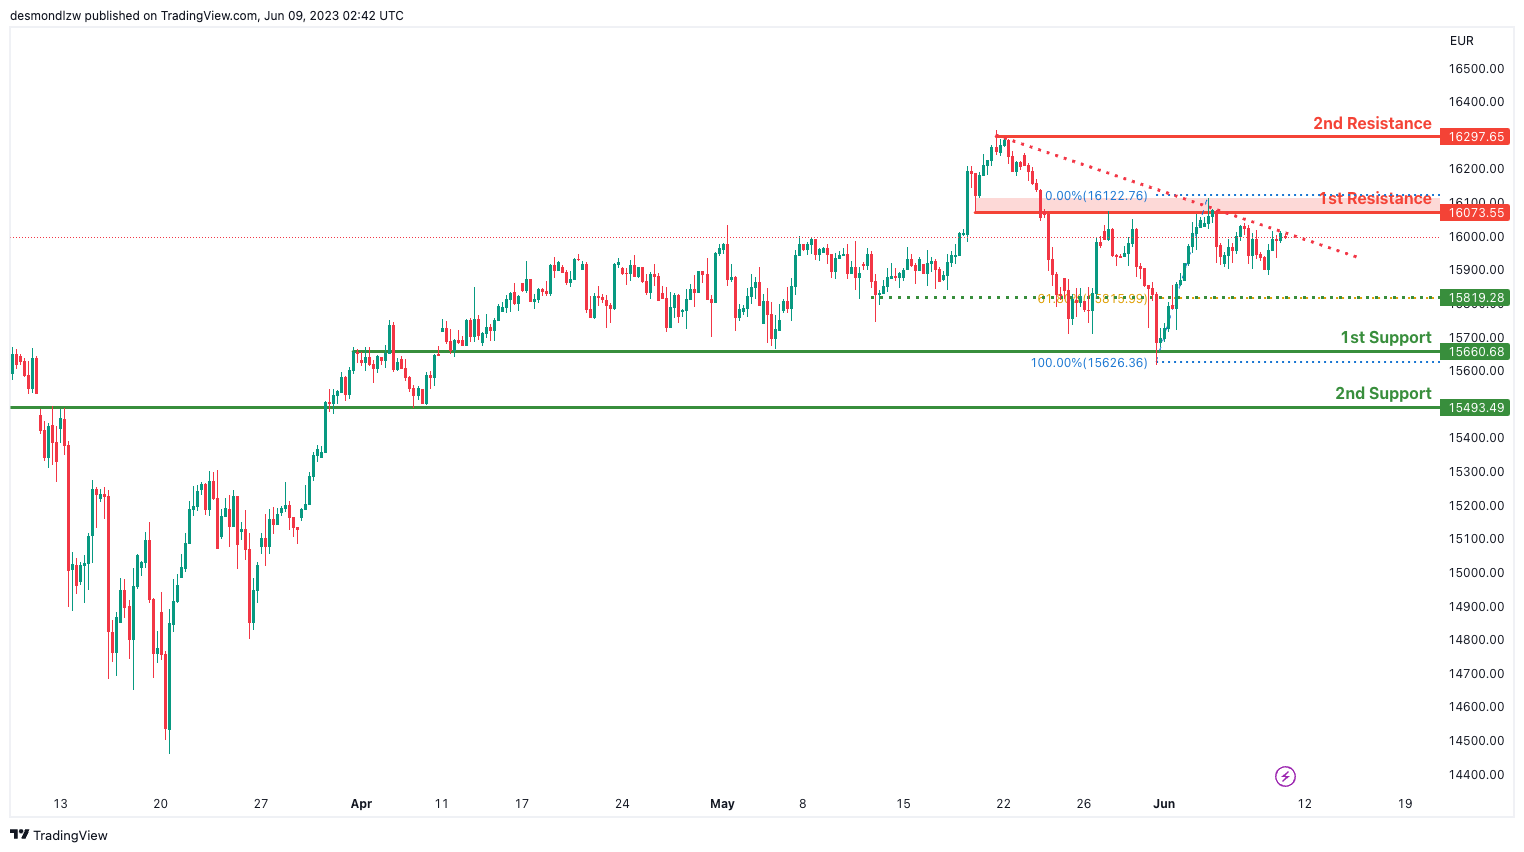
The GER30 chart currently demonstrates bearish momentum, supported by the fact that the price is below a major descending trend line, indicating the potential for further bearish movement.
There is a possibility of a bearish continuation towards the first support level at 15660.68. This level is an overlap support, meaning it has previously acted as a significant level of price support.
Additionally, the second support level at 15493.49 is another overlap support, further reinforcing its potential as a level where price may find support and potentially reverse its downward momentum.
On the upside, the first resistance level at 16073.65 is an overlap resistance, which has historically acted as a barrier to upward price movements.
Furthermore, the second resistance level at 16297.65 is a swing high resistance, indicating its significance in impeding further upward movement.
In between these levels, there is an intermediate support at 15819.28, which is a pullback support and aligns with the 61.80% Fibonacci retracement level. This level adds further weight to its potential as a level where price may find support and reverse its bearish momentum.
US500
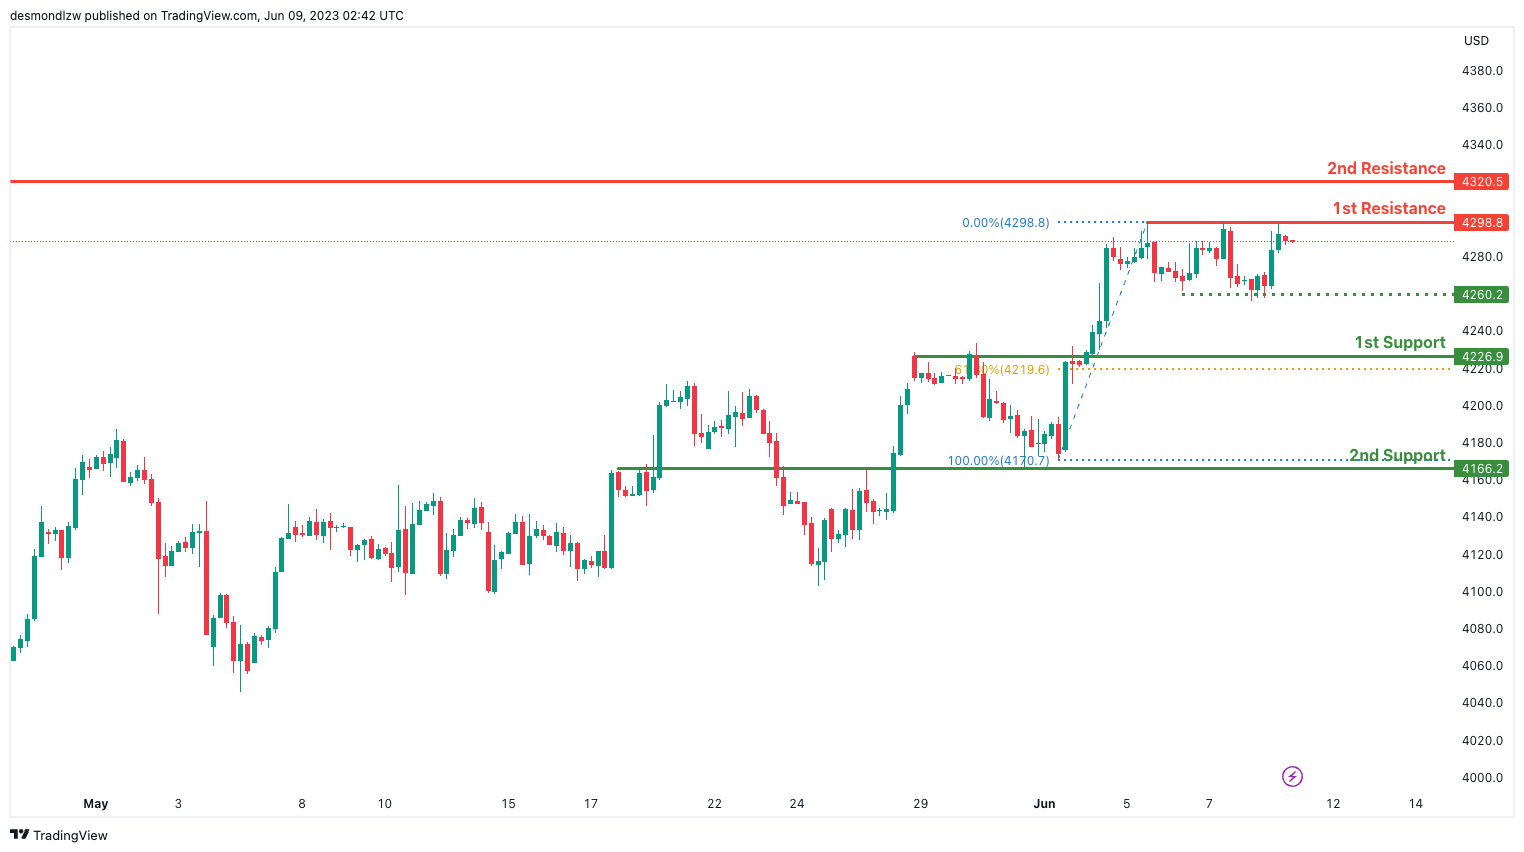
The US500 chart is currently experiencing a neutral momentum, with no clear trend direction evident.
Price has the potential to fluctuate between the first resistance level at 4298.8 and the first support level at 4226.9.
The first support level at 4226.9 is an overlap support, indicating its historical significance as a level where price has previously found support.
Similarly, the second support level at 4166.2 is another overlap support level, further reinforcing its potential as a level where price may find support and reverse any downward movement.
On the upside, the first resistance level at 4298.8 is a multi-swing high resistance, suggesting its significance in hindering upward price movements.
Furthermore, the second resistance level at 4320.5 is a swing high resistance, indicating its potential to impede further upward movement.
In between these levels, there is an intermediate support at 4260.2, which is a multi-swing low support and aligns with the 61.80% Fibonacci retracement level. This level adds further weight to its potential as a level where price may find support and reverse its short-term downward momentum.
BTC/USD:
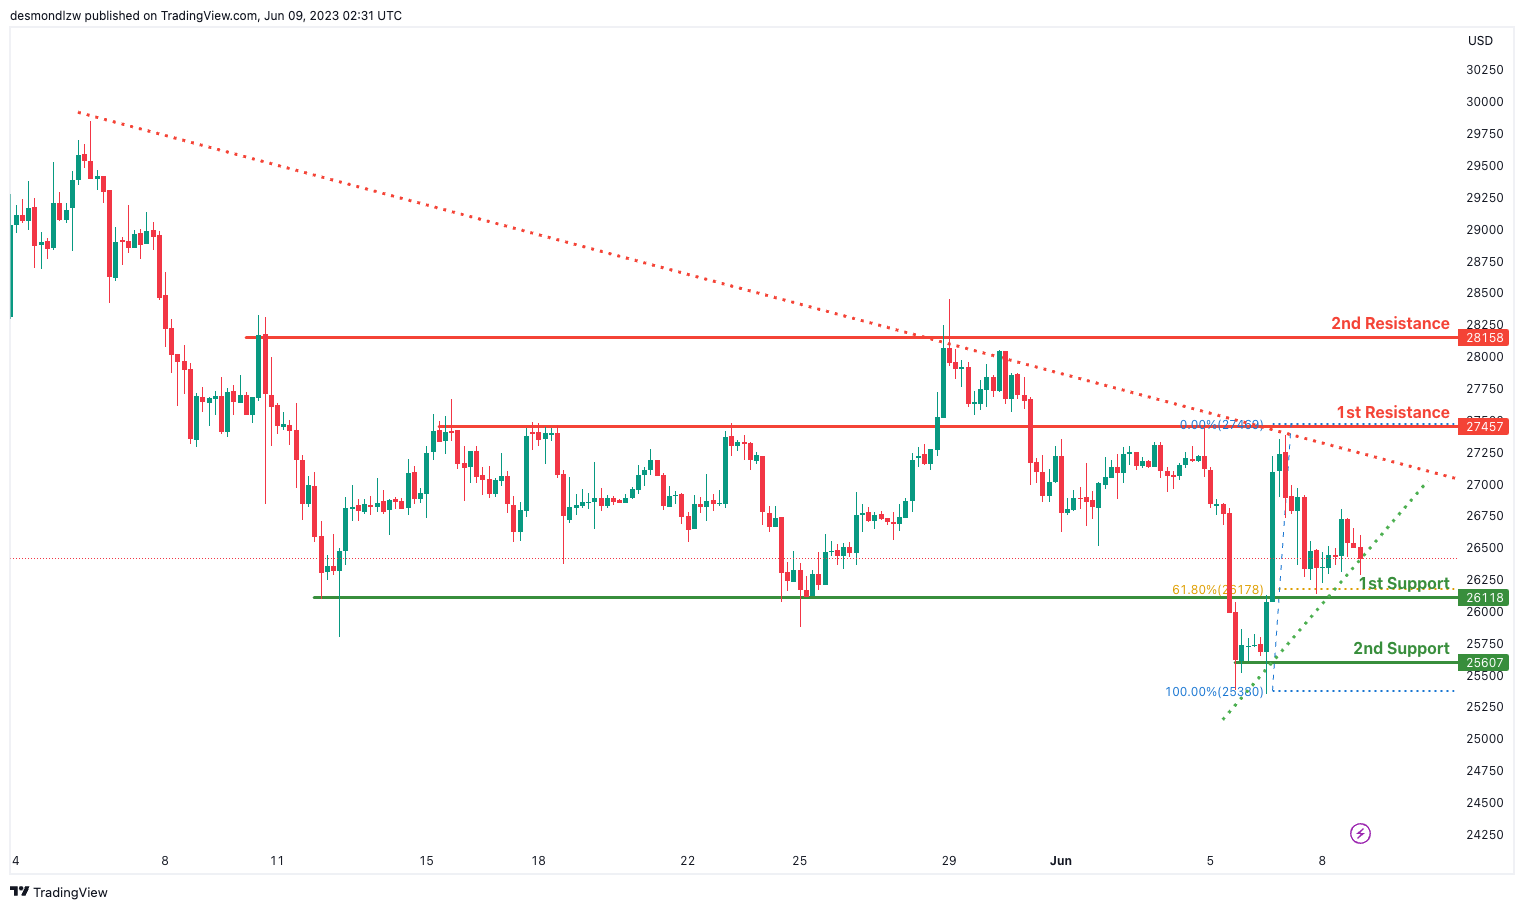
The BTC/USD chart is currently experiencing a neutral momentum, with no clear trend direction evident.
Price has the potential to fluctuate between the first resistance level at 27457 and the first support level at 26118.
The first support level at 26118 is an overlap support, indicating its historical significance as a level where price has previously found support.
Similarly, the second support level at 25607 is a multi-swing low support, further reinforcing its potential as a level where price may find support and reverse any downward movement.
On the upside, the first resistance level at 27457 is an overlap resistance, suggesting its significance in hindering upward price movements.
Furthermore, the second resistance level at 28158 is a multi-swing high resistance, indicating its potential to impede further upward movement.
Additionally, the chart pattern observed is a symmetrical triangle, which represents a period of consolidation before the price is forced to breakout or breakdown. A break above the upper trendline of the pattern could signal a bullish breakout, while a break below the lower trendline might indicate a bearish breakdown. Traders should closely monitor the price action within this pattern for potential breakout or breakdown signals.
ETH/USD:
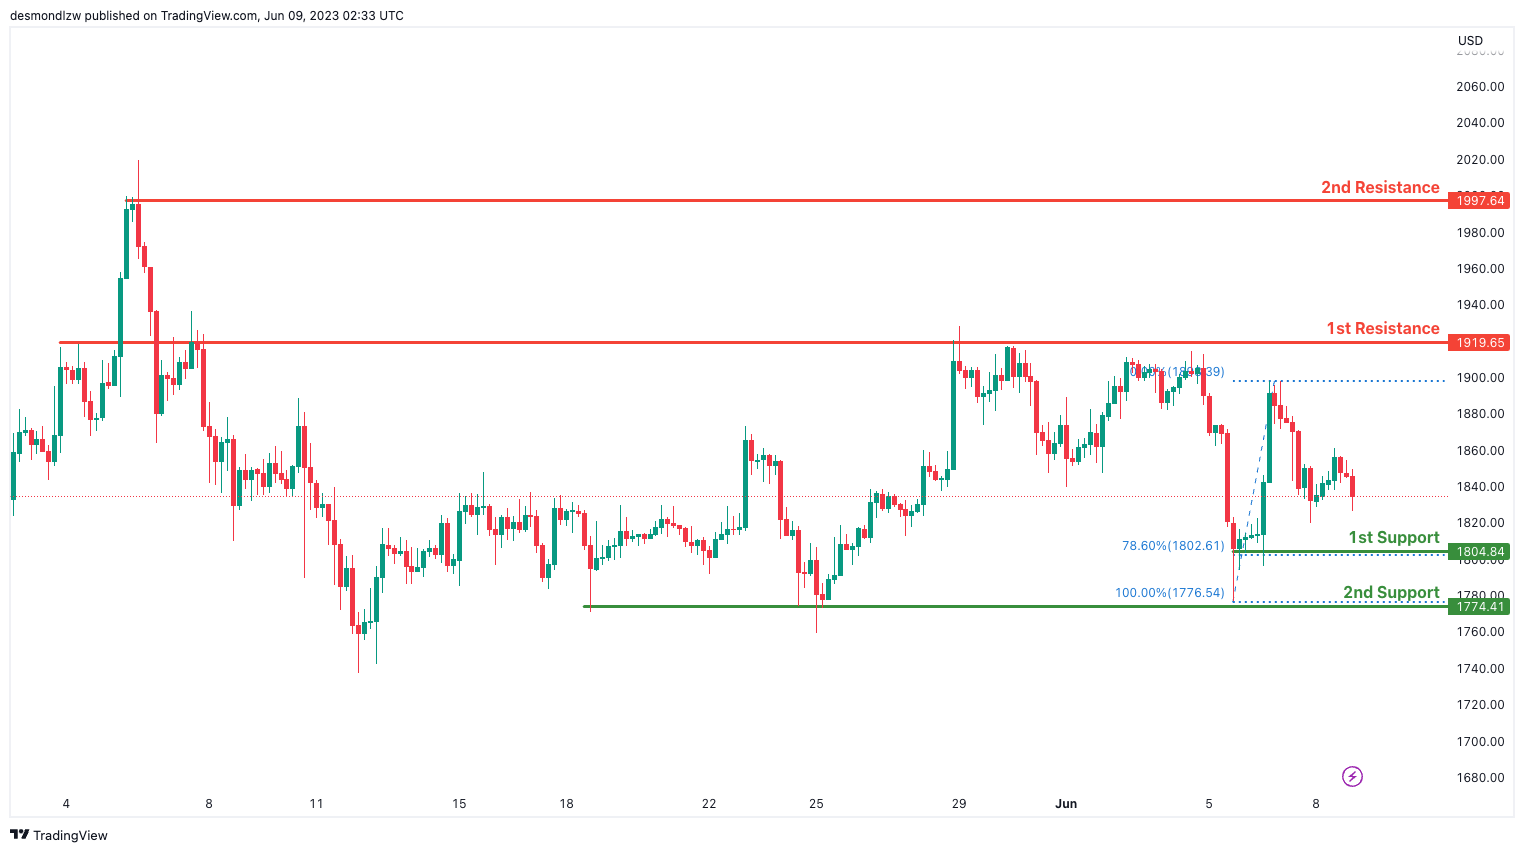
The ETH/USD chart is currently showing a bearish momentum, indicating a downward trend in price.
There is a potential for a bearish continuation towards the first support level at 1804.84. This support level is significant as it is a multi-swing low support and coincides with the 78.60% Fibonacci retracement level, suggesting its importance in providing potential price support.
In addition, the second support level at 1774.41 is also a multi-swing low support, further reinforcing its significance as a potential level where price could find support and reverse any downward movement.
On the upside, the first resistance level at 1919.65 is an overlap resistance, indicating its historical significance as a level where price has previously faced resistance.
Furthermore, the second resistance level at 1997.54 is a swing high resistance, suggesting its potential to impede further upward movement.
WTI/USD:
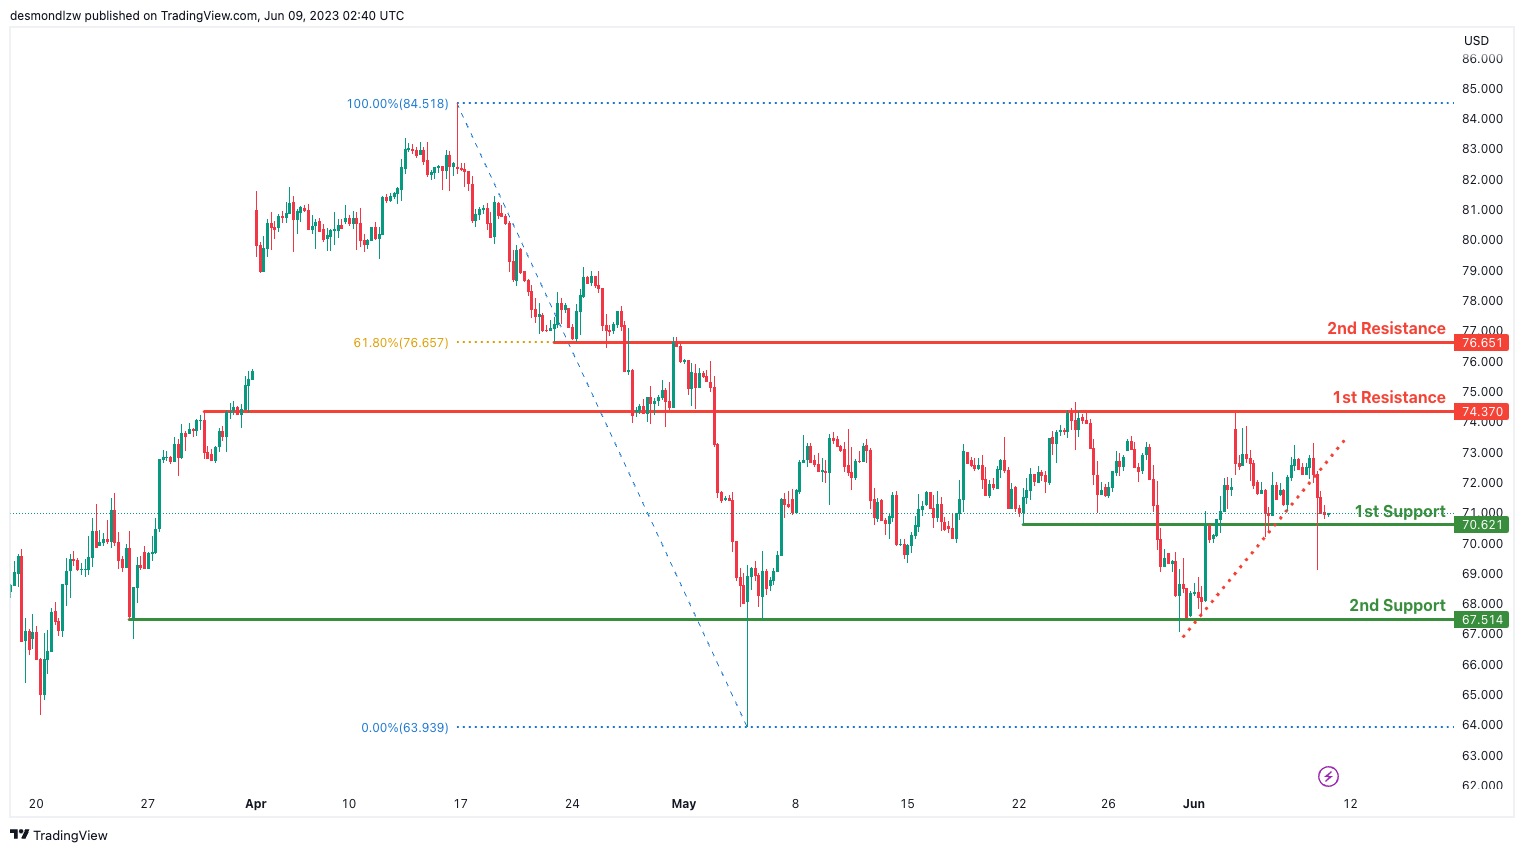
The WTI chart is currently displaying a bearish momentum, indicating a downward trend in price.
One of the contributing factors to this momentum is the break below an ascending support line, which has triggered a potential bearish move.
There is a possibility for a bearish break off the first support level at 70.62, which is an overlap support level. This support level holds significance as it has previously acted as a level where price found support. A break below this support level could potentially lead to a drop towards the second support level at 67.51, which is a multi-swing low support.
On the upside, the first resistance level at 74.37 is an overlap resistance, suggesting its historical significance as a level where price has faced resistance.
Additionally, the second resistance level at 76.66 is also an overlap resistance and coincides with the 61.80% Fibonacci retracement level. This resistance level holds importance as it signifies a potential area where price may encounter further resistance.
XAU/USD (GOLD):
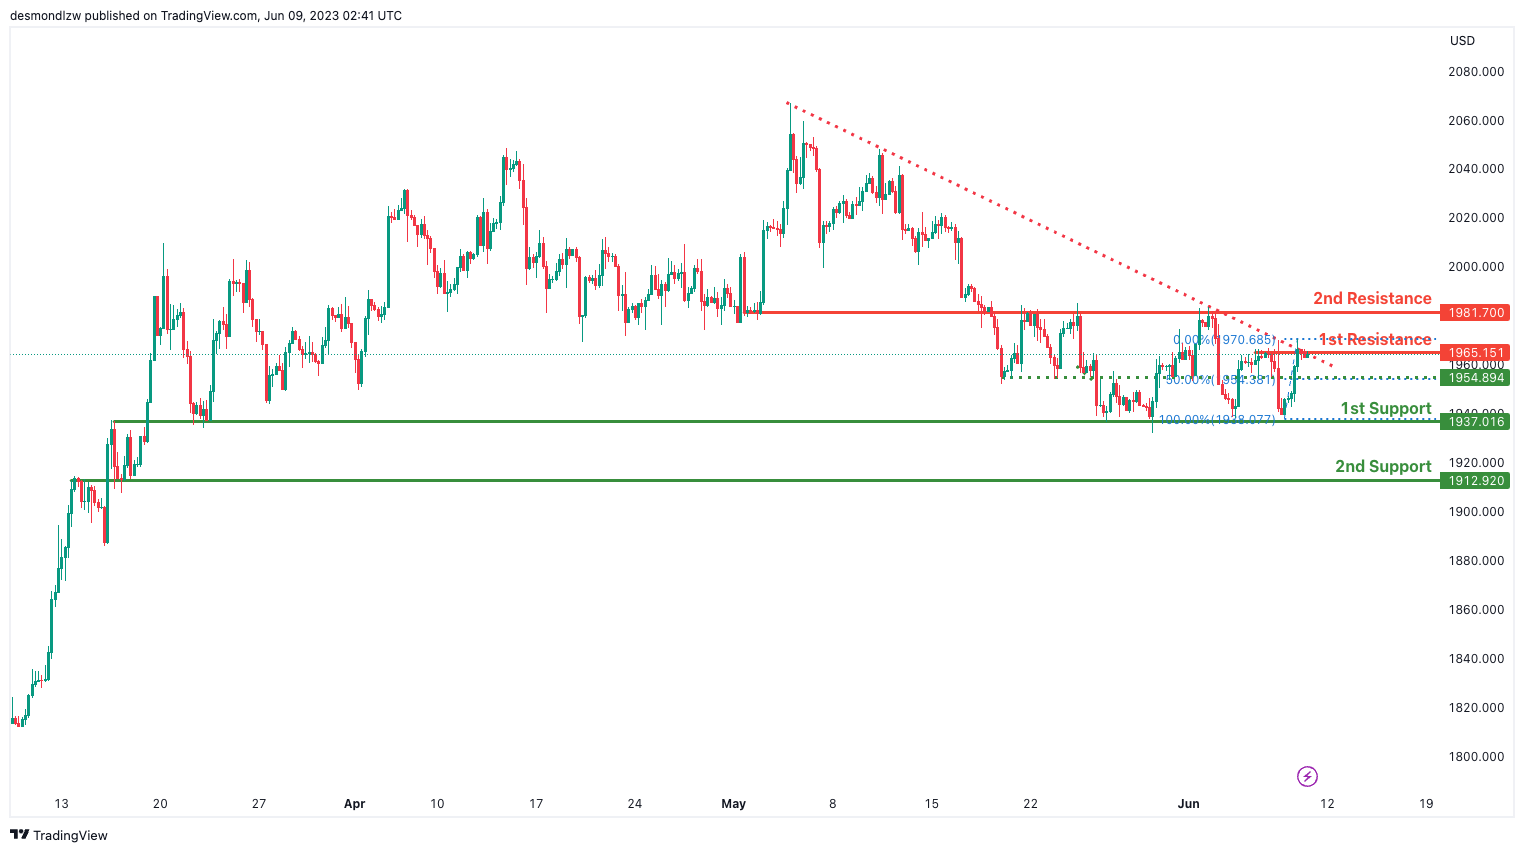
The XAU/USD chart is currently displaying a bearish momentum, indicating a downward trend in price.
One of the factors contributing to this momentum is the price being below a major descending trend line. This suggests that bearish momentum is likely to continue.
There is a potential for a bearish continuation towards the first support level at 1937.01. This support level is significant as it has previously acted as a level where price found support.
The second support level at 1912.92 is also an overlap support level, further reinforcing its importance as a potential level for price to find support.
On the upside, the first resistance level at 1965.15 is a multi-swing high resistance level. This resistance level holds significance as it has historically acted as a level where price faced resistance.
Additionally, the second resistance level at 1981.70 is an overlap resistance level. This level may also provide resistance to the upward movement of price.
China CPI ticked up to 0.2% yoy in May, but PPI down -4.6% yoy
China CPI ticked up slightly from 0.1% yoy to 0.2% yoy in May, above expectation of 0.1% yoy. Core CPI, which excludes volatile food and energy prices, slowed from 0.7% yoy to 0.6% yoy.
Food price rose 1.0% yoy, up from prior month's 0.4% yoy. However, price for industrial consumer products dropped -1.7% yoy, worse than April's -1.5% yoy. On a month-on-month basis CPI dropped -0.2% mom, deeper than April's -0.1% mom.
PPI dropped from -3.60% yoy to -4.6% yoy, below expectation of -3.9% yoy. That's also the steepest decline in seven years since May 2016.
Dong Lijuan, an NBS statistician, said the consumer inflation picked up marginally with the gradual recovery in consumer demand, while the fall in factory-gate prices was affected by declining international commodity prices, weak demand for industrial products at both home and abroad, as well as a high comparison base in the previous year.
BoJ to persist with monetary easing amid inflation uncertainty, says Ueda
BoJ is committed to maintaining its monetary easing policy as it seeks to sustainably achieve its 2% inflation target, stated BOJ Governor Kazuo Ueda in a parliamentary address.
He acknowledged, "There's still some distance to sustainably and stably achieve our 2% inflation target. As such, we will patiently maintain our monetary easing policy."
Ueda explained that the central bank's strategy is to initiate a positive cycle in which inflation-adjusted wages will start to rise.
However, he also indicated that BOJ anticipates core consumer inflation to dip below 2% target in the latter half of the fiscal year. Despite this projection, Ueda expressed that there remains a substantial degree of uncertainty surrounding the inflation outlook.
One key factor he highlighted is corporate price-setting behaviour, which he stated was "somewhat overshooting expectations."
BoC’s Beaudry: Data since April tipped the balance for rate hike
Paul Beaudry, Deputy Governor of BoC, has shed more light on the unexpected 25bps rate hike that took place this week. In a speech, he explained that the evidence gathered from a multitude of economic indicators had "tipped the balance" in favor of this decision. The persistent excess demand in Canadian economy, he observed, posed an increased risk of a stall in the decline of inflation, necessitating the rate hike.
Unanticipated robust economic growth was also a key factor that prompted the monetary tightening. "Economic growth rebounded in the first quarter of 2023 to 3.1%," Beaudry said, "Consumption growth, in particular, was very strong at 5.8%, with household spending on both goods and services sharply higher. This surprised us."
He then turned his attention to inflation, discussing April's unexpected increase to 4.4%, up from 4.3% in March. "While that might not seem like much," Beaudry continued, "it was in the opposite direction of what we expected, and the details behind the headline number were concerning." The sticking points were that three-month measures of core inflation remain high and appear to "have lost their downward momentum", and that goods inflation surprisingly accelerated in April, reversing months of deceleration.
Beaudry stated, "when we looked at the recent dynamics in core inflation combined with ongoing excess demand, we agreed the likelihood that total inflation could get stuck well above the 2% target had increased. Based on this accumulated evidence, we decided to raise the policy rate to slow demand and restore price stability."
The Deputy Governor promised more insight into these matters in the BoC's July forecast, indicating that the central bank remains vigilant and will adjust its policies as the economic climate necessitates.