Sample Category Title
Fed holds, still sees one cut this year and next despite higher inflation
Federal Reserve left its policy rate unchanged at 3.50–3.75% as widely expected, but the updated projections and statement revealed a subtle shift in the outlook. Known dove Governor Stephen Miran dissented in favor of a 25bps cut.
The statement struck a balanced tone, noting that “economic activity has been expanding at a solid pace” while “job gains have remained low” and “inflation remains somewhat elevated.” Importantly, the Fed flagged that “uncertainty about the economic outlook remains elevated,” with explicit reference to the Middle East, signaling awareness of rising geopolitical risks without committing to a policy response.
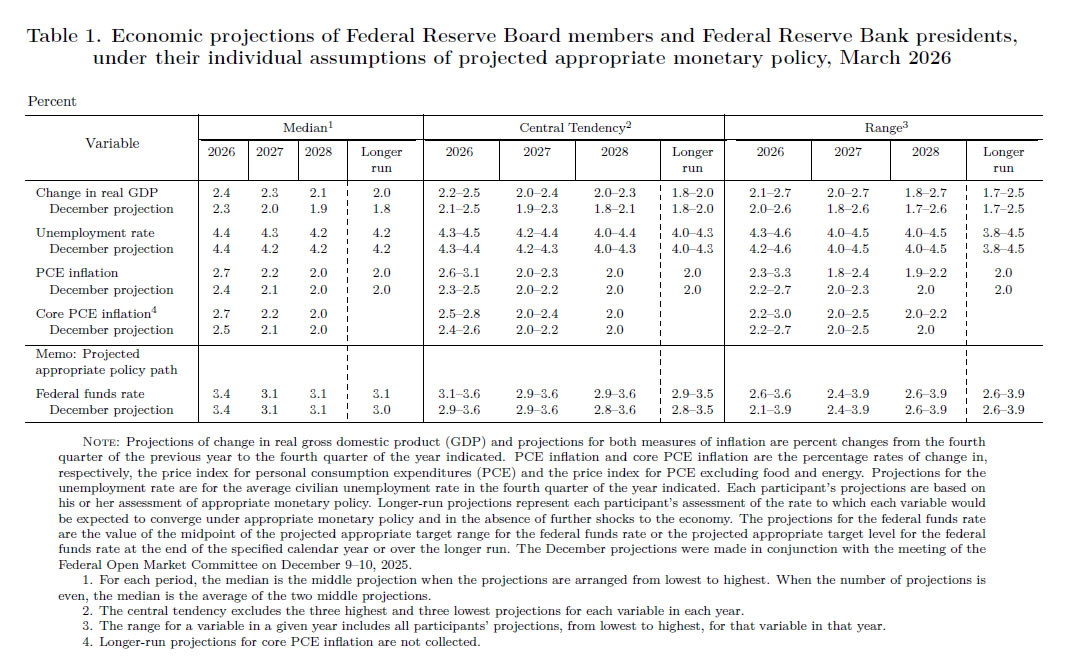
Updated projections point to a more resilient economy alongside firmer inflation. GDP growth was revised higher across the forecast horizon, to 2.4% (from 2.3%) in 2026, 2.3% (2.0%) in 2027, and 2.1% (1.9%) in 2028. At the same time, inflation forecasts were lifted, with headline PCE raised to 2.7% (from 2.4%) in 2026 and core PCE nudged higher from 2.5% to 2.7% as well. Despite this, the unemployment rate path remained broadly stable around the mid-4% range, indicating no material deterioration in labor market conditions.
Crucially, the rate path itself was left unchanged, with the median projection at 3.4% by end-2026 and 3.1% in both 2027 and 2028, implying a gradual easing cycle of one cut per year. However, the distribution narrowed notably, from 2.1-3.9% to 2.6-3.6%, suggesting increased confidence in this baseline. This combination of higher inflation and steady rate expectations suggests that the Fed is not yet prepared to react to emerging price pressures.
Taken together, the decision highlights a Fed that is cautious but not reactive. Policymakers recognize that inflation may run higher than previously expected, but with growth holding up and the labor market stable, there is little urgency to adjust policy. The focus remains on monitoring incoming data and evolving risks.
(FED) Federal Reserve Issues FOMC Statement
Available indicators suggest that economic activity has been expanding at a solid pace. Job gains have remained low, and the unemployment rate has been little changed in recent months. Inflation remains somewhat elevated.
The Committee seeks to achieve maximum employment and inflation at the rate of 2 percent over the longer run. Uncertainty about the economic outlook remains elevated. The implications of developments in the Middle East for the U.S. economy are uncertain. The Committee is attentive to the risks to both sides of its dual mandate.
In support of its goals, the Committee decided to maintain the target range for the federal funds rate at 3‑1/2 to 3‑3/4 percent. In considering the extent and timing of additional adjustments to the target range for the federal funds rate, the Committee will carefully assess incoming data, the evolving outlook, and the balance of risks. The Committee is strongly committed to supporting maximum employment and returning inflation to its 2 percent objective.
In assessing the appropriate stance of monetary policy, the Committee will continue to monitor the implications of incoming information for the economic outlook. The Committee would be prepared to adjust the stance of monetary policy as appropriate if risks emerge that could impede the attainment of the Committee's goals. The Committee's assessments will take into account a wide range of information, including readings on labor market conditions, inflation pressures and inflation expectations, and financial and international developments.
Voting for the monetary policy action were Jerome H. Powell, Chair; John C. Williams, Vice Chair; Michael S. Barr; Michelle W. Bowman; Lisa D. Cook; Beth M. Hammack; Philip N. Jefferson; Neel Kashkari; Lorie K. Logan; Anna Paulson; and Christopher J. Waller. Voting against this action was Stephen I. Miran, who preferred to lower the target range for the federal funds rate by 1/4 percentage point at this meeting.
WTI Oil: $100 Comes in Focus Again after Multiple Downside Rejection as Fears
WTI oil price dipped on Wednesday after news that Iraq resumed oil exports via pipeline to Turkey’s East Mediterranean port, temporarily changed the sentiment (oil was up around 2% on Tuesday.
Optimism over the latest measures (Iraq resumes oil export, release of strategic reserves and lifting sanctions on sales of Russian crude oil) may not be sufficient to significantly change the situation.
Escalation of the conflict in the Middle East and threats that Strait of Hormuz (key route for transport of oil from several countries in the Persian Gulf) would be blocked for longer period, would further destabilize global oil supply and push prices much higher, after oil spiked to $120 in immediate reaction.
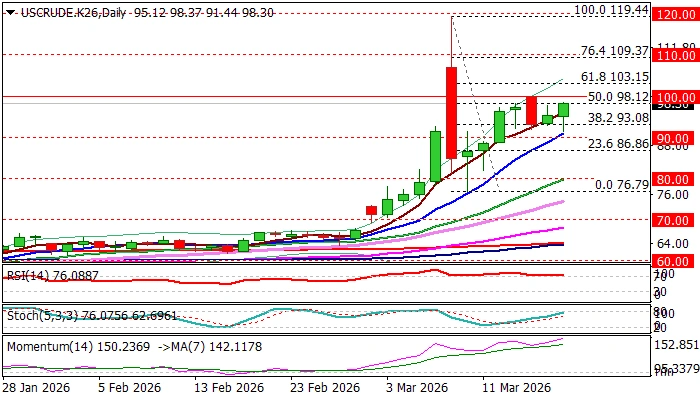
Bullish technical picture on daily chart (strong positive momentum/MAs in full bullish setup with converged 100/200DMAs about to form bull cross) continue to underpin the action, though RSI remains in overbought territory and may obstruct bulls.
Broken Fibo 38.2% of $119.44/$76.79 pullback ($93.08) reverted to solid support which holds dips for the fourth straight day (four consecutive daily closes above this level), pointing to formation of a higher base.
Today’s quick recovery after the price dipped to $91.44 (bounce cracked next barrier at $98.12, Fibo 50%) suggests that bulls regained traction and prepare for renewed attack at psychological $100 barrier, after Monday’s attempt stalled on approach ($99.68).
Sustained break of $100 level to signal bullish continuation (bull-leg off $76.79 correction low) and expose targets at 103.15 (Fibo 61.8% of $119.44/$76.79) and $104.28 (upper 20-d Bollinger band), with stronger acceleration to unmask 109.37/110.00 (Fibo 76.4%/round-figure).
Res: 99.68; 100.00; 103.15; 104.28.
Sup: 96.00; 94.80; 93.08; 90.98.
Sunset Market Commentary
Markets
An Israeli strike on Iran’s giant South Pars gas field set the “Iran-trade” back in swing after two days of contemplation. Iran immediately warned that (energy) facilities in Qatar, Saudi Arabia and the UAE are now on the its hit list as the attack on Iran’s own energy infrastructure “will not go unanswered”. Brent crude prices were already rising since the start of European trading, but the move hit a higher gear afterwards. The oil price rallies from levels just above $100/b to currently $110/b. Gas prices followed swiftly with the reference Dutch TTF contract add more than 10%, from €50/MWh to €56. In an attempt to stem (US) price pressures, US President Trump temporary waived the Jones Act allowing foreign-flagged vessels to transport a range of commodities between US ports for the next 60 days. Normally such cargo should be carried on US-flagged, -built and -owned ships. Core bonds turn back to sell-off mode, with yield curves bear flattening in anticipation of a hawkish (verbal) monetary policy response over the next 24 hours. The Fed, BoJ, ECB and BoE are expected to sound much more vigilant than their “transitory” rhetoric from four years ago. The Bank of Canada was a point in case today. They kept the policy rate unchanged at 2.25% but reported readiness to respond (to upside inflation risks) in the policy statement: “Governing council will look through the war’s immediate impact of inflation but if energy prices stay high, we will not let their effects broaden and become persistent”. Governor Macklem nevertheless downplayed the risk that higher energy prices quickly spread to the prices of other Canadian goods and services. He might have missed the BASF-memo. The German chemical group increases prices of some of its products by up to 30% effective immediate amid higher costs of raw materials, energy and transportation. Short-term German and UK yield increase by more than 8 bps. EMU money markets for the first time fully price 2 ECB rate hikes this year (25 bps). The front-end of the US curve grinds 4 bps higher. Adding to the inflation worries, February US PPI already beat consensus. Factory-gate prices increased by 0.7% M/M on a headline level and by 0.5% for core prices. Annual comparisons rose to 3.4% and 3.9% respectively. The latter matches the fastest pace since February 2023. Dollar gains in FX space are less outspoken than earlier this month. The trade-weighted greenback tries to regain the 100 barrier. EUR/USD changes hands at 1.1510 from a start near 1.1540. European stock markets switched intraday gains for losses of up to 0.50% with main US indices currently sliding by the same magnitude.
At tonight’s FOMC meeting, it is very unlikely that the policy statement, the quarterly projections or Fed Chair Powell’s press conference will still pave the way for a rate cut this year. At the end of February, US money markets discounted 2.5 rate cuts by December with the policy rate bottoming out around 2.75%-3% next year. Now, Fed funds futures only give an 80% probability to one Fed rate cut this year which would most likely be the final one than this cycle but might be pushed further in time. That leaves more room for repositioning in bear flattening fashion especially as we don’t exclude inflation hawks to put rate hikes in their forecasts.
News & Views
The Swiss KOF Economic Institute in its Spring forecast considers two scenarios as the exercise is overshadowed by higher trade-related and geopolitical uncertainty. In its baseline forecast, KOF assumes the impact on Switzerland from the conflict in the Middle East to be limited and to normalize after an initial shock. In this scenario GDP growth (ex-major sporting events) is projected at 1% this year and 1.7% next year. In an alternative scenario with the oil price holding near $90/b and remaining 30% above the baseline scenario, KOF downgrades its growth forecast to 0.7% and 1.5% respectively resulting in a cumulative GDP loss of 0.6% by end 2027. Employment growth would then weaken (20,000 fewer jobs) lifting the unemployment rate to 3.1% in 2027. Inflation in the risk scenario is expected to increase from 0.3% to 0.6% in 2026 and from 0.6% to 0.8% in 2027. Overall inflationary pressures remain low overall. Rents and domestic services remain the main drivers. Domestic goods and imports exert downward pressure with the appreciation of the franc adding disinflationary pressure. KOF expects the Swiss National Bank (SNB) to keep its policy rate at 0% throughout the forecast period. The SNB will release a regular policy decision tomorrow. The market will keep a close look at the SNB communication on FX interventions. The Swiss franc at EUR/CHF 0.907 trades slightly weaker from record strong levels (except 2015 spike) below EUR/CHF 0.90 last week.
Bank of Canada Holds as Expected, Highlights Risks are Tilted to the Downside
The Bank of Canada (BoC) held its policy rate at 2.25%, in line with market expectations.
The Opening Statement made clear that uncertainty is higher than before as the "war in Iran has added a new layer of uncertainty". The total impact of the shock is uncertain but "how long the conflict lasts and the extent to which it spreads across the Middle East" are two key factors that were cited.
Since January, the economy has grown "at a slower pace" than the BoC forecast. However, given the inflation shock, the BoC noted that this "excess supply" is helping to contain the "risk that higher energy prices quickly spread to the prices of other goods and services." But the Bank also struck a dovish note, pointing out that "relative to our January forecast, risks to economic growth are tilted to the downside."
Most importantly the statement highlighted that, "Governing Council will look through the war's immediate impact on inflation but if energy prices stay high, we will not let their effects broaden and become persistent inflation".
Key Implications
No real surprises here. The BoC stayed on hold as expected and highlighted the uncertainty coming from the energy shock. The emphasis on keeping inflation pressures from spilling over from energy to other categories was to be expected. What matters in the coming months will be how the assessment and identification of those spillovers are communicated.
The war in the Middle East is the dominant factor here. How long it disrupts supplies of energy products and other goods is the determinant of how big the associated inflationary impact will be. The BoC is focused on the pass-through to core prices and any shifts to inflation expectations. Given a domestic economic backdrop that has featured still-elevated unemployment, softening core inflation and growth risks "tilted to the downside", we expect the Bank of Canada to stay on the sidelines, for now. However, uncertainty is high and the supply shock could easily escalate, broadening inflation beyond energy prices. In the event that both core inflation and inflation expectations drift higher we would expect the BoC to be ready to respond.
BoC holds at 2.25%, flags growth risks despite rising energy inflation
The Bank of Canada left its overnight rate unchanged at 2.25% as widely expected, but the accompanying statement struck a cautious tone, emphasizing downside risks to growth even as inflation risks rise due to higher energy prices. Policymakers acknowledged that uncertainty remains elevated, particularly around US trade policy and the unfolding Middle East conflict.
The key shift lies in the balance of risks. BoC noted that recent data point to weaker-than-expected economic activity, with labor market conditions deteriorating as Q4's job gains were "largely reversed" and unemployment rose to 6.7% in February. "Ongoing weakness in exports" and trade uncertainty further cloud the outlook, reinforcing the view that near-term growth will be softer than previously anticipated.
While inflation is expected to pick up again on higher gasoline prices, current conditions remain benign, with CPI easing to 1.8% yoy and core measures close to 2%. This suggests inflation pressures are not yet embedded, allowing BoC to focus on growth stabilization.
Bank of Canada maintains policy rate at 2¼%
The Bank of Canada today held its target for the overnight rate at 2.25%, with the Bank Rate at 2.5% and the deposit rate at 2.20%.
The war in the Middle East has increased volatility in global energy prices and financial markets, and heightened the risks to the global economy. The breadth and duration of the conflict, and hence its economic impacts, are highly uncertain.
Prior to the war, the global economy was on pace to grow at around 3%, as expected in the January Monetary Policy Report (MPR). Economic growth in the United States has moderated but remains solid, driven by consumption and strong AI-related investment. US inflation remains above target and has evolved largely as expected. In the euro area, domestic demand is supporting growth while exports have contracted. China’s economy continues to be boosted by strength in exports, but domestic demand remains weak.
Since the outbreak of the conflict in the Middle East, global oil and natural gas prices have risen sharply, and this will boost global inflation in the near-term. In addition to energy supply disruptions, transportation bottlenecks stemming from the effective closure of the Strait of Hormuz could impact the supply of other commodities, such as fertilizer. Financial conditions have tightened from accommodative levels. Global bond yields have risen, equity market prices have declined, and credit spreads have widened. The Canada-US dollar exchange rate has remained relatively stable.
After expanding by 2.4% in the third quarter of last year, GDP in Canada contracted 0.6% in the fourth quarter. This was weaker than expected at the time of the January MPR, but mainly because of a larger-than-expected drawdown in inventories. Domestic demand grew by more than 2% due to strength in consumer and government spending, even as housing markets remained weak.
We continue to expect the Canadian economy to grow modestly as it adjusts to US tariffs and trade policy uncertainty, but recent data suggest that near-term economic growth will be weaker than anticipated in January. The labour market remains soft. Employment gains in the fourth quarter of 2025 were largely reversed in the first two months of 2026, and the unemployment rate rose to 6.7% in February. Looking through the volatility, recent data also suggest ongoing weakness in exports. It’s too early to assess the impact of the conflict in the Middle East on growth in Canada.
CPI inflation eased further to 1.8% in February, down from 2.3% in January. CPI inflation excluding changes in indirect taxes as well as core inflation measures have also come down and are all close to 2%. Food inflation slowed in February but remains elevated. The sharp increase in global energy prices has led to increases in gasoline prices, and this will push up total inflation in the coming months.
Against this overall backdrop, Governing Council decided to maintain the policy rate at 2.25%. With recent data pointing to weaker economic activity and uncertainty elevated, risks to growth look tilted to the downside. At the same time, inflation risks have gone up due to higher energy prices. We will continue to assess the impact of US tariffs and trade policy uncertainty, and how the Canadian economy is adjusting. We are also monitoring the unfolding conflict in the Middle East closely and assessing its impact on growth and inflation. As the outlook evolves, we stand ready to respond as needed. The Bank is committed to ensuring that Canadians continue to have confidence in price stability through this period of global upheaval.
Information note
The next scheduled date for announcing the overnight rate target is April 29, 2026. The Bank’s next MPR will be released at the same time.
EUR/USD Mid-Day Outlook
Daily Pivots: (S1) 1.1488; (P) 1.1518; (R1) 1.1570; More….
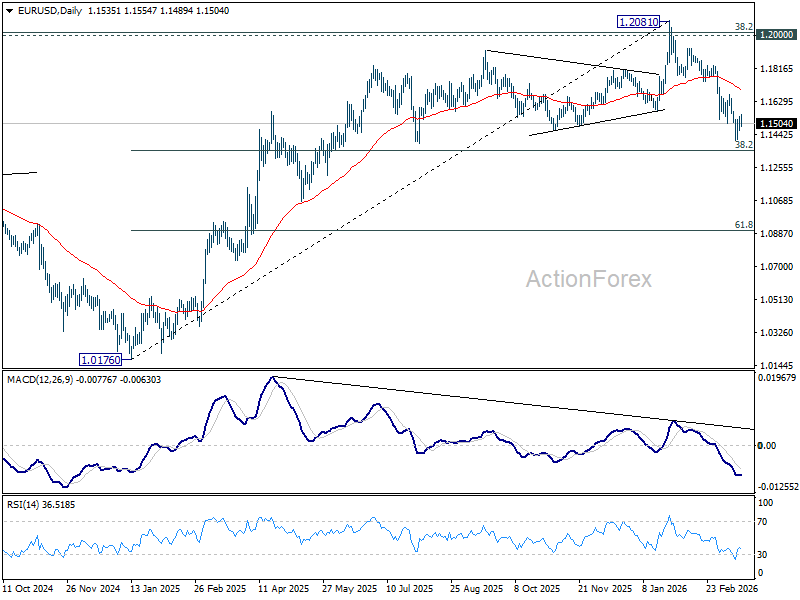
EUR/USD dips notably after hitting 55 4H EMA, but stays above 1.1408 temporary low. Intraday bias remains neutral and some more consolidations could be seen. Further decline is expected as long as 1.1666 resistance holds. Below 1.1408 will resume the fall from 1.2081 to 38.2% retracement of 1.0176 to 1.2081 at 1.1353. Firm break there will target 61.8% projection at 1.0904 next.
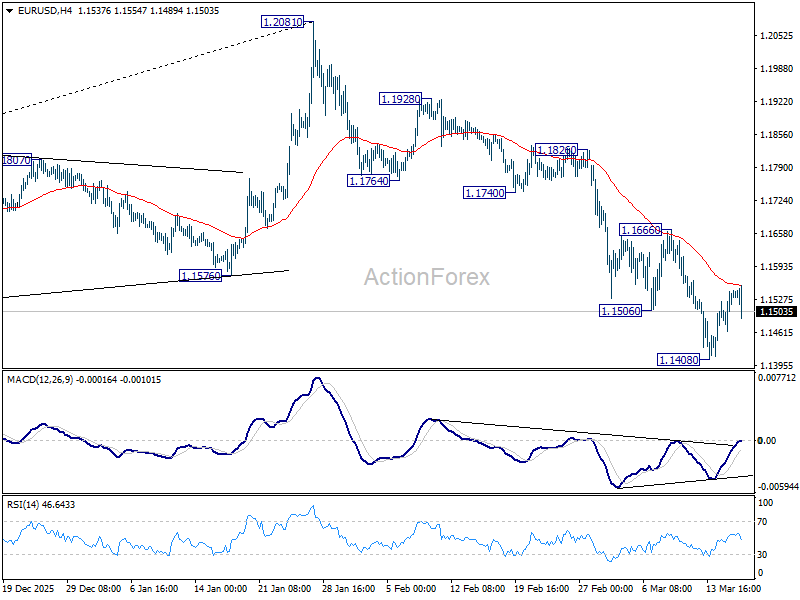
In the bigger picture, the break of 55 W EMA (now at 1.1495) confirms rejection by 1.2 key cluster resistance level. The whole up trend from 0.9534 (2022 low) might have completed as a three wave corrective rise too. In either case, deeper fall is now expected to long term channel support (now at 1.0528. Risk will stay on the downside as long as 1.2081 holds, in case of recovery.
GBP/USD Mid-Day Outlook
Daily Pivots: (S1) 1.3298; (P) 1.3332; (R1) 1.3390; More...
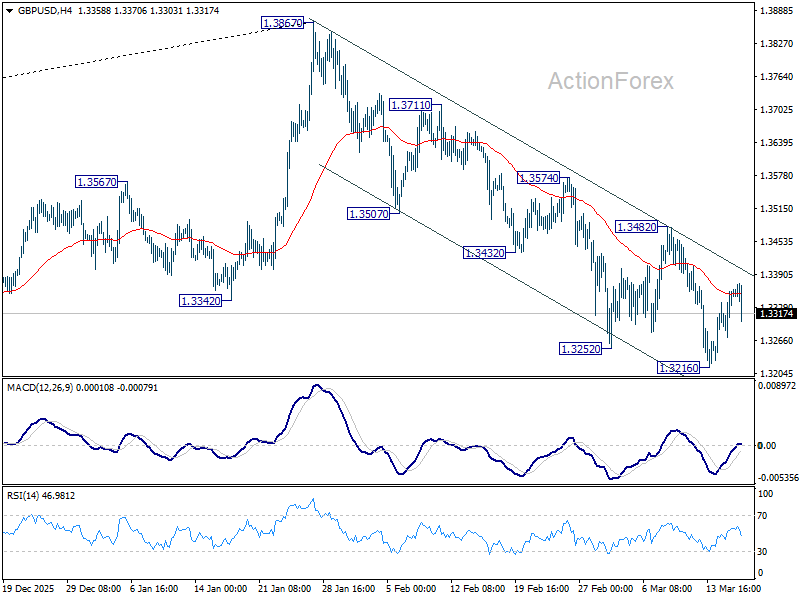
GBP/USD retreated sharply after hitting 55 4H EMA, but stays above 1.3216 temporary low. Intraday bias remains neutral and some more consolidations could still be seen. But risk will stay on the downside as long as 1.3482 resistance holds. Below 1.3216 will resume the fall from 1.3867 to 1.3008 structural support. Firm break there will carry larger bearish implication and target 1.2524 fibonacci level.
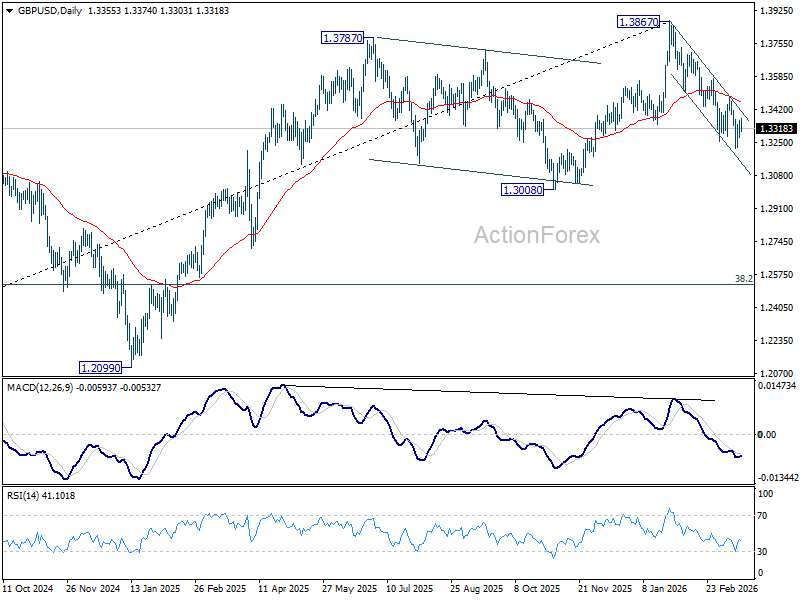
In the bigger picture, considering bearish divergence condition in both D and W MACD, a medium term top should be in place from 1.3867. Firm break of 1.3008 support will argue that fall from 1.3867 is at least correcting the rise from 1.0351 (2022 low) with risk of bearish reversal. That would open up further decline to 38.2% retracement of 1.0351 to 1.3867 at 1.2524. For now, medium term outlook will be neutral at best as long as 1.3867 resistance holds, or under further development.
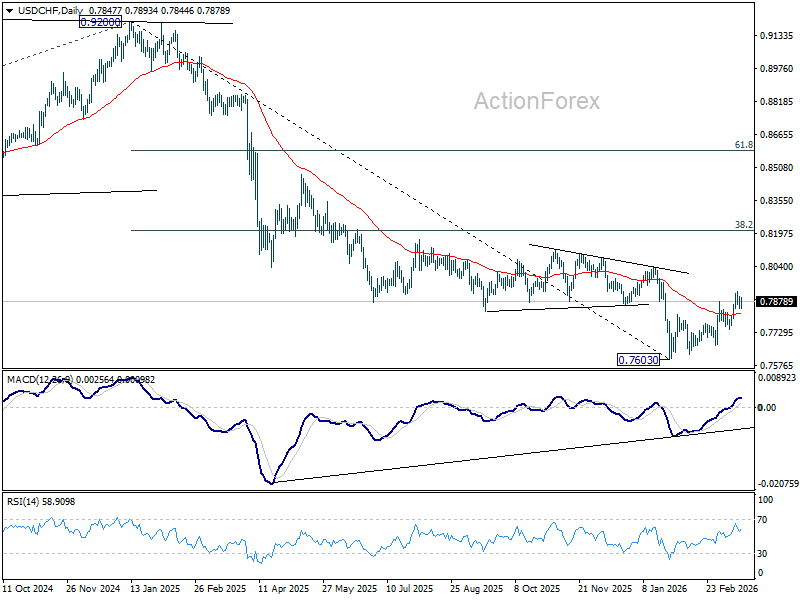
USD/CHF Mid-Day Outlook
Daily Pivots: (S1) 0.7853; (P) 0.7888; (R1) 0.7913; More….
USD/CHF recovers today but stays below 0.7921 temporary top. Intraday bias remains neutral and more consolidations could still be seen. Further rally is still expected as long as 0.7746 support holds. Rise from 0.7603 is seen as correcting whole down trend from 0.9200. Break of 0.7921 will target 38.2% retracement of 0.9200 to 0.7603 at 0.8213.
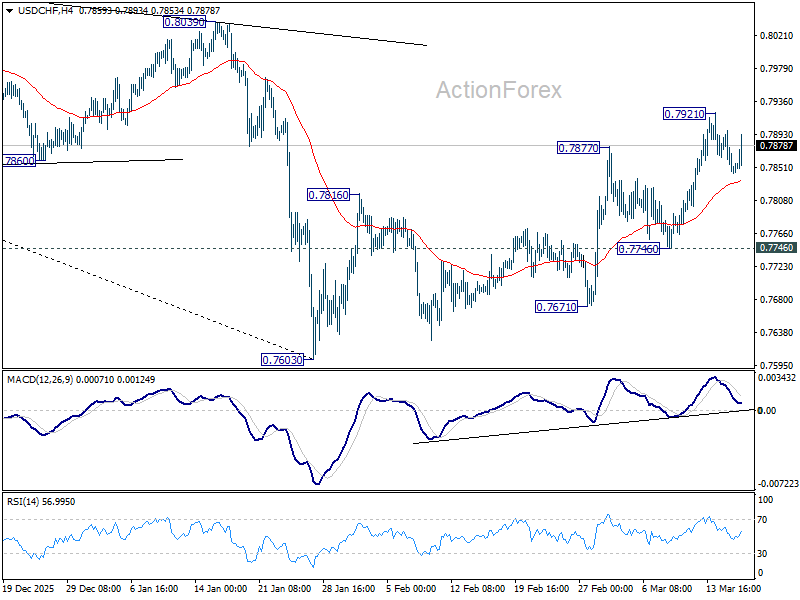
In the bigger picture, a medium term bottom should be in place at 0.7603 on bullish convergence condition in D MACD. Rebound from there is seen as correcting the fall from 0.9200 only. However, decisive break of 55 W EMA (now at 0.8091) will suggest that it's probably correcting the larger scale down trend from 1.0146 (2022 high). On the other hand, rejection by the 55 W EMA will setup down trend resumption to 100% projection of 1.0146 (2022 high) to 0.8332 from 0.9200 at 0.7382 at a later stage.