

Sample Category Title
NZ GDP disappoints at 0.2% as momentum fades into year-end
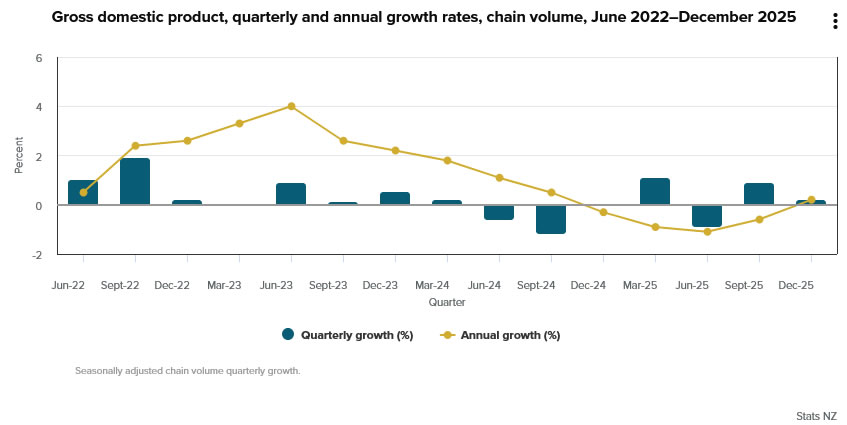
New Zealand’s economy expanded by just 0.2% qoq in Q4, missing expectations of 0.4% qoq and slowing sharply from Q3’s 0.9% qoq pace. On an annual basis, GDP rose 0.2% yoy, marking the first year-on-year expansion since the year ended September 2024, but the weak quarterly print highlights fading momentum into the end of the year.
The details show a mixed picture across sectors. Growth was supported by services, with rental, hiring, and real estate activity leading the increase at 0.8% qoq. Other contributors included retail trade and accommodation (+1.3%), financial and insurance services (+1.5%), information media and telecommunications (+1.9%), and arts and recreation (+2.0%). These gains suggest domestic demand held up in parts of the services economy.
However, the broader picture remains soft. GDP per capita was flat, underscoring limited improvement in underlying living standards. Construction fell -1.4% qoq, acting as the largest drag on growth.
GBP/USD Struggles at Resistance — BoE, Jobs Report in Focus
Key Highlights
- GBP/USD extended losses and traded below 1.3300.
- A key bearish trend line is forming with resistance at 1.3380 on the 4-hour chart.
- EUR/USD seems to be facing resistance near 1.1550 and 1.1565.
- Gold prices declined heavily from $5,050 and traded below $5,000.
GBP/USD Technical Analysis
The British Pound failed to stay above 1.3380 against the US Dollar. GBP/USD declined further and traded below 1.3350 to enter a bearish zone.
Looking at the 4-hour chart, the pair is struggling below the 1.3580 resistance, the 100 simple moving average (red, 4-hour), and the 200 simple moving average (green, 4-hour). There is also a key bearish trend line forming with resistance at 1.3380.
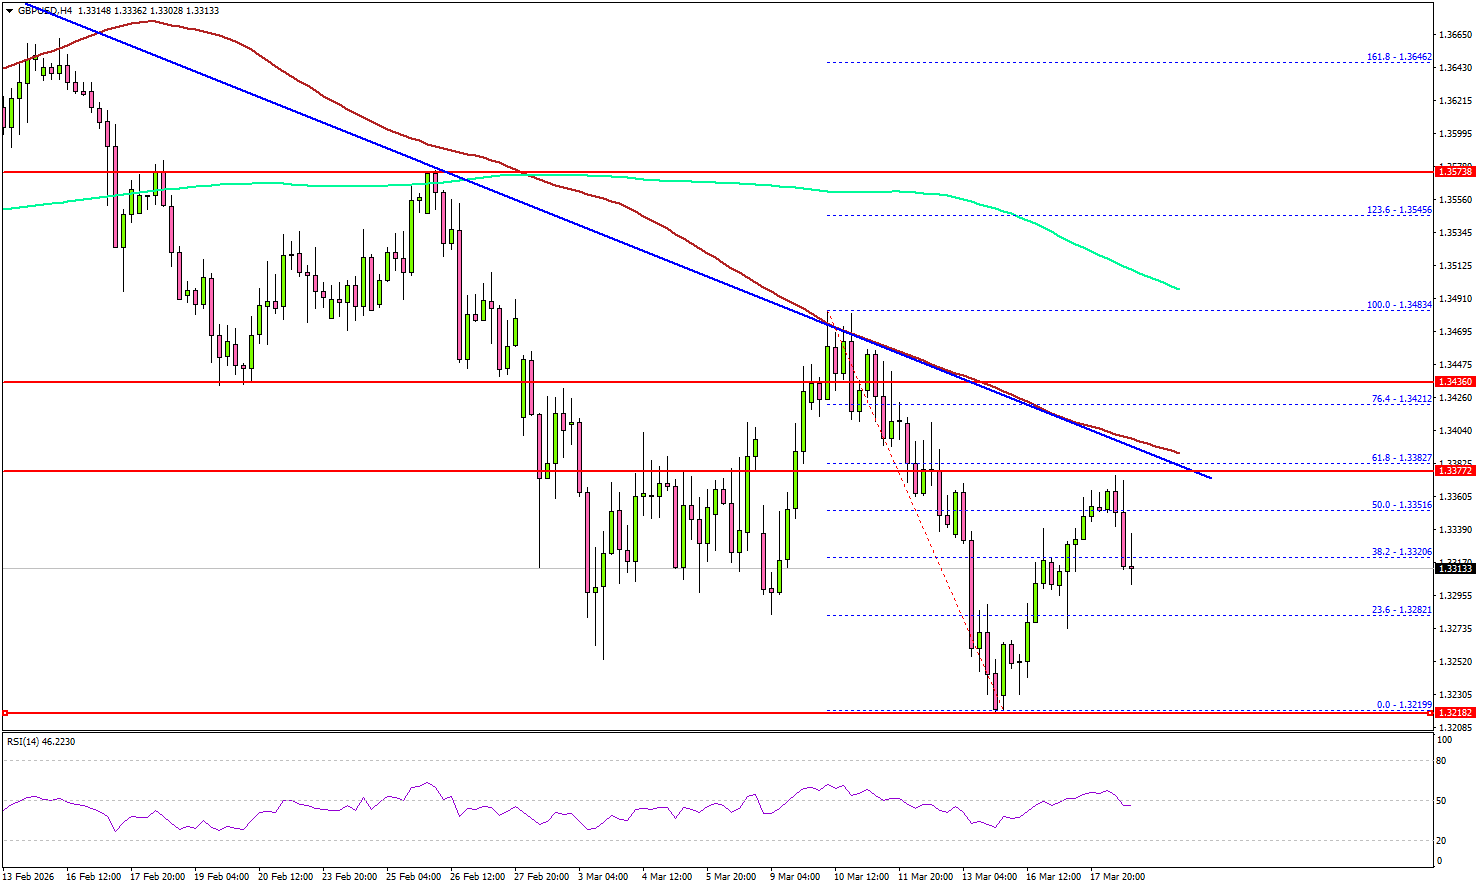
The pair traded as low as 1.3219 and is currently consolidating losses. On the upside, the pair is now facing sellers near 1.3380, the 61.8% Fib retracement level of the downward move from the 1.3483 swing high to the 1.3219 low, the 100 simple moving average (red, 4-hour), and the same trend line.
The first major resistance sits at 1.3420. A close above 1.3420 could open the doors for gains above 1.3450. In the stated case, the bulls could aim for a move to 1.3500. Any more gain might open the doors for a test of 1.3550.
If there is no upside break above the trend line, the pair might start a fresh decline. Immediate support is seen near 1.3280. The first key support sits at 1.3250. A close below 1.3250 might call for heavy losses. In the stated case, it could even revisit 1.3120 in the coming days.
Looking at Gold, the price failed to settle above $5,120, resulting in a strong bearish reaction below $5,020.
Upcoming Key Economic Events:
- UK Claimant Count Change for Feb 2026 – Forecast 25.8K, versus 28.6K previous.
- UK ILO Unemployment Rate for Jan 2026 (3M) – Forecast 5.3%, versus 5.2% previous.
- BoE Interest Rate Decision - Forecast 3.75%, versus 3.75% previous.
- US Initial Jobless Claims - Forecast 215K, versus 213K previous.
First Impressions: NZ GDP, December Quarter 2025
New Zealand’s GDP rose by 0.2% in the December quarter. While less than forecast, the figures support the story that the economy was regaining some momentum before the latest oil shock hit.
Key results
- Quarterly change: +0.2% (last: +0.9%, revised from +1.1%)
- Westpac f/c: +0.4%, market f/c: +0.5%, RBNZ: +0.5%
- Annual change: +1.3% (last: +1.1%, revised from +1.3%)
New Zealand’s GDP rose by just 0.2% in the last quarter of 2025, less than our forecast of a 0.4% increase and the median market forecast of 0.5%. Historical revisions were to the downside overall, with the September quarter revised down from +1.1% to +0.9%, against a smaller upward revision to the June quarter from -1.0% to -0.9%.
Given the ongoing volatility in the quarterly GDP figures, we recommend focusing on the annual growth rate. This came in at +1.3%, lower than our forecast of +1.6%, reflecting both the lower-than-expected December quarter and the revisions to recent history.
We don’t read too much into the December quarter ‘miss’, as it was entirely due to our old nemesis – the non-additivity between total GDP and the individual sectors. This difference was a large negative this time (and larger than in previous December quarters), for reasons that we’ll have to unpick later. The results by sector were largely in line with our forecasts, with the usual range of overs and unders.
Nevertheless, these results are on balance a downside surprise to our view, and to the RBNZ’s forecasts. Today’s figures may ultimately prove to be of little more than historical interest, given the pall cast over the global economy in recent weeks by the Iran conflict. But from the RBNZ’s point of view, they will note that while the New Zealand economy was regathering some momentum coming into this latest shock, it was still barely at a pace that would have halted the rise in unemployment or added to domestic inflation pressures.
Details
The results by sector were generally in line with what we detailed in our preview. The strongest gains were seen in the primary industries, and those linked to the ongoing recovery in tourism. The more domestically focused industries, such as construction and business services, were more subdued.
The expenditure measure of GDP was also soft, up just 0.1% for the quarter. Household consumption fell by 0.1%, though this likely reflects the ongoing issues with distinguishing between spending by households and by overseas tourists, the latter of which showed up in the 7.7% rise in services exports instead. Central government spending jumped by 2.5%, while business investment and goods exports fell. The latter two cases largely reflect timing issues, having both come off large gains in the September quarter. These were partly offset by an accumulation of inventories in the December quarter.
The FOMC’s Steady Hand
Productivity is set to benefit US GDP growth and inflation over the forecast period. Inflation expectations are not a concern for the FOMC, in stark contrast to the RBA.
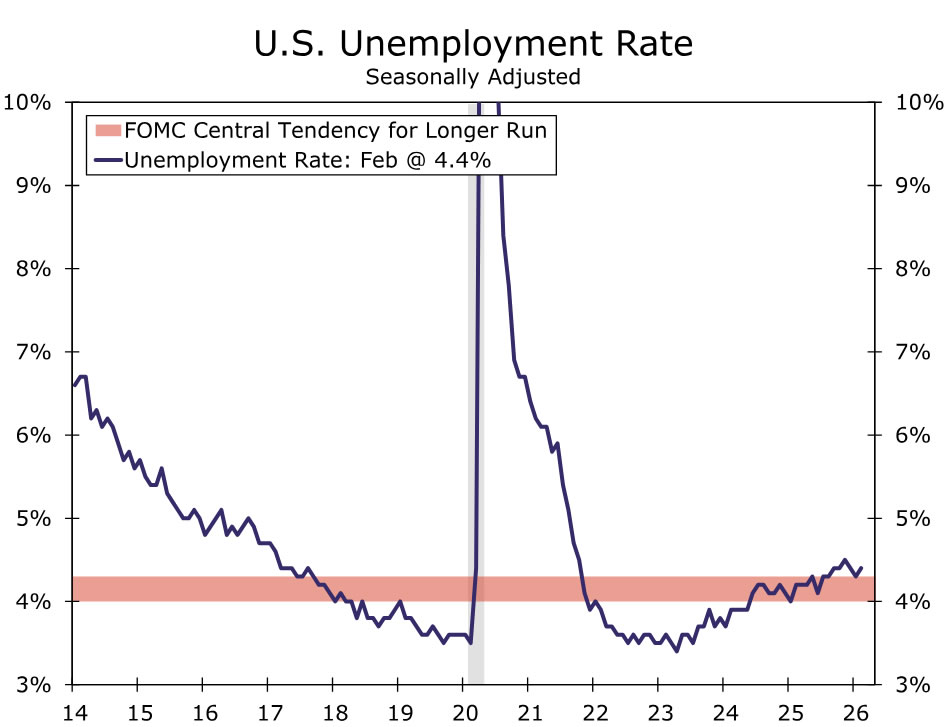
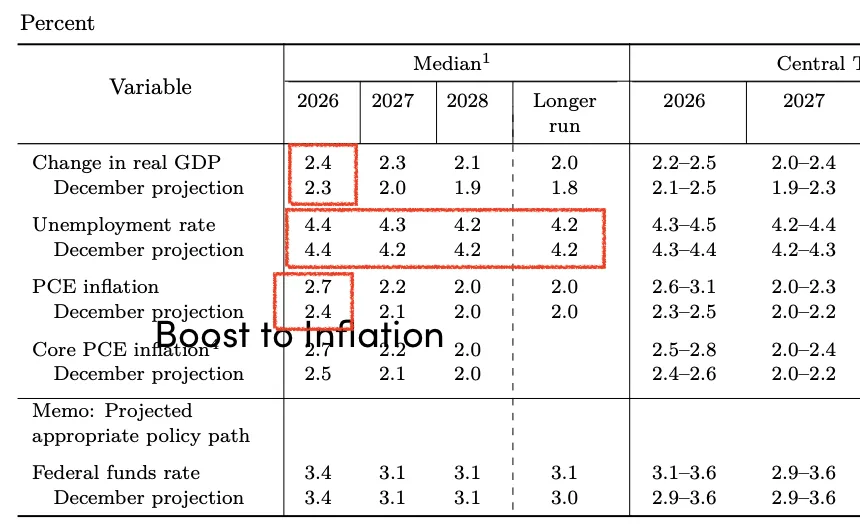
The US FOMC marked time at its March meeting, recognising increased global uncertainty since January, but also a need to remain focused on the domestic economy when determining the appropriate path for policy. GDP growth is now expected to be 2.4% in 2026 (prev. 2.3%) and, more significantly, 2.3% in 2027 (prev. 2.0%), then 2.1% in 2028 (prev. 1.9%) and 2.0% in the longer run (prev. 1.8%). This is despite a largely unchanged view for the labour market, the unemployment rate seen edging down from 4.4% at end-2026 to 4.2% by end-2028, where it is expected to remain in the longer run. Noted in the press conference is that labour supply is constrained and will likely remain so over the forecast period, keeping job gains low. The stronger path for GDP growth is therefore primarily a function of productivity gains as well as a greater willingness amongst consumers to spend out of current income and wealth.
The consequences for inflation of tariffs and the Middle East conflict are seen as temporary, annual inflation revised up 0.3ppts to 2.7% for 2026 but only edged higher to 2.2% for 2027 and unchanged at 2.0% in 2028. Capacity constraints evident in the US economy (housing and energy are prime examples) continue to get little airplay in the FOMC’s communications, so too the potential for second-round effects from energy and other commodities impacted by the conflict in the Middle East (fertiliser being an example). Inflation expectations are clearly not a concern for the FOMC, in stark contrast to the RBA’s view for Australia.
The Committee's base case for the stance of policy therefore remains one cut in 2026 and another in 2027 to 3.1%, which is now the Committee's best estimate of the US’ longer run neutral rate. The implication here, confirmed in the press conference, is that the Committee sees a need to maintain a moderately restrictive stance over the next year, as inflation risks recede, and then an ability to return to a neutral stance for the out years.
Risks to the above views are evolving, however. While most Committee members still expect the next rate decision to be a cut, the lower bound for the 2026 central tendency and full forecast range for the fed funds rate was edged up at this meeting. The upper bound for the 2026 and 2027 central tendency range for inflation was also increased, highlighting a greater degree of uncertainty over the persistence of price pressures in the short term.
Westpac continues to believe that the FOMC are likely to cut once more, at most, in this cycle. The lack of private sector job creation spoken about in the press conference points to the timing of this cut being sooner than later. We have this decision pencilled in for June, albeit with low conviction. The more critical point here though is that, with economic and fiscal capacity constrained as well as potential upside risks from tariffs and commodities, term US yields are likely to rise from here. Such an outturn puts the onus for growth on household consumption as housing investment remains weak and business investment concentrated in niche applications such as AI infrastructure and efficiency measures across industry.
March FOMC: In the Right Place for Now
Optionality maintained. As expected, the FOMC left the fed funds rate unchanged at 3.50%-3.75% at its March meeting and was careful not to hint at the timing of future adjustments. The statement reaffirmed the FOMC's view of "solid" growth and inflation that "remains somewhat elevated," but signaled a little less confidence in the state of the labor market by noting that the unemployment rate "has been little changed" versus previously saying it has shown "some signs of stabilization."
Increased uncertainty was acknowledged head on in the statement and press conference. There is no doubt in our minds that the spike in oil prices is inflationary over the near term, but this is a supply shock, which monetary policy is ill-equipped to solve. The Fed also has to grapple with the growth-sapping effects of higher oil prices that add a fresh challenge to the already-struggling labor market (Figure 1).
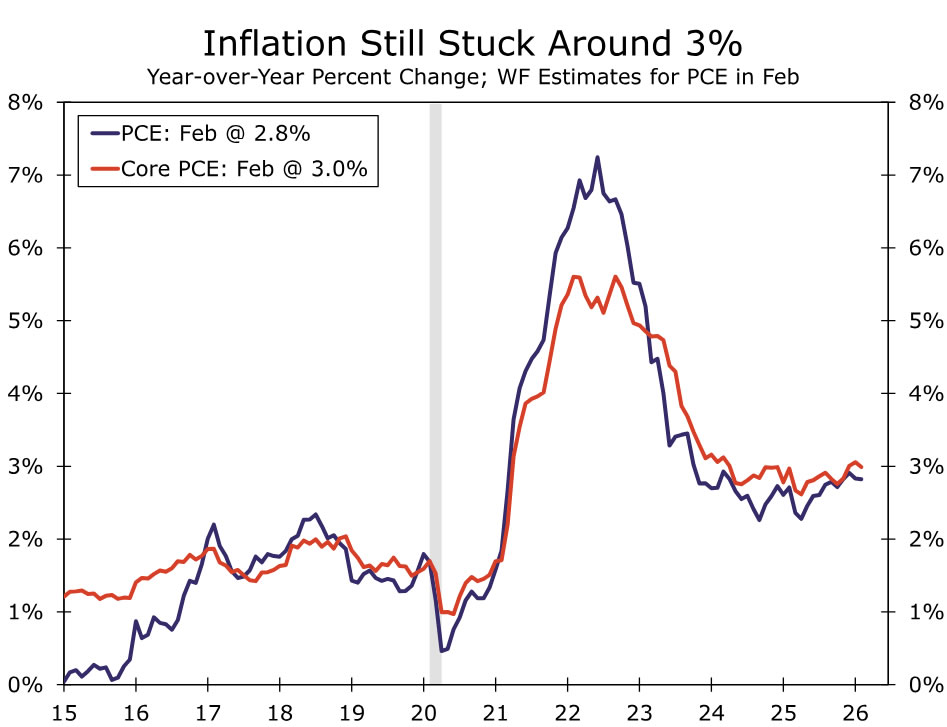
Participants seemed hesitant to incorporate looming stagflation risks into the SEP. The median estimate for PCE inflation at year-end rose to 2.7% from 2.4% in December, less than what we were expecting with our own estimate tracking at 2.9%. The median core projection rose to 2.7%, perhaps reflecting some pass-through of higher energy costs, but more likely, in our view, stemming from the stubborn strength of recent readings that has left the index up 3.1% over the past year (Figure 2). Meantime, the median estimate for GDP this year was revised up a tenth and the median unemployment rate was unchanged. While this did not signal as much of a stagflationary shock as we expected, we note that participants flagged higher uncertainty around their estimates with risks skewed more toward higher inflation and unemployment than in the December SEP.
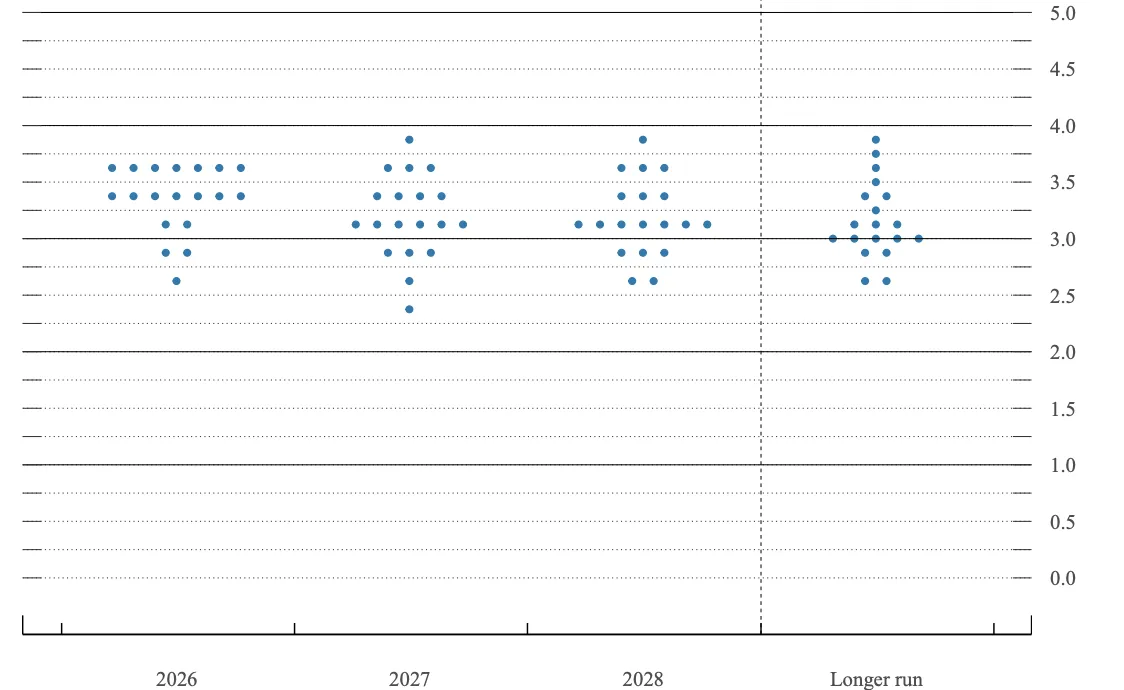
Wait-and-see mode kept the median view of rates this year unchanged. The median estimate of the fed funds rate at year-end remained at 3.375%, implying one 25 bps cut in 2026, while the median dot for 2027 held at 3.125% (Figure 3). The continued bias toward easing reflects that most Fed officials still view policy as slightly restrictive, even as the median long-run estimate drifted up a tenth to 3.1%.
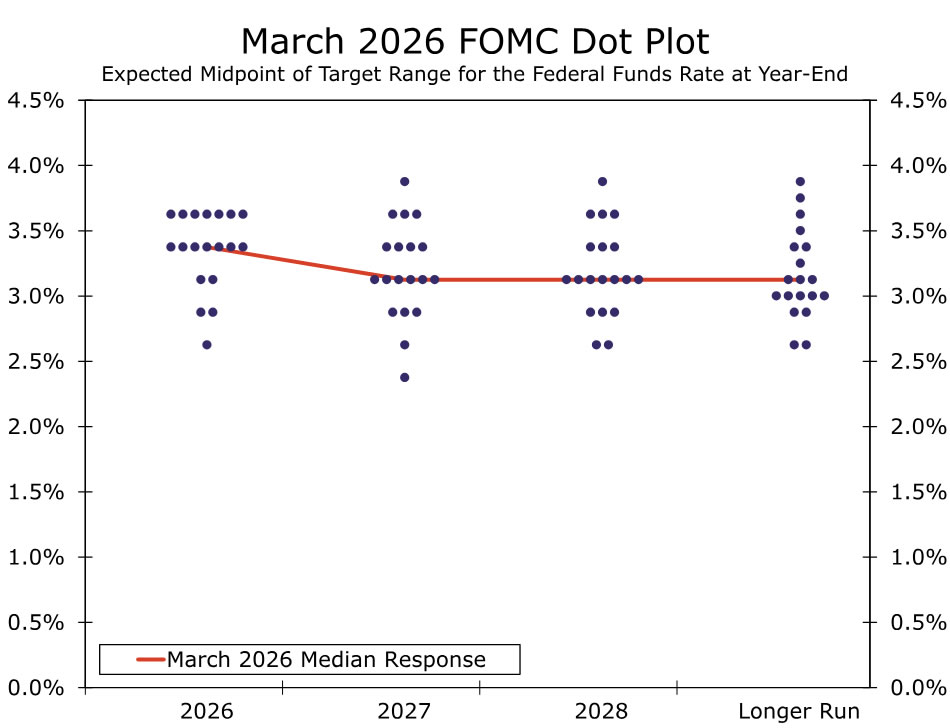
The Committee looks a little less divided. No participants viewed a hike as appropriate this year, even as hawkish members have been voicing their concerns about inflation's prolonged overshoot from target these past five years. At the same time, Governor Waller voted in line with the Committee, making Governor Miran the lone dissenter. Yet even the lowest projection for the fed funds rate at year-end—presumably Governor Miran's—shifted up, and suggests less dispersion among members' view at present.
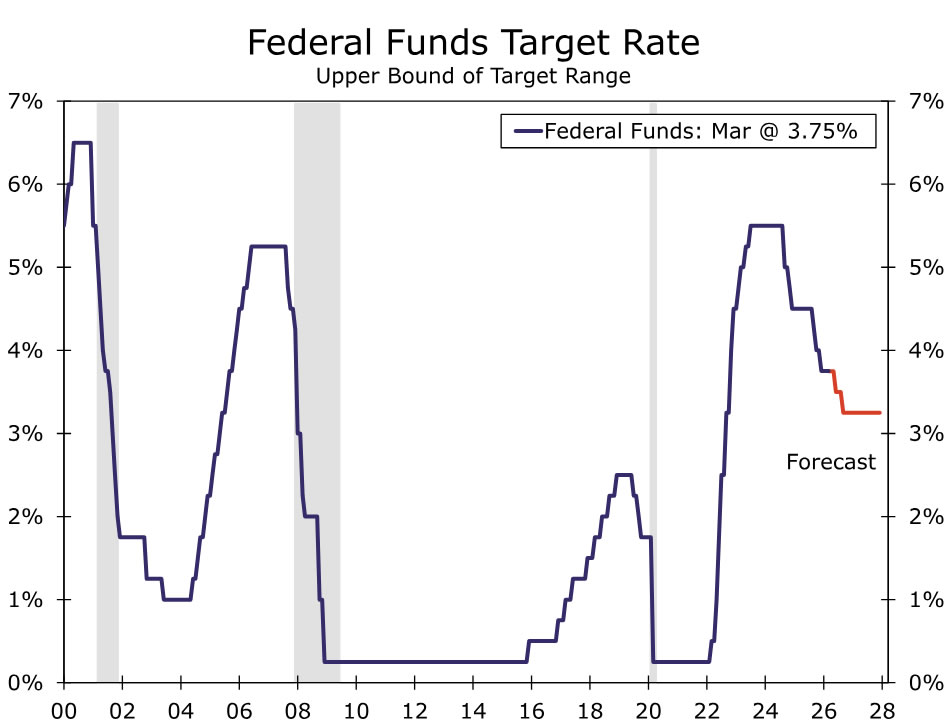
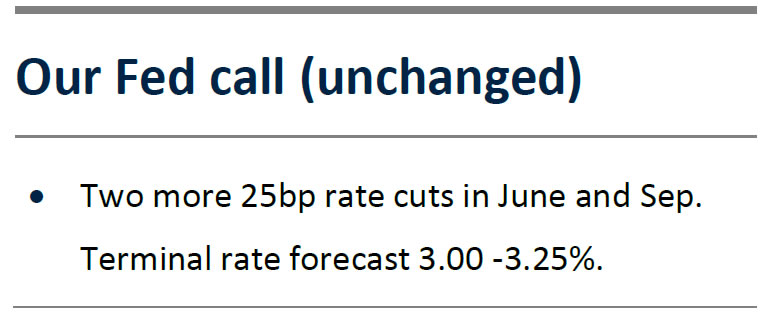
Two more cuts this year remain our base case. We sympathize with the view that the labor market remains on a shaky footing. While the renewed inflation concerns generate risk to our call for the FOMC to cut again by June, we still look for two 25 bps cuts this year and acknowledge they just might end up coming a little later (Figure 4). The inflationary effects of higher oil prices become visible more quickly than does the damage they inflict on growth and the labor market. So long as long-term inflation expectations stay anchored, we believe the Fed could still move the fed funds rate further toward neutral in the second half of the year.
Reserve management purchases (RMPs) continue at their current $40B monthly pace. The Fed did not announce plans to reduce RMPs as we were expecting. Yet given the recent reduction in funding pressures, we suspect a slowdown to around a $20-25B monthly pace has merely been delayed and is likely to be announced at the Fed's April meeting and begin mid-May.
Fed Review: Staying Humble
- The Fed maintained its monetary policy unchanged in March, as widely expected by both consensus and markets.
- Powell refrained from strong forward guidance but appeared more concerned about inflation than downside risks to growth. Median 'dots' remained unchanged, but the distribution shifted towards later cuts.
- 2y UST yields shifted some 7bp higher, and EUR/USD declined back below 1.15. We still like our call for two more rate cuts from the Fed, but the timing remains highly sensitive to the length of the energy supply disruption.
The FOMC's March statement was rather blunt about how the war in Iran is affecting monetary policy decisions for now, as the only new addition was: "The implications of developments in the Middle East for the U.S. economy are uncertain." Powell joked about the policymakers having even considered skipping publishing the summary of economic projections given how sensitive the outlook remains to the assumptions made about the war in Iran.
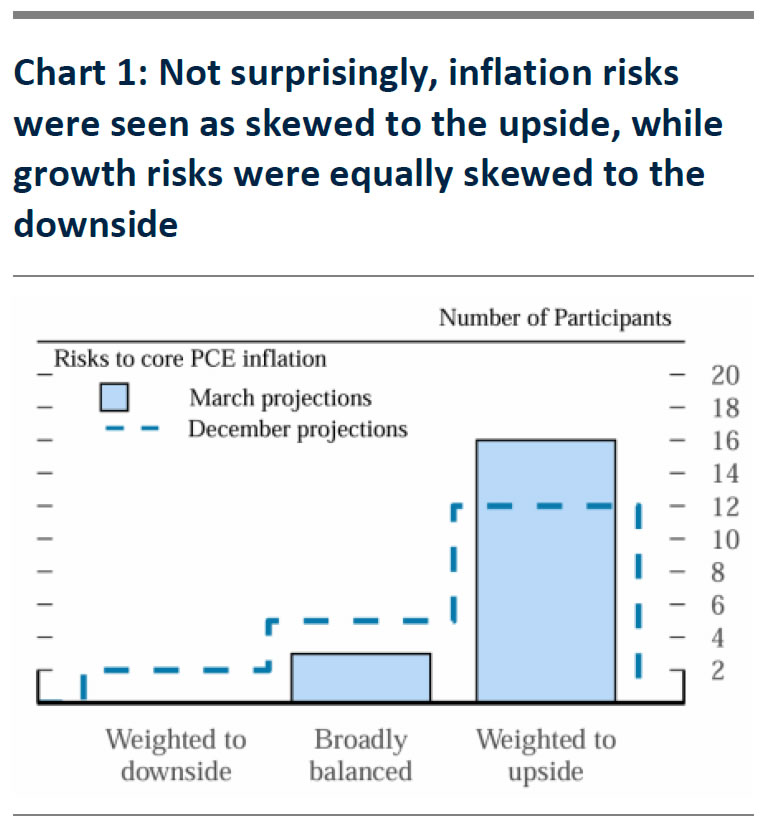
The GDP growth forecast was revised up (2.3% for 2027; Dec 2.0%) as was the median core PCE forecast (2.2% for 2027; Dec. 2.1%). Under 'normal' circumstances, we would have seen such revisions as hawkish signals, but markets paid little attention for now. Not surprisingly, the risk assessment showed GDP growth risks tilting back to the downside and inflation risks equally to the upside.
Powell did not appear particularly hawkish, but he also avoided some of the dovish arguments he could have presented. In our preview, we speculated that the negative growth impact from already tighter financial conditions could be an argument in favour of continuing rate cuts, but this was not even brought up.
UST yields shifted modestly higher and broad USD gained during the press conference. Powell underscored that a 'meaningful' number of participants had shifted their rate expectations in favour of later cuts, even if the median projection still foresees two more 25bp reductions. He also emphasized the importance of tariff-driven inflation slowing over the course of this year. On that topic, note that the February PPI released earlier today showed core goods prices rising at the fastest monthly pace since April 2022 - certainly a concerning signal in this light.
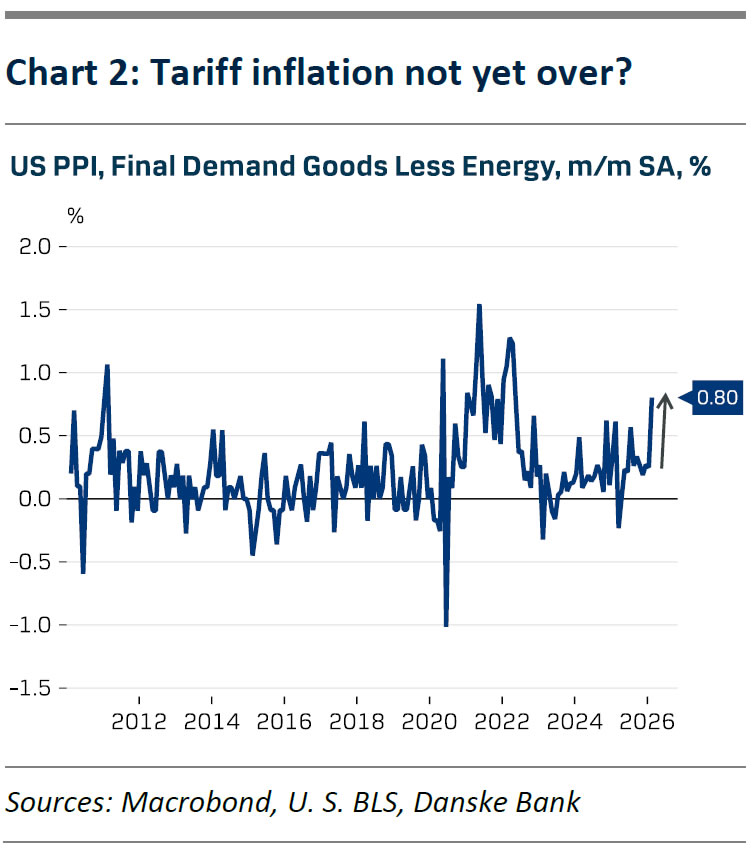
Even so, we still like our call of two more rate cuts. Markets price in only 17bp worth of cuts over the next year. Our pre-war baseline forecast has been for cuts in June and September, though the timing is not a high conviction call, and we will evaluate it as we gain more clarity on the scale and length of the energy supply disruption.
Note that there was no discussion about the Fed's balance sheet operations. We expect to see some guidance on the slowing of T-bill reserve management purchases in the meeting minutes. The base case is that the net purchase volumes will decrease substantially after the mid-April tax date.
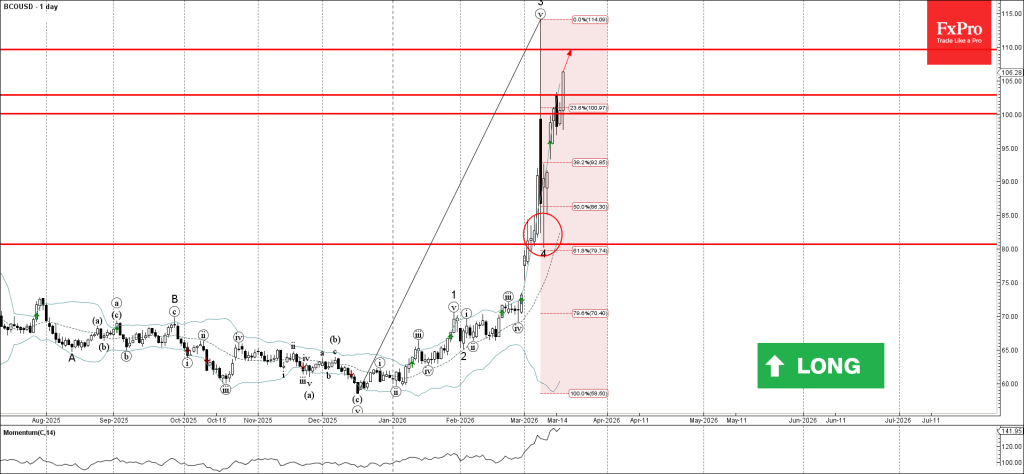
Brent Crude Oil Wave Analysis
Brent Crude Oil: ⬆️ Buy
- Brent Crude Oil broke resistance level 102.90
- Likely to rise to resistance level 110.00
Brent Crude Oil today broke above the between the resistance level 102.90, which reversed the price earlier this month.
The breakout of the resistance level 102.90 continues the active minor impulse wave 5, which belongs to the sharp impulse wave C from last December.
Given the strong daily uptrend, Brent Crude Oil can be expected to rise to the next resistance level 110.00 – the breakout of which can lead to further gains toward 115.00.
Bitcoin Wave Analysis
Bitcoin: ⬇️ Sell
- Bitcoin reversed from resistance area
- Likely to fall to support level 67070.00
Bitcoin cryptocurrency recently reversed from the resistance area between the resistance level 75000
00 (which stopped wave ii at the start of March), upper daily Bollinger Band and the 38.2% Fibonacci correction of the sharp downward impulse 1 from January.
The downward reversal from this resistance zone will form the daily Japanese candlesticks reversal pattern Evening Star – if the price closes today near the current levels.
Bitcoin cryptocurrency can be expected to fall to the next support level 67070.00 (which stopped the previous correction b).
Eco Data 3/19/26
| GMT | Ccy | Events | Act | Cons | Prev | Rev |
|---|---|---|---|---|---|---|
| 21:45 | NZD | GDP Q/Q Q4 | 0.20% | 0.40% | 1.10% | 0.90% |
| 23:50 | JPY | Machinery Orders M/M Jan | -5.50% | -9.50% | 19.10% | |
| 00:30 | AUD | Employment Change Feb | 48.9K | 20.0K | 17.8K | 26.1K |
| 00:30 | AUD | Unemployment Rate Feb | 4.30% | 4.10% | 4.10% | |
| 02:46 | JPY | BoJ Interest Rate Decision | 0.75% | 0.75% | 0.75% | |
| 04:30 | JPY | Industrial Production M/M Jan | 4.30% | 2.20% | 2.20% | |
| 07:00 | GBP | Claimant Count Change Feb | 24.7K | 25.8K | 28.6K | |
| 07:00 | GBP | ILO Unemployment Rate (3M) Jan | 5.20% | 5.20% | 5.20% | |
| 07:00 | GBP | Average Earnings Excluding Bonus 3M/Y Jan | 3.80% | 4.00% | 4.20% | 4.10% |
| 07:00 | GBP | Average Earnings Including Bonus 3M/Y Jan | 3.90% | 3.90% | 4.20% | |
| 08:30 | CHF | SNB Interest Rate Decision | 0.00% | 0.00% | 0.00% | |
| 09:00 | CHF | SNB Press Conference | ||||
| 12:00 | GBP | BoE Interest Rate Decision | 3.75% | 3.75% | 3.75% | |
| 12:00 | GBP | MPC Official Bank Rate Votes | 0--0--9 | 0--3--6 | 0--4--5 | |
| 12:30 | USD | Initial Jobless Claims (Mar 13) | 205K | 215K | 213K | |
| 12:30 | USD | Philadelphia Fed Manufacturing Survey Mar | 18.1 | 17.5 | 16.3 | |
| 13:15 | EUR | ECB Main Refinancing Rate | 2.15% | 2.15% | 2.15% | |
| 13:15 | EUR | ECB Deposit Rate | 2.00% | 2.00% | 2.00% | |
| 13:45 | EUR | ECB Press Conference | ||||
| 14:00 | USD | New Homeles Jan | 587K | 725K | 745K | |
| 14:00 | USD | Wholele Inventories Jan F | -0.50% | 0.20% | 0.20% | |
| 14:30 | USD | Natural Gas Storage (Mar 13) | 35B | 39B | -38B |
| 21:45 | NZD |
| GDP Q/Q Q4 | |
| Actual | 0.20% |
| Consensus | 0.40% |
| Previous | 1.10% |
| Revised | 0.90% |
| 23:50 | JPY |
| Machinery Orders M/M Jan | |
| Actual | -5.50% |
| Consensus | -9.50% |
| Previous | 19.10% |
| 00:30 | AUD |
| Employment Change Feb | |
| Actual | 48.9K |
| Consensus | 20.0K |
| Previous | 17.8K |
| Revised | 26.1K |
| 00:30 | AUD |
| Unemployment Rate Feb | |
| Actual | 4.30% |
| Consensus | 4.10% |
| Previous | 4.10% |
| 02:46 | JPY |
| BoJ Interest Rate Decision | |
| Actual | 0.75% |
| Consensus | 0.75% |
| Previous | 0.75% |
| 04:30 | JPY |
| Industrial Production M/M Jan | |
| Actual | 4.30% |
| Consensus | 2.20% |
| Previous | 2.20% |
| 07:00 | GBP |
| Claimant Count Change Feb | |
| Actual | 24.7K |
| Consensus | 25.8K |
| Previous | 28.6K |
| 07:00 | GBP |
| ILO Unemployment Rate (3M) Jan | |
| Actual | 5.20% |
| Consensus | 5.20% |
| Previous | 5.20% |
| 07:00 | GBP |
| Average Earnings Excluding Bonus 3M/Y Jan | |
| Actual | 3.80% |
| Consensus | 4.00% |
| Previous | 4.20% |
| Revised | 4.10% |
| 07:00 | GBP |
| Average Earnings Including Bonus 3M/Y Jan | |
| Actual | 3.90% |
| Consensus | 3.90% |
| Previous | 4.20% |
| 08:30 | CHF |
| SNB Interest Rate Decision | |
| Actual | 0.00% |
| Consensus | 0.00% |
| Previous | 0.00% |
| 09:00 | CHF |
| SNB Press Conference | |
| Actual | |
| Consensus | |
| Previous | |
| 12:00 | GBP |
| BoE Interest Rate Decision | |
| Actual | 3.75% |
| Consensus | 3.75% |
| Previous | 3.75% |
| 12:00 | GBP |
| MPC Official Bank Rate Votes | |
| Actual | 0--0--9 |
| Consensus | 0--3--6 |
| Previous | 0--4--5 |
| 12:30 | USD |
| Initial Jobless Claims (Mar 13) | |
| Actual | 205K |
| Consensus | 215K |
| Previous | 213K |
| 12:30 | USD |
| Philadelphia Fed Manufacturing Survey Mar | |
| Actual | 18.1 |
| Consensus | 17.5 |
| Previous | 16.3 |
| 13:15 | EUR |
| ECB Main Refinancing Rate | |
| Actual | 2.15% |
| Consensus | 2.15% |
| Previous | 2.15% |
| 13:15 | EUR |
| ECB Deposit Rate | |
| Actual | 2.00% |
| Consensus | 2.00% |
| Previous | 2.00% |
| 13:45 | EUR |
| ECB Press Conference | |
| Actual | |
| Consensus | |
| Previous | |
| 14:00 | USD |
| New Homeles Jan | |
| Actual | 587K |
| Consensus | 725K |
| Previous | 745K |
| 14:00 | USD |
| Wholele Inventories Jan F | |
| Actual | -0.50% |
| Consensus | 0.20% |
| Previous | 0.20% |
| 14:30 | USD |
| Natural Gas Storage (Mar 13) | |
| Actual | 35B |
| Consensus | 39B |
| Previous | -38B |
FOMC Pauses Rates Yet Again – Economic Projections and Market Reactions
The Fed is keeping rates unchanged at the 3.50% to 3.75% range – The stance was surprisingly not so hawkish!
The votes for the pause are at 11-1 – Only Miran dissented.
The rougher part for Markets is the fact that rates are not priced to move much throughout the year.
You can get access to the detailed report and Fed Statement right here.
The Statement made mentions to uncertainty regarding the situation in the Middle East, a solid US economy and low Job gains but stable Unemployment rate.
Regarding inflation, the Fed's stance wasn't so hawkish compared to what it could have been.
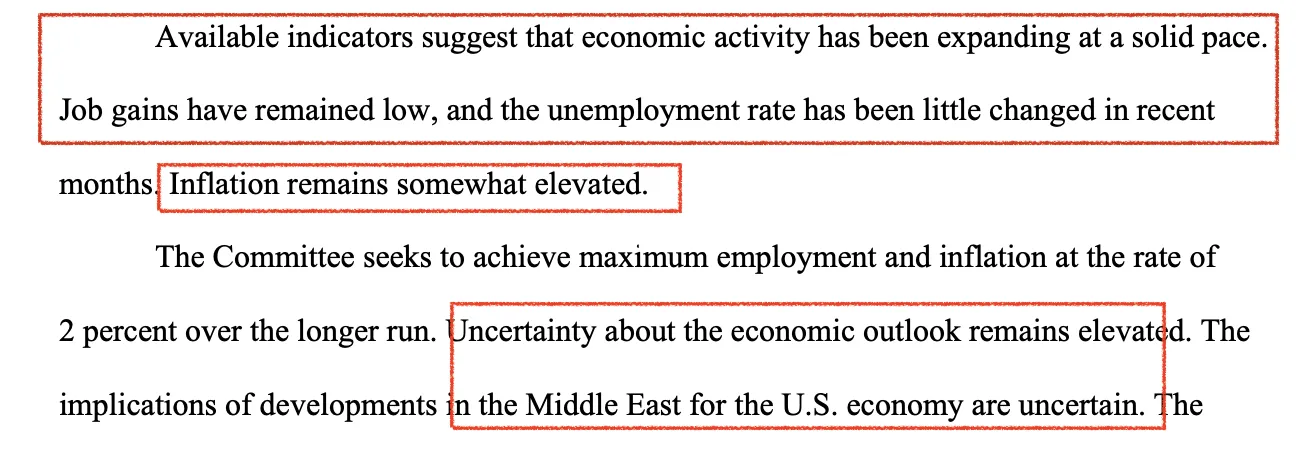
Notable quotes from the Statement – Source: Federal Reserve
Dot Plot
March Meeting Projections– Source: Federal Reserve
The Fed projected a slightly more elevated inflation in 2026, with the War affecting expectations.
For the rest, the FOMC is not expecting much change in the Unemployment Rate – This opens the way for dovish repricing in the event of large misses in NFP.
Get access to the full SEP report here.
March Meeting Dot Plot – Source: Federal Reserve
The Dot Plot has largely restrained around the 3.5% to 4% range for 2026, indicating that Rate cuts are really far gone.
Only material changes to Employment or economic performance will bring changes to such pricing.
Pre-Conference Asset Board – Courtesy of Finviz
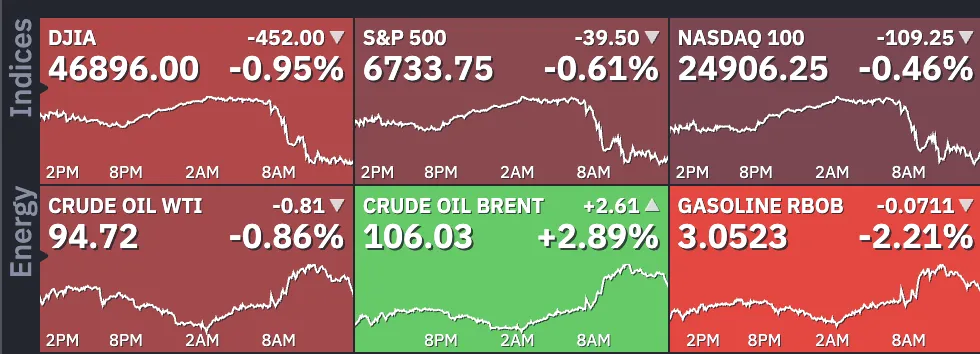
Except for WTI which corrected strongly, the Market is stuck in the waiting for Powell.
Powell is coming up in less than 15 Minutes – You can access his live speech right here.
Market Reactions
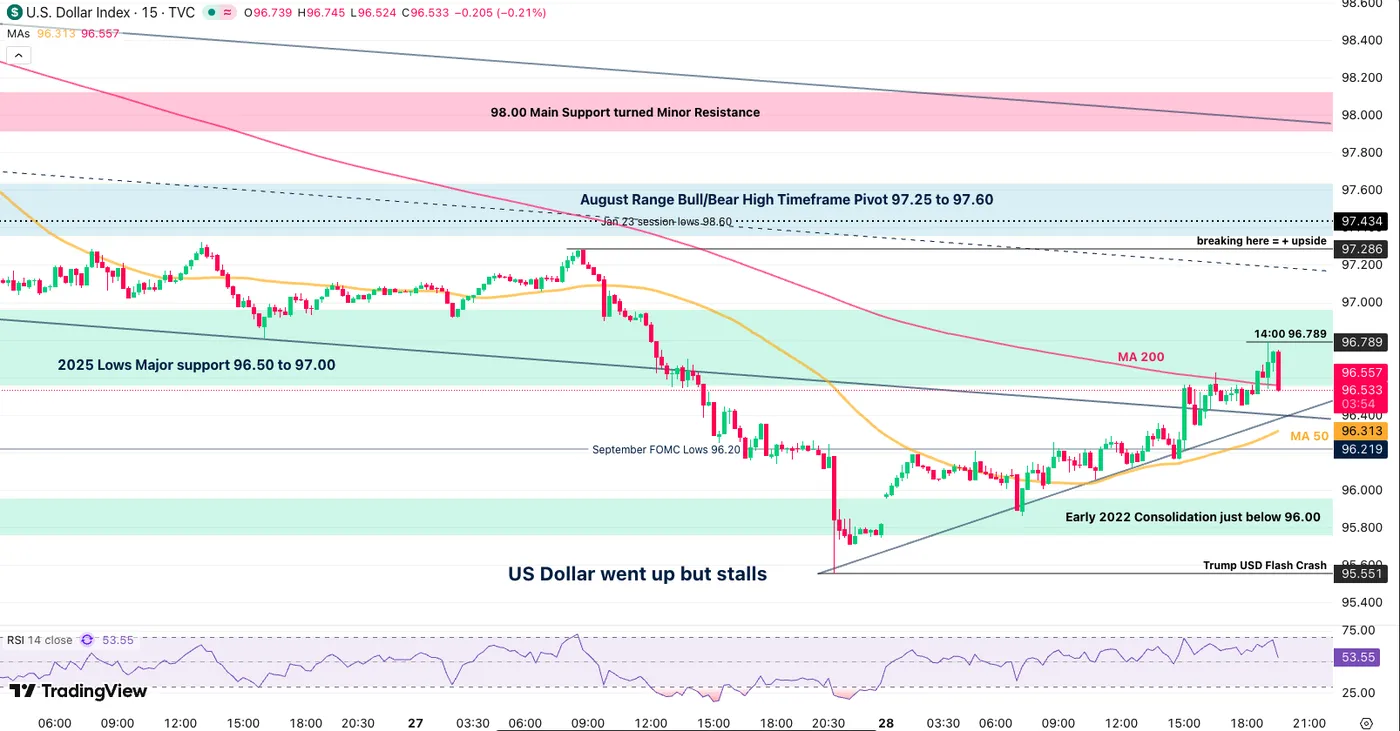
Dollar is higher but stalls its ascent
US Dollar (DXY) 15M Chart – Source: TradingView – January 28, 2026
US Stocks wicked higher but are staying flat
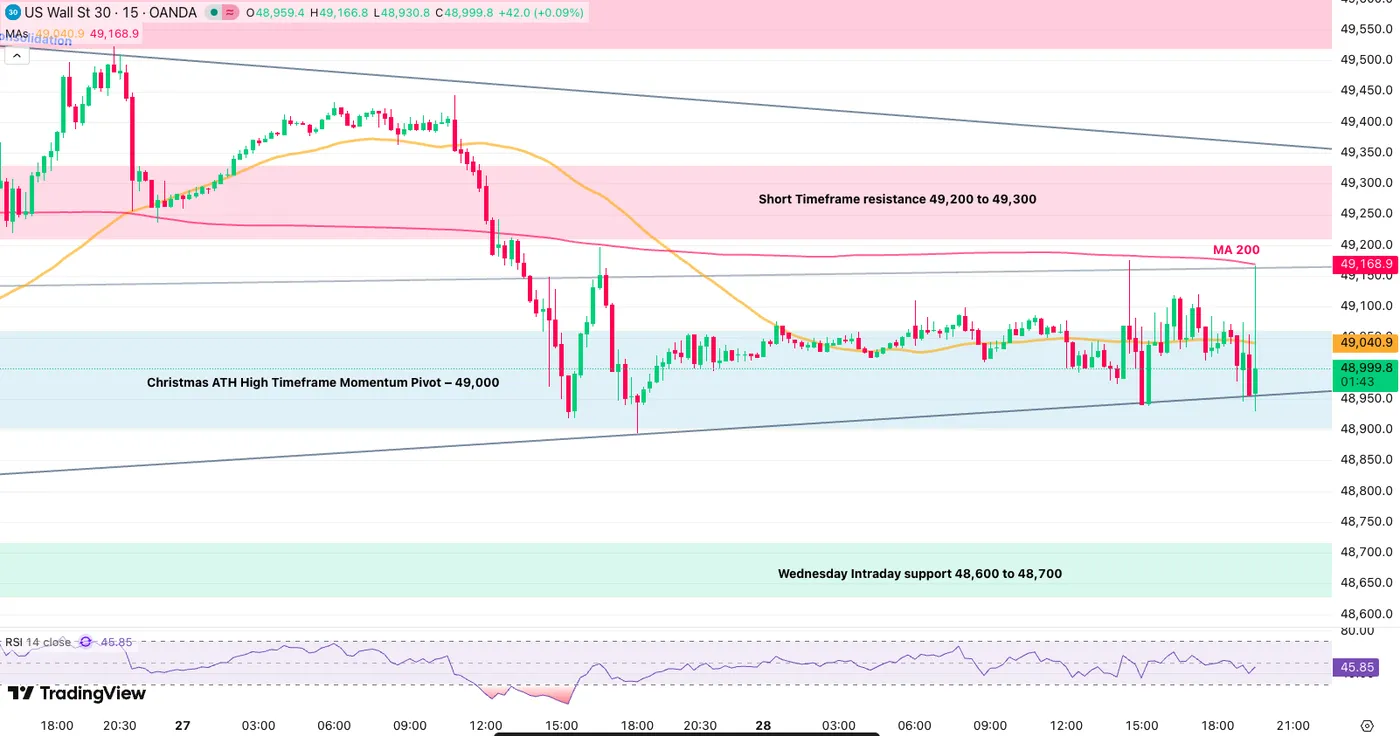
Dow Jones (CFD) 15m Chart – Source: TradingView
Gold is correcting from its record highs
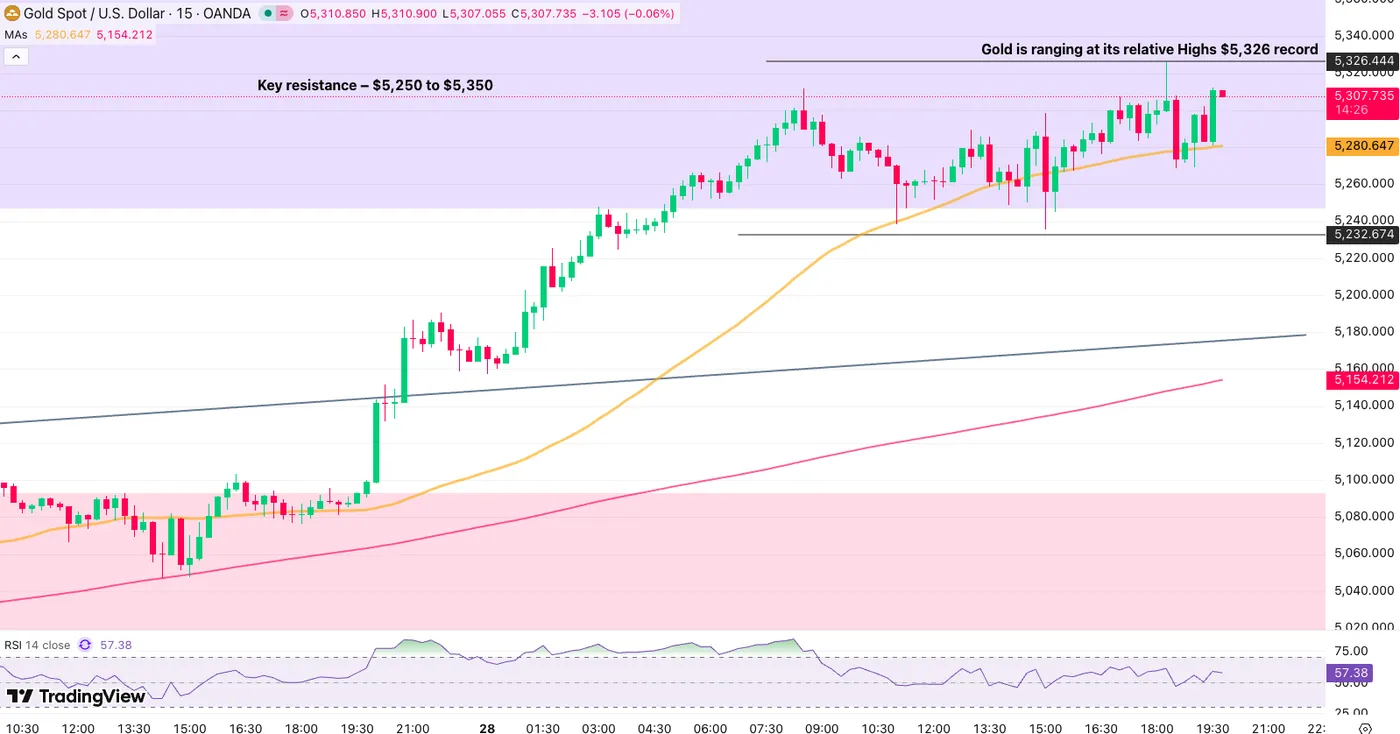
Gold (CFD) 15m Chart – Source: TradingView
Other metals are also staying flat/correcting slightly
Bitcoin and Cryptos are remaining flat
Keep a close eye on post-speech flows which can be quite sudden – This session's close in Stock Market will be of huge importance.
Safe Trades and Good luck for Powell!