Sample Category Title
Swiss economic outlook worsens as KOF economic barometer plunges
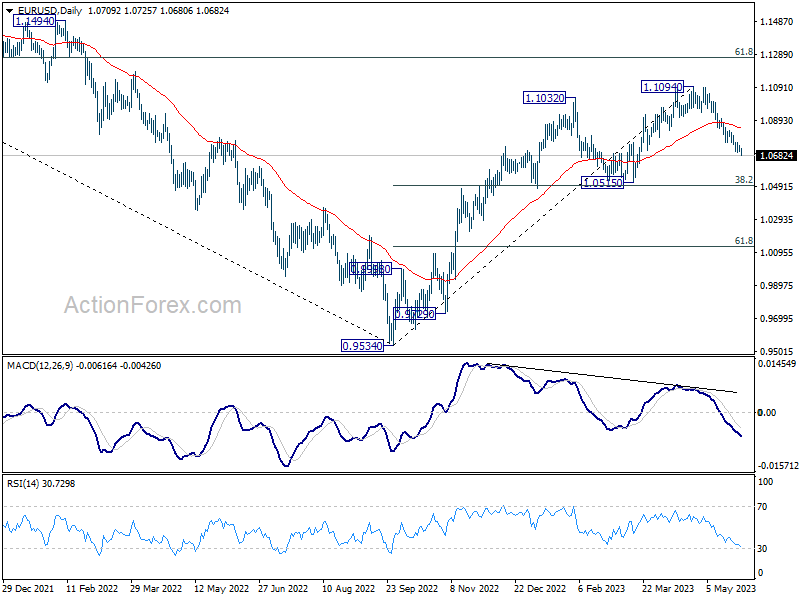
May has brought a significant dip in Swiss KOF Economic Barometer, which fell sharply from 96.1 to 90.2, a figure notably below the anticipated 95.3. This reading, barely above the cyclic trough of 89.3 recorded last November, indicates a continued deteriorating outlook for the Swiss economy for mid-2023.
In a statement, KOF noted, "This is the second time in a row that the barometer has fallen sharply. The outlook for the Swiss economy for the middle of 2023 is thus deteriorating further and remains at a below-average level."
The sharp decline of the barometer, an important indicator of Switzerland's economic health, is largely attributed to the manufacturing sector and financial and insurance services. Other economic sectors and foreign demand also contributed negative signals.
In contrast, "indicators covering private consumption are slightly positive," providing a slight glimmer of optimism amid a broadly dimming economic forecast.
Crypto Market Climbing Out of the Hole But Slowly
Market picture
The crypto market cap has fallen by 0.5% over the past 24 hours to $1.156 trillion, as it pulled back from the extremes at the start of trading on Monday. However, the market has remained positive for the past five days. Top altcoin prices ranged from a 1.7% decline (Tron) to a 4% gain (XRP) over the day.
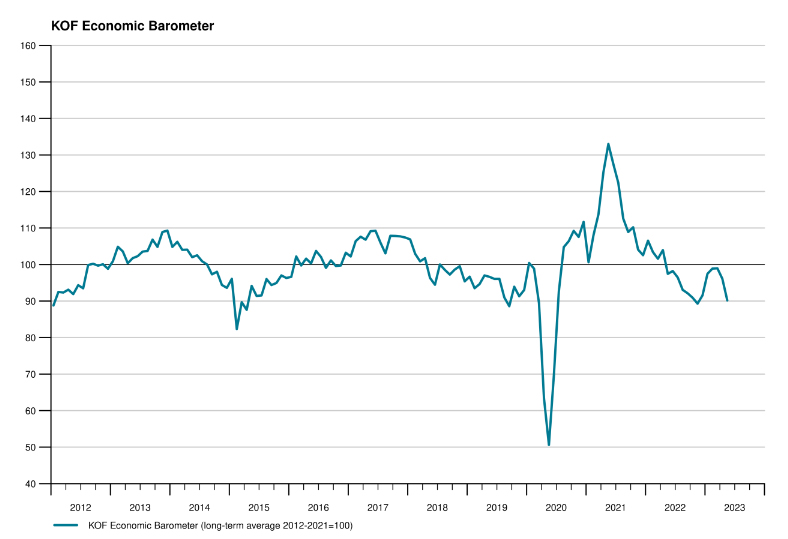
Bitcoin failed to break above its 50-day moving average after being under pressure for most of the day on Monday. After the correction to $27.5K, the first cryptocurrency began to attract local buyers. This is a local support area in March and April, and a move higher shows the strength of the buyers.
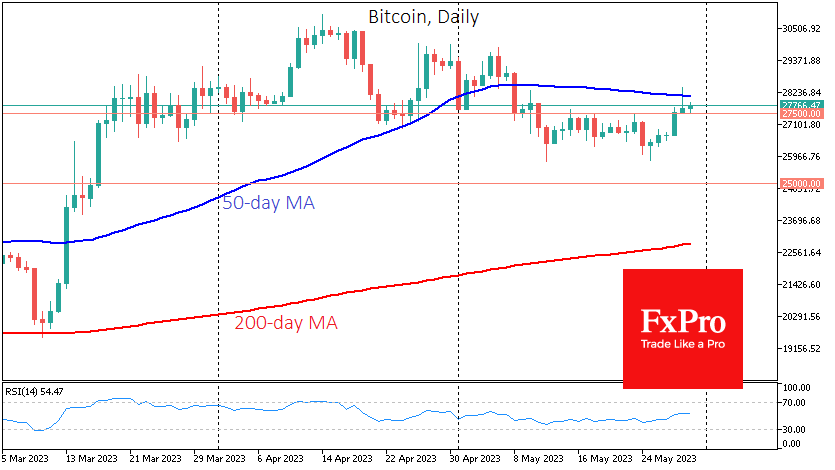
Ethereum broke through yesterday and is trying to hold the $1900 level today, also managing to stay above its 50-day average. Digital silver is coming out of the hole after a long consolidation, but only a consolidation above $2000 or even $2100 will allow further upside to be discussed.
News background
Former BitMEX CEO Arthur Hayes predicted a new Bitcoin rally by 2024 with a renewal of historic highs, which is unlikely to happen this year. He believes the 2024 halving will primarily drive BTC’s growth.
Asset management firm VanEck predicts that Ethereum will reach $11,850 by 2030, and with favourable development, ETH will be worth $51K. The forecast assumes Ethereum will become the dominant global network for large corporate payments.
The bill agreed in the US to raise the national debt ceiling has no mention of a 30% tax on mining. The initiative, proposed in early May, was positioned as a measure to minimise the impact of climate change.
The European Commission will prepare legislation for the digital euro in June 2023, ECB Governing Council member Fabio Panetta said. The document will only be given final approval by the ECB’s Governing Council in October, after which preparations will begin for the introduction and initial testing of the technology.
EUR/USD: Violation of Psychological 1.07 Support Signals Bearish Continuation
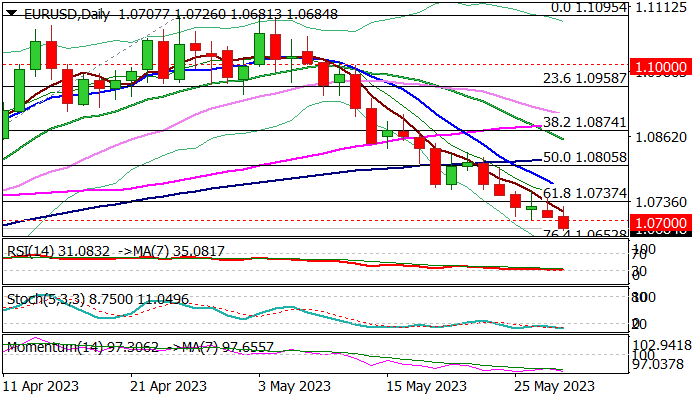
Probe through psychological 1.07 support in early Tuesday adds to negative signals as larger bears off 2023 high (1.1095) resume after hesitating at 1.07 level in past two days.
Daily studies remain in full bearish setup and maintain downside pressure for attack at 1.0652 (Fibo 76.4% of 1.0516/1.1095 rally) and 1.0600 zone in extension, though break of 1.0700 pivot needs to be confirmed by daily close below this level.
Oversold conditions on daily chart suggest that bears may enter consolidation in coming sessions, with upticks to be ideally capped at 1.0737/58 zone (broken Fibo 61.8% / falling 10DMA) and offer better levels to re-enter bearish market.
Overall bias is expected to remain with bears while the price remains below the base of thick daily cloud (1.0796).
Res: 1.0700; 1.0737; 1.0758; 1.0796.
Sup: 1.0652; 1.0631; 1.0600; 1.0551.
JPY Sees Limited Support
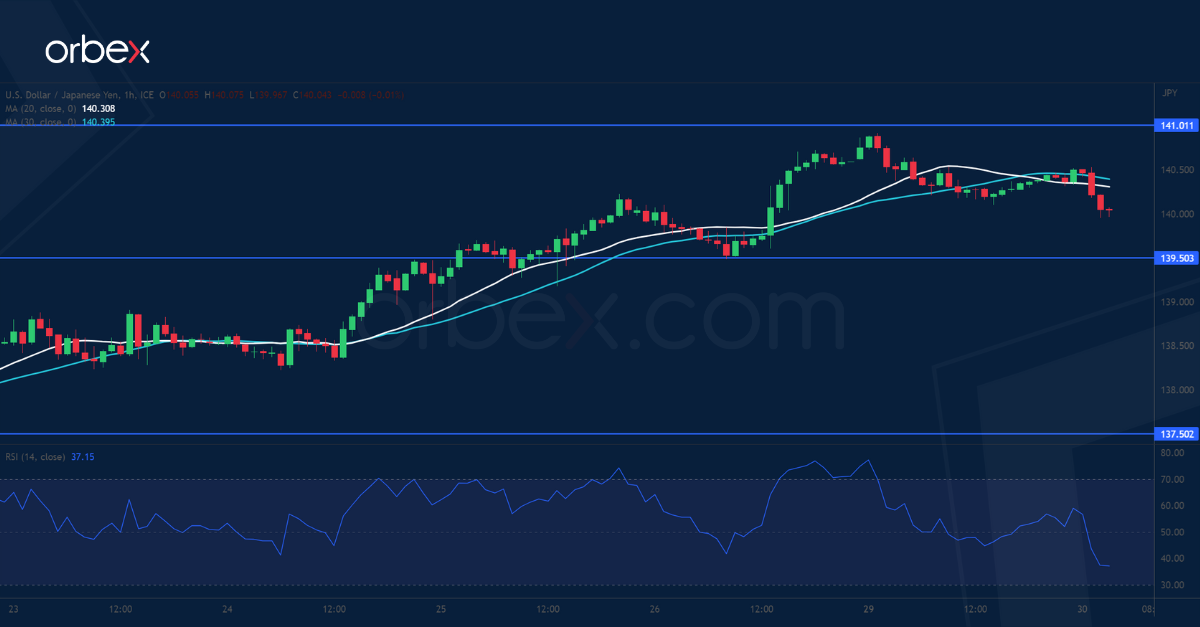
USD/JPY pulls back
The Japanese yen bounced after a lower-than-expected unemployment rate in April. An overbought RSI on both the daily and the hourly chart is a sign of overextension, which could briefly limit the upside. The round number of 141.00 is the immediate resistance and further up 142.20 from last November’s sell-off would carry more weight. 139.50 is the first support should the buy side start to take profit. 137.50 at the confluence of the 20-day SMA and the resistance-turned-support is an important floor.
EUR/GBP struggles for support
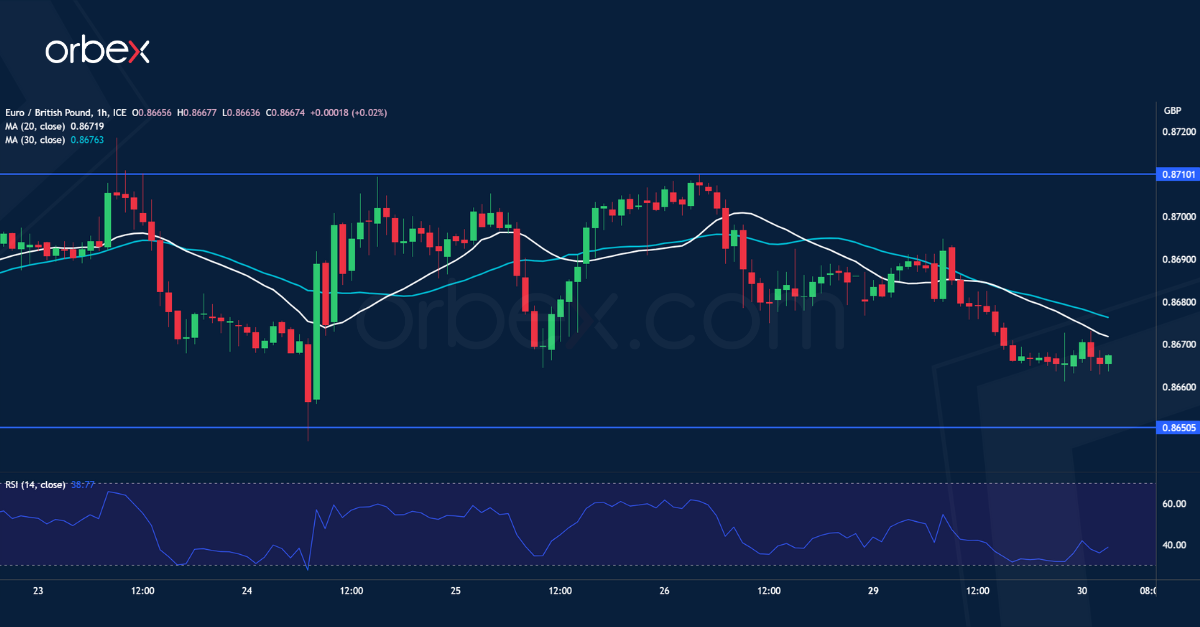
The euro slipped as Eurozone bond yields ticked lower ahead of inflation data. The pair has remained under pressure after a series of faded bounce in the supply zone 0.8710-0.8730. This suggests that the bears have been eager to sell into strength after the single currency sank below the daily support of 0.8730. Only a snap back above said area would break the downward momentum. Otherwise, a fall below 0.8650 would trigger a new round of sell-off and send the pair towards last December’s lows around 0.8570.
Dow Jones 30 attempts to rebound
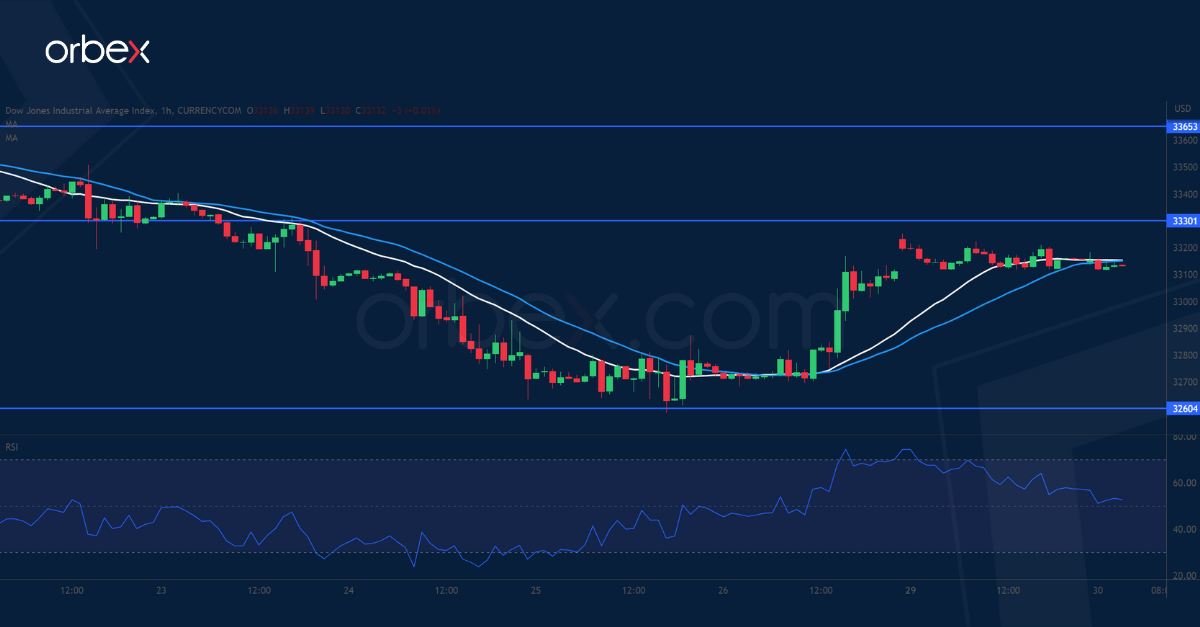
The Dow Jones rallies on news that the Biden administration has struck a deal to raise the debt ceiling. The index is still trying to preserve its rebound from two months ago after it gave back over half of the gains. 32600 is the latest support and a surge above the psychological level and the support-turned-resistance of 33000 has reduced the bearish pressure. 33300 along the 20-day SMA is a key hurdle ahead and its breach could pave the way for a sustained recovery above 33800. Failing that, the price might drop to 32000.
EUR/USD Technical: Bears May Be Getting Exhausted
EUR/USD Technical: Bears May Be Getting Exhausted
- The current minor downtrend phase for EUR/USD from its 3 May 2023 high of 1.1092 is showing signs of exhaustion.
- Elliot Wave/fractal analysis suggests a potential terminal support zone of 1.0670/1.0630 for the minor downtrend phase where a possible minor mean reversion rebound may occur next.
- The key intermediate resistances to watch will be at 1.0725 and 1.0850.
Fig 1: EUR/USD trend as of 30 May 2023 (Source: TradingView, click to enlarge chart)
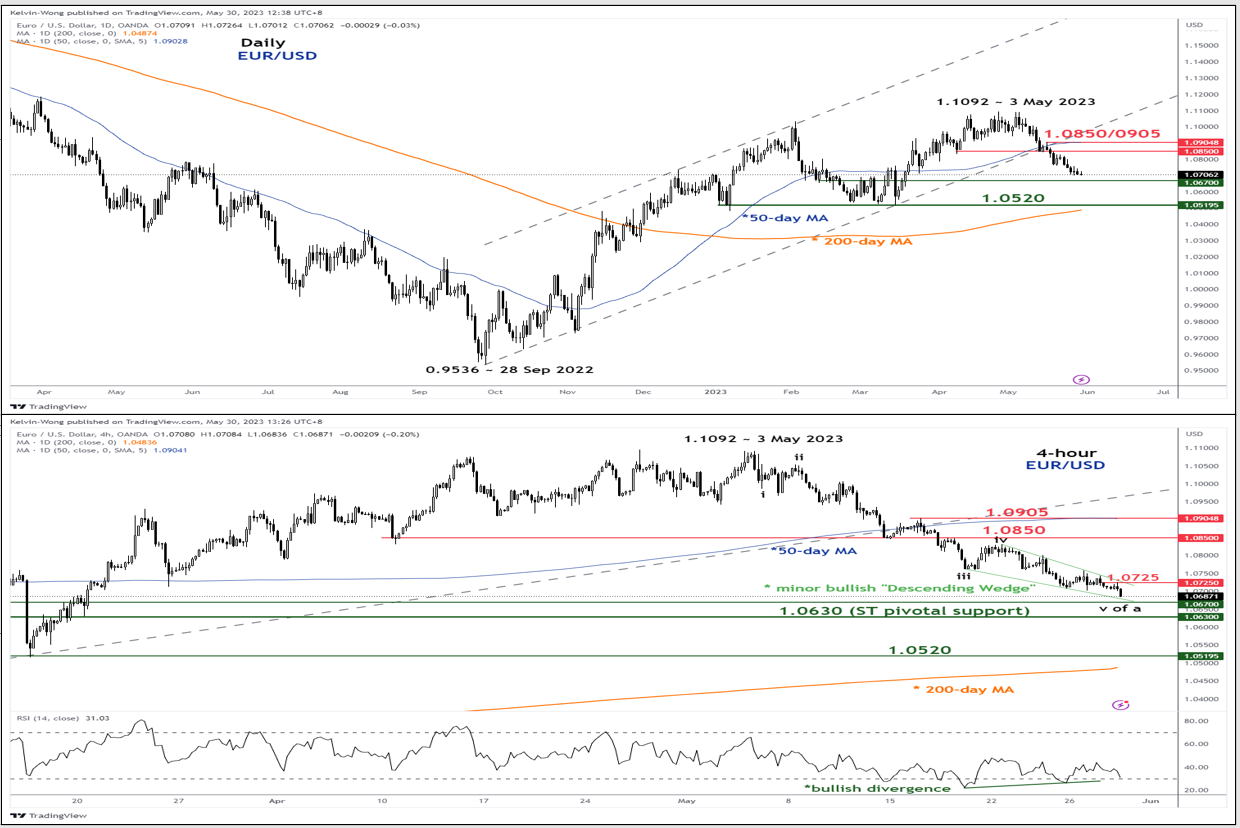
In the medium term (multi-week), the price actions of EUR/USD are evolving in a downtrend phase since the bearish down from form the multi-month ascending channel support from the 28 September 2022 low 0f 0.9536 on 18 May 2023 as depicted on the daily chart.
Elliot Wave/fractal analysis suggests the current minor downtrend may be approaching its tail-end
The ongoing 390 pips decline from its 1.1095 high of 26 April 2023 (also current 52-week high) to the current intraday low of 1.0701 on 30 May 2023 has traced out an Elliot Wave/fractal analysis’s five waves down move (labelled as i, ii, iii, iv & v on the 4-hour chart) with its potential terminal level at 1.0670/1.0630 (defined by a cluster of Fibonacci extension levels).
“Descending Wedge” and bullish divergence seen in 4-hour RSI may suggest bearish momentum exhaustion
In addition, the price actions of EUR/USD since its minor swing high of 1.0831 printed on 22 May 2023 have started to evolve into an impending minor bullish “Descending Wedge” configuration coupled with a bullish divergence signal being flashed out on the 4-hour RSI oscillator at its oversold region.
These observations suggest that the ongoing minor downtrend phase from the 3 May high of 1.1092 may have started to get exhausted for EUR/USD bears and in conjunction with the potential Elliot Wave count analysis highlighted earlier, the odds seem to be skewed towards a possible minor short-term corrective mean reversion rebound to retrace a certain portion of this current minor downtrend phase.
Key short-term pivotal support at 1.0630 to maintain this potential minor mean reversion rebound scenario with next intermediate resistances at 1.0725 (the upper boundary of the minor “Descending Wedge”) and 1.0850 (former minor swing lows of 10 April/15 May 2023).
On the other hand, a break below 1.0630 exposes the key medium-term support at 1.0520 (also the 200-day moving average.
Technical Graphs in US Yields Don’t Suggest a Turnaround
Markets
On Friday, strong US eco data (durable goods orders, spending and income data and, last but not least, PCE deflators) all supported the market repositioning that already dominated the price action earlier last week. Markets now acknowledge that with inflation holding stubbornly high (Core PCE 4.7% Y/Y) and no imminent signs of a US recession, the Fed will most likely be forced to raise its policy rate by 25 bps in June or July (fully discounted). The US 2y yield closed above the 4.50% mark (4.56%). In a further curve inversion, the 10-y closed marginally lower at 3.80%, still near the highest level since the financial turmoil in March. US markets yesterday were closed for Memorial day. However, during the weekend the White House and the US House Republicans reached a deal to lift/suspend the US debt limit till January 2025 in exchange for spending caps/cuts. The deal still has to obtain agreement from Congress and apparently there is still some lobbying to do, but both parties look convinced that they will find the necessary majority. The US debt deal didn’t bring any euphoria in the European markets that were open yesterday. In low volume trading, German yields lost between 6.2 bps (2-y) and 10.6 bps (30-y). For now, we consider this as a correction on last week’s protracted uptrend. European equities failed to build on the strong (tech-driven) momentum from end last week (Eurostoxx 50 close -0.4%). The dollar maintained recent gains (DXY close yesterday at 104.20). The correction in European/German yields kept the euro in the defensive (EUR/USD close 1.071).
This morning, Asian markets show a mixed picture, with Chinese indices mostly trading in red, but South Korea outperforming. The US 2-y yield (4.57%) is holding near recent highs. Yields at longer maturities are losing a few bps. The dollar remains well bid (DXY 104.4 area). EUR/USD is losing the 1.07 handle (1.069). The eco calendar today contains house price data and consumer confidence (Conference Board). A modest decline in in the headline confidence index (99.00 from 101.3) is expected. In Europe the EC confidence data will be released. Belgium and Spain will be the first EMU countries to release May inflation data. Later this week, we look out for the German/French and Italian CPI data tomorrow, with the first estimate of the EMU CPI to be released on Thursday. In the US, we keep an eye on the JOLTS job openings (Wednesday), the US manufacturing ISM and the ADP labour report on Thursday and the inevitable US payrolls report on Friday. Markets, just as is the case for central bankers, are in a data-dependent modus. However, at least the technical graphs in US yields don’t suggest a turnaround on last week’s rise unless data would bring really nasty surprises. The picture for German yields is a bit different, with both the 2-y and the 10-y yield near important resistance at 3.0% and 2.50/55% respectively. Here, this week’s EMU (core) inflation data evidently have an important role to play. On FX markets, EUR/USD remains in correction modus. Except for the 1.06 big figure first really important support only comes in at 1.0516/1.0484.
News and views
Spanish prime minister Sanchez will dissolve parliament and call snap elections for July 23, about five months earlier than the one expected for December. The surprise decision followed Sunday’s heavy setback in local and regional elections. Sanchez’ Socialist Party share fell to 28% while the centre-right Partido Popular won 31.5% of the votes, up from 22% in 2019. The far-right Vox more than doubled its votes to 7%. The PP, in some places with Vox support, is set to control eight out of the 12 regions that were being polled. Sanchez said the outcome called for clarifications of the will of the people. Political analysts label it an “all or nothing” move with Sanchez trying to consolidate votes on the scrambled left that has been struggling to resolve a dispute over whether they can and should unite under a single flag.
British Retail Consortium data showed shop price inflation accelerating to 9% y/y (0.5% m/m) in May, up from 8.8% in April and a new record in the series which started tracking in 2005. The numbers follow up on last week’s much stickier headline and even rising core inflation. They also defy expectations back in April that shop price inflation may have peaked. Food prices rose 15.4%, only marginally lower than the 15.7% in April. Non-food inflation picked up from 5.5% to 5.8%. According to Watkins, head of retailer and business insight of the company that produces the data, UK shoppers are trying to save money by looking for promotions and taking advantage of price reductions offered by supermarket loyalty schemes.
Yields Decline as a Deal on US Debt Ceiling is Getting Closer
Market movers today
The main data releases today will be the Spanish flash inflation, euro area economic sentiment indicators and the US conference board's consumer confidence index for May.
The Spanish figures will offer the first hints about the euro area flash HICP data due for release on Thursday where consensus is looking for modest easing in core inflation pressures.
Regarding monetary policy, ECB's Holzmann and the Fed's Barkin will be on the wires today.
Overnight, the Chinese NBS PMIs will be released. Early indicators point towards a stabilization in the manufacturing index after a big drop in April, while we expect the service PMI to decline modestly from the current elevated level.
Later in the week, markets will closely follow if the US congress will be able to pass the preliminary debt ceiling agreement, with the House of Representatives expected to vote on Wednesday. Markets will also keep an eye out for some key US data releases, including the April JOLTs on Wednesday, May ISM Manufacturing on Thursday and Jobs Report on Friday.
The 60 second overview
US and UK markets were closed yesterday, but there was a solid decline in the European government bond yields and the curve flattened from the long end. There was a modest loss in the European equity markets. In the US, President Biden and the republicans are getting closer to a deal on the debt ceiling thereby avoiding a default on the US government debt.
We see a mixed picture in the Asian equity markets where some markets are posting small gains while others are posting small losses. US Treasuries are rallying from the long in the Asian trading hours on the back of the expected deal on the US debt ceiling. We have also seen a solid decline in the yield on short-dated T-bills (maturing in June), where the yield has declined by more than 100bp during the last few days. Part of the deal includes a cap on public spending in the next two years. This is likely to dampen growth in the US economy, and the debt ceiling will be suspended until January 2025.
Yesterday, the Spanish socialist government called a snap election after the government lost significantly to the conservative opponents in the regional and local elections on Sunday. The election will be held on July 23. The impact on Spanish government bonds should be limited although we could see a modest short-term widening relative to Italy and Portugal. However, Spain together with the other peripheral markets have been the best performing government bond markets among the Euro area government bonds as shown in our weekly on the European fixed income market.
In Turkey, President Erdogan won the presidential election and will serve another 5-year term. This sent the Turkish lira weaker against the dollar given the uncertainty regarding the outlook for the Turkish economy. See more in our comment on the Turkish election, Research Turkey - Time to fasten seatbelts as Erdogan secures another term, 29 May.
FI: The UK and US markets were closed yesterday, but in the European markets bond yields declined and the curve flattened from the long end. Spreads between the core-EU and periphery were stable despite the Spanish government calling a snap election for 30 July after losing in the local elections.
FX: A quiet start to the week without much to report. Sustained Scandie weakness and a slightly stronger USD. With both US and Europe back in action today we expect a slight uptick in volatility compared to yesterday.
Credit: Credit spreads were supported towards the end of last week by improving risk sentiment, sending iTraxx Main 2bp tighter compared with the previous week thus closing at 80bp on Friday, while Xover was tighter by 9bp to close at 425bp.
Nordic macro
In Sweden, the revised GDP figure for Q1 will be released. The GDP indicator has indicated quarterly and yearly growth of +0.2%, which is much higher than our forecast of -1% q/q in the Nordic Outlook report in April. If there are no significant revisions, this suggests that the Swedish economy is on track to avoid a recession in 2023, assuming no other changes are made to our forecasts for Q2-Q4. However, the economy remains divided, with pressure on households and the housing market, while the production side and labour markets continue to do OK. Since this data pertains to Q1 and therefore is more backward-looking, both the NIER survey and PMI figures also today will be very interesting, as they provide more forward-looking information. Both the NIER and PMI surveys have presented a somewhat mixed picture so far. The PMI's have held up relatively well, especially in the services sector, whereas the NIER survey indicates the opposite, with better-than-normal sentiment among manufacturers but pressure on the services sector. The NIER survey covers a broader range of businesses with a heavier focus on consumer activity, which likely explains the divergences. In addition to overall sentiment, we will pay special attention to price plans.
Manufacturing prices have been trending lower for about a year, while price plans have been more resilient in the services sector. The development of these will most likely be the most interesting, giving some more clues on how fast the inflation will move lower. We will also look out for hiring plans, household sentiment, and the order inflow.
Furthermore, there will be an open hearing with the Board of the Riksbank on monetary policy for 2022. Although this discussion will be largely backward-looking, it might provide some comments or clues regarding their perspective on the latest inflation data or the weakness of the SEK.
One Step Closer to Debt Ceiling Deal – And a Fed Hike
The holiday shortened trading week starts tense but on an optimistic note as US President Joe Biden and House Speaker Kevin McCarthy finally reached an agreement to raise the debt ceiling. The deal must get approval in a congressional vote on Wednesday.
US Treasury Secretary Janet Yellen warned that the Treasury will be running out of money in about a week, by June 5th.
Presently, it feels like investors are confident that the US debt ceiling will be raised. The kneejerk reaction to a debt ceiling deal will be positive but gains could remain short-lived as most of the deal is already priced in, and the end of the det ceiling crisis means that the US treasury will issue $1 trillion debt to service its existing debt, pay its bills and start refilling the Treasury’s General Account, which fell to below $50billion last week, whereas the balance should be normally around $500bn. This means that the US Treasury will be sucking around half a trillion dollars from the market very shortly. We don’t know at what speed at which the market liquidity will drain, but we know that it will drain.
Then, the latest economic data suggested last Friday that US inflation didn’t ease as much as analysts expected in April. On the contrary, the US PCE prices, the Federal Reserve’s (Fed) favourite gauge of inflation, rose from 4.2% to 4.4% in April, instead of falling to 3.9% as analysts expected. Core PCE rose as well. Personal spending was double what analysts penciled in.
The data boosted odds that the Fed would opt for one last hike at next month’s policy meeting. Activity on Fed funds futures now assesses more chance for a 25bp hike in June, than a no hike. The probability of a 25bp hike increased to 60%.
Prospects of lower market liquidity amid the end of the US debt ceiling crisis, and hawkish Fed expectations are both reasons to turn bearish on stocks.
But the S&P500 closed last week above the 4200 level, while Nasdaq 100 jumped more than 2.50% and hit the highest levels since April 2021. Nvidia added another 2.50% to the 24% rally of the day before, before the eyes of those who continue betting that this can’t be anything else but a … bubble.
The rising interest rates due to the more hawkish Fed expectations are outright bearish for rate-sensitive technology stocks.
The US 2-year yield which captures the best the Fed bets, is up for the 12th straight session.
Fed hawks give support to USD
Rising US yields continue giving a decent support to the US dollar; the US dollar index is now pushing above the minor 23.6% retracement on September to April retreat.
The USDJPY consolidates above the 140 mark, yet the recent fall in US-Japan 10-year bond spread hints that the potential for a further rally above 140 could be limited. The price could soon peak and return toward the 200-DMA, near 137.
The EURUSD. on the other hand, tests 1.07 to the downside.
This week, the US jobs data will reveal whether the US jobs market loosened or not. According to the consensus of analyst forecasts on Bloomberg, the US economy may have added around 180K new nonfarm jobs in May.
But for the last 13 months, not a single time the NFP number was lower than the forecast, and not a single time was it below the 200K mark. Maybe the 14th time is the charm!
Another month of strong US jobs data, and solid wage growth should further fuel the Fed rate hike bets and support the US dollar. In which case, the EURUSD could extend losses below the 1.07 mark, and USDJPY could extend rally above the 140 level.
In commodities, the strong dollar continues weighing on gold appetite, as US crude remains bid, though without a strong conviction, above the $70 into the June 3-4 OPEC meeting when OPEC is expected to announce another output cut to give oil prices another jolt. Yet, any OPEC-boosted rally in oil prices will likely remain short lived.
Technical Outlook and Review
DXY:
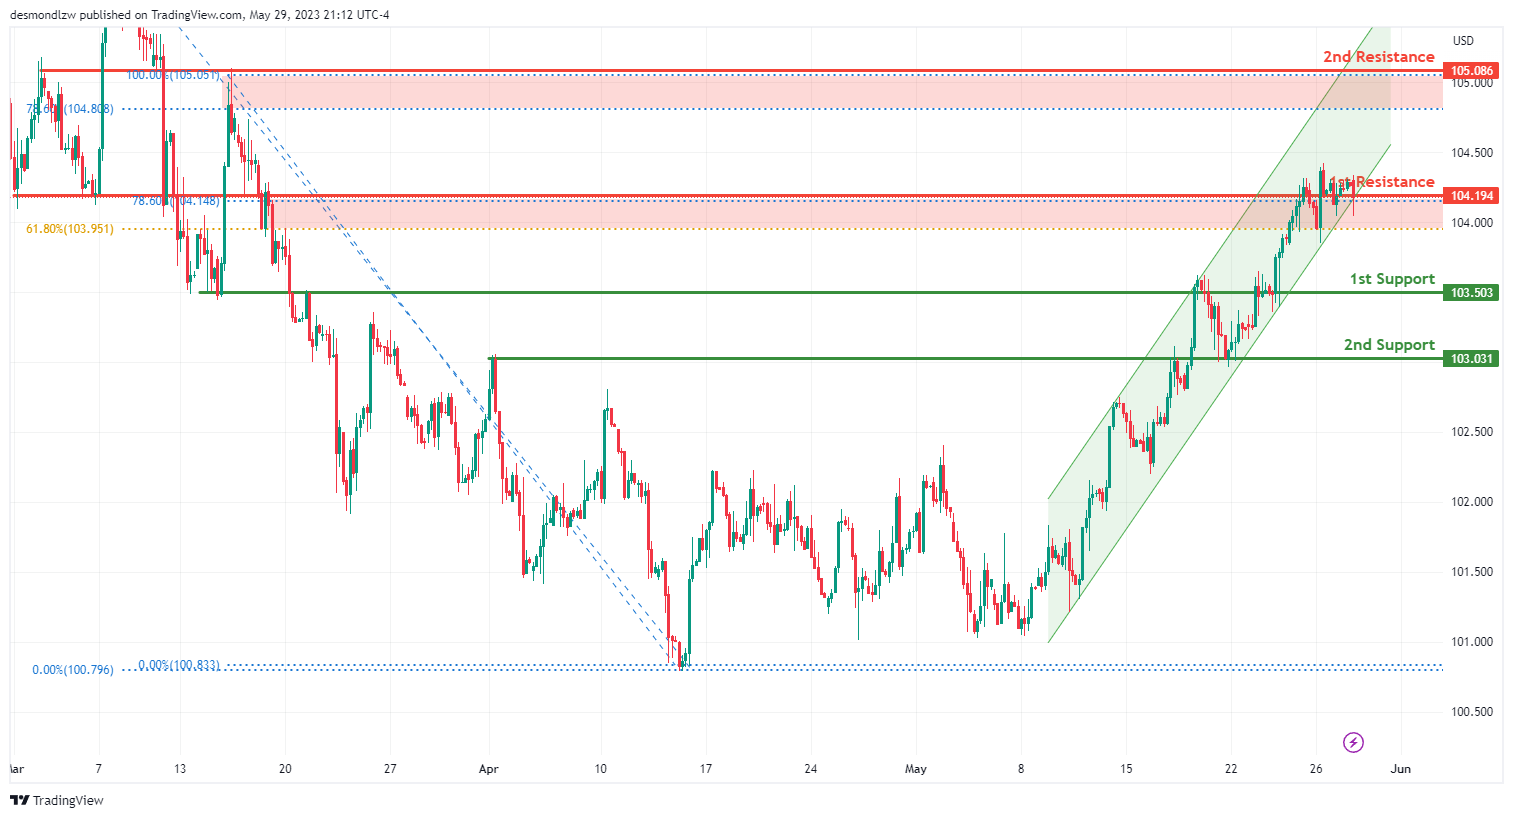
The DXY chart currently displays a weak bearish momentum, although with low confidence. The potential factors contributing to this momentum are the possibility of the price breaking below an ascending trendline, which could trigger a bearish continuation towards the first support level.
The first support level at 103.50 level serves as an important support area, identified as an overlap support. This level carries significance due to its historical relevance as a price level where buyers have previously entered the market.
Additionally, there is a second support level at 103.03, the second support level is also an overlap support. Previous instances of price action bouncing off this level provide additional credibility to its importance as a potential support area.
On the resistance side, the first resistance level at 104.19 level represents an overlap resistance and aligns with the 78.60% Fibonacci retracement. This confluence of technical factors adds strength to the resistance level and suggests it may act as a barrier to upward price movements.
Furthermore, there is a second resistance level at 105.09 is identified as an overlap resistance. This level has previously shown its significance as a price level where selling pressure has emerged.
EUR/USD:
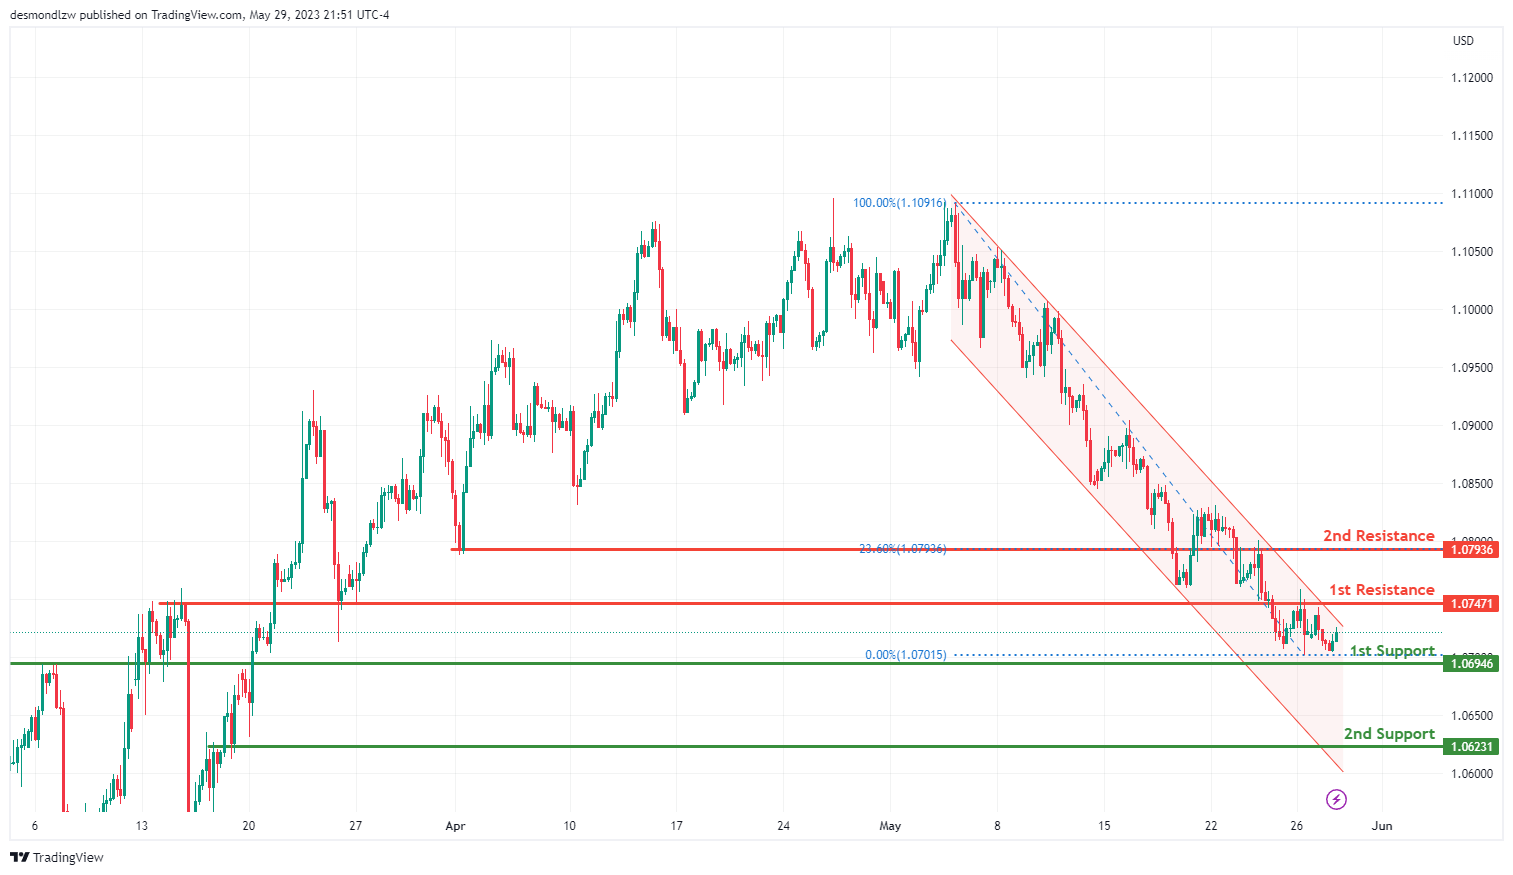
The EUR/USD chart currently exhibits a bearish momentum, characterized by being in a bearish descending channel. This suggests a potential continuation of the downward trend, indicating a negative sentiment in the market.
The first support level at 1.0695 serves as a significant support area, identified as an overlap support. This level carries historical importance as a price level where buyers have previously entered the market, making it a key support area to monitor.
Additionally, there is a second support level at 1.0623 which is also an overlap support. Previous instances of price action bouncing off this level provide additional credibility to its importance as a potential support area.
On the resistance side, the first resistance level at 1.0747 represents an overlap resistance. This level may act as a temporary barrier to upward price movements, potentially causing a pause or retracement in the bearish trend.
Furthermore, there is a second resistance level at 1.0794 that is identified as an overlap resistance. This level has previously shown its significance as a price level where selling pressure has emerged. Additionally, it aligns with the 23.60% Fibonacci retracement, adding further strength to its potential as a resistance area.
GBP/USD:
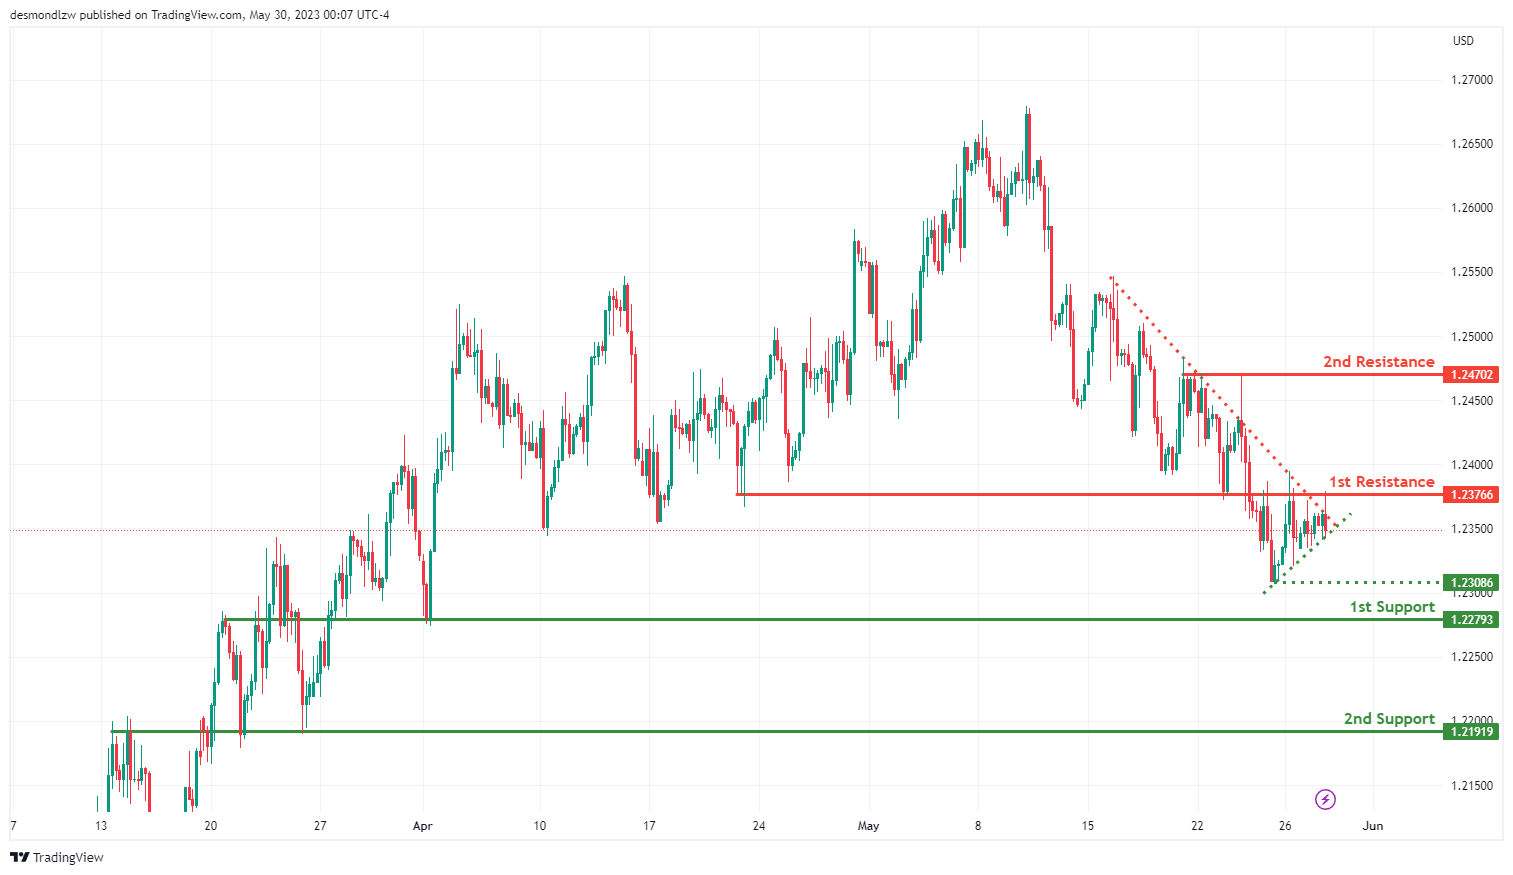
The GBP/USD chart currently exhibits a bearish momentum, characterized by a bearish symmetrical triangle pattern. This pattern suggests a potential continuation of the downward trend, indicating a negative sentiment in the market. Price could break below the ascending support line, triggering a potential bearish move.
The first support level at 1.2279 serves as a significant support area, identified as an overlap support. This level carries historical importance as a price level where buyers have previously entered the market, making it a key support area to monitor.
Additionally, there is a second support level at 1.2192, the second support level is also an overlap support. Previous instances of price action bouncing off this level provide additional credibility to its importance as a potential support area.
On the resistance side, the first resistance level at 1.2377 represents an overlap resistance. This level may act as a temporary barrier to upward price movements, potentially causing a pause or retracement in the bearish trend.
Furthermore, there is a second resistance level at 1.2470 that is identified as an overlap resistance. This level has previously shown its significance as a price level where selling pressure has emerged.
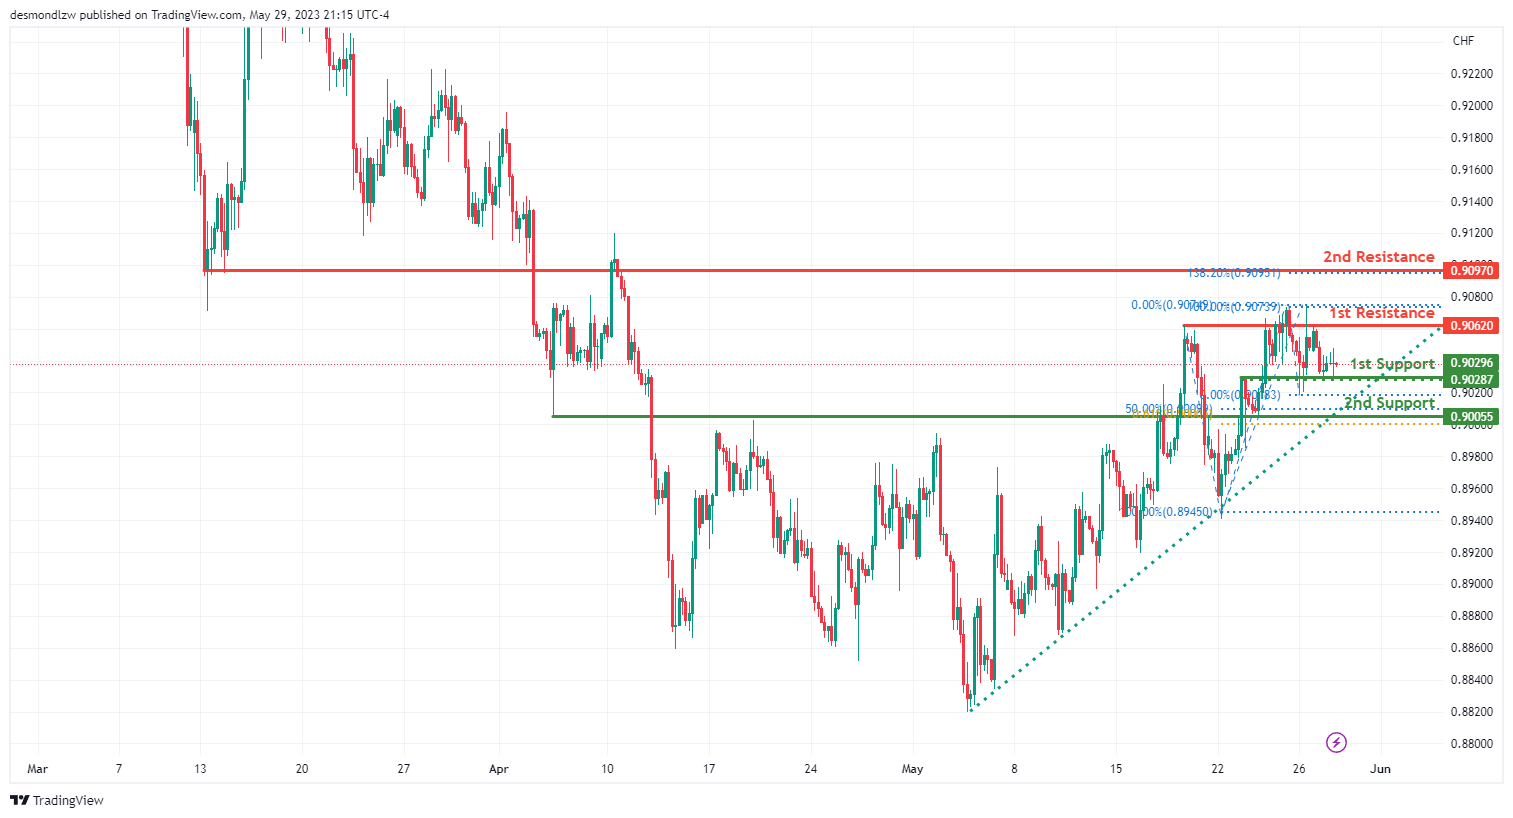
USD/CHF:
The USD/CHF chart currently exhibits a weak bullish momentum, although with low confidence. This suggests a potential continuation of the upward trend, but with uncertainty surrounding the strength of the bullish sentiment. There is a possibility of a bullish continuation towards the first resistance level at 0.9062.
The first support level at 0.9030 serves as a significant support area that is identified as an overlap support. This level carries historical importance as a price level where buyers have previously entered the market, making it a key support area to monitor.
Additionally, there is a second support level at 0.9006 which is also an overlap support. This level carries additional significance as it aligns with the 50% Fibonacci retracement and 61.80% Fibonacci projection, adding strength to its potential as a support area.
On the resistance side, the first resistance level at 0.9062 represents an overlap resistance. This level may act as a temporary barrier to further upward price movements, potentially causing a pause or retracement in the bullish trend.
Furthermore, there is a second resistance level at 0.9097 that is identified as an overlap resistance. This level has previously shown its significance as a price level where selling pressure has emerged. Additionally, it aligns with the 138.20% Fibonacci expansion, adding further strength to its potential as a resistance area.
USD/JPY:
The USD/JPY chart currently exhibits a bullish momentum, characterized by being in a bullish ascending channel. This suggests a potential continuation of the upward trend, indicating a positive sentiment in the market. There is a possibility of a bullish continuation towards the intermediate resistance level at 140.89.
On the support side, the first support level at 138.80 serves as a significant support area, identified as an overlap support. This level carries historical importance as a price level where buyers have previously entered the market, making it a key support area to monitor.
Additionally, there is a second support level at 137.71 which is also an overlap support. Previous instances of price action bouncing off this level provide additional credibility to its importance as a potential support area.
On the resistance side, the first resistance level at 142.26 represents an overlap resistance. This level may act as a temporary barrier to further upward price movements, potentially causing a pause or retracement in the bullish trend.
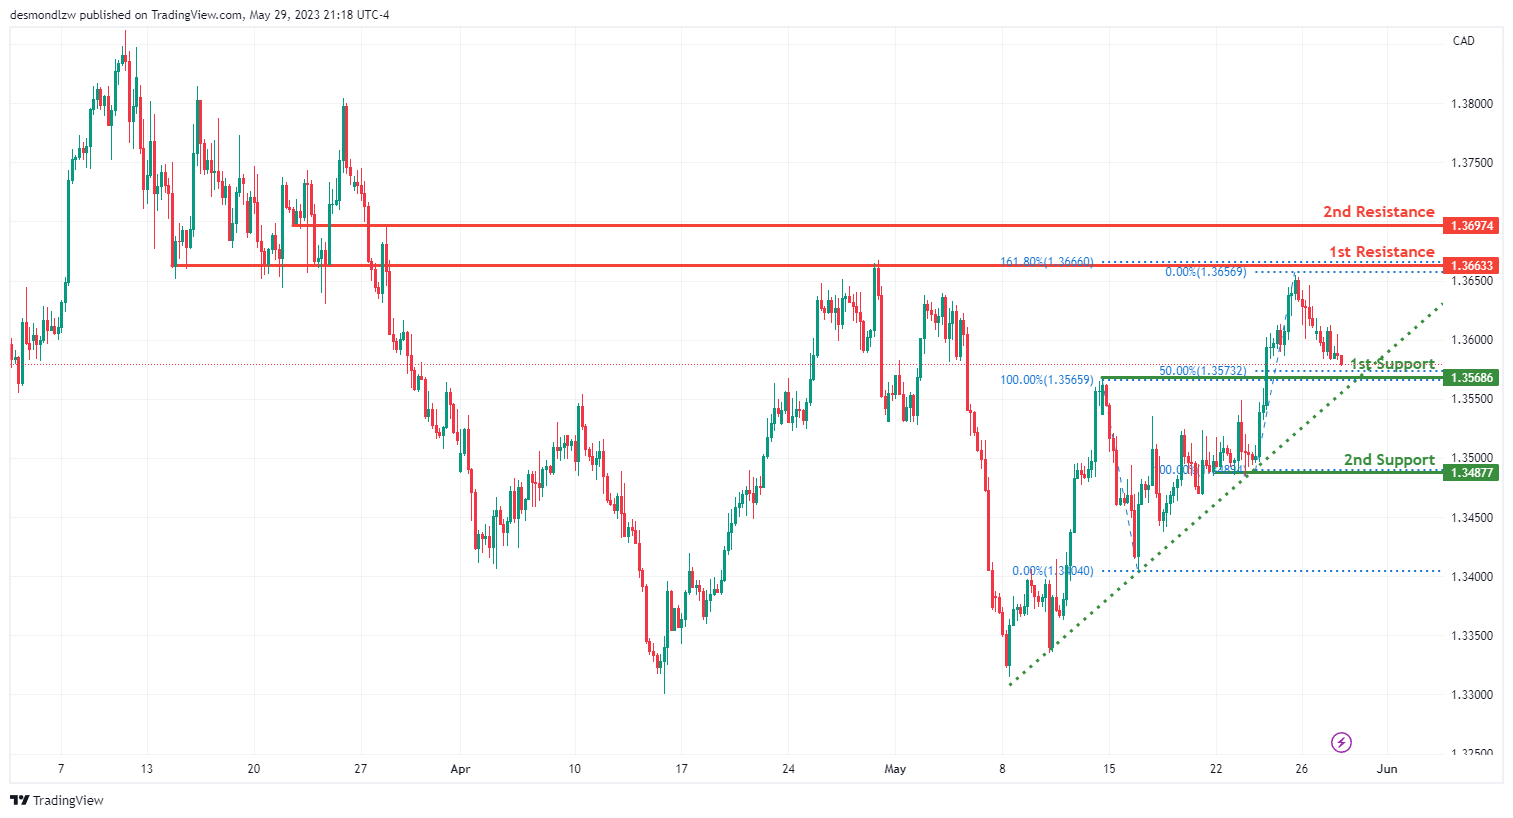
USD/CAD:
The USD/CAD chart currently exhibits a bullish momentum, suggesting a potential continuation of the upward trend. This bullish sentiment indicates a favorable environment for further price appreciation.
The first support level at 1.3569 serves as a significant support area that is identified as an overlap support. This level carries historical importance as a price level where buyers have previously entered the market. Additionally, it aligns with the 50% Fibonacci retracement, further reinforcing its significance as a potential support area.
Additionally, there is a second support level at 1.3488 which is also an overlap support. Previous instances of price action bouncing off this level provide additional credibility to its importance as a potential support area.
On the resistance side, the first resistance level at 1.3663 that represents an overlap resistance. This level may act as a temporary barrier to further upward price movements, potentially causing a pause or retracement in the bullish trend. Additionally, it aligns with the 161.80% Fibonacci extension, adding strength to its potential as a resistance area.
Additionally, there is a second resistance level at 1.3697 that is identified as an overlap resistance. This level has previously shown its significance as a price level where selling pressure has emerged.
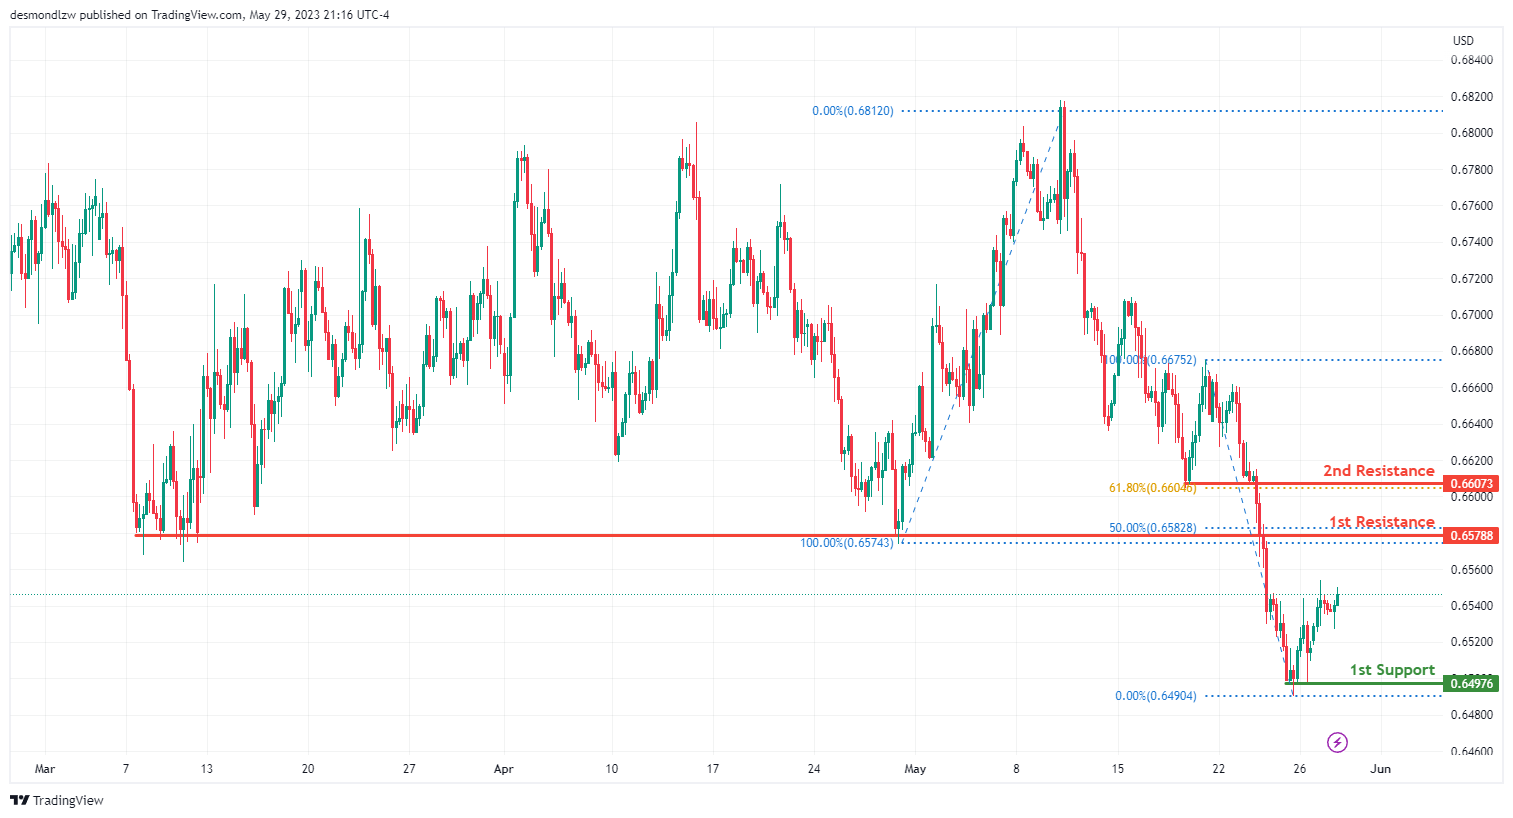
AUD/USD:
The AUD/USD chart currently exhibits a strong bearish momentum, suggesting a potential continuation of the downward trend. This bearish sentiment indicates a negative outlook for the currency pair.
On the support side, the first support level at 0.6498 serves as a significant support area, identified as a swing low support. This level carries historical importance as a price level where buyers have previously entered the market, making it a key support area to monitor.
On the resistance side, the first resistance level at 0.6579 that represents an overlap resistance. This level may act as a temporary barrier to upward price movements, potentially causing a pause or retracement in the bearish trend. Additionally, it aligns with the 50% Fibonacci retracement, adding further strength to its potential as a resistance area.
Furthermore, there is a second resistance level at 0.6607 that is identified as an overlap resistance. This level has previously shown its significance as a price level where selling pressure has emerged. Additionally, it aligns with the 61.80% Fibonacci retracement, further reinforcing its potential as a resistance area.
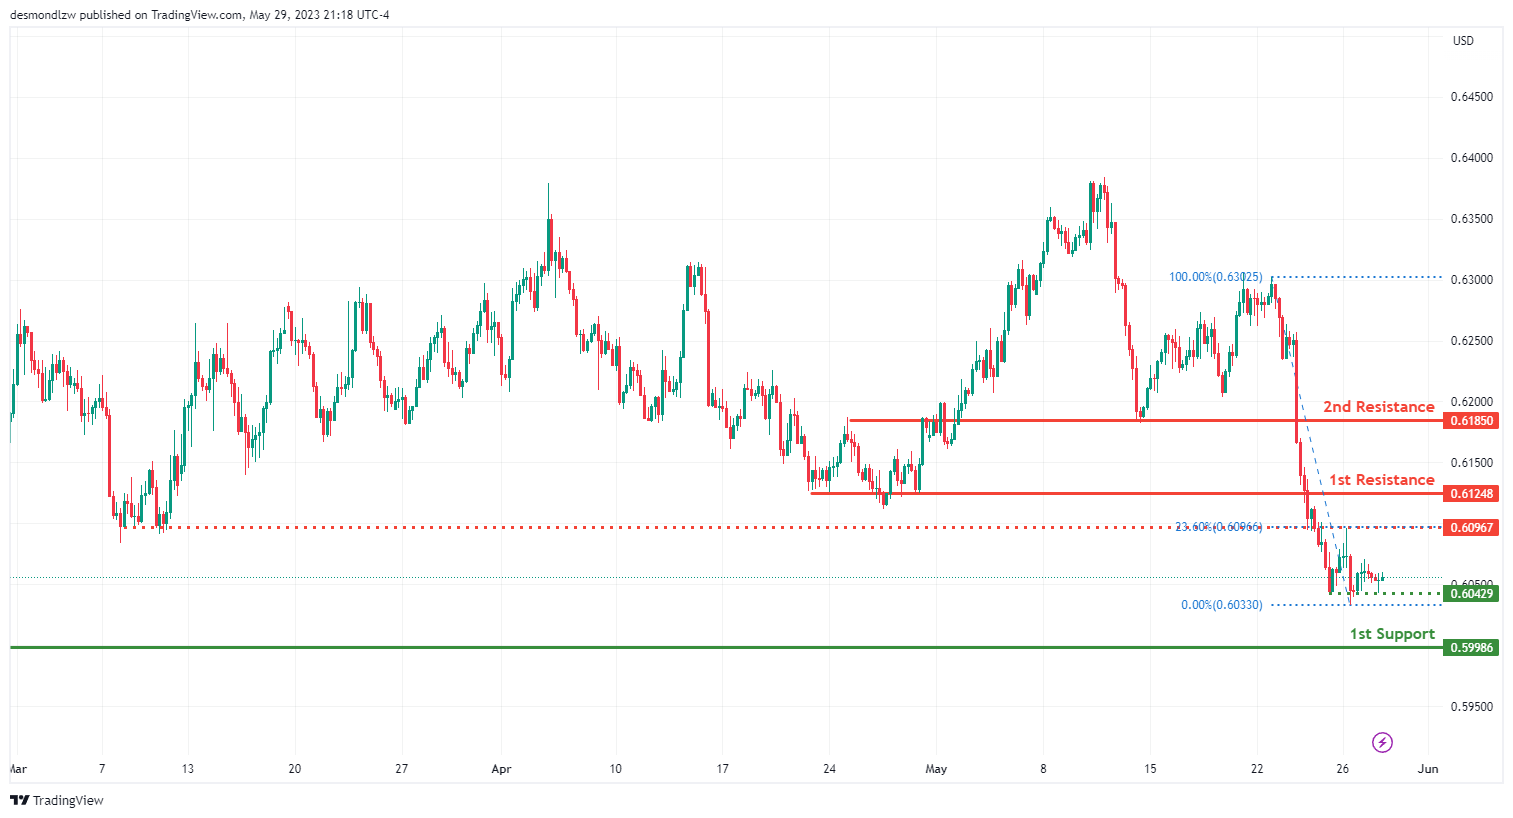
NZD/USD
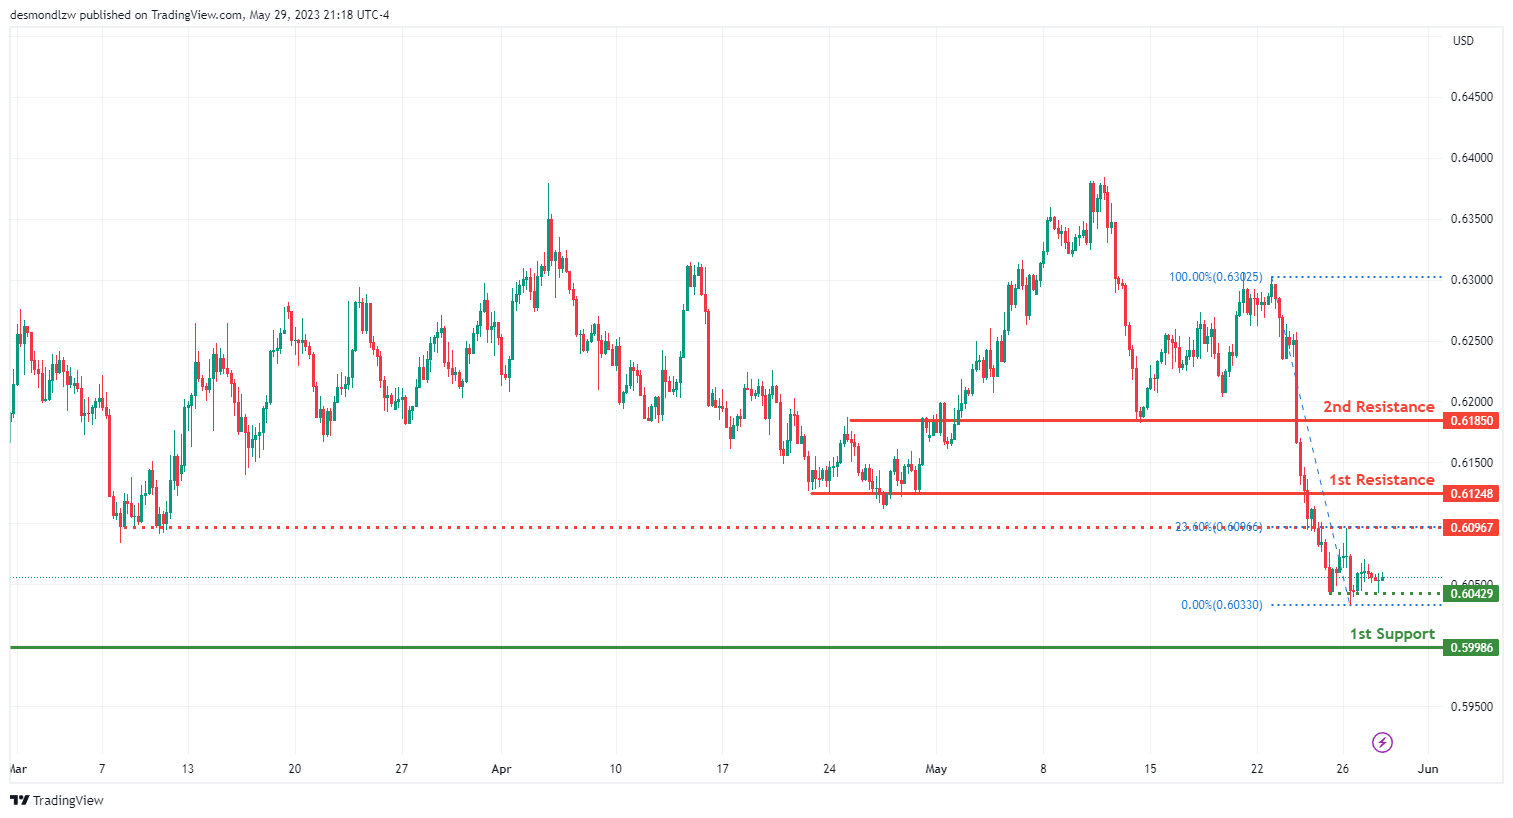
The NZD/USD chart currently exhibits a strong bearish momentum, suggesting a potential continuation of the downward trend. This bearish sentiment indicates a negative outlook for the currency pair.
An intermediate support level can be found at 0.6043, which represents an overlap support while the first support at 0.6000 serves as a significant support area that is identified as an overlap support. This level carries historical importance as a price level where buyers have previously entered the market, making it a key support area to monitor..
On the resistance side, the first resistance level at 0.6125 represents an overlap resistance. This level may act as a temporary barrier to upward price movements, potentially causing a pause or retracement in the bearish trend.
Additionally, there is a second resistance level at 0.6185 that is identified as an overlap resistance. This level has previously shown its significance as a price level where selling pressure has emerged.
DJ30:
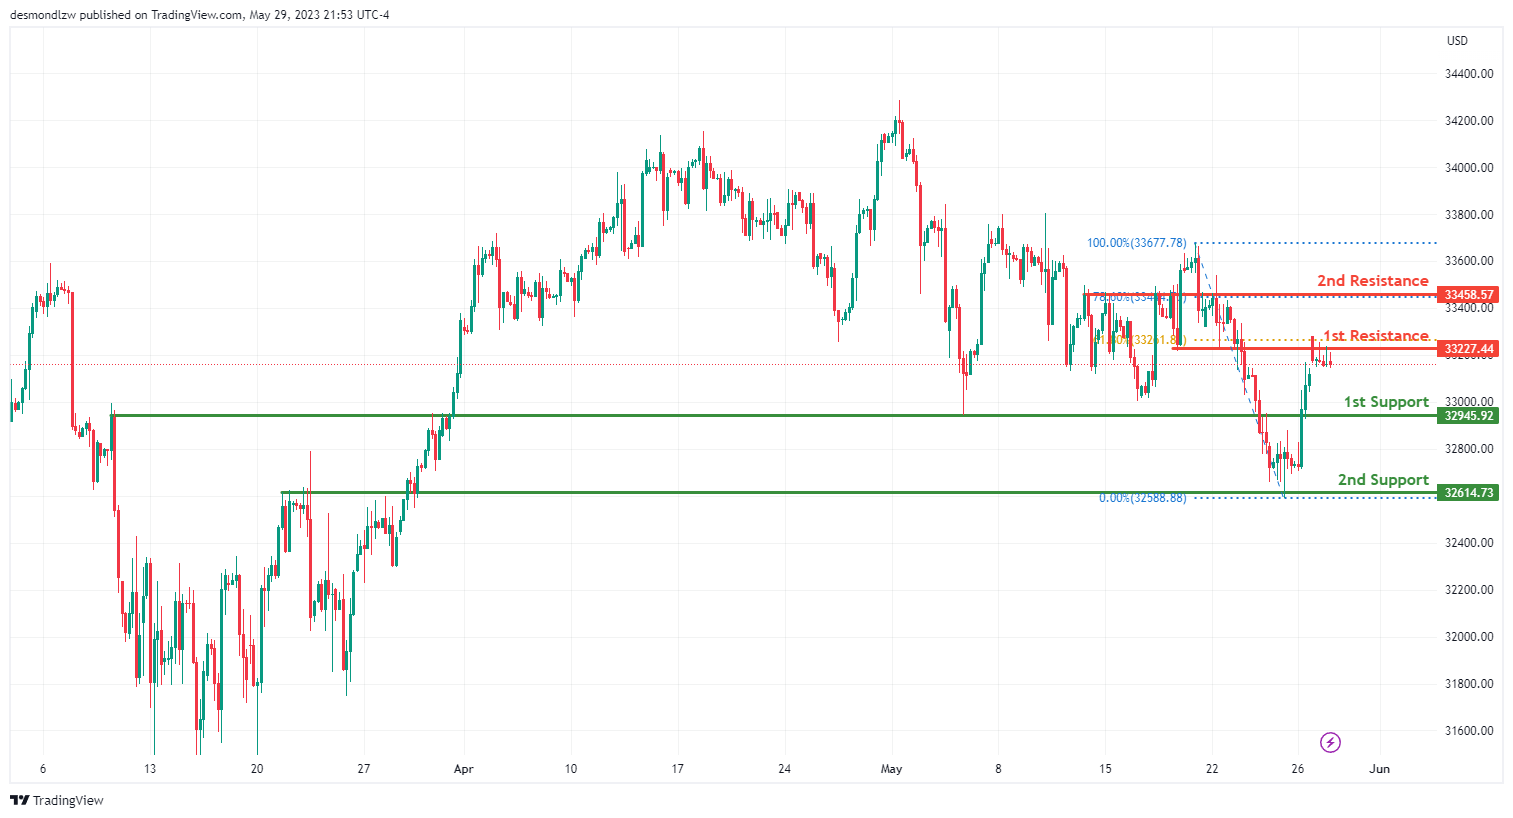
The DJ30 (Dow Jones Industrial Average) chart currently exhibits bullish momentum, indicating a potential continuation of the upward trend. This bullish sentiment suggests a favorable environment for further price appreciation.
There is a possibility of a bullish continuation towards the first resistance level at 33227.44. This level represents an overlap resistance and aligns with the 61.80% Fibonacci retracement. This confluence of technical factors adds strength to the resistance level and suggests it may act as a barrier to further upward price movements. Additionally, there is a second resistance level at 33458.57 is identified as an overlap resistance and aligns with the 78.60% Fibonacci retracement. This level has previously shown its importance as a price level where selling pressure has emerged, making it a crucial area to watch.
On the support side, the first support level at 32945.92 level serves as a significant support area, identified as an overlap support. This level has historical importance as a price level where buyers have previously entered the market, making it a key support area to monitor. Additionally, there is a second support level at 32614.73, the second support level is also an overlap support. Previous instances of price action bouncing off this level add credibility to its significance as a potential support area.
GER30:
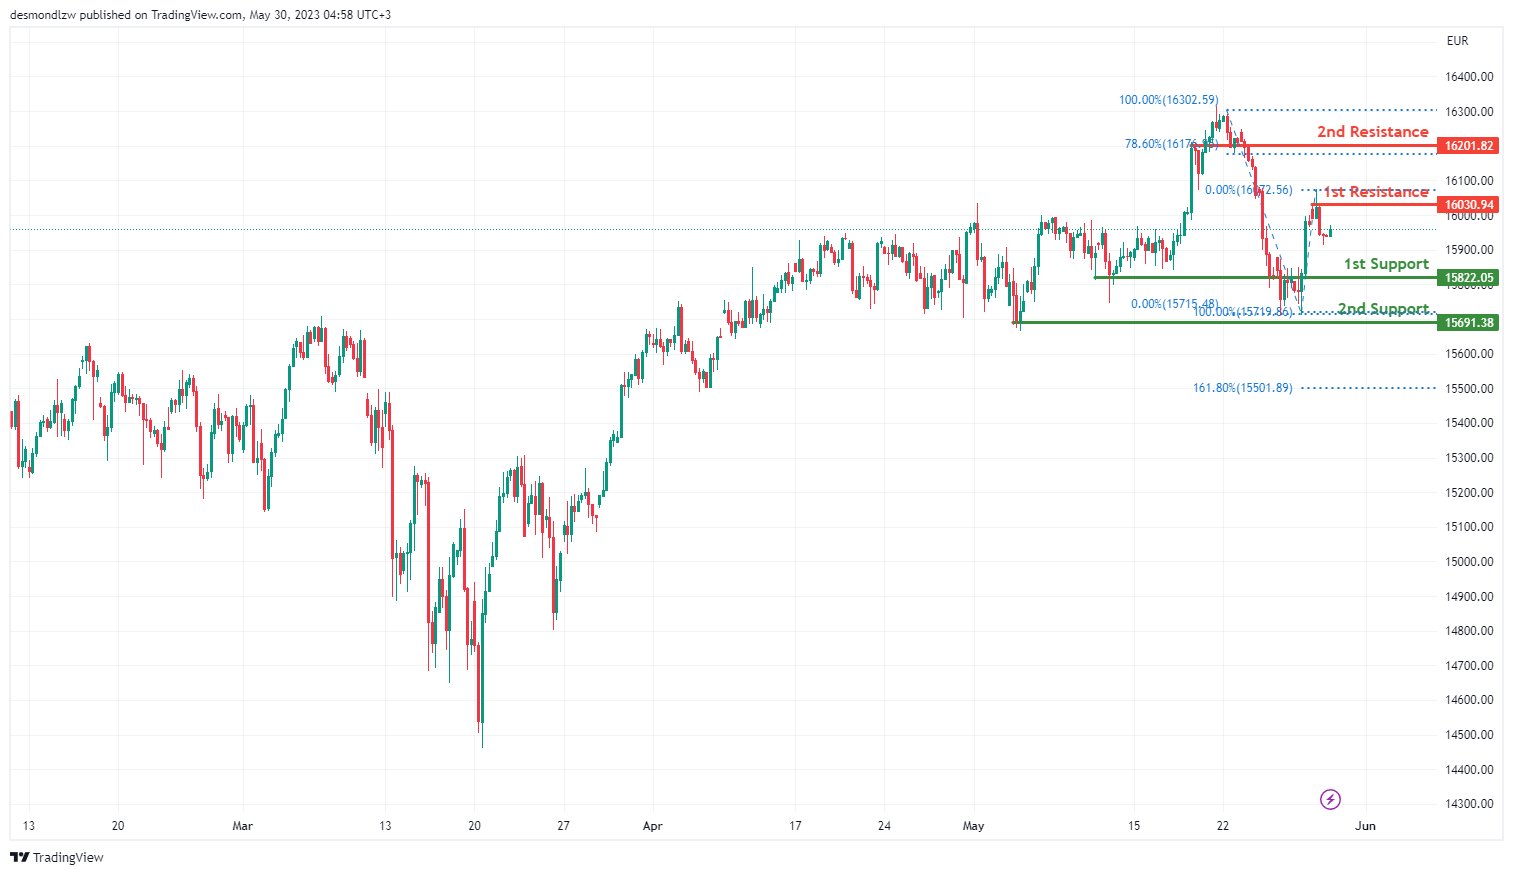
The GER30 (DAX) chart currently exhibits a weak bullish momentum, although with low confidence. This suggests a potential continuation of the upward trend, but with uncertainty surrounding the strength of the bullish sentiment.
There is a possibility of a bullish continuation towards the first resistance level at 16030.94 level. This level may act as a temporary barrier to further upward price movements, potentially causing a pause or retracement in the bullish trend. Additionally, a second resistance level at 16201.82 is identified as an overlap resistance. This level has previously shown its significance as a price level where selling pressure has emerged. Additionally, it aligns with the 78.60% Fibonacci retracement, adding further strength to its potential as a resistance area.
On the support side, the first support level at 15822.05 level serves as an important support area, identified as an overlap support. This level carries significance due to its historical relevance as a price level where buyers have previously entered the market. Furthermore, there is a second support level at 15691.38. Previous instances of price action bouncing off this level provide additional credibility to its importance as a potential support area.
US500
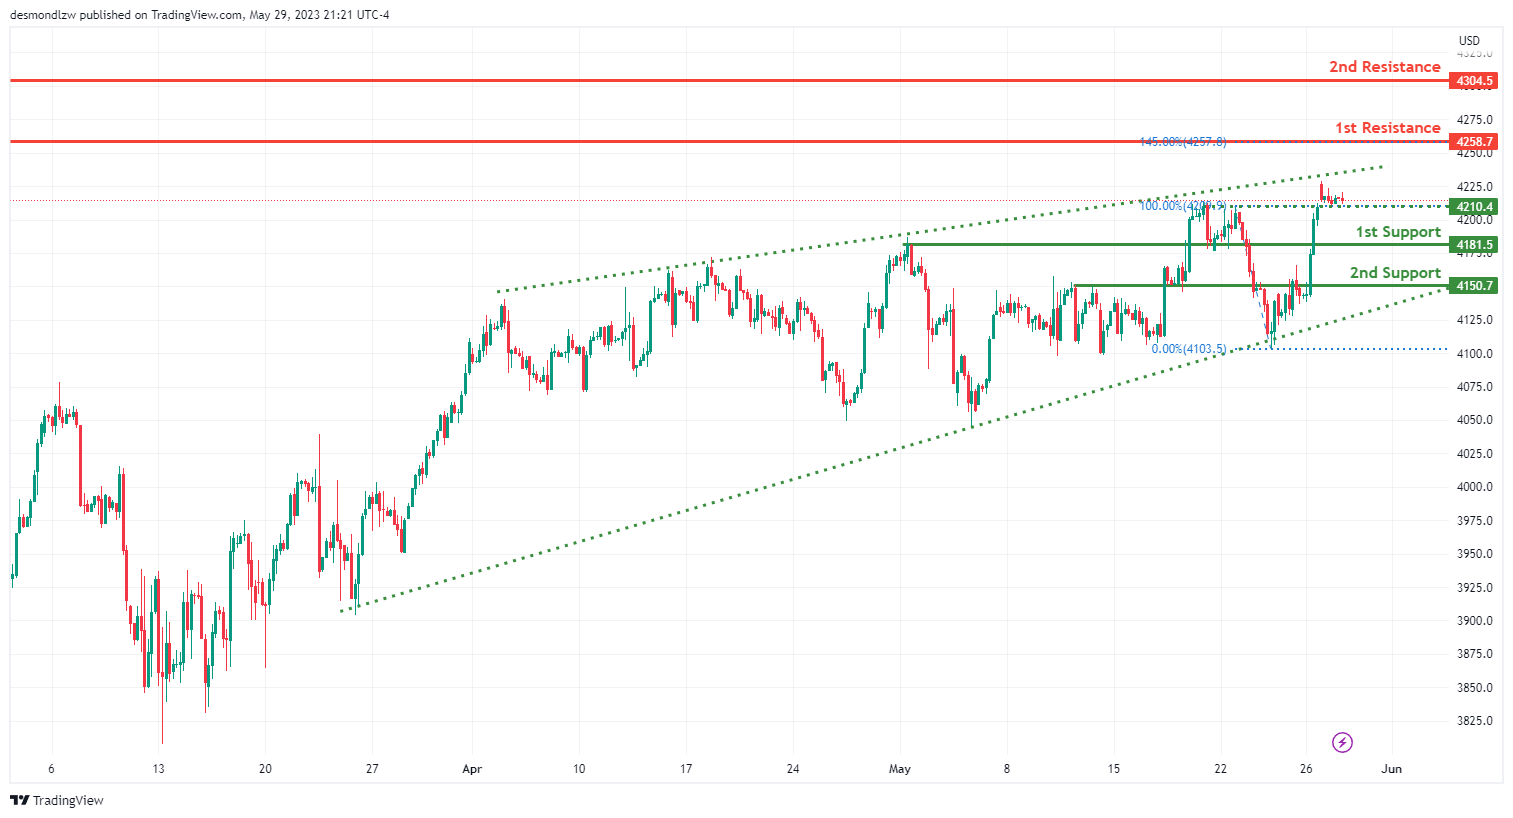
The US500 chart currently exhibits a weak bullish momentum, although with low confidence. This suggests a potential continuation of the upward trend, but with uncertainty surrounding the strength of the bullish sentiment.
There is an intermediate support level at 4210.40 and the first support level at 4181.50 serves as an important support area, identified as an overlap support. This level carries significance due to its historical relevance as a price level where buyers have previously entered the market.
The second support level at 4150.70 is also an overlap support. Previous instances of price action bouncing off this level provide additional credibility to its importance as a potential support area.
There is a possibility of a bullish break through the ascending channel to rise towards the first resistance level at 4258.70. This level may act as a temporary barrier to further upward price movements, potentially causing a pause or retracement in the bullish trend. Additionally, it aligns with the 145.00% Fibonacci expansion, adding strength to its potential as a resistance area.
The second resistance level at 4304.50 is identified as an overlap resistance. This level has previously shown its significance as a price level where selling pressure has emerged.
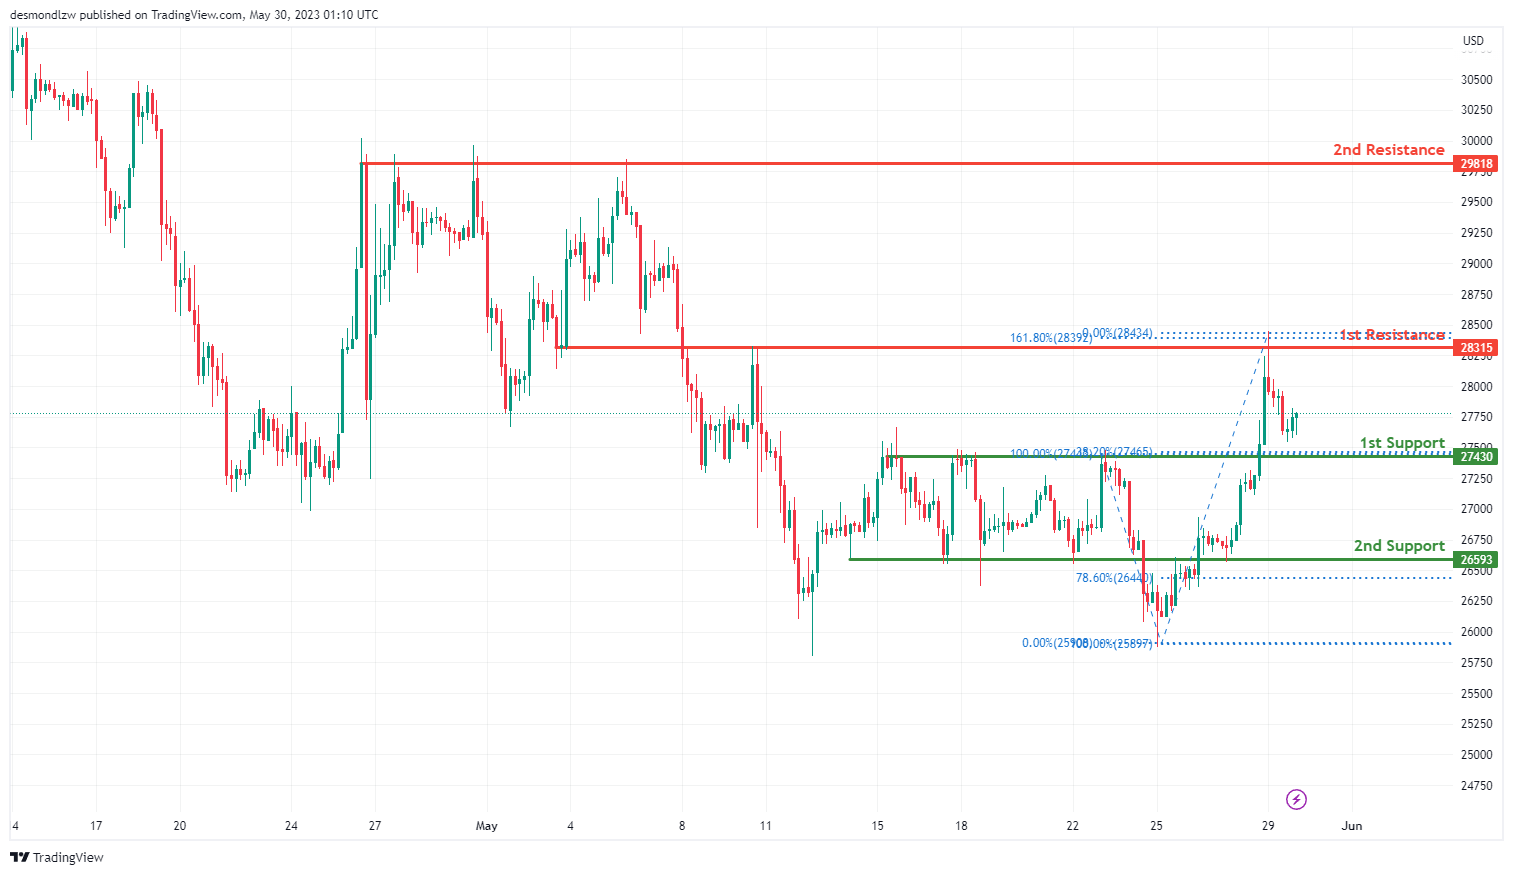
BTC/USD:
The BTC/USD chart currently exhibits a weak bullish momentum, although with low confidence. This suggests a potential continuation of the upward trend, but with uncertainty surrounding the strength of the bullish sentiment.
There is a possibility of a bullish move towards the first resistance level at 28315.00. This level may act as a temporary barrier to further upward price movements, potentially causing a pause or retracement in the bullish trend. Additionally, it aligns with the 161.80% Fibonacci expansion, adding strength to its potential as a resistance area.
The second resistance at 29818.00 is identified as an overlap resistance. This level has previously shown its significance as a price level where selling pressure has emerged.
On the support side, the first support level at 27430.00 serves as an important support area, identified as an overlap support. This level carries significance due to its historical relevance as a price level where buyers have previously entered the market.
Additionally, there is a second support level at 26593.00 which is an overlap support and aligns with the 78.60% Fibonacci retracement. This confluence of technical factors adds strength to its importance as a potential support area.
ETH/USD:
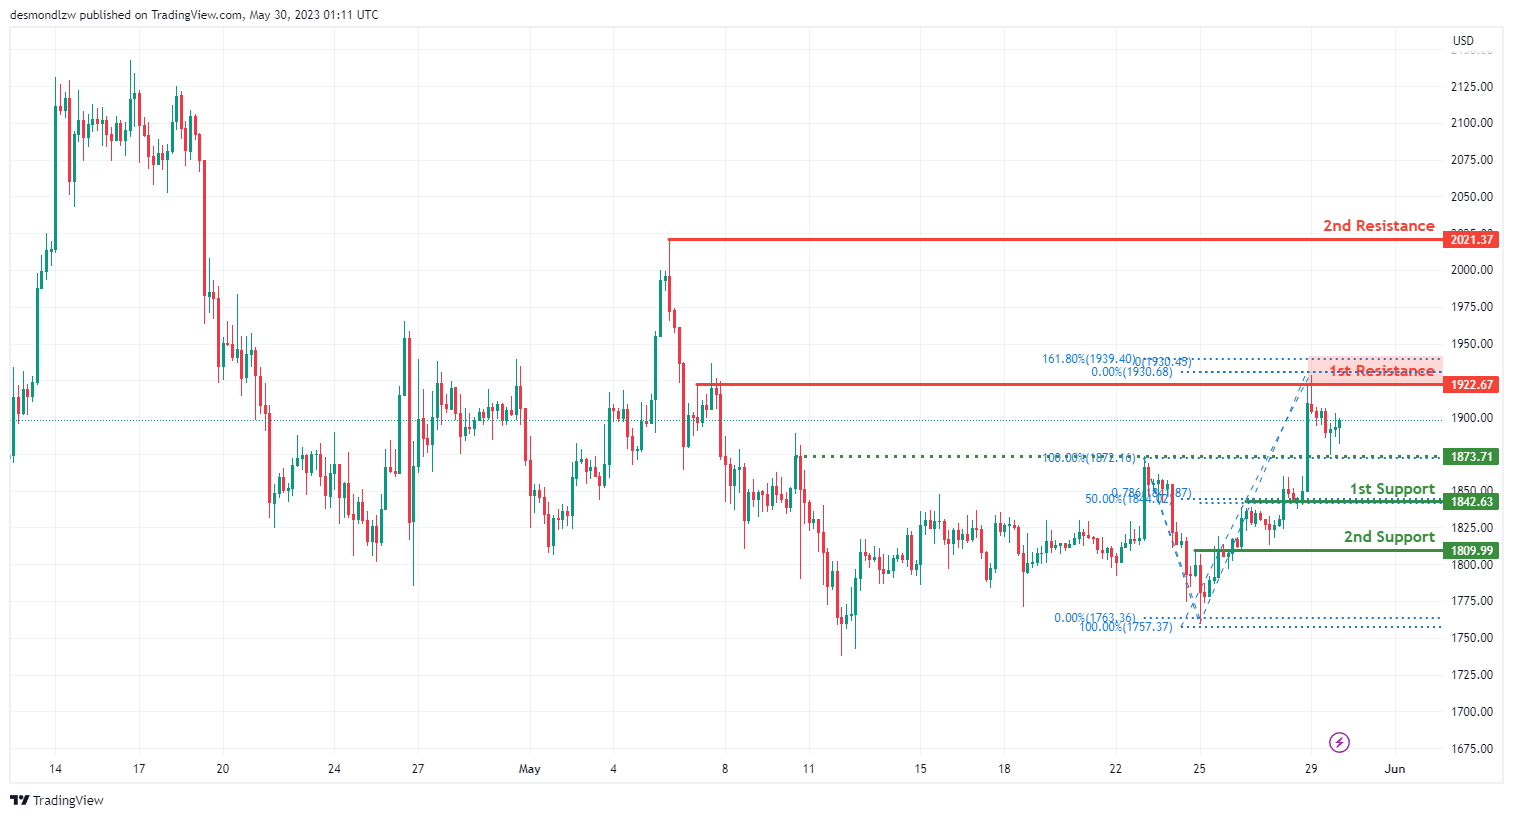
The ETH/USD chart currently exhibits a bullish momentum, suggesting a potential continuation of the upward trend. This bullish sentiment indicates a favorable environment for further price appreciation.
The first line of support at 1842.63 level serves as a significant support area, identified as an overlap support. Additionally, it aligns with the 50% Fibonacci retracement, adding further significance to this level as a potential area for price stabilization during pullbacks.
If the price breaks below this level, the second line of support lies at 1809.99 which is also an overlap support. Previous instances of price action bouncing off this level provide additional credibility to its importance as a potential support area.
On the upside, the first resistance is at 1922.67 which represents an overlap resistance. This level may act as a temporary barrier to further upward price movements, potentially causing a pause or retracement in the bullish trend. Additionally, it aligns with the 161.80% Fibonacci expansion, adding further strength to its potential as a resistance area.
The second resistance is at 2021.37, which was a previous swing high. This level has previously shown its significance as a price level where selling pressure has emerged.
WTI/USD:
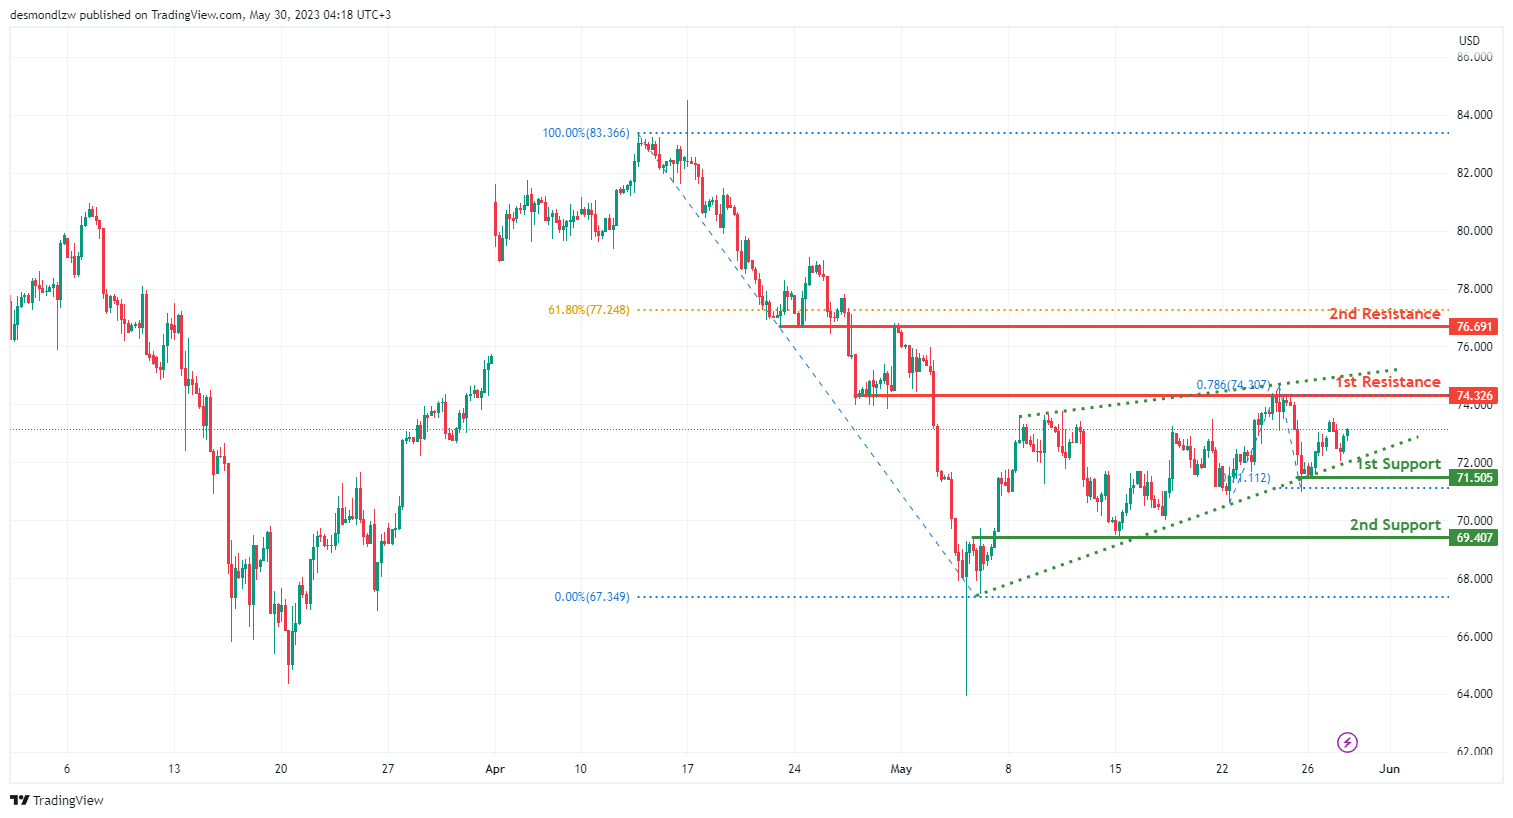
The WTI/USD chart currently exhibits a bullish momentum, suggesting a potential continuation of the upward trend. This bullish sentiment indicates a favorable environment for further price appreciation.
The 71.51 level serves as a significant first support area, identified as an overlap support. This level has historical relevance as a price level where buyers have previously entered the market, making it a key support area to monitor.
If the price falls below this point, the second line of support is at 69.41 which is also an overlap support. Previous instances of price action bouncing off this level provide additional credibility to its importance as a potential support area.
Looking upward, the first resistance level is at 74.33 which represents an overlap resistance. This level may act as a temporary barrier to further upward price movements, potentially causing a pause or retracement in the bullish trend.
The second resistance is at 76.69 which is identified as an overlap resistance. This level has previously shown its significance as a price level where selling pressure has emerged. Additionally, it aligns with the 61.80% Fibonacci retracement, adding further strength to its potential as a resistance area.
XAU/USD (GOLD):
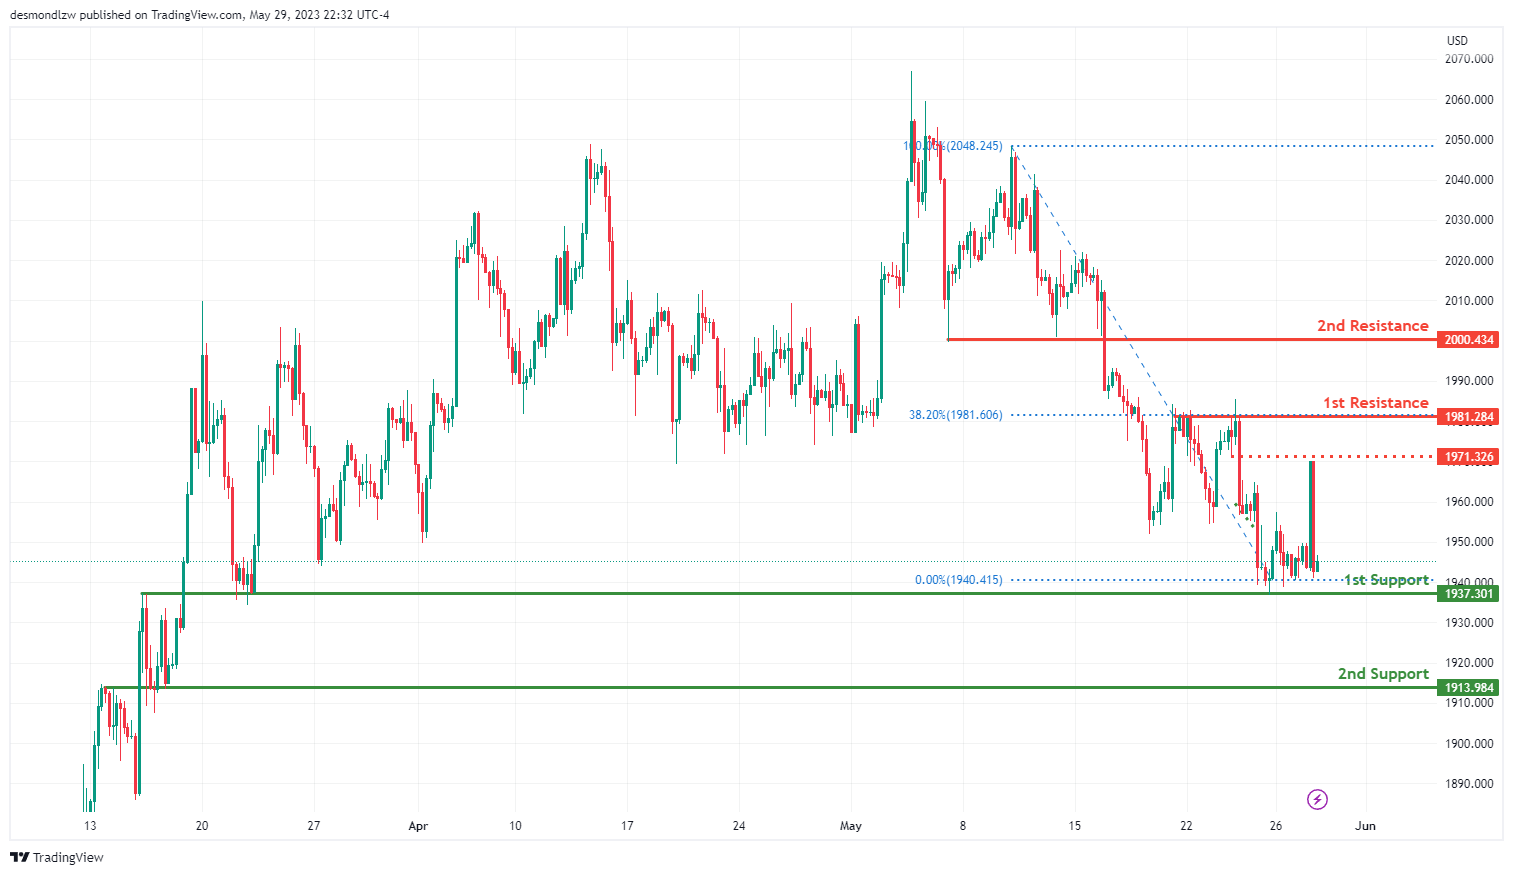
The XAU/USD chart currently exhibits a weak bullish momentum, suggesting a potential bounce from the first support. This indicates a cautious environment where further price appreciation may be limited.
The first level of support is at 1937.30 which serves as a significant support area, identified as an overlap support. This level carries historical importance as a price level where buyers have previously entered the market, making it a key support area to monitor.
If the price breaks below this level, the second line of support is at 1913.98 which is also an overlap support. Previous instances of price action bouncing off this level provide additional credibility to its importance as a potential support area.
On the upside, the first resistance level is at 1981.28 which represents an overlap resistance. This level may act as a temporary barrier to further upward price movements, potentially causing a pause or retracement in the bullish trend. Additionally, it aligns with the 38.20% Fibonacci retracement, adding further strength to its potential as a resistance area.
The second resistance is located at 2000.43 is identified as an overlap resistance. This level has previously shown its significance as a price level where selling pressure has emerged.
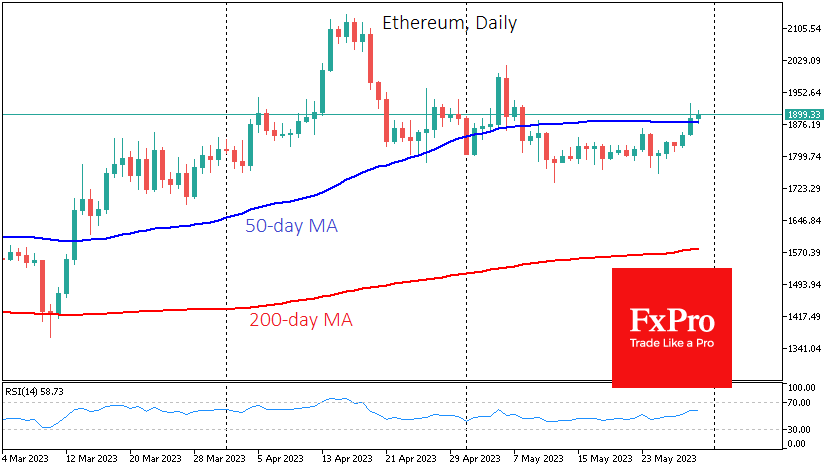
EUR/USD Daily Outlook
Daily Pivots: (S1) 1.0695; (P) 1.0720; (R1) 1.0733; More...
EUR/USD's fall from 1.1094 continues today and intraday bias stays on the downside. This decline is seen as correcting whole up trend from 0.9534, and should target 1.0515 cluster support, 38.2% retracement of 0.9534 to 1.1094 at 1.0498. On the upside, however, above 1.0757 minor resistance will turn bias to the upside for stronger rebound.
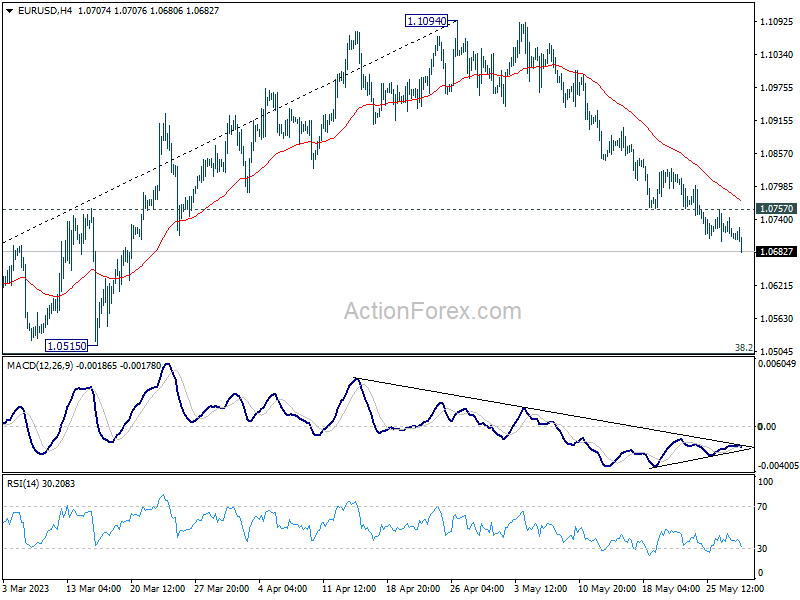
In the bigger picture, as long as 1.0515 support holds, rise from 0.9534 (2022 low) would still extend higher. Sustained break of 61.8% retracement of 1.2348 (2021 high) to 0.9534 at 1.1273 will solidify the case of bullish trend reversal and target 1.2348 resistance next (2021 high).