Sample Category Title
Has Silver Reversed?
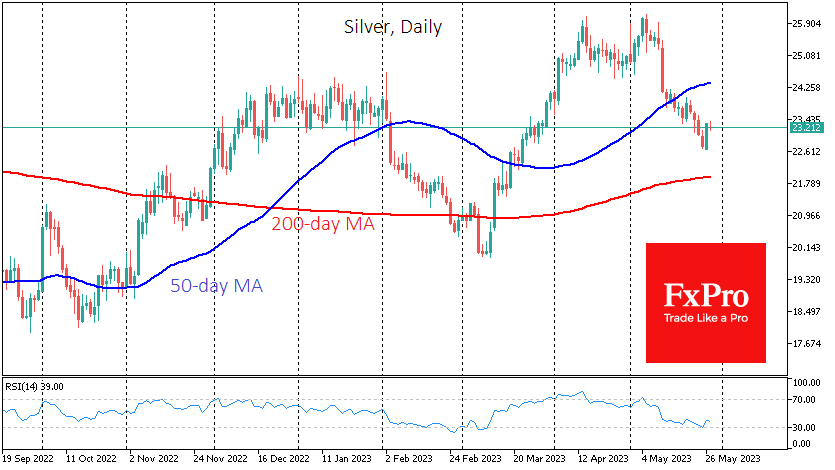
Silver jumped 2.8% on Friday, an important signal of the end of the bearish momentum that has seen the price fall by more than 13% in three weeks.
Although silver is resting on Monday along with most developed markets, Friday’s rally lets us speculate that we have seen more than profit-taking.
A strong bullish candle by a wide margin overcame Thursday’s decline and most of Wednesday’s, to produce the strongest daily gain since the 4th.
We also note that Friday’s bounce came from an oversold RSI on the daily timeframe, erasing just over half of the gains from the March lows.
The bounce in silver could take the price back to $24, a key circular level, relatively quickly.
Silver is often the canary in the mine for gold. If the former finds buyers’ support later this week, the same reversal can be expected for gold.
However, silver could also see a deeper correction to the $22 area, which is now the 200-day average.
Oil Once Again Needs to Confirm its Uptrend
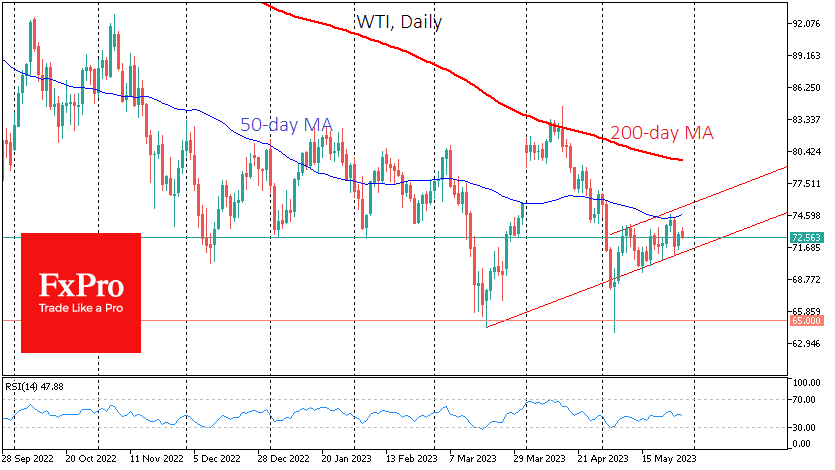
WTI remains within the upward trend formed in early May. However, be prepared for another test of this trend support at $71 and a possible move lower.
The current upward trend in oil has been shaped by signs that the economy continues to outperform expectations, showing resilience despite tighter financial conditions.
On the side of oil buyers, there was a wide range of factors, from increased demand for risky assets to signals from the US president’s administration that the strategic fuel reserve would soon begin to be replenished.
Despite all that, in the middle of last week, the rise in the price of a barrel of WTI stalled in the territory above $74.20. The local peak almost coincided with the 50-day moving average. We have already seen how aggressively the bears defend this trend indicator in early May.
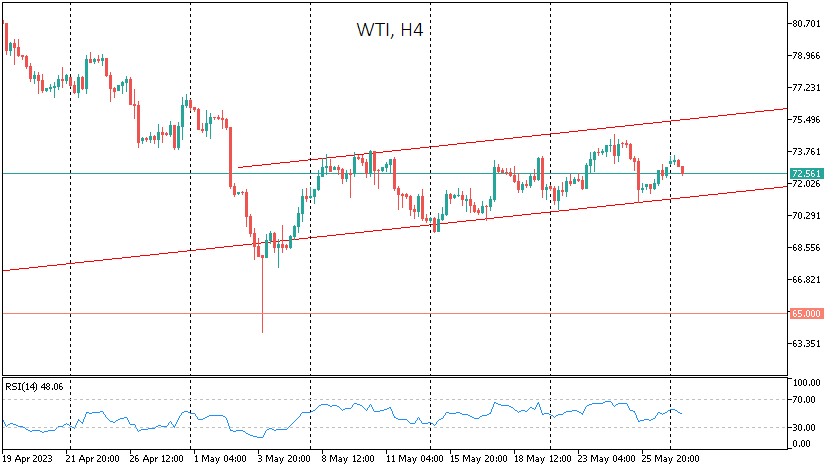
Last Thursday’s sell-off brought oil back to test support again, allowing only a slight retracement of the previous local highs.
Among the fundamentals, oil traders should consider the start of the US holiday season, which is already evident in the methodical decline in gasoline inventories over the past three weeks. In addition, commercial crude stocks have fallen by 12.4 million barrels. Crude oil stocks are now 8.4% higher than in the same week a year earlier but were above 16% in February. At the same time, an additional 1.6m barrels were sold from the strategic reserve.
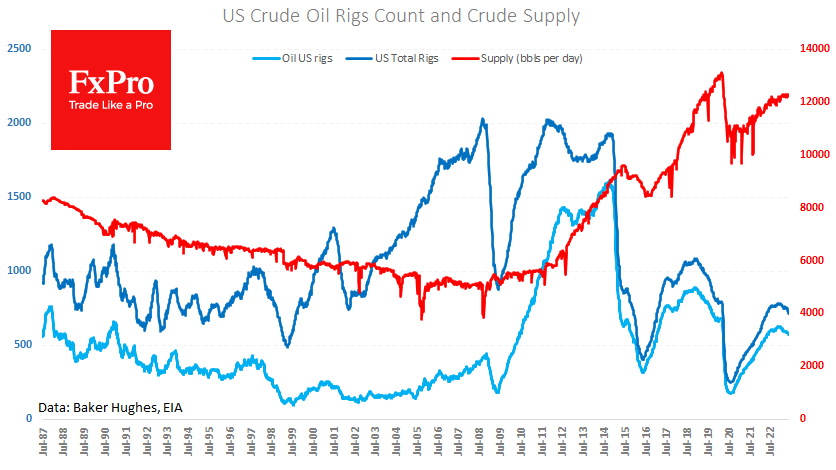
Moreover, Friday’s data from Baker Hughes showed a new fall in the number of drilling rigs in the USA: from 575 to 570 and Crude plus Gas count from 720 to 711. Thus, producers are still not interested in ramping up production. The answer to this indifference on the part of oil producers is most likely to be found in unfavourable financial conditions due to high-interest rates and the promotion of a green agenda.
Short-term, oil is under pressure from reports that Russia is successfully selling its diesel to Saudi Arabia, and the latter is exporting it to Europe. Meanwhile, offshore oil exports from Russia continue to rise. Saudi Arabia has also joined the IEA in noting that Russia has not cut production by 500,000 BPD, as promised earlier in the spring.
Local negative factors can send oil to a new test of trend support, which is now near $71. A fall below that would be significant evidence of a victory for the bears, potentially triggering a downside momentum towards $68 or even $65.
If oil gets another bout of downside support, it could be followed by a rally to $74.60-75.0.
GBPAUD Wave Analysis
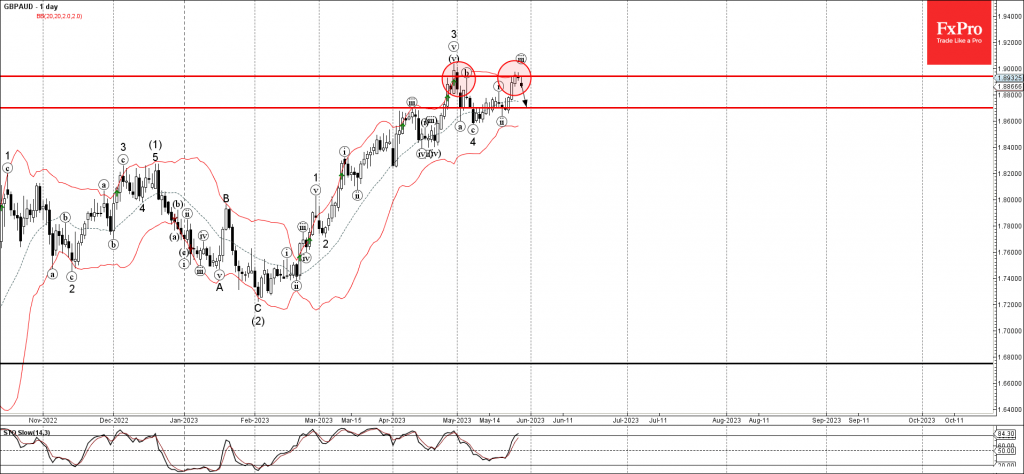
- GBPAUD reversed from strong resistance level 1.8940
- Likely to fall to support level 1.8700
GBPAUD currency pair recently reversed down with the downward gap from the strong resistance level 1.8940 (which stopped the previous waves 3 and (b)).
The downward reversal from the resistance level 1.8940 stopped the earlier sharp upward impulse waves (iii) and 5.
Given the overbought daily Stochastic and the strength of the nearby resistance level 1.8940, GBPAUD can be expected to fall toward the next support level 1.8700.
USDCHF Wave Analysis
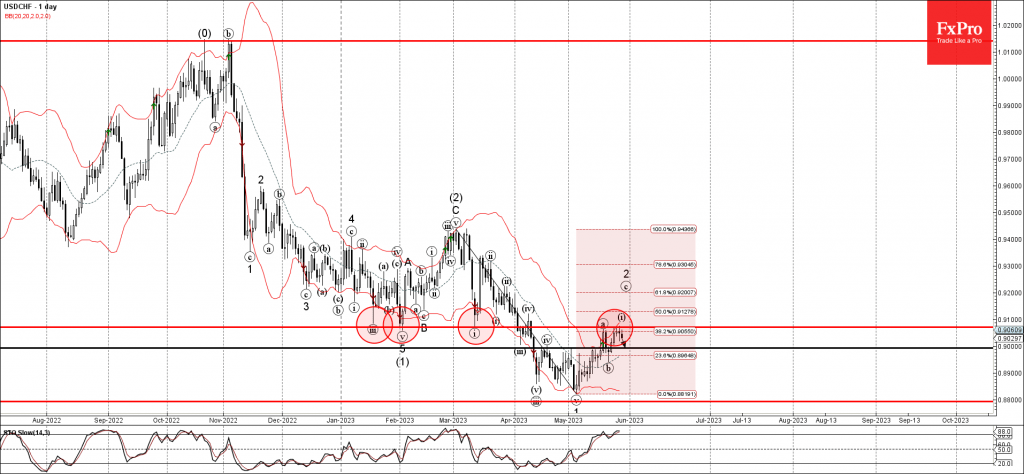
- USDCHF reversed from resistance level 0.9070
- Likely to fall to support level 0.9000.
USDCHF currency pair recently reversed down from the pivotal resistance level 0.9070 (former monthly low from January, February and March).
The resistance level 0.9070 was strengthened by the upper daily Bollinger Band and by the 38.2% Fibonacci correction of the downward impulse from the start of March.
Given the overbought daily Stochastic, USDCHF can be expected to fall toward the next round support level 0.9000.
GBP/USD Flat in Holiday-Thinned Trading
- US markets closed for bank holiday
- US debt ceiling agreement reached
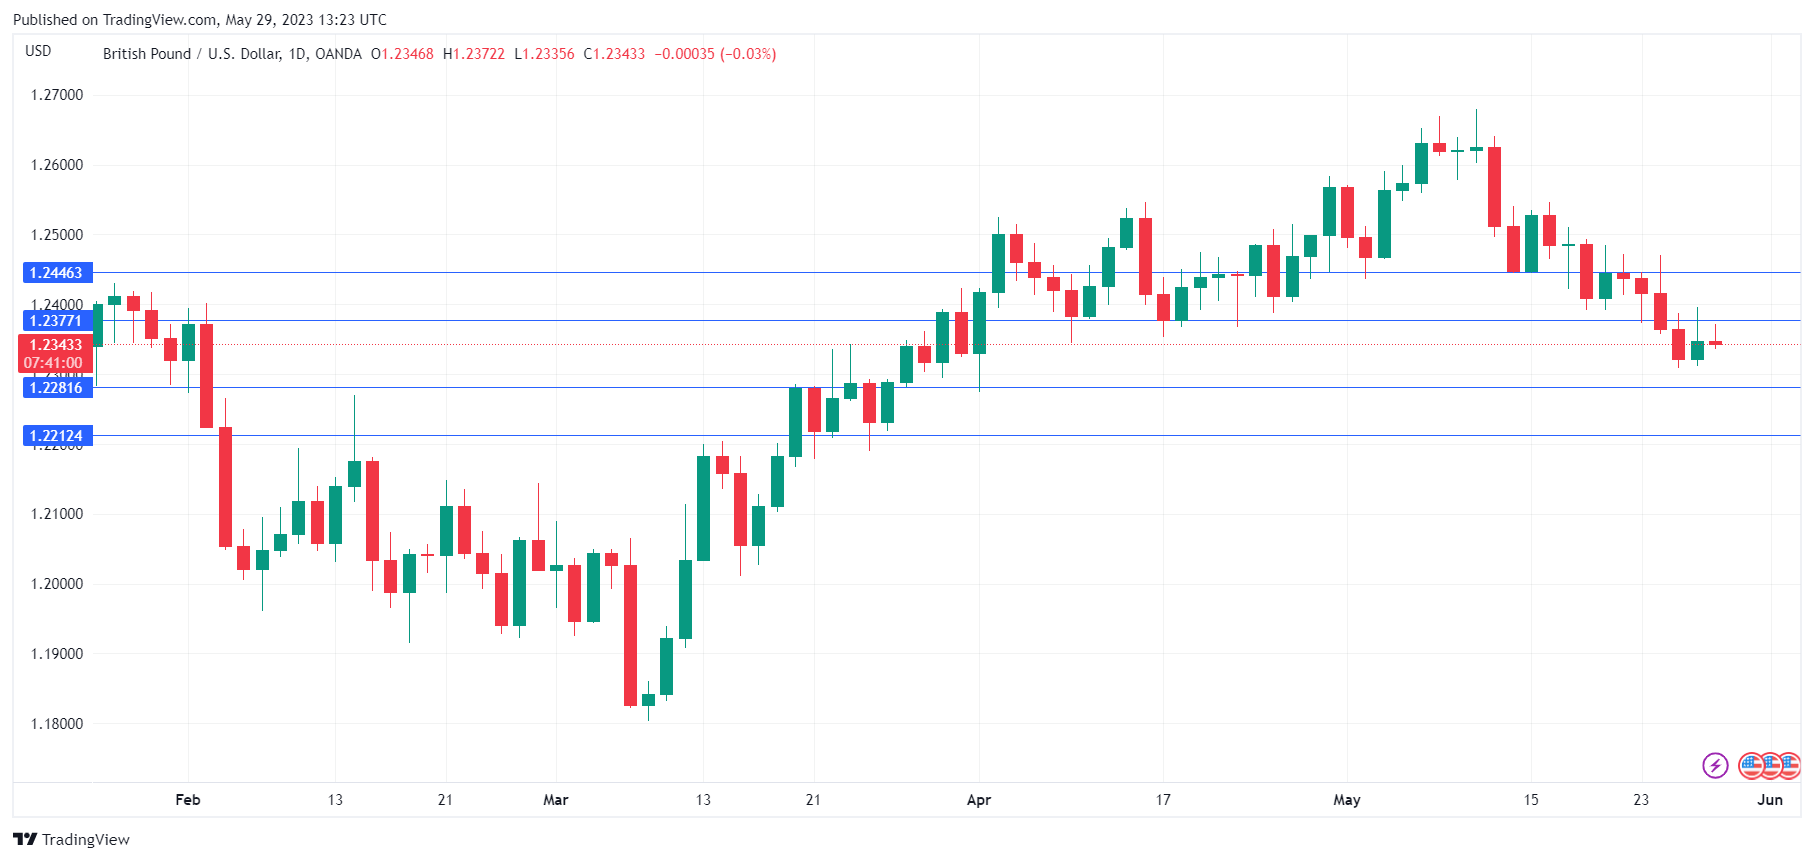
GBP/USD has started the week quietly. The pound is currently trading at 1.2342, almost unchanged. With US markets closed for Memorial Day, I expect little movement from GDP/USD during the day.
US debt ceiling crisis averted
After weeks of uncertainty, the US debt ceiling crisis appears over. The US has never defaulted on its debt, so one could argue that the crisis was manufactured by lawmakers who were intent on playing a high-stakes game of brinkmanship. The uncertainty jarred the markets, as risk sentiment fell and US yields and the US dollar moved higher. There’s little movement in the markets today with US markets closed, but we could see a reaction to the debt ceiling agreement on Tuesday. The agreement now moves on to Congress, where it is expected to be approved.
Sticky inflation could extend rate cycle
Will the Fed pause its rate hikes in June? Just a few weeks ago, the markets had projected a pause at 64%, but that has changed due to hawkish messages from the Fed and higher-than-expected inflation on Friday. Headline PCE price index climbed 0.4% on the month, versus an estimate of 0.0%, while the core reading jumped 0.8%, double the estimate.
The markets have now priced a 25-basis point hike at 64%, with a 36% probability of a pause, according to CME’s FedWatch. The US economy has been extremely resilient in the face of rising hikes and the Fed may have to tighten further, complicating its hopes of a soft landing for the economy.
GBP/USD Technical
- 1.2377 is a weak resistance line. Above, there is resistance at 1.2446
- 1.2281 and 1.2212 are providing support
EUR Remains Low Amidst Debt Ceiling Discussions: Technical Analysis and Market Outlook
The EUR remains at a low level, with the most traded currency pair in the market staying near 1.0730 on Monday.
Investors continue to focus on the issue of raising the US public debt limit. There are discussions underway between Congress and the White House regarding a framework agreement on increasing the debt ceiling.
It is expected that Republicans will agree to raise the borrowing limits by 4 trillion USD over two years if the Democrats allow for restrictions on non-defense spending in 2024.
As it is a public holiday in the US on Monday, official news is anticipated in the coming days. This week, the country will release important statistics, including labor market indicators for May.
Technical analysis:
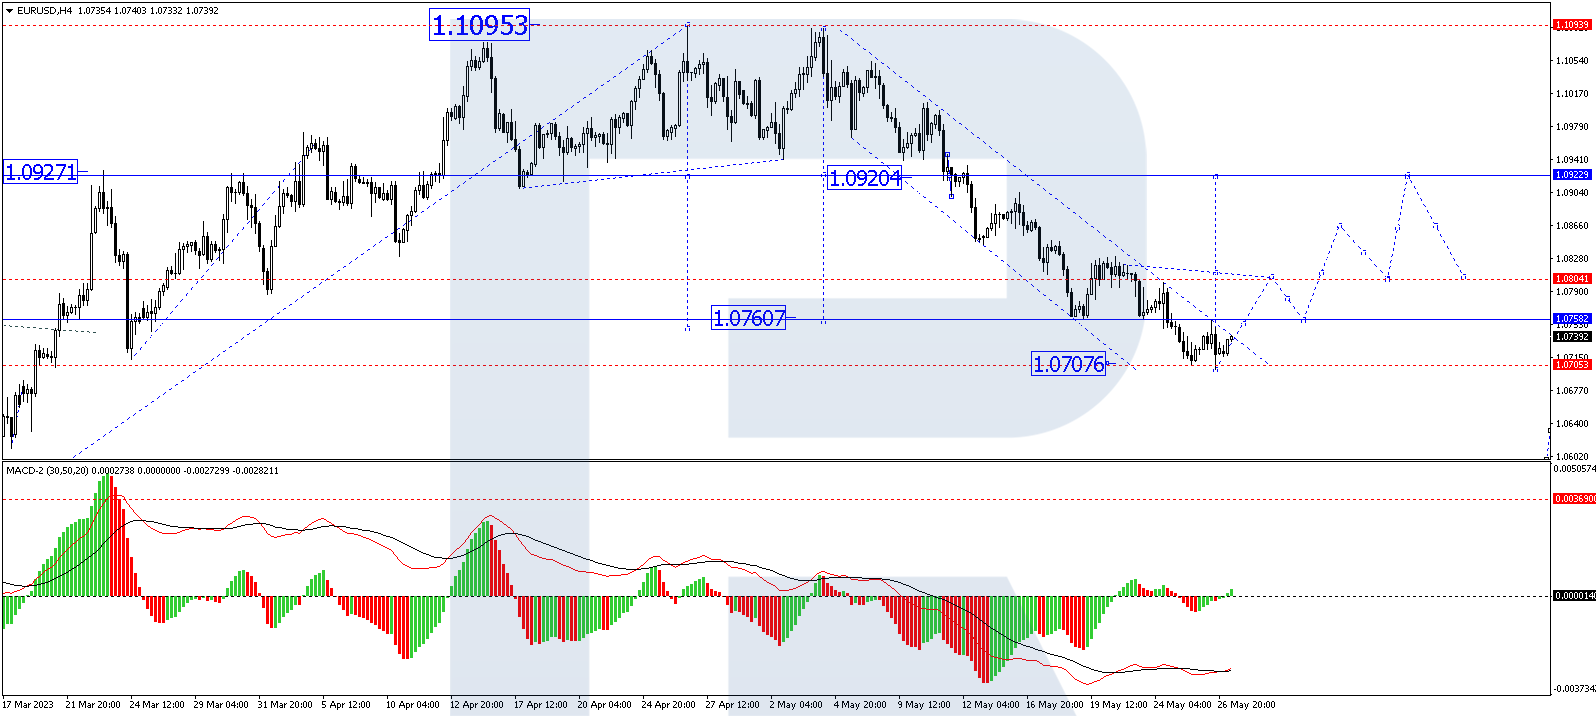
On the H4 timeframe, EUR/USD has completed a downward wave, reaching 1.0701. Currently, the market is correcting towards 1.0760. After the correction, a decline to 1.0730 can be expected. It is possible for a consolidation range to form around 1.0730. If the price breaks out of the range upwards, the correction might continue towards 1.0804, which is the initial target. This scenario is technically supported by the MACD, as its signal line is currently at lows below zero and preparing to rise towards the zero mark.
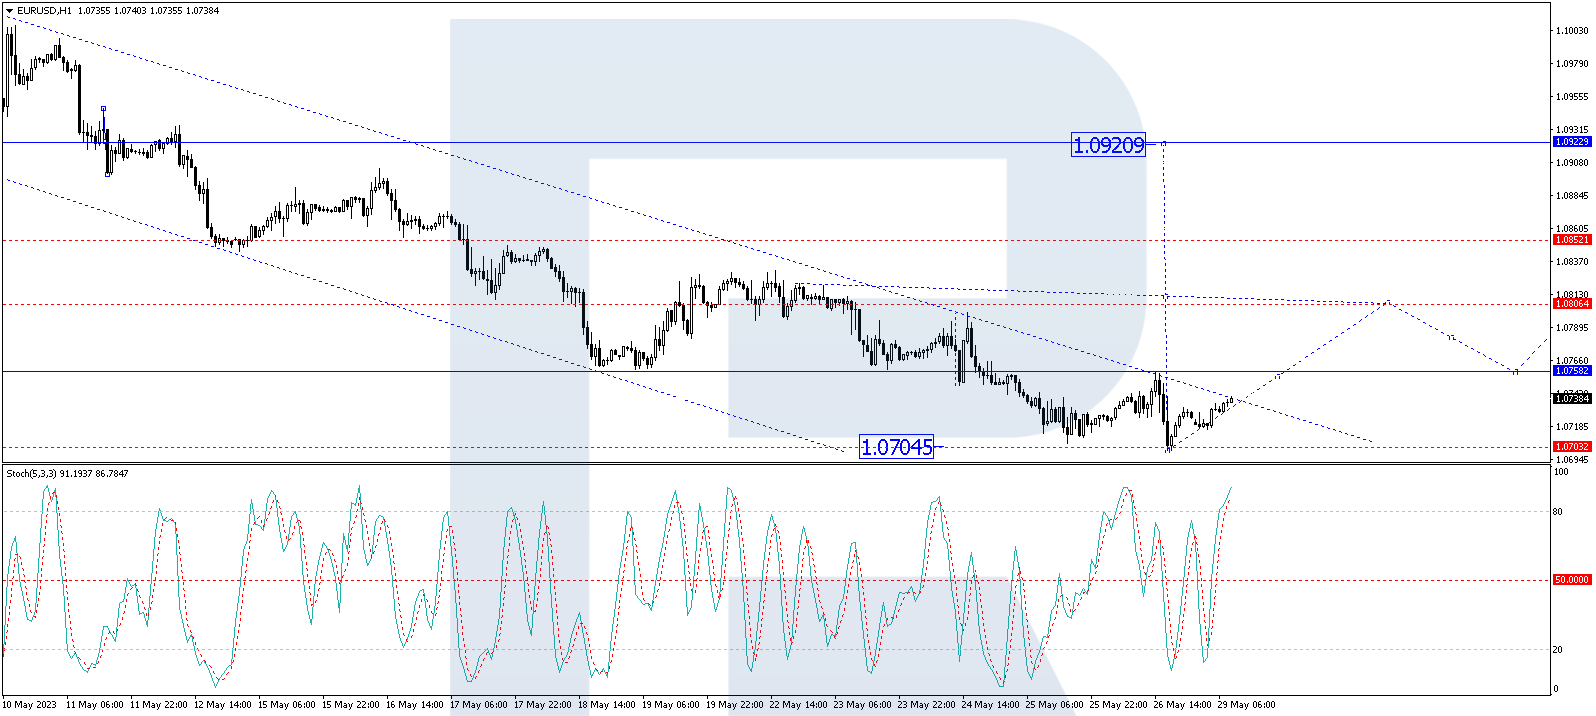
On the H1 timeframe, EUR/USD experienced a downward wave, reaching 1.0701. The market has made an upward impulse towards 1.0730 and is currently forming a consolidation range around this level. A potential upward structure might develop towards 1.0744, which is a local target. Once the price reaches this level, a decline to 1.0730 followed by a rise to 1.0760 is expected. The Stochastic oscillator confirms this scenario, as its signal line is near 80. A decline to 50 could occur today, after which a rise towards 80 may follow.
ECB’s Resolve to be Tested by a Potential Downside Surprise in Inflation
Another week has just started, and it is another test for the ECB’s commitment to deliver price stability. With growth slowing down considerably, as seen at last week’s weaker business surveys, the focus turns to inflation figures. Could a mixed set of data create second thoughts at the ECB and put a (temporary?) stop to the recent euro/US dollar decline?
Where are we now?
With the US flirting with a debt default and a likely loss of its AAA rating, the euro area is experiencing a weaker growth patch. This was not widely expected considering the lower downside risks, especially as energy costs have been aggressively declining over the past few months. The much-expected Chinese reopening continues to disappoint, having a ripple effect across the globe and particularly affecting the German manufacturing powerhouse.
Does that mean that the ECB will pause in June? Based on the recent comments from president Lagarde and various members of the governing council, the ECB remains committed to its inflation target. Understandably, the hawks will maintain their hawkish commentary since the inflation rate remained elevated and negotiated wages have reached record high levels, increasing the chances of the much-dreaded second-round effects.
However, the doves are expected to make more frequent appearances, using last week’s growth data to justify their inflation-easing expectations for the second quarter of 2023. Similar to BoE’s strategy, the doves believe that weaker economic data could help them stop the imminent rate hikes.
May’s CPI will be the key release of the week
Amidst this environment, this week we have the release of the May CPI figures. The preliminary numbers from Germany and France are expected on Wednesday with the euro area aggregate scheduled to be released a day later. The national CPIs are seen edging lower to 6.5 % and 6.8% year-on-year (YoY) change respectively, still at extremely elevated levels. It is worth noting that French CPI remains just a tad below the recent high of 7.3% and it has not recorded yet the easing seen in other euro area countries’ figures.
Having said that, professional forecasters have penciled in a sizeable drop in the euro area aggregate from the 7% YoY change in April to 6.3% in May. If this is confirmed, it will be the lowest print since March 2022; a sign that the ECB's restrictive monetary policy is working.
Should the actual figures deviate from market expectations, there is an asymmetric risk in terms of the possible surprises. An upside surprise will not materially affect market expectations for the next ECB meeting unless the figure climbs considerably above April’s 7% print. On the other hand, a much weaker outcome would clearly raise questions about the three extra rate hikes that the market is currently pricing in, a view also shared by most investment banks. This probable outcome could also remove a strong tailwind for the euro over the past few months.
Extra focus on German data
With the first quarter of 2023 remaining in negative territory of -0.3% GDP change on a quarterly basis, and the various business surveys portraying a rather weak environment for firms, the market will pay extra attention to incoming German data. With unemployment remaining at a record low level, Thursday's retail sales would be an interesting read. Despite the higher wage increases, the retail sector remains under pressure. The annual rate of change remains in deeply negative territory, flirting with a double-digit drop. The recent reduction in energy prices could provide some breathing space, but potentially not enough to cause a significant improvement.
Euro range-trading against the pound
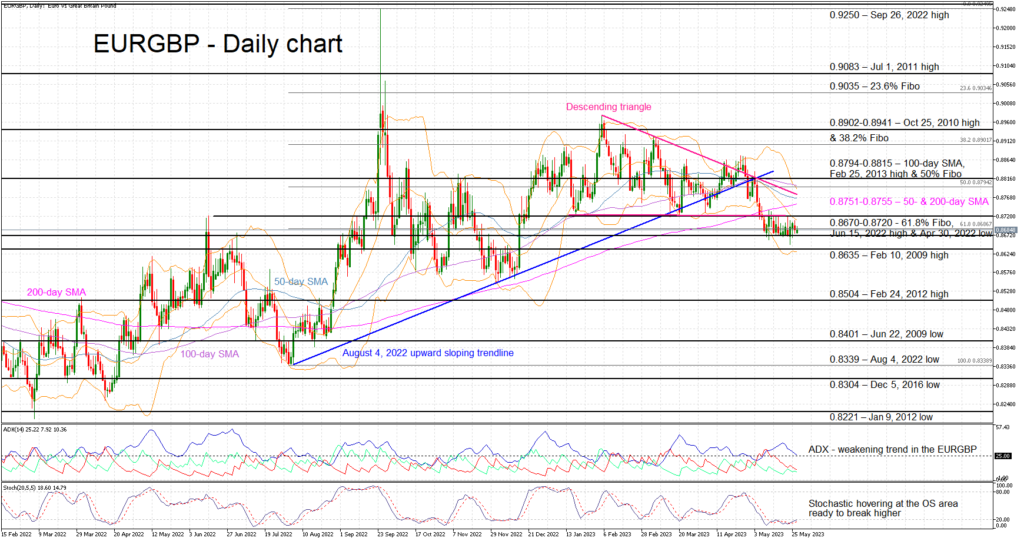
Contrary to the continued underperformance against the US dollar and despite last week’s upside surprise at UK’s inflation, euro bulls have managed to keep the euro/pound pair in a tight range. A downward breakout from the formed descending triangle has also taken place, but it appears to lack the strength for a more sustained correction.
At this juncture, a positive set of data this week would allow the euro bulls to recapture the 0.8720 level and target the busier 0.8751-0.8766 area that is defined by the 50- and 200-day simple moving averages (SMAs). On the other hand, a much weaker inflation print will finally help the euro bears overcome the key 0.6870 and 0.6835 levels respectively, opening the door for a stronger move towards the 0.8500 area.
Loonie Looks to Canadian GDP Data for Direction Ahead of BoC Decision
GDP figures due on Wednesday (12:30 GMT) are expected to show that growth in the Canadian economy likely accelerated in the first quarter of 2023. The report will be the last major one before the Bank of Canada’s June 7 policy meeting. After a string of better-than-expected data lately, can upbeat GDP numbers sway policymakers to resume their rate hiking cycle? For the Canadian dollar, though, which has been rangebound against its US counterpart all year, there might be some short-term gains from a solid report.
Is the slowdown over?
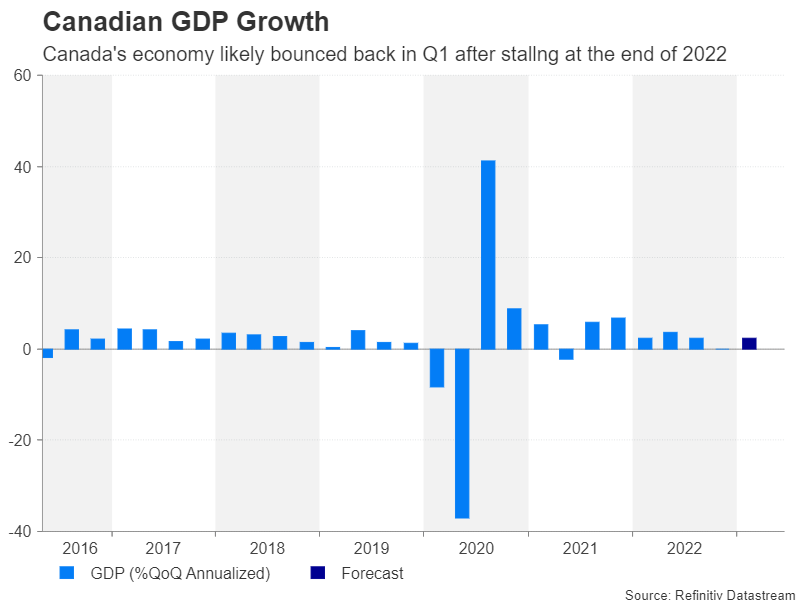
Canada’s economy stagnated at the end of 2022 as higher inflation and interest rates started to bite for consumers and inflicted pain on the housing sector. Businesses, meanwhile, drew down their inventories and economic output as a whole was unchanged from the prior quarter.
The jobs market on the other hand has remained surprisingly buoyant and is supporting households amid the restraint on spending from rising borrowing costs. Exports are also estimated to have performed strongly between January and March, and even the housing market appears to be bottoming out.
For the quarter, GDP is expected to have expanded by an annualized 2.4% rate compared to the prior three months, signalling a return in growth momentum. But would a pickup in the economy necessarily be good news for policymakers?
An economic rebound might not be so welcome
The labour market is showing no sign of slowing down and with the unemployment rate at decade lows and wage growth running above 5%, there’s a risk that things could heat up even more. There are similar risks for the property sector. Despite the steep downturn in 2022, the bubble may not have popped just yet as there is some evidence suggesting that the lower prices are reviving demand as some houses become affordable again.
But what the Bank of Canada is probably most worried about is the fact that headline CPI unexpectedly edged up in April, rising to 4.4%. Although it is too early to jump to any conclusions from one month’s data and underlying measures of inflation continue to head lower, it is something the Bank will be watching very closely.
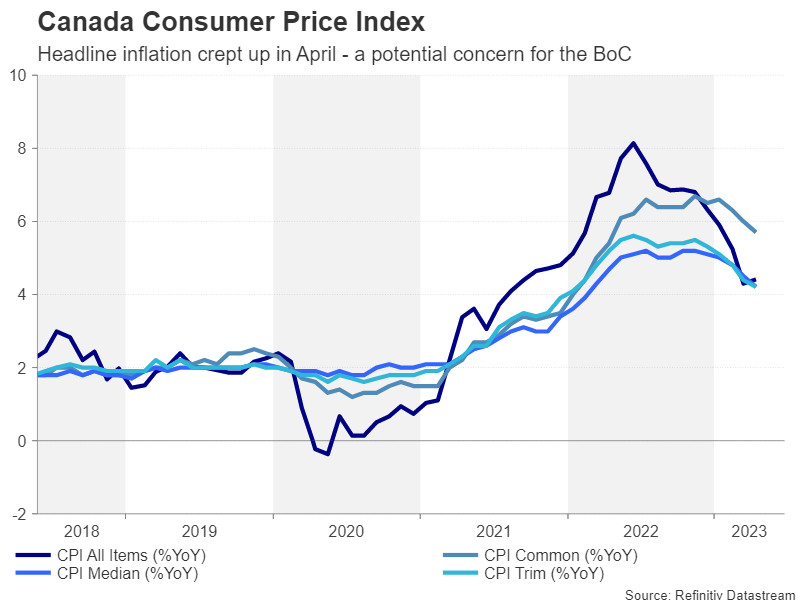
The BoC expects the bounce back in Q1 GDP to be short lived and that growth in the rest of the year will be rather weak. If that does not turn out to be the case, there’s a strong possibility that policymakers will be compelled to restart their tightening campaign.
Loonie eyeing one more rate hike by BoC
Expectations of one additional 25-basis-point rate hike in 2023 have been gathering pace lately so faster-than-expected GDP growth in Q1 could further boost those odds, lifting the loonie.
Dollar/loonie could seek immediate support in the C$1.35 region from any rally in the Canadian currency. This is also the 38.2% Fibonacci retracement of the August-October 2022 uptrend. If broken, traders might next target the recent troughs around C$1.33.
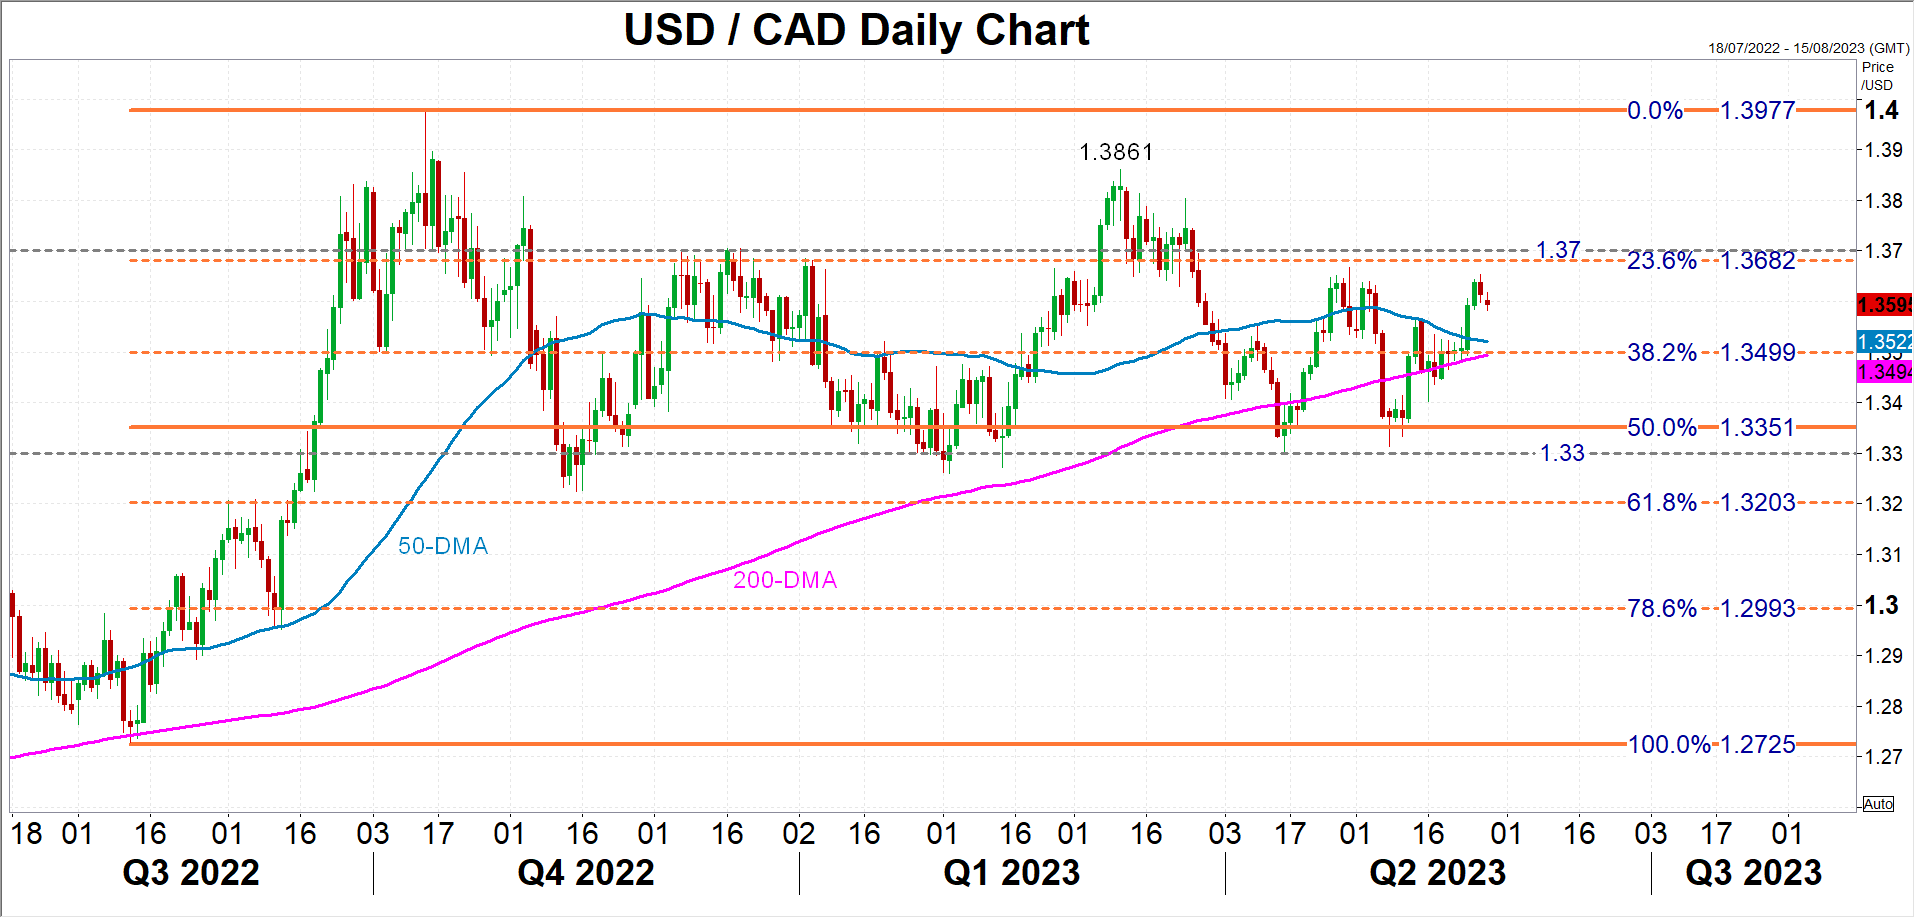
However, if the GDP data underwhelms and the greenback is still broadly on the front foot, dollar/loonie could aim for the C$1.37 level slightly above the 23.6% Fibonacci before having another go at the March peak of C$1.3861.
In the bigger picture, the pair has been consolidating since October 2022, but looking more closely, it has been developing within a symmetrical triangle. This puts a potential breakout on the radar, although that could still be months away.
US 500 Index Posts Fresh 9-Month Peak
The US 500 stock index (cash) has been in an uptrend since mid-March, slicing through crucial technical regions such as its 50- and 200-day simple moving averages (SMAs). In addition, the index jumped to a fresh nine-month high of 4,232 in today’s session before paring some gains.
The short-term oscillators are endorsing the latest upside move. Specifically, the MACD jumped above its red signal line in the positive region, while the RSI is flatlining above its 50-neutral mark.
Should the price attempt another advance, the nine-month peak of 4,232, which overlaps with the July 2021 bottom, could act as initial resistance. Conquering this barricade, the bulls might then challenge the October 2021 low of 4,270. A violation of that zone could open the door for the August 2022 high of 4,325.
On the flipside, if the index experiences a pullback, immediate support could be found at 4,146, which is the 78.6% Fibonacci retracement of the 4,325-3,489 downtrend. Piercing through that wall, the price could challenge 4,100 before the double-bottom region of 4,048 comes under scrutiny. A break below the latter may trigger a retreat towards the 61.8% Fibo of 4,006.
In brief, the US 500 index stormed to a fresh nine-month high amid some positive developments regarding the US debt-ceiling negotiations. However, a downside correction should not be ruled out as the latest advance pushed the price above its upper Bollinger band, indicating that it approached overbought conditions.

XAU/USD: Near-Term Directionless Mode Extends
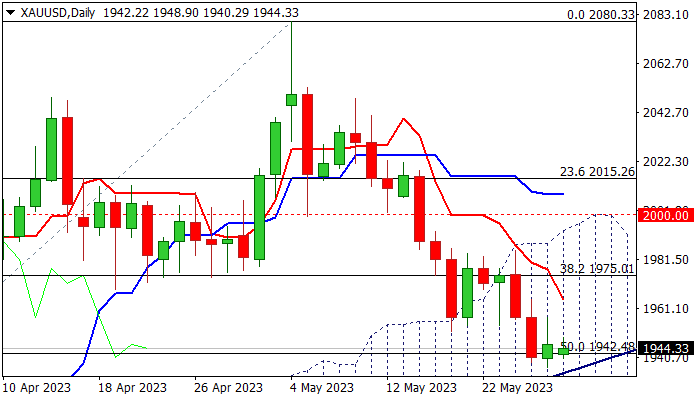
Gold is trading in a narrow-range sideways mode for the second straight day, hovering above new multi-week low and nearby trendline support ($1936).
Metal’s price is stuck between two opposite forces – optimism about eventual deal in debt ceiling deal (positive) and signs that the Fed may keep high interest rates for longer period (negative).
Prolonged indecision on mixed fundamentals suggests that traders look for fresh direction signals, as daily technical studies also show conflicting signals on overall bearish structure but oversold conditions.
Initial bullish signal to be expected on close above falling 10DMA ($1964) and signal verification to be seen on extension above $1975/93 (broken Fibo 38.2% of $1804/$2080 / daily cloud top).
On the other hand, larger bears would tighten grip after current consolidation if price break below trendline support / 100DMA ($1936) and signal confirmation expected on close below daily cloud base ($1926).
Res: 1964; 1975; 1985; 1993.
Sup: 1936; 1926; 1918; 1909.