Sample Category Title
Gold Pauses Decline But Bearish Bias Holds
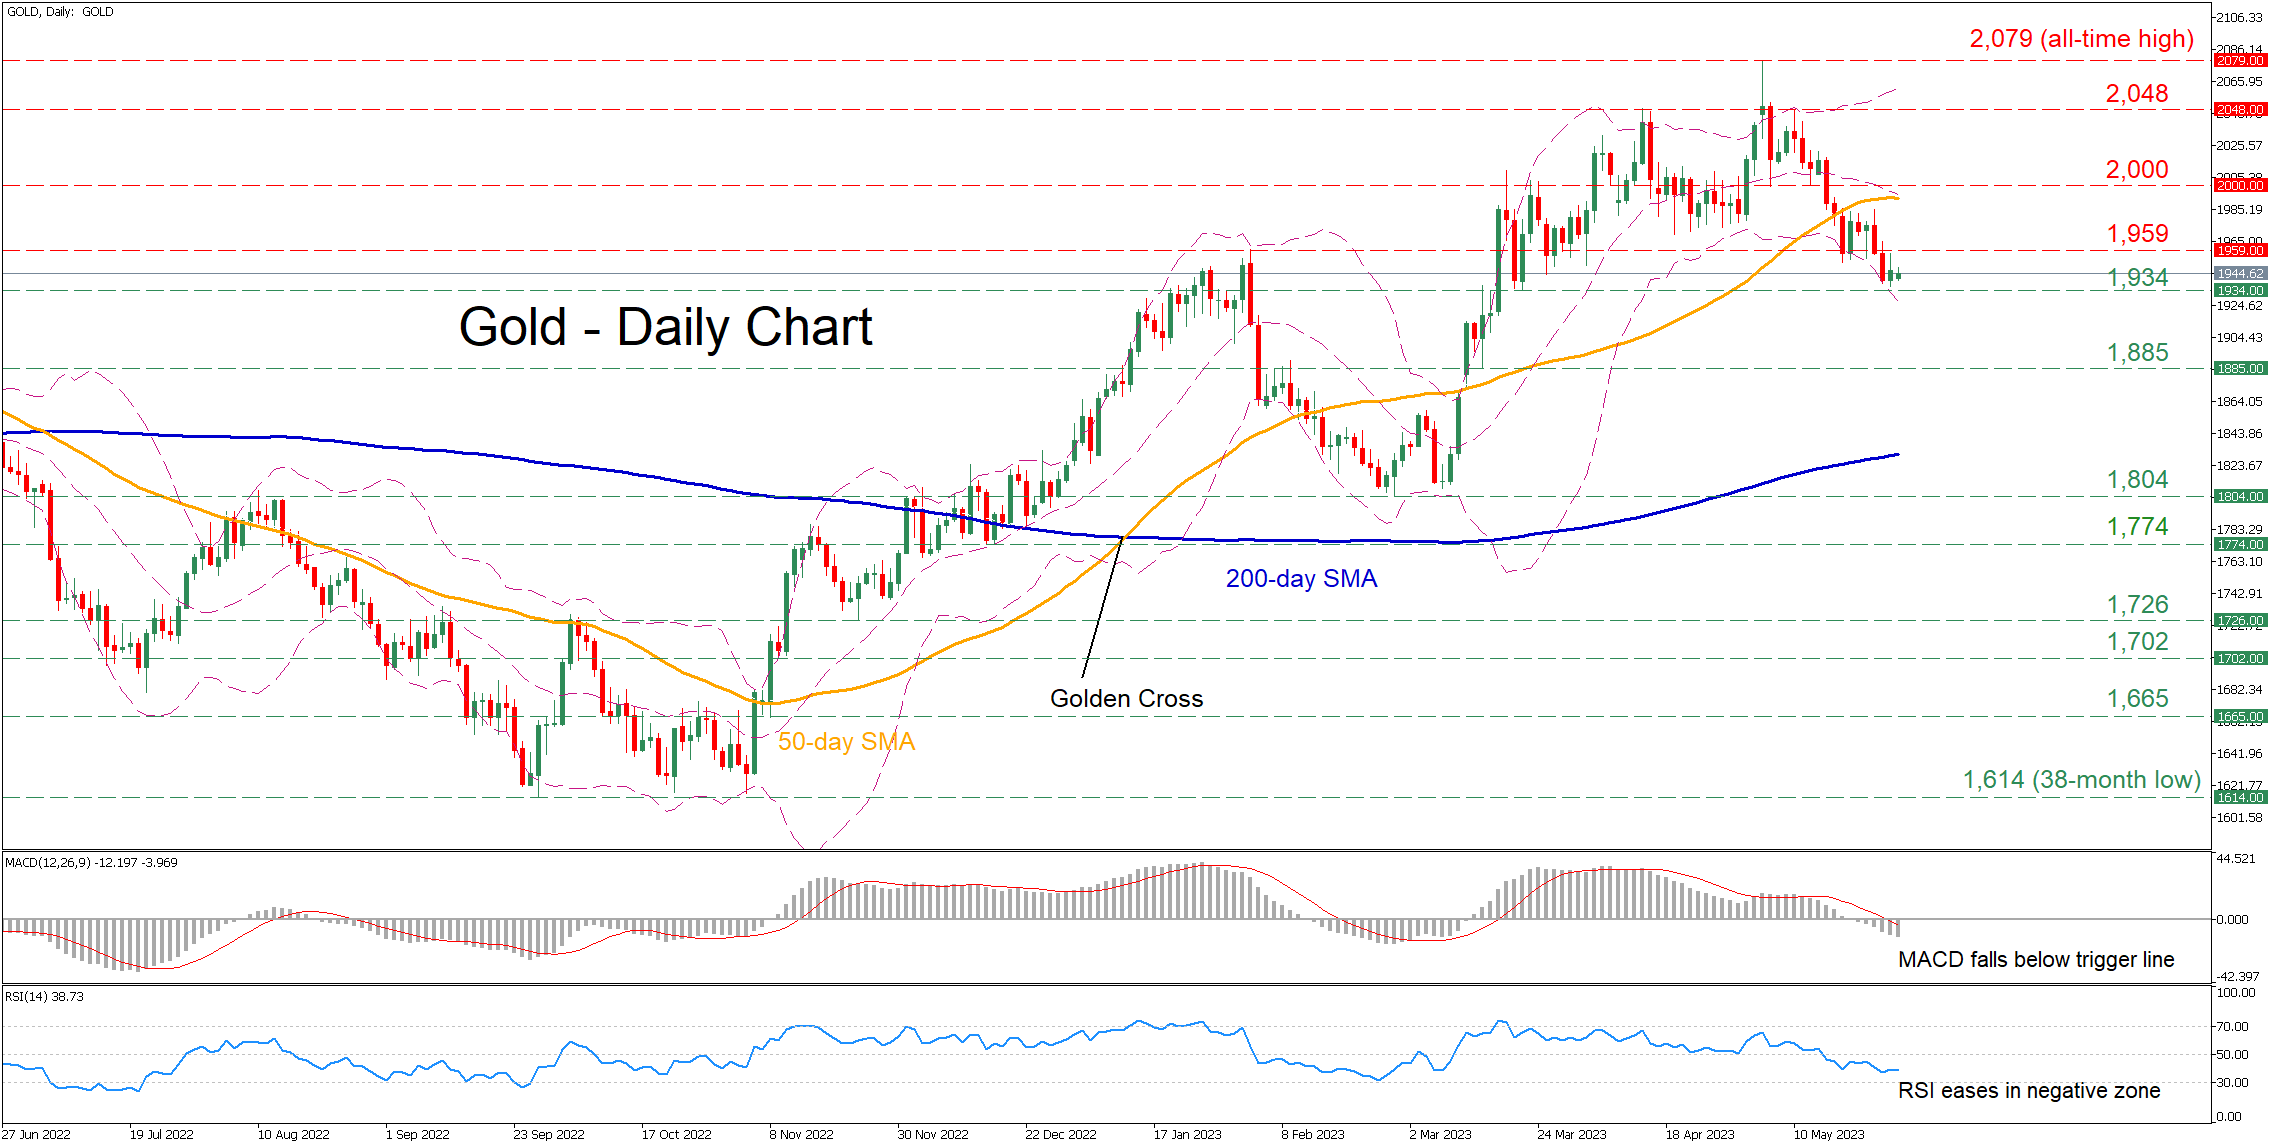
Gold experienced a remarkable surge since early March, surpassing some crucial technical levels to peak near the all-time high of 2,079 in early May. However, bullion has been in a steady downtrend since then, falling beneath its 2,000 psychological mark and creating a bearish structure of consecutive lower lows.
The momentum indicators currently suggest that bearish forces reign supreme. Specifically, the MACD is softening beneath zero and its red signal line, while the RSI has flatlined below its 50-neutral mark.
If the downside correction extends, the price could challenge the March support of 1,934. Should that barricade fail, the spotlight could turn towards 1,885 before the 2023 bottom of 1,804 gets tested. Further declines might then cease at 1,774.
Alternatively, should buyers regain the upper hand, the February high of 1,959 could prove to be the first barrier for the price to clear. A violation of that zone could set the stage for the 2,000 psychological mark before 2,048 comes under examination. Failing to halt there, the price could ascend to test the all-time high of 2,079.
Overall, gold has been losing ground in the short-term, appearing to be unable to halt its retreat. For that bearish sentiment to alter, the price needs to reclaim the 50-day simple moving average (SMA).
EUR/USD: Larger Bears to Remain Intact While Key 1.0800 Resistance Zone Caps Recovery
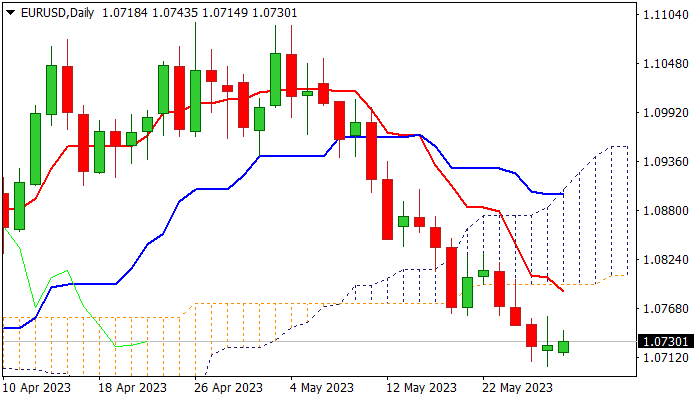
The Euro edges higher in early Monday trading, generating initial bullish signal on formation of reversal pattern on daily chart, after Friday’s Doji candle signaled indecision.
Oversold daily studies and weaker dollar on growing optimism about US debt ceiling deal, contribute to euro’s fresh strength.
Stochastic is emerging from oversold territory on daily chart and 14-d momentum turned up (still deeply in the negative zone) sending initial positive signals.
Today’s close above Friday’s high (1.0758) is seen as a minimum requirement in formation of reversal pattern, which will keep renewed bulls in play for attack at key barriers at 1.0800 zone (falling daily Tenkan-sen / Fibo 23.6% of 1.1095/1.0701 / base of thickening daily cloud).
Sustained break here is needed to generate stronger bullish signal and open way for recovery towards 1.0852 (Fibo 38.2%) and 1.0898 (daily Kijun-sen / 50% retracement of 1.1095/1.0701).
Conversely, failure to clear pivotal 1.0800 zone would keep larger bearish structure intact and offer better selling opportunities.
Res: 1.0758; 1.0800; 1.0831; 1.0852.
Sup: 1.0700; 1.0652; 1.0631; 1.0600.
US Oil: Intermediate Correction (B) Completion Hints at the Beginning of a Bearish Impulse (C)
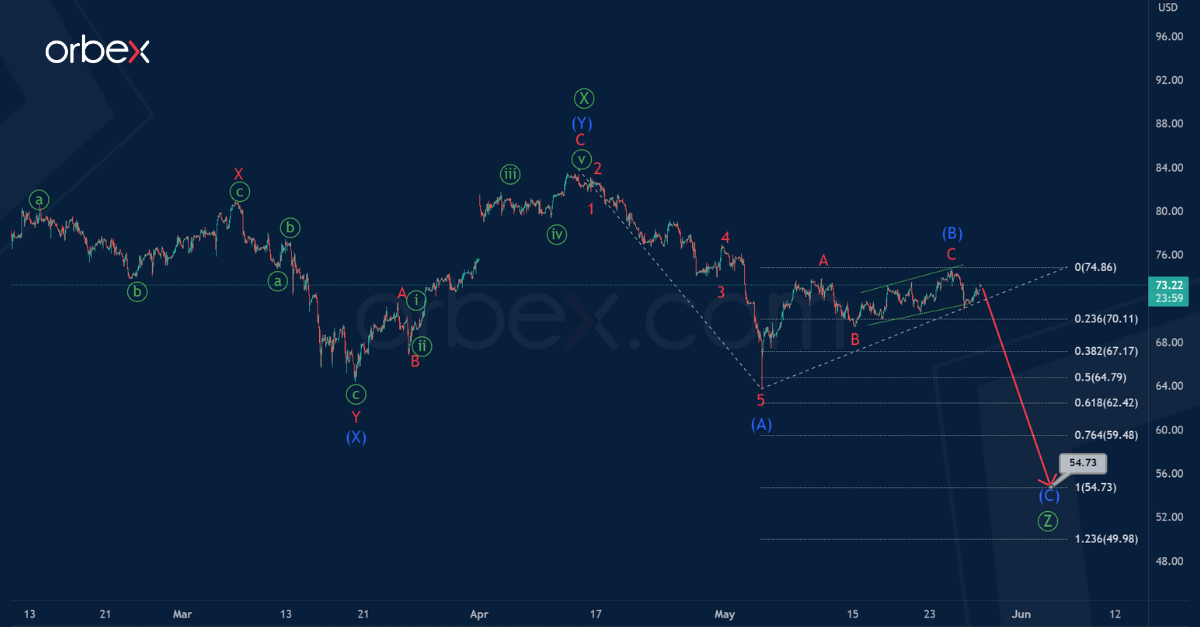
We considered the USOIL situation more than three weeks ago. We see that the formation of a large bearish trend continues, taking the form of a triple zigzag Ⓦ-Ⓧ-Ⓨ-Ⓧ-Ⓩ.
It seems that the final part of this triple zigzag is being built, that is, the sub-wave Ⓩ. It is possible that the primary wave Ⓩ will have the form of a simple 3-wave zigzag (A)-(B)-(C) of the intermediate degree.
The intermediate impulse wave (A) and the zigzag correction (B) look completed. Thus, in the near future, the price may fall in the sub-wave (C).
Wave (C) is likely to strive for equality with impulse (A), so its end is expected near 54.73.
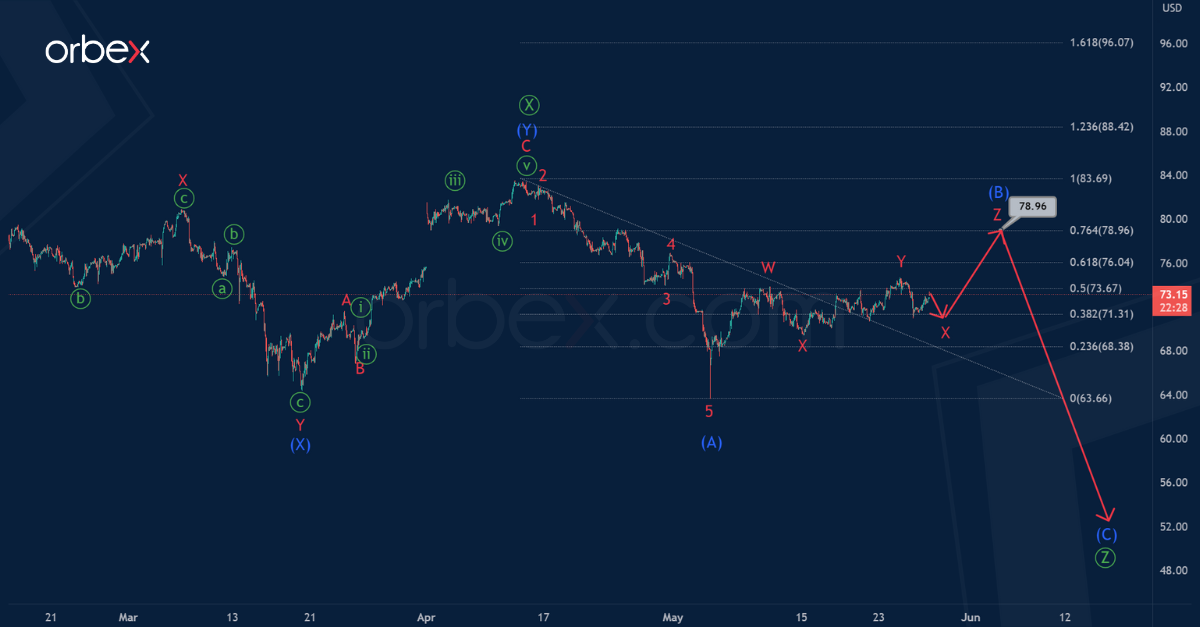
Let's consider an alternative scenario in which the correction wave (B) can take on a more complex internal structure.
Perhaps, with a bullish movement, we will see how the correction (B) ends in the form of a triple zigzag W-X-Y-X-Z. Now we can notice the completed W-X-Y sub-waves.
In the near future, the development of minor sub-waves X-Y is expected, as shown in the chart, approximately near 78.96.
At that level, correction (B) will be at 76.4% of impulse (A).
Gold Price Technical Analysis
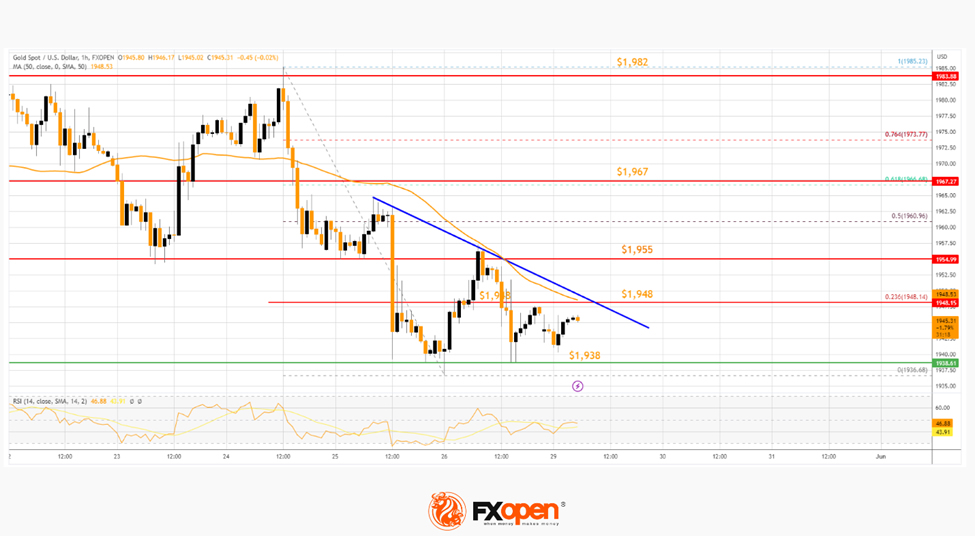
Gold price started another decline from the $1,982 zone against the US Dollar. The price traded below the $1,955 level to move further into a bearish zone.
There was a clear move below the $1,950 level and the 50-hour simple moving average. A low was formed near $1,936 before the price is now consolidating losses. The bulls are now facing resistance near a connecting bearish trend line at $1,948 on the hourly chart.
The next main resistance could be near the $1,955 level, above which the price could rise toward the $1,967 level. Any more gains might send the price toward $1,982.
On the downside, immediate support is near the $1,938 level. The next major support is near the $1,932 level, below which the price might decline toward the $1,920 support level in the near term.
GBP Still Under Pressure
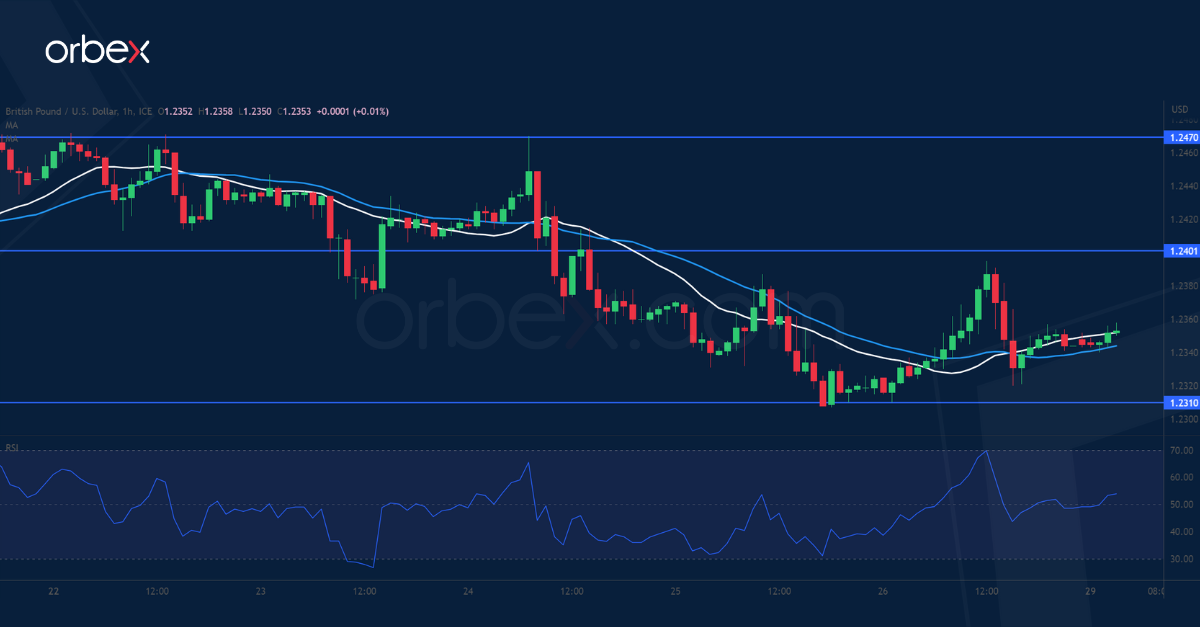
GBP/USD struggles to bounce
The US dollar advanced after consumer spending grew more than expected in April. The price action is still looking to regain a foothold after breaking above the double top at 1.2440. 1.2310 is the latest level where some buyers have stepped in and they must clear offers around 1.2400 first to alleviate the downward pressure. Then only a close above 1.2470 next to the 20-day SMA would flush out selling interests and pave the way for a sustained rally. On the downside, a lack of support would drive cable towards 1.2200.
EUR/JPY continues to climb
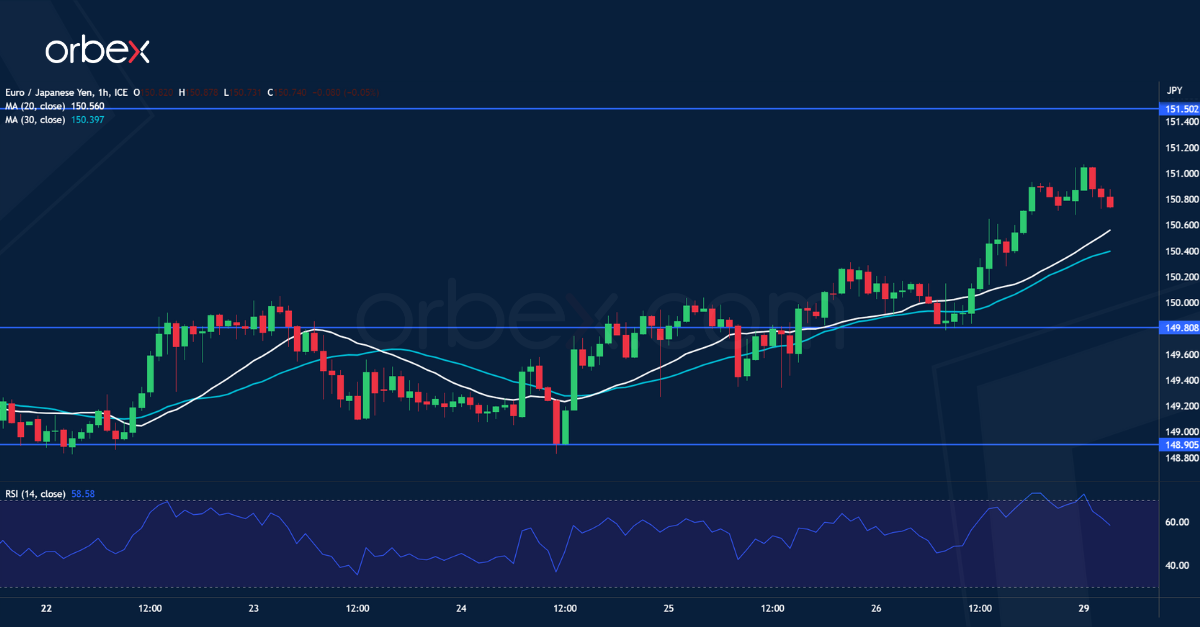
The Japanese yen weakens as traders expect the BoJ to maintain yield curve control. The pair has held on to its gains after breaking above 149.20, with 148.90 seeing solid bids before the euro started to climb again. A series of higher lows indicates a rising bullish pressure which is likely to attract follow-through buying. The recent peak of 151.50 is a major ceiling ahead and its breach would signal a bullish continuation in the medium-term. On the flip side, a fall below 149.80 would lead to a test of 148.90 on the 20-day SMA.
DAX 40 finds support
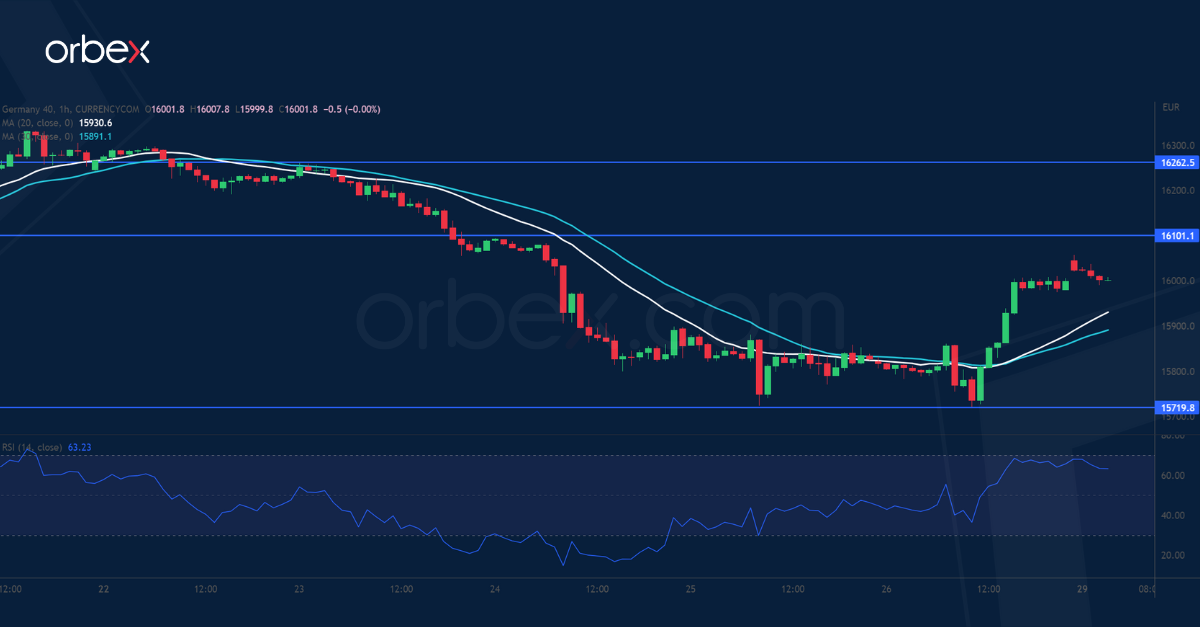
Equities rallied after the US Treasury extended the deadline for raising the debt limit. The Dax 40’s drop below the daily support of 15800 and the 20 and 30-day SMAs has dented the short-term enthusiasm, shaking off the weak hands. However, the bulls may not have had their last word yet as general sentiment remains upbeat. The demand zone 15700-15720 saw support from trend followers after the RSI recovered from the oversold area. 16100 is the immediate hurdle and a close above 16260 would resume the uptrend.
Forex and Cryptocurrency Forecast
EUR/USD: Dollar Awaits U.S. Bankruptcy
The dollar has been rising since May 4. Last week, on May 26, the DXY Index reached 104.34. It hasn't been this high since mid-March 2023. What is driving the U.S. currency up and, consequently, pushing the EUR/USD pair down? According to analysts at Commerzbank, "the absolute calmness in the options market suggests that the driving force behind the EUR/USD exchange rate is monetary policy considerations rather than ongoing U.S. debt ceiling negotiations." It is worth noting that the probability of a rate hike at the June 14 FOMC (Federal Open Market Committee) meeting increased throughout May. At the beginning of the month, the likelihood of a rate increase was close to 0%, but by the end of the month, it reached 50%. It turns out that the U.S. economy is holding up very well compared to other economies, and the deterioration in lending has not been as severe or rapid as initially feared.
Of course, 50% is far from 100%. Moreover, the FOMC published the minutes of its latest meeting on Wednesday, May 24, and the key phrase regarding the possibility of additional tightening of monetary policy was absent. The document also revealed divergent opinions among committee members regarding further rate hikes. However, despite this, the flight to safety in anticipation of a potential U.S. default continued to support the dollar.
The United States government has been living with a debt that has already exceeded $31 trillion. If Congress does not raise its permissible limit by June 1, the U.S. will declare default. Treasury Secretary Janet Yellen has already warned about this multiple times. However, the actual date of bankruptcy may vary slightly from the "X Day" on June 1. For example, Deutsche Bank points to the end of July, while Morgan Stanley mentions either June 7-14 or July 21-28, and Goldman Sachs even suggests the end of September.
The authors of the British publication The Economist are alarming readers, stating that U.S. bankruptcy will cause a collapse in global stock markets and sow panic in the global economy. According to the estimates of the White House Council of Economic Advisers, the securities market will plummet by 45% in the first months of the crisis. Moody's agency predicts a decline of about 20%, but unemployment will increase by 5%.
As for politicians, discussions about extending the debt ceiling continue. On Wednesday, May 24th, Kevin McCarthy, the Speaker of the United States House of Representatives, noted that there is still work to be done to reach an agreement. However, he added that the country will not declare default. President Joe Biden also expressed confidence in reaching a deal with Republicans. An agreement is in the interests of both parties, as next year is an election year in the United States.
David Malpass, the President of the World Bank, stated in an interview with CNN that he does not expect a default and explained that such situations occur every few years. (For reference, the U.S. debt ceiling has existed since 1917 and has been raised 78 times since 1960).
As mentioned earlier, statistics indicate that the U.S. economy is feeling relatively confident. The GDP estimate for Q1 was revised upward from 1.1% to 1.3%. At the same time, the number of initial unemployment claims, forecasted at 250K, actually decreased to 229K. Durable goods orders increased by 1.1%. This figure followed a growth of 3.3% in March and exceeded market expectations, which anticipated a 1.0% decrease. Finally, the April National Activity Index from the Chicago Fed rose from -0.37 to +0.07.
Investment bank Goldman Sachs predicts further strengthening of the dollar due to the lack of an attractive alternative among other currencies. According to the bank's experts, there is currently no serious contender for the reserve status of the dollar in the world, including the euro. Unlike the American economy, the Eurozone does not please investors. If the preliminary estimate of Germany's GDP for Q1 was -0.1%, the reality showed a decline to -0.3%. Additionally, the Purchasing Managers' Index (PMI) for Germany's manufacturing sector declined (42.9 compared to the previous value of 44.5 and a forecast of 45.0), as did the country's business climate index (IFO) (91.7 compared to the previous value of 93.4 and a forecast of 93.0).
Starting the week at 1.0805, on May 25, EUR/USD reached a local low of 1.0701, and by the end of the five-day workweek (Friday evening, May 26), it is trading around 1.0725. As for the near-term prospects, at the moment, the majority of analysts (55%) anticipate a correction to the upside. 20% expect further strengthening of the dollar, while the remaining 25% hold a neutral position. Among the indicators on the daily chart (D1), there is a significant advantage for the dollar: 100% of oscillators are coloured in red (although a third of them signal oversold conditions for the pair), and among the trend indicators, 85% favour the red side (15% are on the green side). The nearest support for the pair is located around 1.0680-1.0710, followed by zones and levels at 1.0620 and 1.0490-1.0525. Bulls will encounter resistance around 1.0800-1.0835, followed by 1.0865, 1.0895-1.0925, 1.0985, 1.1045, 1.1090-1.1110, 1.1230, 1.1280, and 1.1355-1.1390.
The upcoming week features several notable events. The US Consumer Confidence Index will be published on Tuesday, May 30. The following day will bring unemployment and Consumer Price Index (CPI) data, while on Thursday, Germany's Purchasing Managers' Index (PMI) for business activity will be released. On June 1st, the preliminary Consumer Price Index (CPI) for the Eurozone and the minutes of the European Central Bank's latest Monetary Policy Committee meeting will be published. Additionally, a significant number of US economic data will be released, including labour market data and the Institute for Supply Management's (ISM) PMI for the US manufacturing sector. As is customary, the first Friday of summer will see another round of US labour market statistics, including the unemployment rate and the number of non-farm payroll jobs created in the country. Traders should also note that Monday, May 29, is Memorial Day in the United States, and there will be no trading.
GBP/USD: One Step Forward, One Step Back
Indeed, GBP/USD has been moving with one step forward and one step back recently. Although it appears to be heading downwards, a closer look at the chart reveals that it ended the week on Friday, May 26, at the same level it had reached in April and a week ago. On one hand, the strengthening dollar is pushing the pair down. On the other hand, hopes that inflation will prompt the Bank of England (BoE) to continue raising interest rates prevent it from plummeting into the abyss.
Fresh consumer inflation (CPI) data in the UK turned out to be significantly higher than expected. The April release showed a rise in consumer prices by 1.2% compared to the previous month's 0.8%. The core CPI reached multi-year highs, reaching 6.8% YoY instead of the forecasted 6.2%. Although the annual inflation rate slowed from 10.1% to 8.7%, it still exceeded the projected 8.2%. While it is the lowest level in 13 months, it remains well above the target level.
In response to this data, Bank of England Monetary Policy Committee member Jonathan Haskel stated that he would not comment on market prices but could not rule out further rate hikes. Another important figure, Chancellor of the Exchequer Jeremy Hunt, also expressed support for tightening monetary policy, even if it harms the economy. In an interview with Sky News, he stated that "it's not a trade-off between tackling inflation and recession; ultimately, the only route to sustainable growth is reducing inflation." Many analysts believe that if the Bank of England indeed raises rates by another 1.0%, the UK economy will fall into a recession, putting significant pressure on the pound.
At the time of writing, GBP/USD is trading around 1.2350. The current analyst consensus is nearly neutral, with 40% bullish, 30% bearish, and another 30% refraining from commenting. Among the oscillators on the D1 timeframe, 100% recommend selling (20% indicate oversold conditions). Among the trend indicators, the ratio between red and green stands at 65% to 35%. In the event of a southward movement, the pair will encounter support levels and zones at 1.2300-1.2330, 1.2275, 1.2200, 1.2145, 1.2075-1.2085, 1.2000-1.2025, 1.1960, and 1.1900-1.1920. If the pair rises, it will face resistance levels at 1.2390, 1.2480, 1.2510, 1.2540, 1.2570, 1.2610-1.2635, 1.2675-1.2700, 1.2820, and 1.2940.
As for the upcoming events in the following week, traders can enjoy a day off on Monday, May 29, in both the UK and the US as it is a public holiday. However, Thursday, June 1, is worth noting as it will reveal the Manufacturing Purchasing Managers' Index (PMI) for the country's manufacturing sector.
USD/JPY: Yen Receives "Ticket to the Moon"
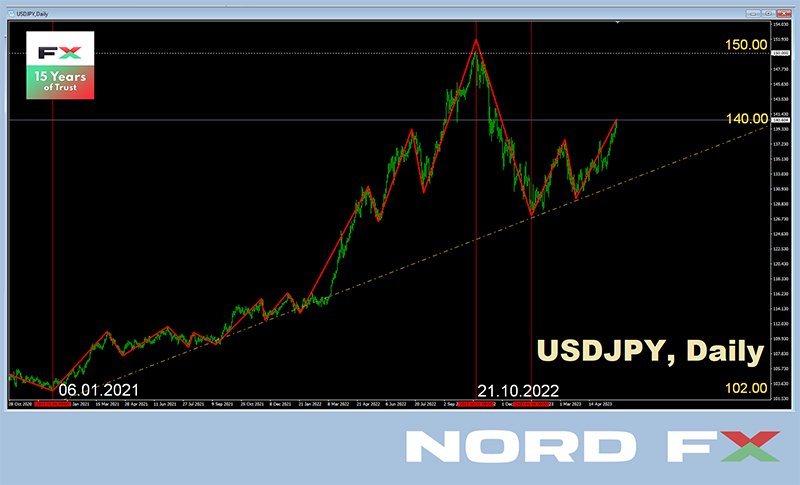
Вue to the ongoing ultra-accommodative policy of the Bank of Japan (BoJ) and similar statements from its new Governor Kadsuo Ueda, the yen was the weakest currency in the DXY basket in April. With a high probability, it will retain this title in May as well. Last week, USD/JPY continued its journey to the Moon. Starting at 137.93 on Monday, it reached above 140.70 on Friday evening, with a finish slightly lower in the 140.60 zone.
According to many analysts, the dovish stance of the Bank of Japan could continue undermining the Japanese currency and suggests that the path of least resistance for USD/JPY is upwards. This is supported by prospects of further interest rate hikes by the US dollar and new rising Treasury yields, increasing the interest rate differential between the US and Japan and encouraging a flow of funds from JPY to USD.
Regarding the near-term prospects of USD/JPY, analysts' opinions are divided as follows. Currently, 75% of them are hoping for at least a short-term strengthening of the Japanese currency and a correction to the south. Only 25% of experts vote for the continuation of the upward trajectory. Among the indicators on the daily chart, the US dollar has an absolute advantage, with 100% of trend indicators and 100% of oscillators pointing north (though 25% of the oscillators indicate overbought conditions for the pair). The nearest support level is located in the 139.85 zone, followed by levels and zones at 138.75-139.05, 137.50, 135.90-136.10, 134.85-135.15, 134.40, 133.60, 132.80-133.00, 132.00, 131.25, 130.50-130.60, and 129.65. The closest resistance is at 141.40, and then bulls will need to overcome obstacles at levels 142.20, 143.50, and 144.90-145.10. The October 2022 high of 151.95 is not far from there.
There is no significant economic information related to the Japanese economy expected for the upcoming week.
CRYPTOCURRIENCIES: Bitcoin Needs a Trigger
Bitcoin remains under pressure from sellers for the tenth consecutive week. However, despite the struggle, it manages to hold its ground in the strong support/resistance zone around $26,500. On Thursday, May 25, amid the strengthening of the dollar, bears launched another attack and pushed the BTC/USD pair down to the $25,860 level. A similar attack was observed on May 12 when the pair dropped to $25,799. But both attacks were repelled, and the storm did not occur.
Investors nostalgically recall the impressive start of the leading cryptocurrency in the first quarter of this year. However, since then, a period of calm and declining trading activity to three-year lows has set in. Some analysts believe that the current price fails to generate enthusiasm among both sellers and buyers. In this situation, investors are hesitant to spend money. According to the analytics agency Glassnode, long-term holders (over 155 days) have accumulated 14.5 million BTC coins. If we add the reserves of cryptocurrency exchanges and other aggregators to this figure, it will be even higher. Even short-term speculators have fallen into a state of hibernation. The market needs a trigger, which could be either decisions by the Federal Reserve regarding monetary policy or an announcement of a US government debt default.
There are two possible scenarios: either a default will be declared (which is unlikely), or it will not. In the first case, if a default occurs, investor confidence in the US dollar as a reserve currency will sharply decline, benefiting bitcoin as a safe haven asset. In the second case, if there is no default, it will become more challenging for cryptocurrencies. To replenish cash reserves, the US Treasury will issue a large number of bonds, causing their yields to rise, and investors will prefer to invest their money in these securities rather than BTC.
However, it is important to note that the announcement of a default could have a significant impact on the stablecoin market. It is worth remembering that Tether, the issuer of USDT, is one of the largest holders of US Treasury bills, surpassing countries like Thailand and Israel. The volume of these debt securities on Tether's balance sheet is $53 billion, or 64% of its own reserves. It is these reserves that support the liquidity of USDT. If a default occurs, then 1 stablecoin will be worth not $1 but only 36 cents. Alternatively, it is possible that it will simply cease to exist along with Tether.
Indeed, the situation is highly ambiguous. Furthermore, industry participants continue to be concerned about increasing regulatory pressure. It is worth noting that in 2023 alone, the US Securities and Exchange Commission (SEC) has filed complaints against cryptocurrency exchanges Bittrex, Coinbase, Kraken, Gemini, and Genesis. Additionally, the Commodity Futures Trading Commission (CFTC) has filed a lawsuit against Binance and its CEO, Changpeng Zhao. According to Yassine Elmandjra, an analyst at ARK Invest, this situation discourages new players and has a negative impact on existing companies, prompting them to flee from the United States to more crypto-friendly countries such as the UAE, South Korea, Australia, and Switzerland. (According to Coin Metrics, bitcoin trading volume in the US has declined by 75% over the past two months, from $20 million per day in March to $4 million in May).
Michael Saylor, the CEO of MicroStrategy, believes that active regulatory intervention will actually benefit bitcoin because it will create problems for its competitors. Saylor pointed out the increased investor interest shifting towards bitcoin from other tokens. According to him, BTC's competitors naturally fall away after more persistent regulation of the industry. This became particularly noticeable after SEC Chairman Gary Gensler stated that "all but bitcoin" fall under securities laws. Saylor believes that "crypto tokens and crypto securities will be regulated, and perhaps cease to exist. Bitcoin is the only commodity that the SEC is not going to regulate. Bitcoin is the safest network and the safest asset." He expects a continuous capital outflow from the rest of the crypto space into Bitcoin, and he already sees the beginning of a new bullish cycle. (As of April 4, 2023, MicroStrategy, along with its subsidiaries, held approximately 140,000 BTC, making it one of the largest holders of the cryptocurrency. The company paid a total of $4.17 billion for them. Thus, the average purchase price was $29,803 per bitcoin).
The opposite opinion is held by Bloomberg analyst Mike McGlone, who expects a collapse in the bitcoin price to the support level of $7,366. This forecast is based on the descending movement of the 52-week moving average (MA) on the BTC chart. McGlone notes that before the powerful pump in 2020, this line, on the contrary, was moving upwards. According to the expert, the negative trend will continue, and the cryptocurrency will face challenging times. (It should be noted that not long ago, at the end of last year, McGlone was looking in a completely different direction. At that time, according to his version, bitcoin was supposed to rise to $100,000).
In the absence of fundamental triggers, experts are paying more attention to technical analysis. For example, a trader known as Dave the Wave, who has made several accurate forecasts, believes that currently Bitcoin is consolidating in the "buying zone" of the logarithmic growth curve. This curve evaluates long-term highs and lows of the leading cryptocurrency throughout its lifecycle, ignoring short-term volatility. The analyst notes that based on the current market structure, a breakout signal from the consolidation channel would be a rise above $32,000. Therefore, according to Dave the Wave, any purchase below $31,000 is still considered an excellent deal. Based on his conservative estimate, the target price for bitcoin by the end of the year should be around $40,000.
Michael van de Poppe, an analyst, trader, and founder of the consulting platform EightGlobal, informed his Twitter followers that a successful retest of support at the $26,280 level (MA200) could mark the completion of the correction and consolidation for the leading cryptocurrency. Therefore, it is advisable to buy bitcoins at such a level. "If we look at past periods, the retest of the 200-day moving average has always been an excellent time to accumulate bitcoins. Over the past six months, Bitcoin has spent a long time below this indicator, making it [BTC] undervalued. The next week will be crucial - a quick retest and bounce upward will signify the end of the bitcoin correction," explains the crypto analyst. Michael van de Poppe is confident that for bitcoin to confirm future growth, it needs to firmly establish itself above $27,000.
The well-known saying goes, "Different people, different opinions." In this case, it can be paraphrased as "Different analysts, different forecasts." The opinions of representatives from the crypto community, surveyed by the online publication BeInCrypto, also turned out to be quite contradictory. For example, the forecast of popular blogger CryptoKaleo does not exclude the possibility of bitcoin reaching a new local high. Signals that indicate a bet on the coin's growth were also noticed by a trader known as DaanCrypto. He paid attention to the bounce of BTC from the weekly MA200 moving average. From a technical analysis perspective, such behavior of the cryptocurrency may indicate the strength of buyers.
On the other hand, crypto blogger Nebraskangooner sees signals for a decline on the chart. His forecast does not rule out a drop in the cryptocurrency to $25,500. According to the blogger, this is indicated by the coin's exit from the symmetrical triangle formation on the chart. The negative Bitcoin forecast was supported by the usually optimistic analyst Inmortal, who pointed to a target level of $22,000. However, Inmortal is confident that the cryptocurrency will be able to recover its position promptly.
As of the evening of Friday, May 26, BTC/USD is trading at $26,755. The total market capitalization of the crypto market stands at $1.123 trillion ($1.126 trillion a week ago). The Crypto Fear & Greed Index has remained relatively unchanged over the past seven days and is currently in the Neutral zone at a level of 49 (48 points a week ago).
Technical Outlook and Review
DXY:
The XAU/USD chart currently exhibits bearish momentum, indicating the potential for further downward movement.
In the short term, there is a possibility of a bearish reaction off the first resistance level at 105.65, which is identified as an overlap resistance. This level could act as a price ceiling and trigger a drop towards the first support.
The first support level at 103.43 is recognized as a pullback support, suggesting it could provide a price floor and support any potential declines.
Additionally, there is a second support level at 100.80, identified as a multi-swing low support, further reinforcing its significance as a potential price floor.
On the resistance side, the second resistance level at 107.87 is an overlap resistance, indicating its importance as a potential barrier for the price’s upward movement.
Furthermore, there is an intermediate resistance level at 104.63, recognized as a pullback resistance and coinciding with a 78.60% Fibonacci extension. This level could pose additional obstacles for the price if it attempts to rise.
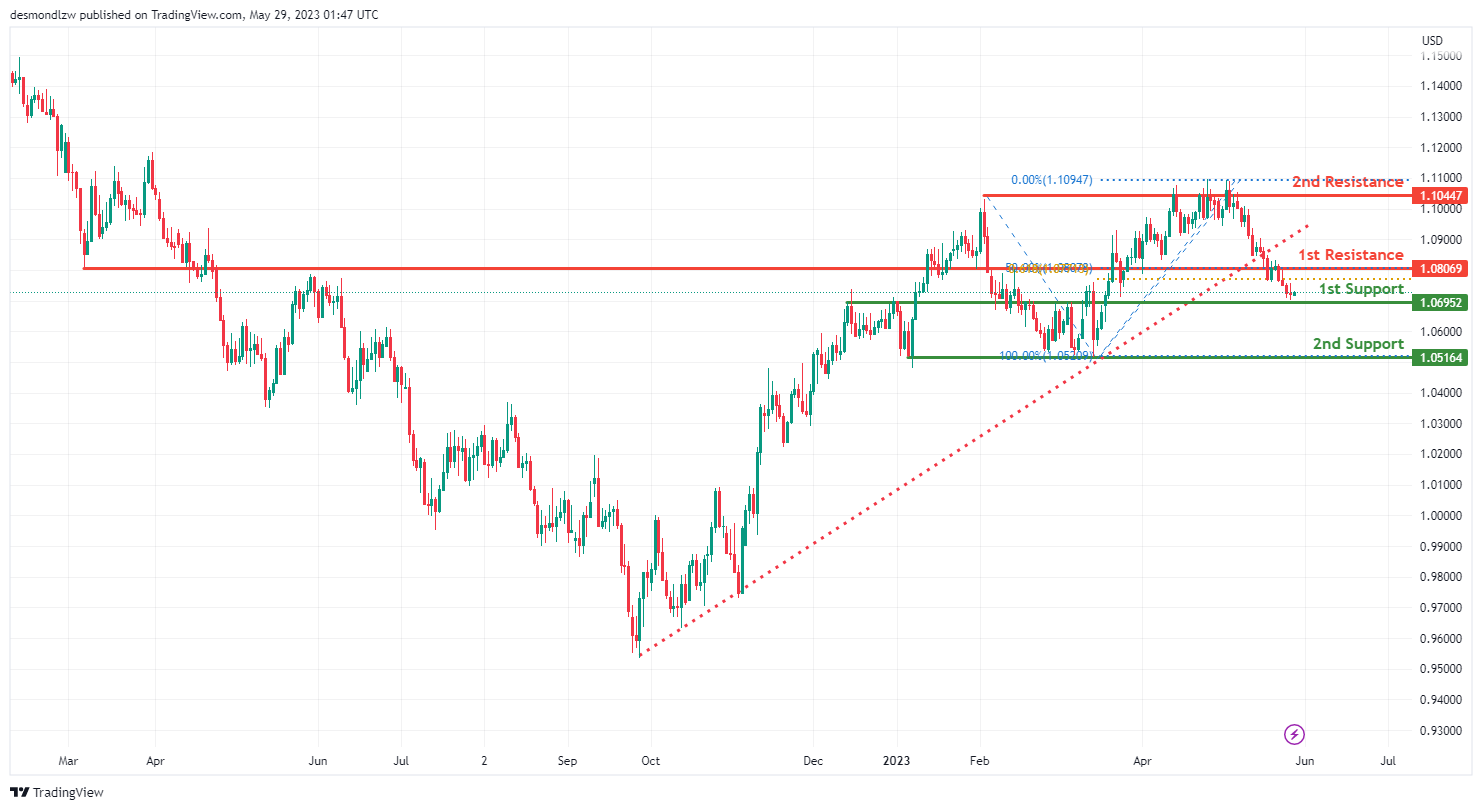
EUR/USD:
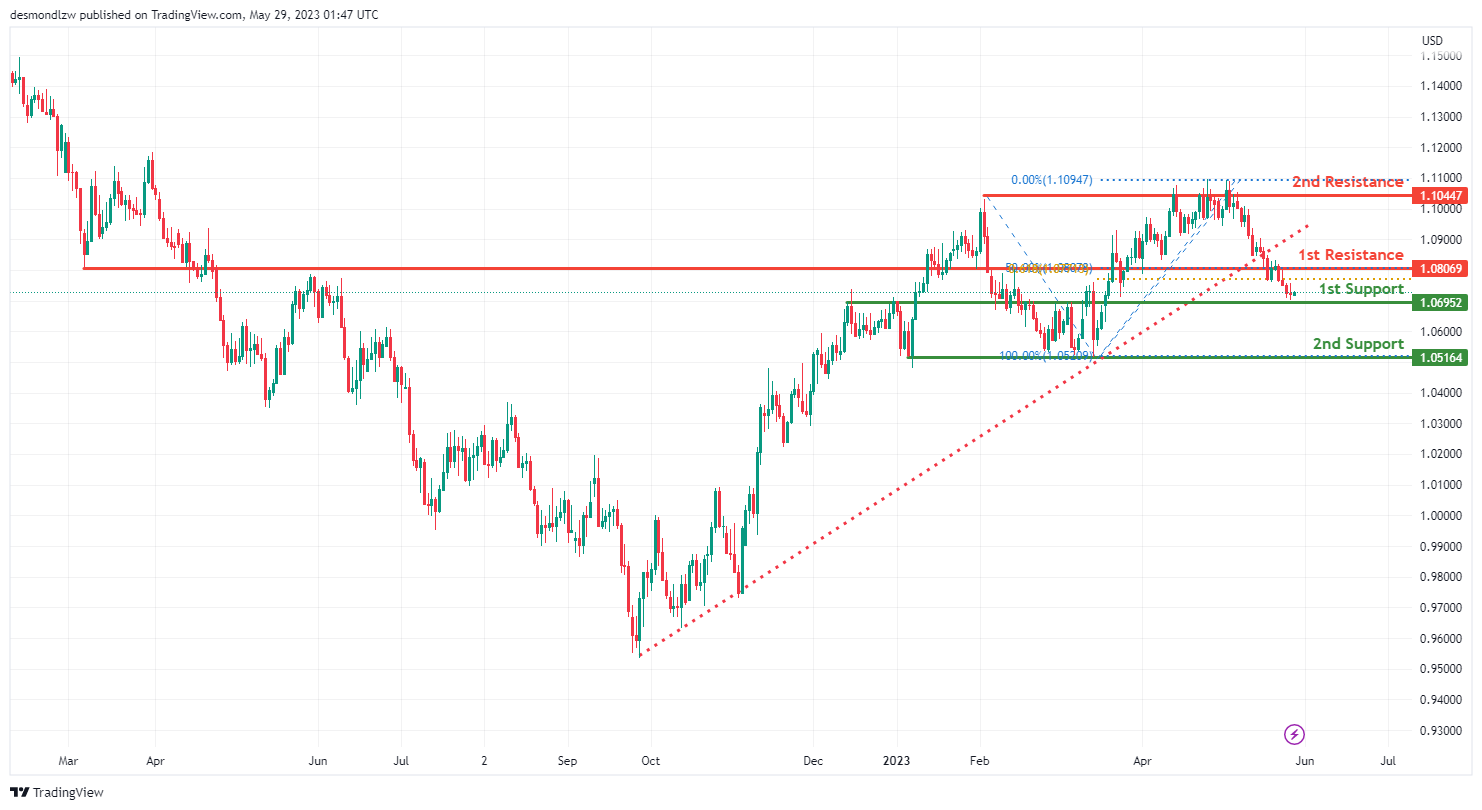
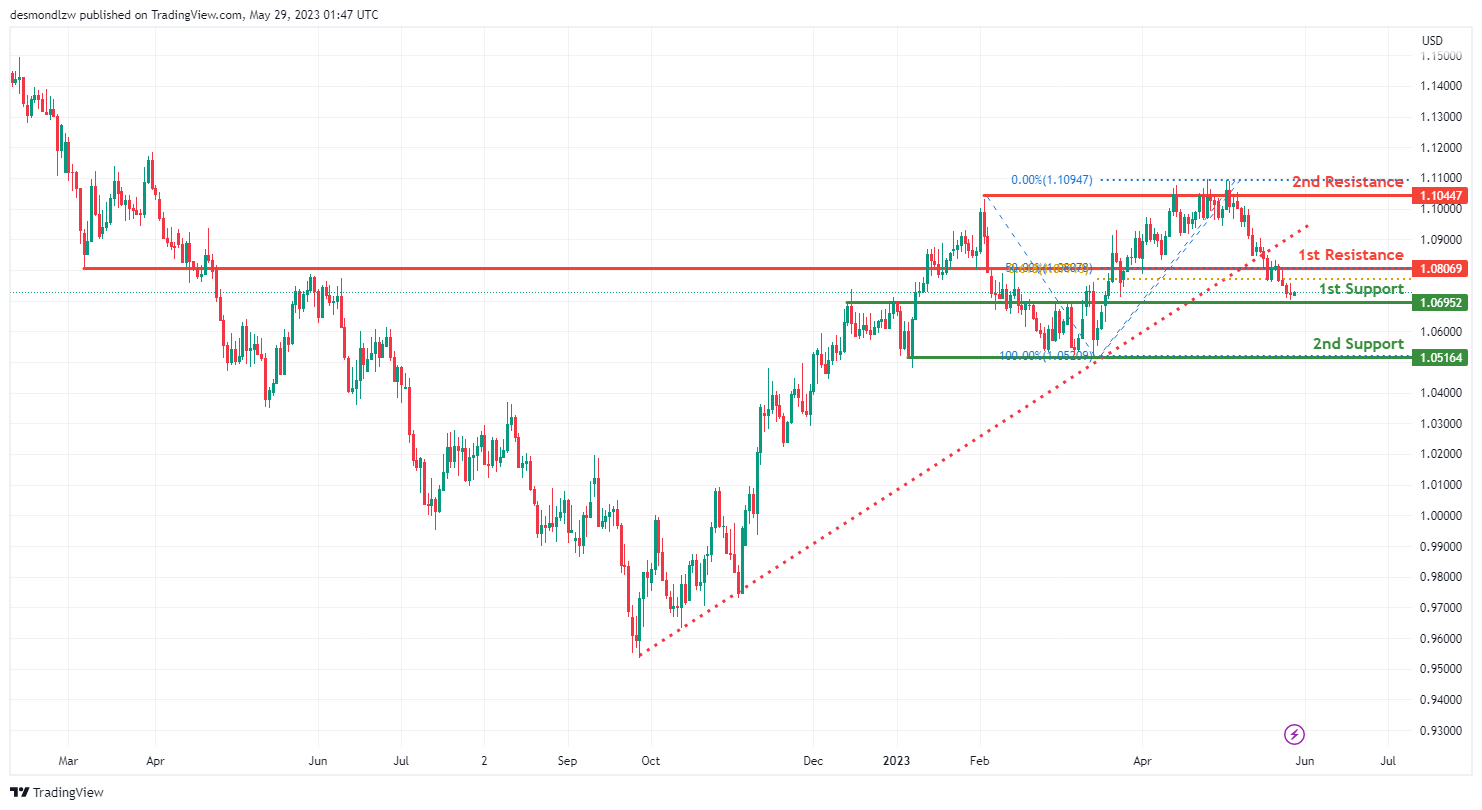
The EUR/USD chart currently exhibits bearish momentum, suggesting the potential for further downward movement.
In the short term, there is a possibility of a rise towards the first resistance level at 1.0806. However, it is anticipated that the price may reverse off this level and drop towards the first support.
The first support level at 1.0695 is identified as an overlap support, indicating its significance as a potential price floor.
Additionally, there is a second support level at 1.0516, recognized as a multi-swing low support, further reinforcing its importance as a potential price floor.
On the resistance side, the first resistance level at 1.0806 is an overlap resistance. It also coincides with a 61.80% Fibonacci projection and a 50% Fibonacci retracement, which adds to its significance as a potential price ceiling. This combination of Fibonacci levels is referred to as Fibonacci confluence.
Furthermore, there is a second resistance level at 1.1044, identified as a swing high resistance. This level could pose additional obstacles for the price’s upward movement.
Moreover, there is an intermediate resistance level at 1.0463, recognized as a pullback resistance.This level could potentially act as a stronger barrier for the price if it attempts to rise.
GBP/USD:
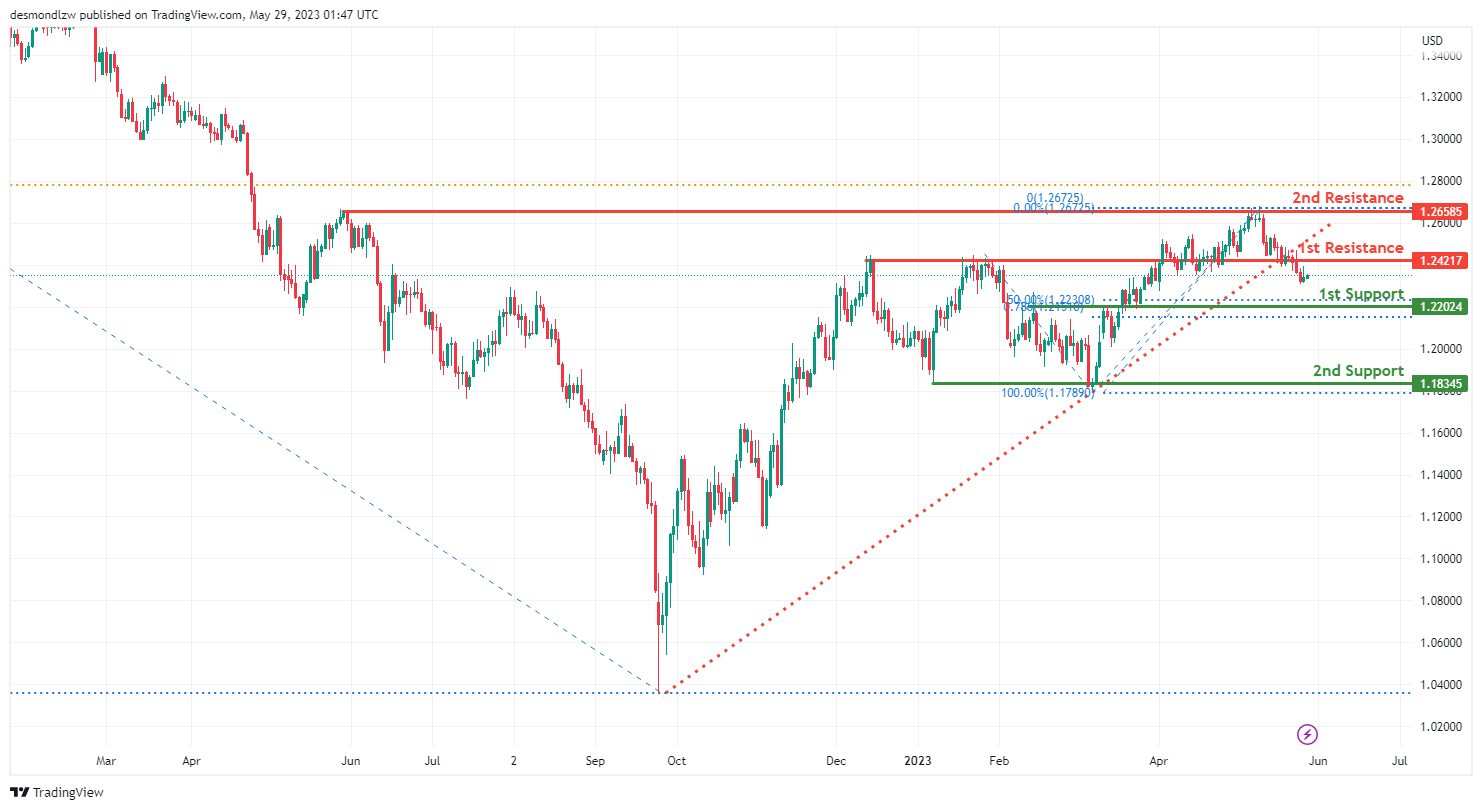
The GBP/USD chart currently exhibits bearish momentum, indicating the potential for further downward movement.
As the price broke below an ascending support line, it triggered a potential bearish move.
There is a possibility of a bearish continuation towards the first support level at 1.2202.
The first support level at 1.2202 is significant as it is an overlap support and coincides with a 50% Fibonacci retracement and a 78.60% Fibonacci projection. This combination of Fibonacci levels is referred to as Fibonacci confluence, adding to its importance as a potential price floor.
Additionally, there is a second support level at 1.1834, recognized as a multi-swing low support, further reinforcing its significance as a potential price floor.
On the resistance side, the first resistance level at 1.2421 is identified as a pullback resistance.
Furthermore, there is a second resistance level at 1.2658, identified as a multi-swing high resistance.
USD/CHF:
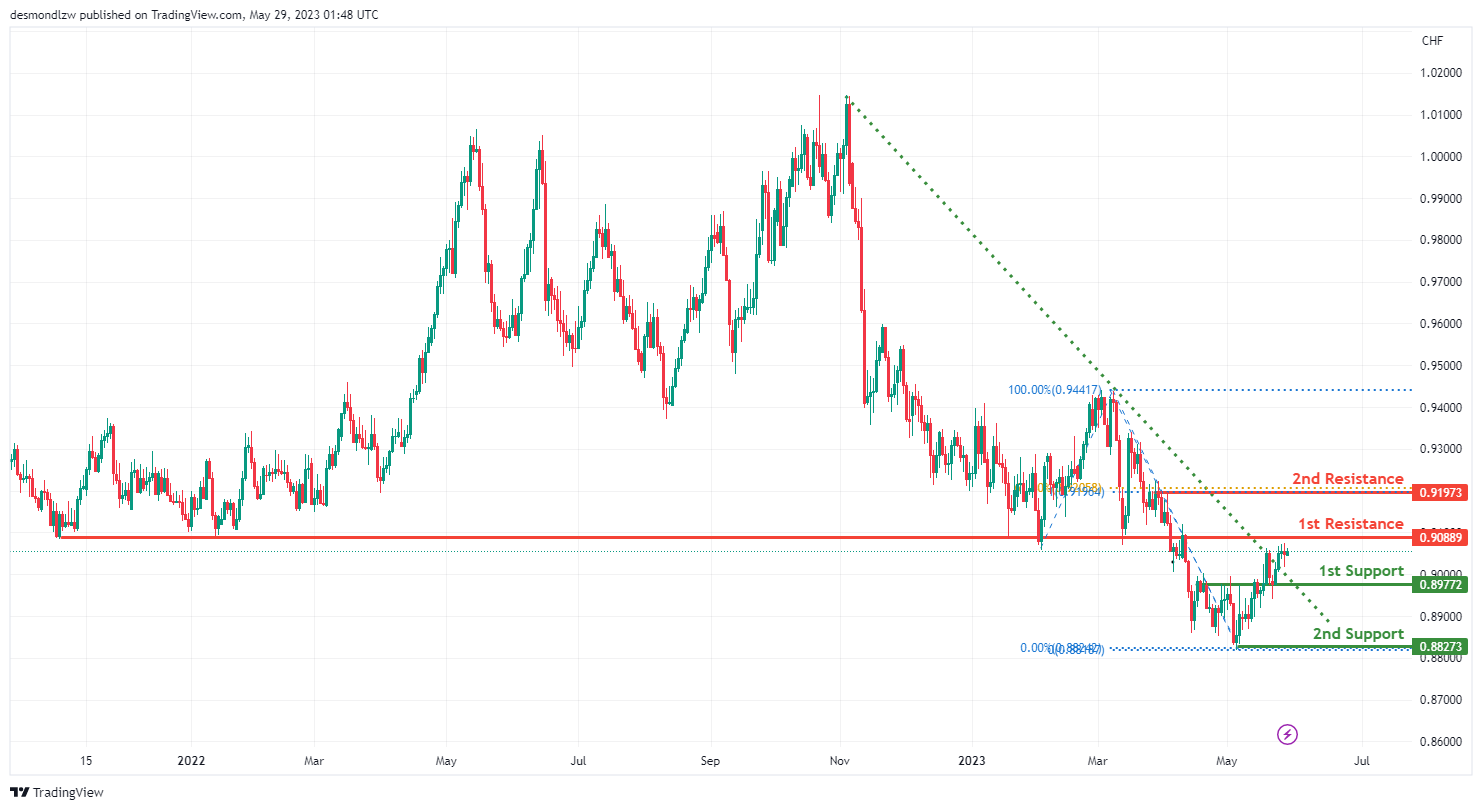
The USD/CHF chart currently exhibits bullish momentum, indicating the potential for further upward movement.
This bullish momentum is supported by the fact that the price broke above a descending resistance line, triggering a potential bullish move.
There is a possibility of a bullish continuation towards the first resistance level at 0.9088.
The first support level at 0.8977 is identified as an overlap support, suggesting it could act as a price floor during potential pullbacks.
Additionally, there is a second support level at 0.8827, recognized as a swing low support, further contributing to the overall bullish bias.
On the resistance side, the first resistance level at 0.9088 is an overlap resistance level.
Furthermore, there is a second resistance level at 0.9197, identified as a multi-swing high resistance. This level coincides with a 61.80% Fibonacci retracement and a 100% Fibonacci projection, adding to its significance as a potential price barrier.
USD/JPY:
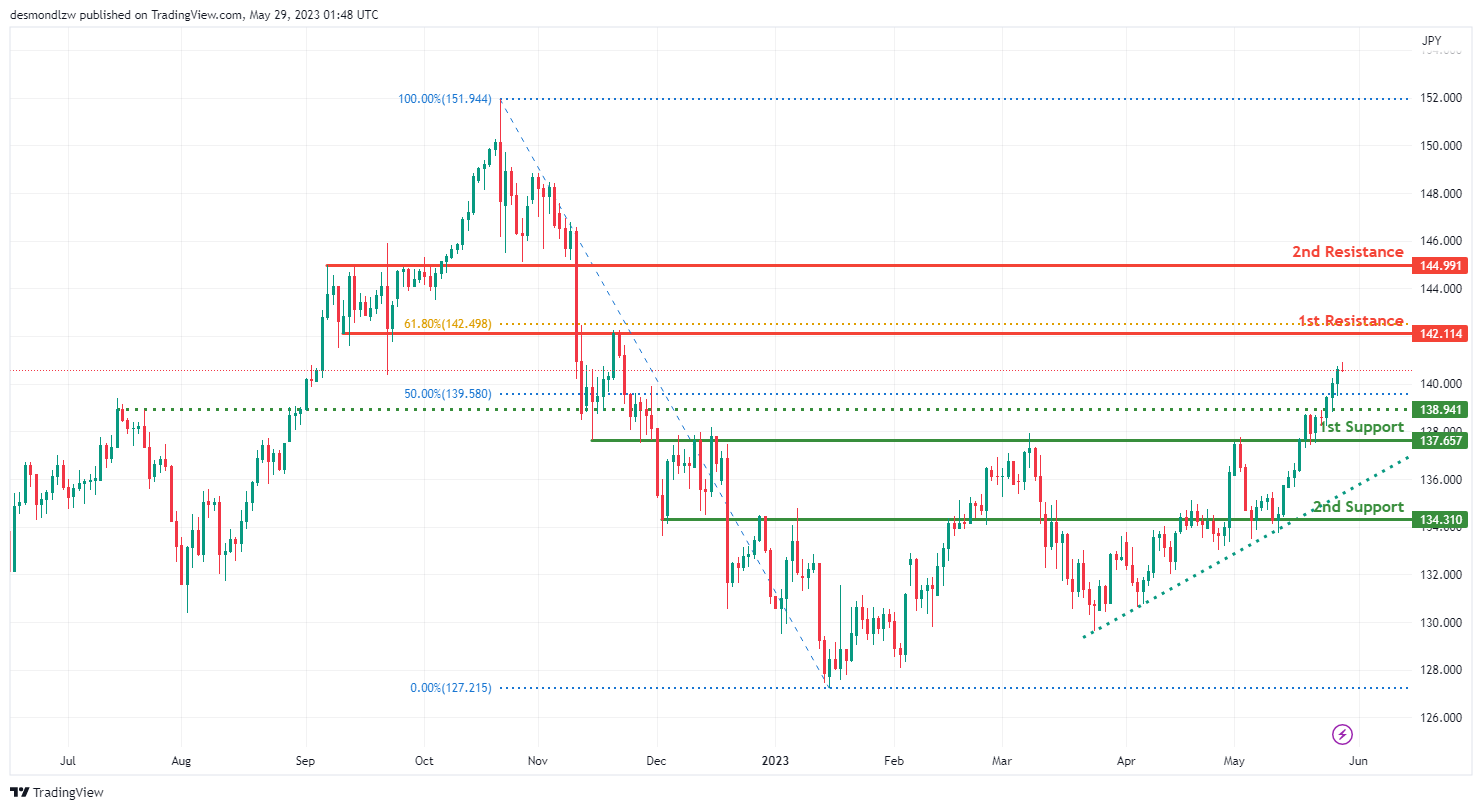
The USD/JPY chart currently demonstrates bullish momentum, suggesting the potential for further upward movement.
This bullish momentum is supported by the fact that the price is positioned above a major ascending trend line, indicating a favorable outlook for continued bullish momentum.
There is a possibility of a bullish continuation towards the first resistance level at 142.11.
On the support side, the first support level at 137.65 is identified as an overlap support, indicating its potential significance as a price floor.
Additionally, there is a second support level at 134.31, recognized as an overlap support, further supporting the overall bullish sentiment.
On the resistance side, the first resistance level at 142.11 is an overlap resistance level. If the price continues to rise, it may encounter resistance at this level.
Furthermore, there is a second resistance level at 144.99, identified as a pullback resistance.
For potential pullbacks, traders may find support at the intermediate support level of 138.94, which aligns with a 50% Fibonacci retracement.
AUD/USD:
The AUD/USD chart currently exhibits bullish momentum, suggesting the potential for further upward movement.
There is a possibility of a bullish continuation towards the first resistance level at 0.6652.
On the support side, the first support level at 0.6496 is identified as a pullback support, indicating its potential as a price floor during pullbacks.
Additionally, there is a second support level at 0.6386, recognized as a swing low support, which further contributes to the overall bullish sentiment. This level also aligns with a 78.60% Fibonacci retracement, adding to its significance.
On the resistance side, the first resistance level at 0.6652 is a pullback resistance level. If the price continues to rise, it may encounter resistance at this level.
Furthermore, there is a second resistance level at 0.6790, identified as a multi-swing high resistance.
For potential pullbacks, traders may find support at the intermediate resistance level of 0.6548, which aligns with a 23.60% Fibonacci retracement.
NZD/USD
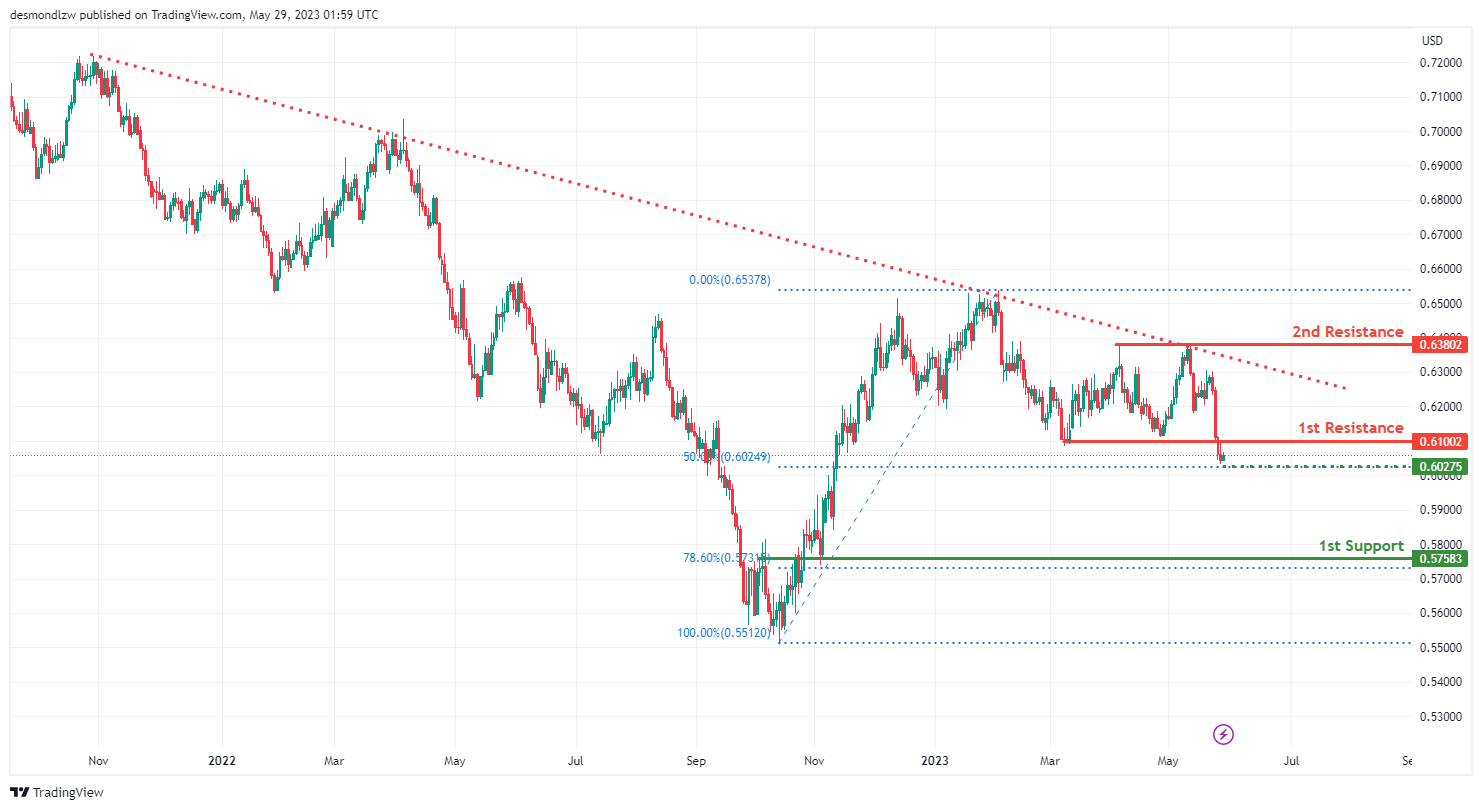
The NZD/USD chart currently demonstrates bearish momentum, indicating the potential for further downward movement.
There is a possibility of a bearish continuation towards the first support level at 0.5758. This level is identified as an overlap support and coincides with a 78.60% Fibonacci retracement, suggesting its significance as a potential price floor.
An intermediate support level can be found at 0.6027, which represents a swing low support and aligns with a 50% Fibonacci retracement.
On the resistance side, the first resistance level at 0.6100 is recognized as a pullback resistance. If the price were to rally, it may encounter resistance at this level.
Additionally, there is a second resistance level at 0.6380, identified as a multi-swing high resistance.
USD/CAD:
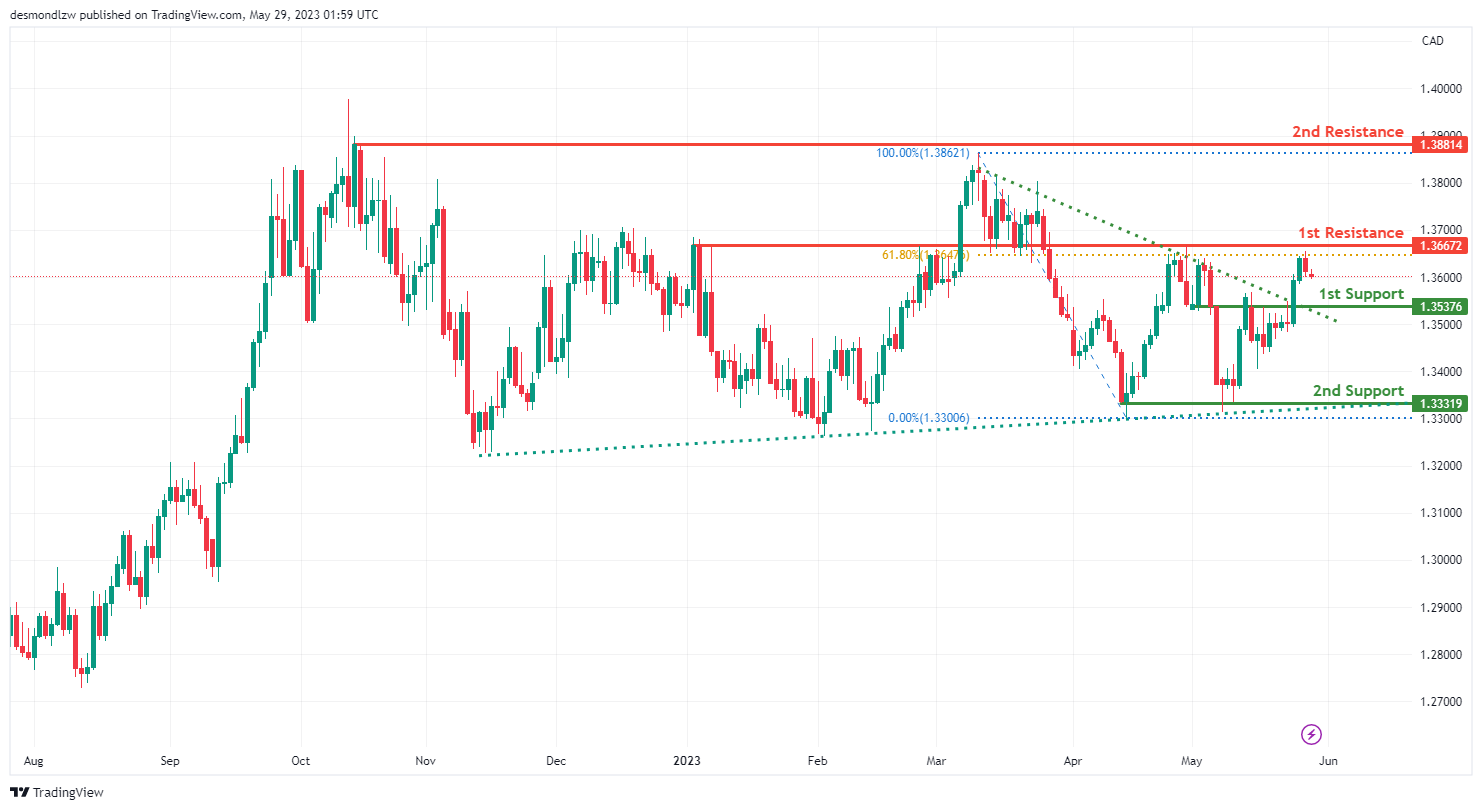
The USD/CAD chart currently exhibits bullish momentum, indicating the potential for further upward movement.
Although the price has broken above a descending resistance line, there is a possibility of a short-term drop towards the first support level at 1.3537 before bouncing back and rising towards the first resistance.
The first support level at 1.3537 is identified as an overlap support, suggesting its significance as a potential price floor. Additionally, there is a second support level at 1.3331, recognized as a multi-swing low support.
On the resistance side, the first resistance level at 1.3667 is an overlap resistance level. Further upward movement could encounter resistance at this level. Additionally, there is a second resistance level at 1.3881, which represents a multi-swing high resistance.
DJ30:
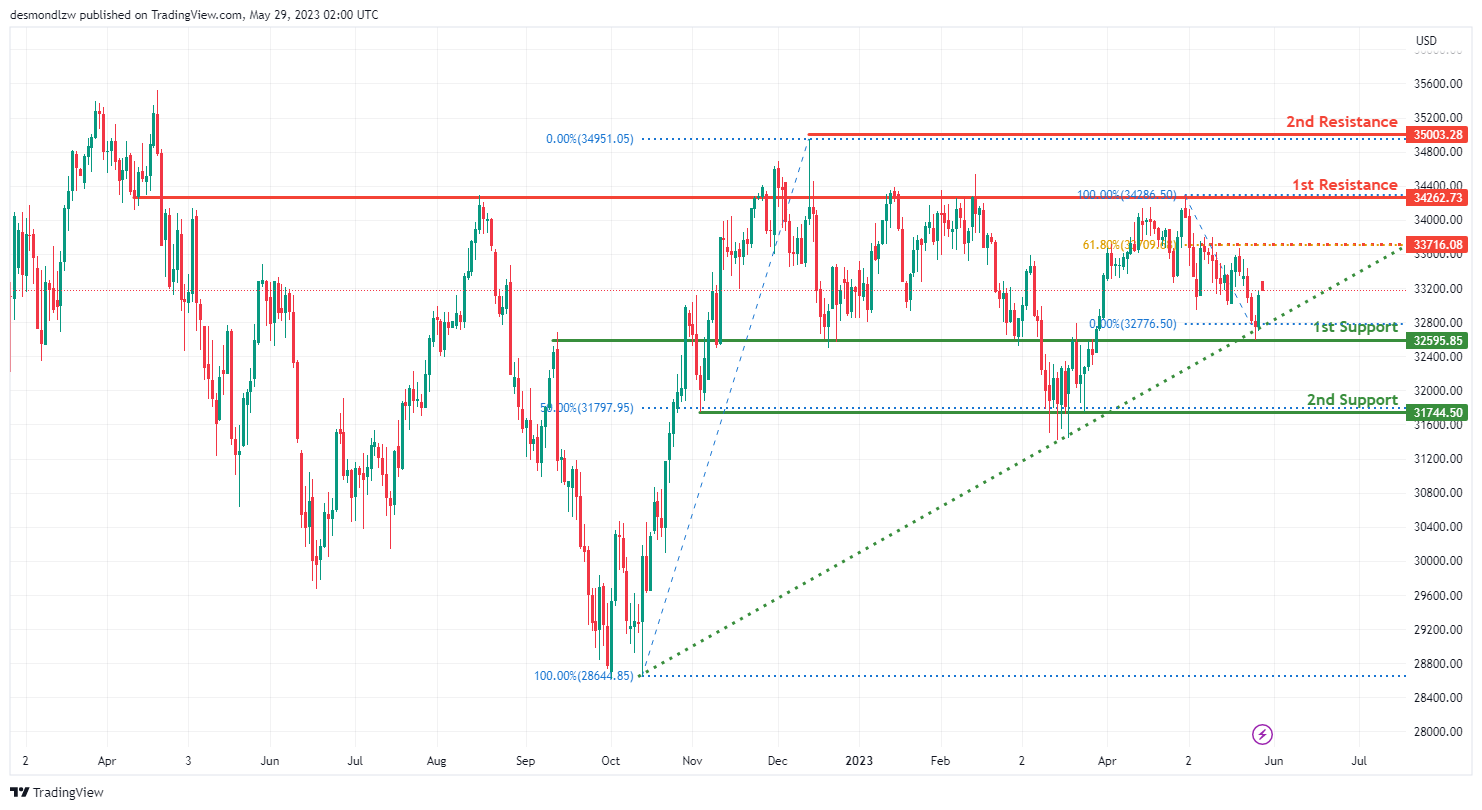
The DJ30 (Dow Jones Industrial Average) chart currently exhibits bullish momentum, suggesting the potential for further upward movement.
The price is positioned above a major ascending trend line, indicating a bullish bias in the market. This trend line serves as a contributing factor to the bullish momentum.
There is a possibility of a bullish continuation towards the first resistance level at 34262.73. This level is identified as an overlap resistance, which could pose a challenge for further upward movement. Additionally, there is a second resistance level at 35003.28, representing a swing high resistance.
On the support side, the first support level at 32595.85 is recognized as an overlap support. This level may provide a price floor during potential pullbacks. Additionally, there is a second support level at 31744.50, which is a multi-swing low support and coincides with a 50% Fibonacci retracement.
GER30:
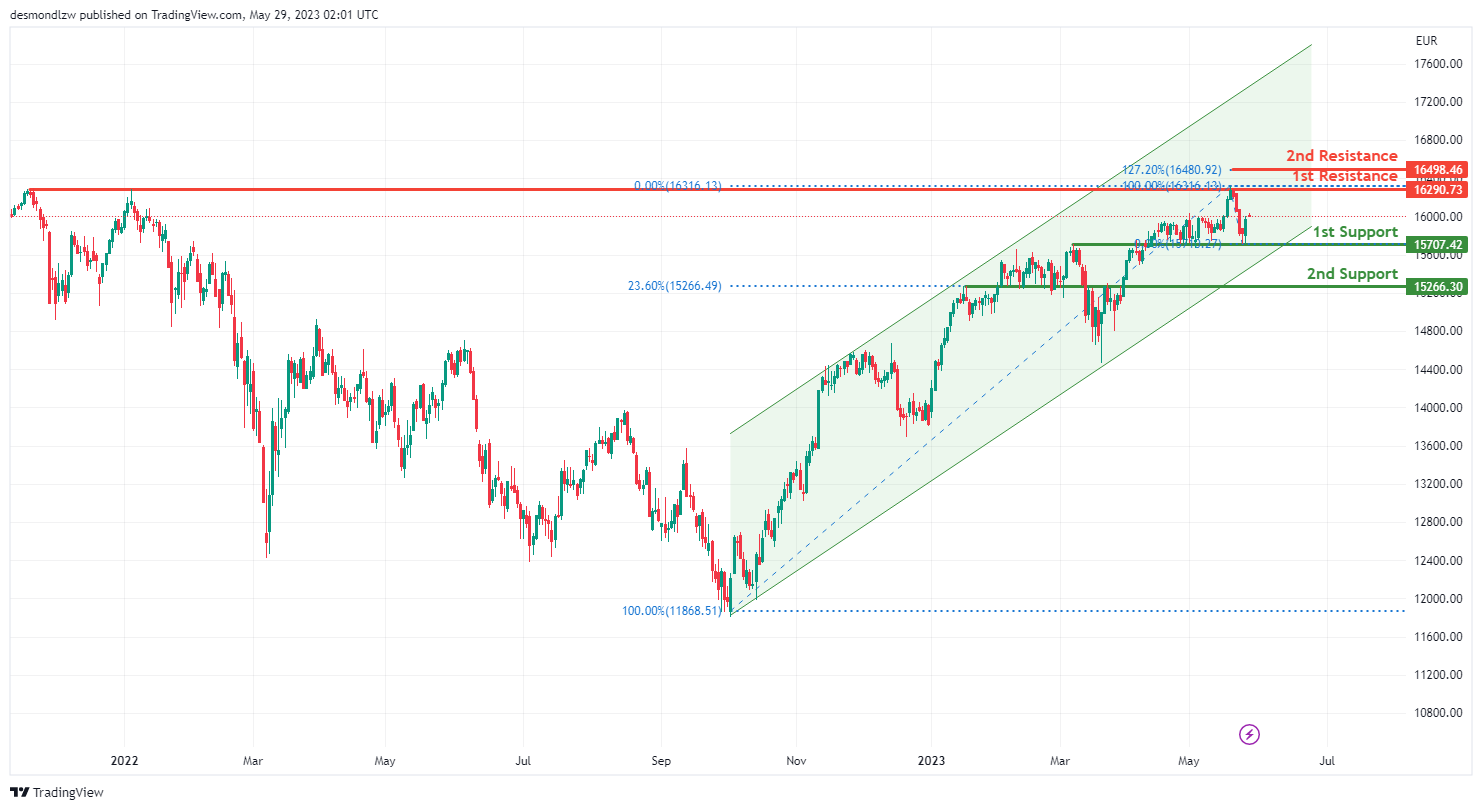
The GER30 (DAX) chart currently shows bullish momentum, with the price moving within a bullish ascending channel, indicating the potential for further upward movement.
There is a possibility of a bullish continuation towards the first resistance level at 16290.73. This level represents a multi-swing high resistance and could pose a challenge for the price’s upward movement. Additionally, there is a second resistance level at 16498.46, which coincides with the 127.20% Fibonacci extension.
On the support side, the first support level at 15707.42 is identified as an overlap support. This level may act as a price floor during pullbacks. Furthermore, there is a second support level at 15266.30, which serves as a pullback support and aligns with the 23.60% Fibonacci retracement.
BTC/USD:
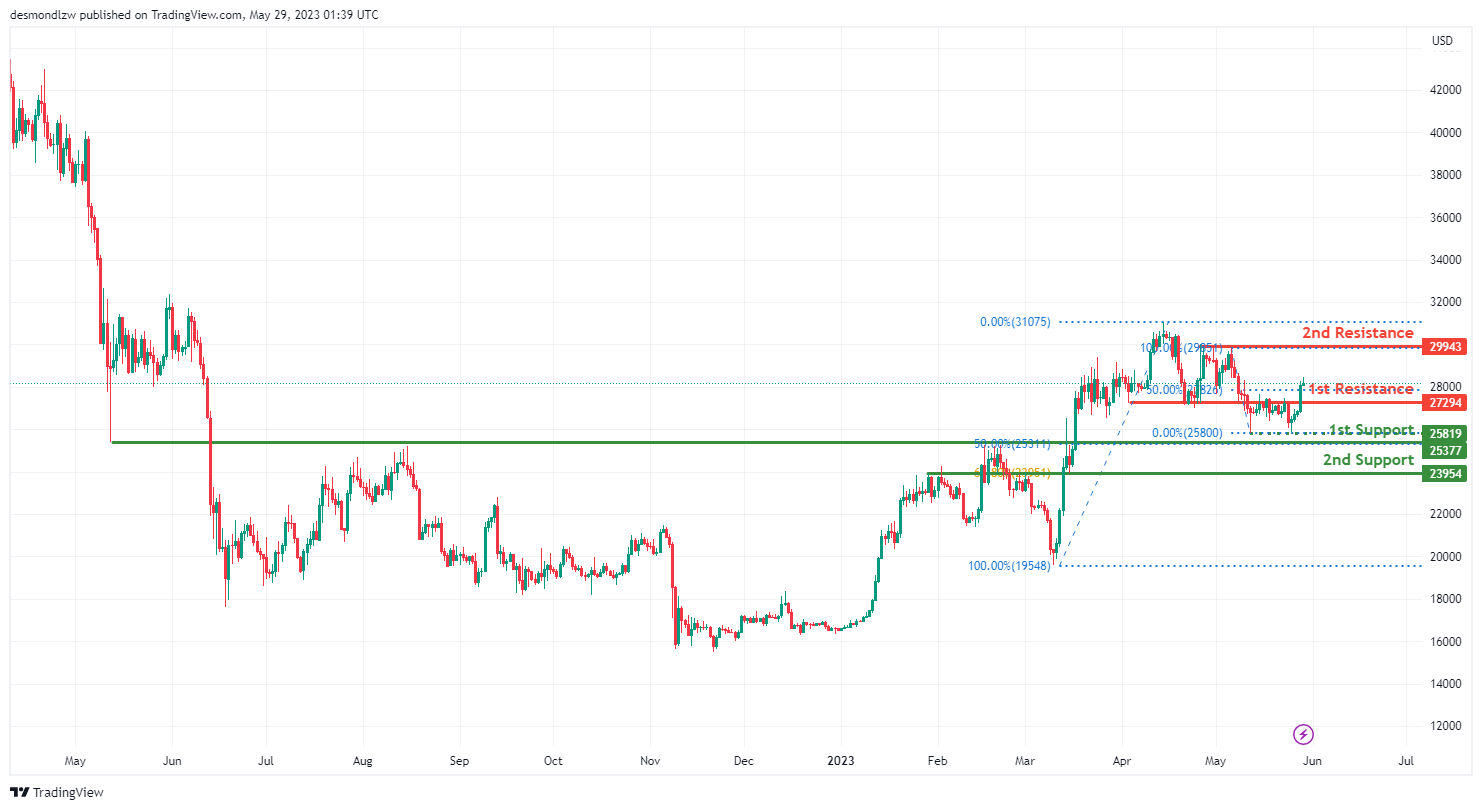
The BTC/USD chart currently demonstrates bullish momentum, indicating the potential for further upward movement.
There is a possibility of a bullish break through the first resistance level at 27294 and a subsequent rise towards the second resistance level at 29943.
On the support side, the first support level at 25377 is identified as an overlap support and aligns with the 50% Fibonacci retracement. This level may provide a price floor during pullbacks. Additionally, there is a second support level at 23954, recognized as an overlap support and coinciding with the 61.80% Fibonacci retracement.
US500
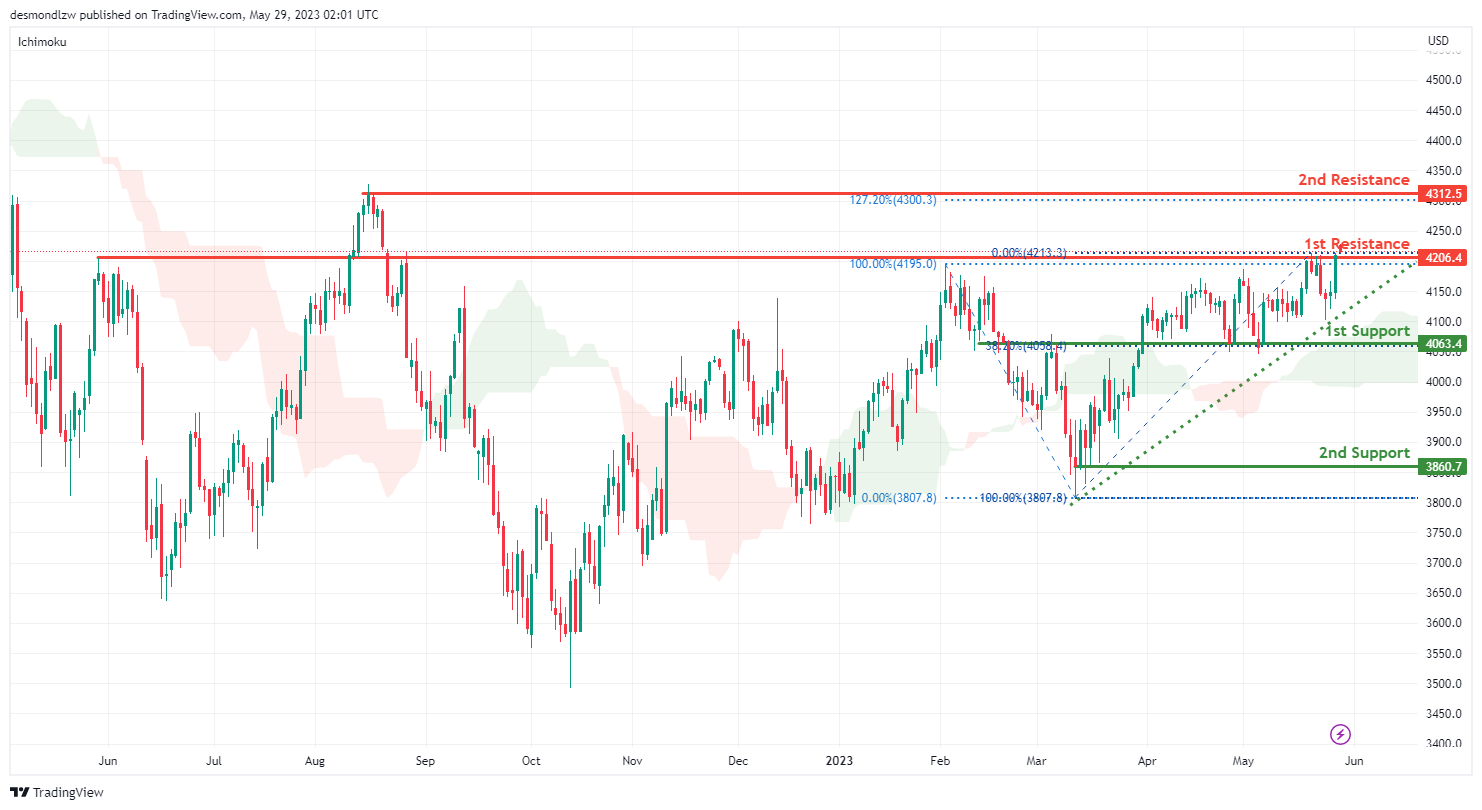
The US500 chart currently exhibits bullish momentum, indicating the potential for further upward movement.
There is a possibility of a bullish break through the first resistance level at 4206.4 and a subsequent rise towards the second resistance level at 4312.5.
Support levels are identified at 4063.4 and 3860.7. The first support level aligns with an overlap support and the 38.20% Fibonacci retracement, while the second support level is recognized as a multi-swing low support.
It’s worth noting that the price is also above a major ascending trend line and the bullish Ichimoku cloud, which further supports the bullish momentum.
ETH/USD:
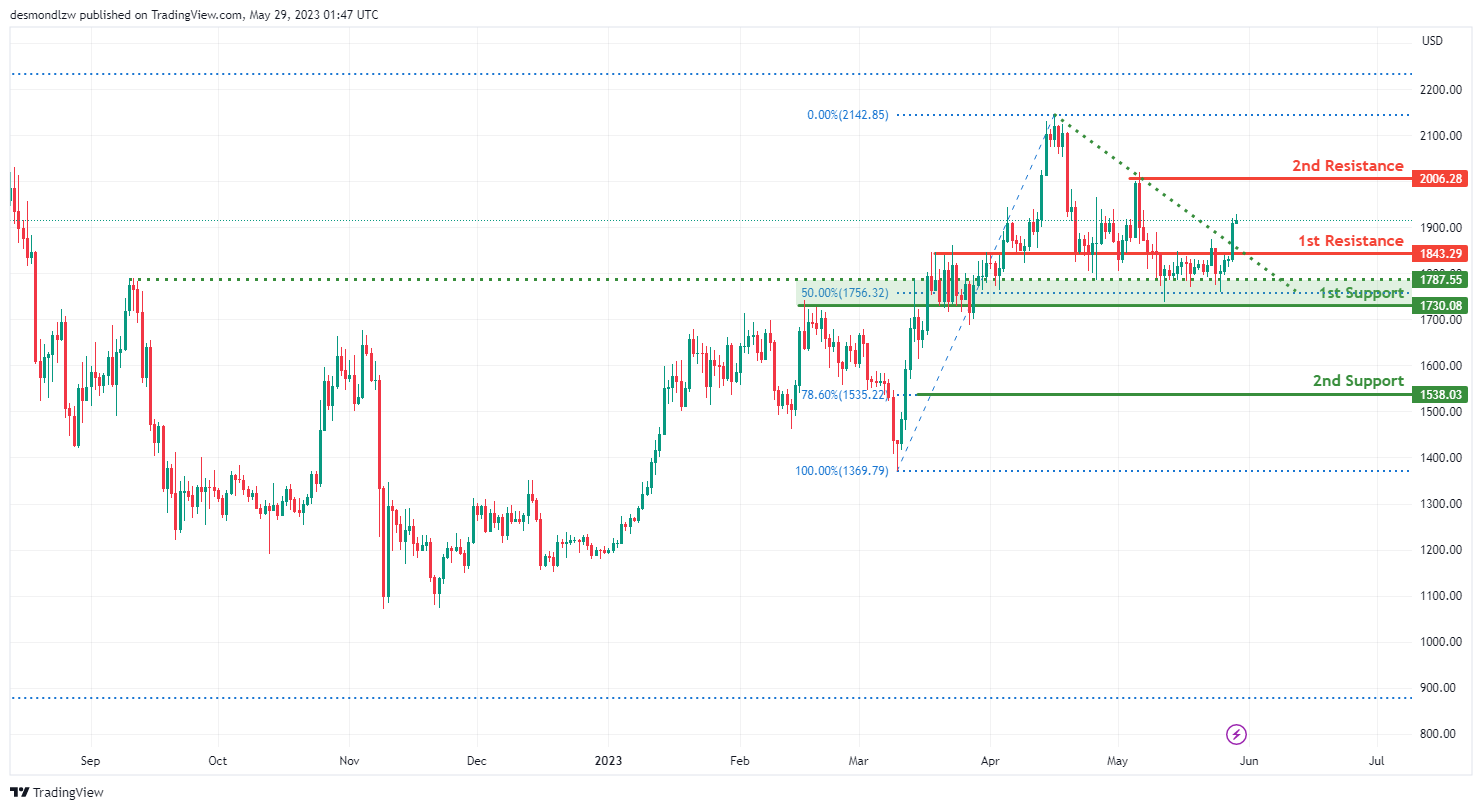
The ETH/USD pair is exhibiting a bullish momentum, with the price recently breaking above a descending resistance line, suggesting a potential bullish move.
Your first line of support is at 1730.08, serving as an overlap support and representing the 50% Fibonacci retracement level. This area may attract buyers in the market, holding the price from falling further.
If the price breaks below this level, the second line of support lies at 1538.03, which is the 78.60% Fibonacci retracement level. It’s a significant level where the market could see additional buying interest to prevent a further decline.
On the upside, the first resistance is at 1843.29, which is currently acting as a pullback resistance. If bullish momentum continues and the price manages to break through this resistance, it could pave the way for further upward movement.
The second resistance is at 2006.28, which was a previous swing high. This resistance may be strong, as sellers previously found this level attractive to sell or short, causing the price to reverse downwards.
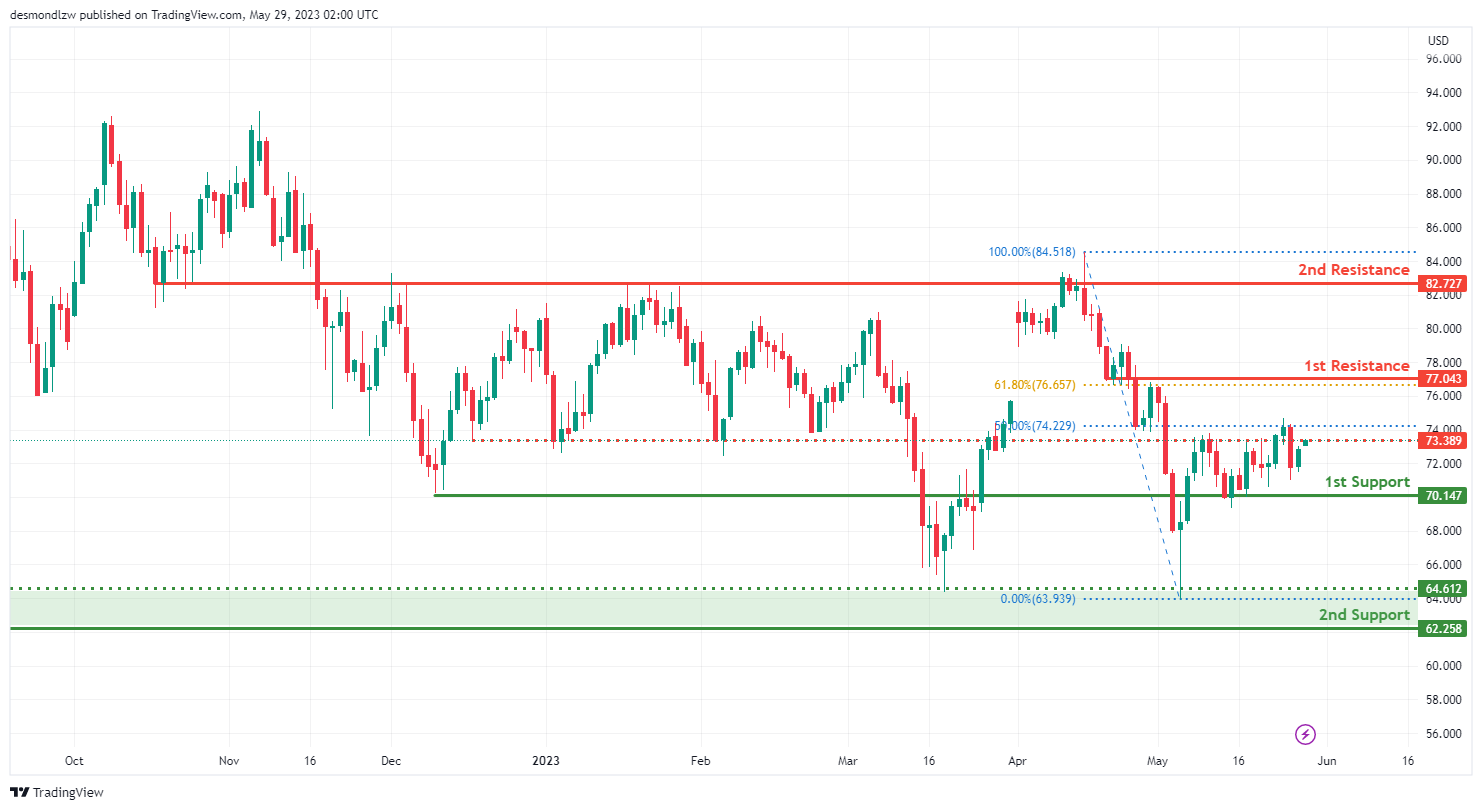
WTI/USD:
WTI (West Texas Intermediate) crude oil indicates a bullish momentum, suggesting a potential for price continuation towards the first resistance.
The first line of support is at $70.14, functioning as an overlap support. This level may draw buyers, keeping the price from dropping further.
If the price falls below this point, the second line of support is at $62.25, known as a multi-swing low support. This level, which has been tested multiple times as a support in the past, could again attract buyers and prevent further decline.
Looking upward, the first resistance level is at $77.04, serving as an overlap resistance and also marking the 61.80% Fibonacci retracement level. This could be a crucial level where the market might see some selling pressure.
The intermediate resistance level is at $73.38, another overlap resistance and the 50% Fibonacci retracement level. This level may provide some resistance before the price reaches the first resistance level.
The second resistance is at $82.72, which is another overlap resistance. This level may see strong selling pressure as it has served as a reversal point in the past.
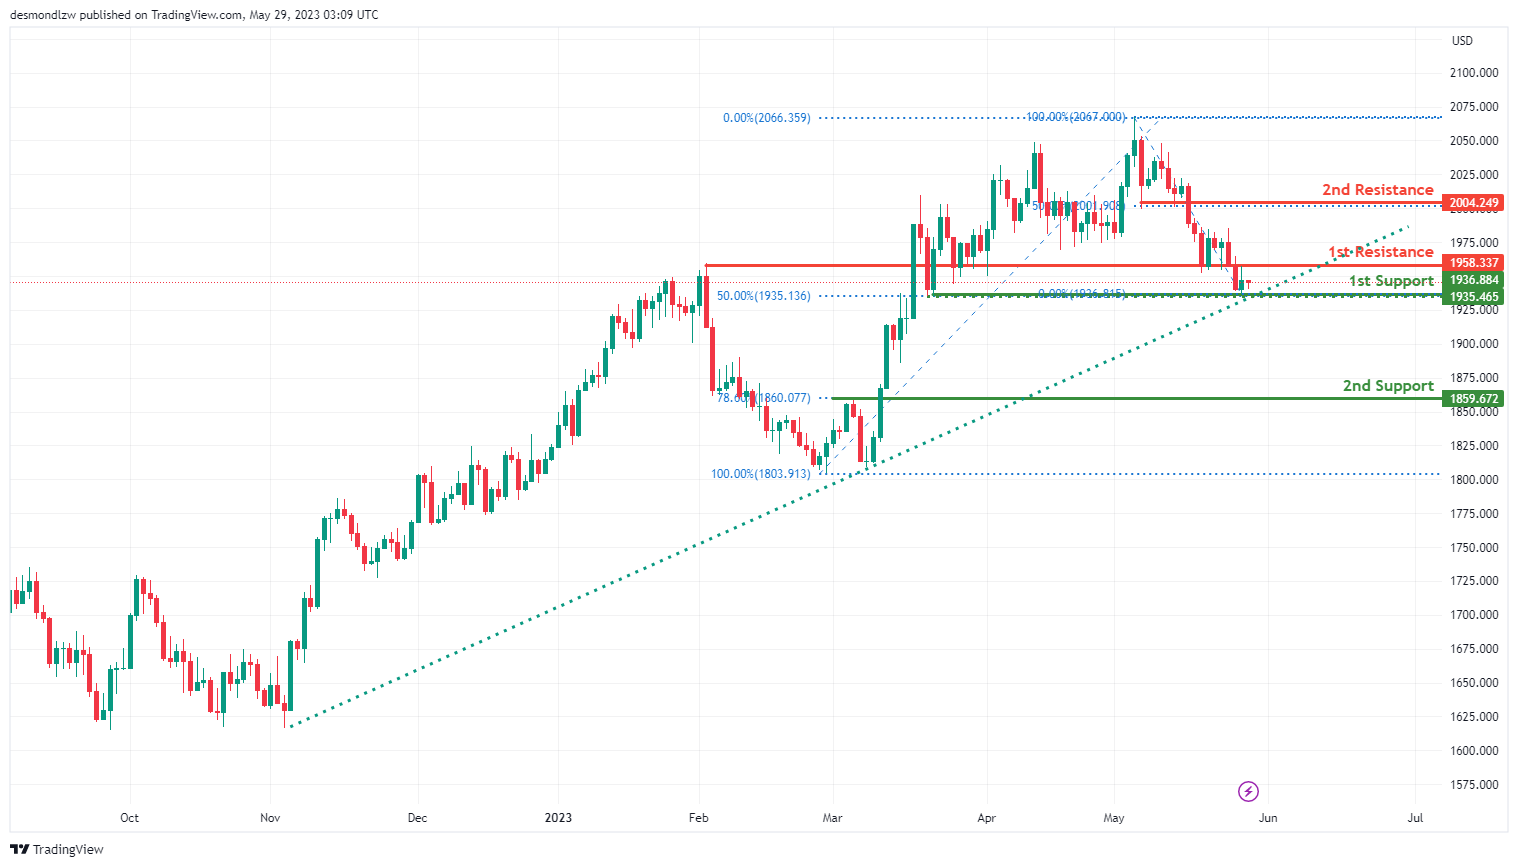
XAU/USD (GOLD):
Based on your analysis, the XAU/USD pair (Gold to US Dollar) is currently demonstrating a bullish momentum. The price being above a significant ascending trendline is a good indicator suggesting further bullish momentum could be anticipated.
The first level of support is at 1935.46. This point serves as the 50% Fibonacci retracement level, which could potentially attract buyers into the market, preventing the price from falling further.
If the price breaks below this level, the second line of support is at 1859.67. This level is a pullback support and represents the 78.60% Fibonacci retracement level. This area could serve as a strong buy zone to prevent the price from declining further.
On the upside, the first resistance level is at 1958.33, acting as an overlap resistance. If the bullish momentum continues, and the price manages to break above this resistance, further upward movement could be expected.
The second resistance is located at 2004.24, serving as a pullback resistance and the 50% Fibonacci retracement level. This resistance might be significant, as sellers previously found this level attractive enough to cause a price reversal.
EUR/USD Turns Red Below 1.0800 As Dollar Gains Momentum
Key Highlights
- EUR/USD extended its decline below the 1.0780 support.
- A major bearish trend line is forming with resistance near 1.0765 on the 4-hour chart.
- USD/JPY pumped above the 140.00 resistance zone.
- Gold price extended its decline below the $1,970 support.
EUR/USD Technical Analysis
The Euro started a fresh decline from well above 1.0800 against the US Dollar. EUR/USD traded below 1.0800 and 1.0780 to move into a bearish zone.
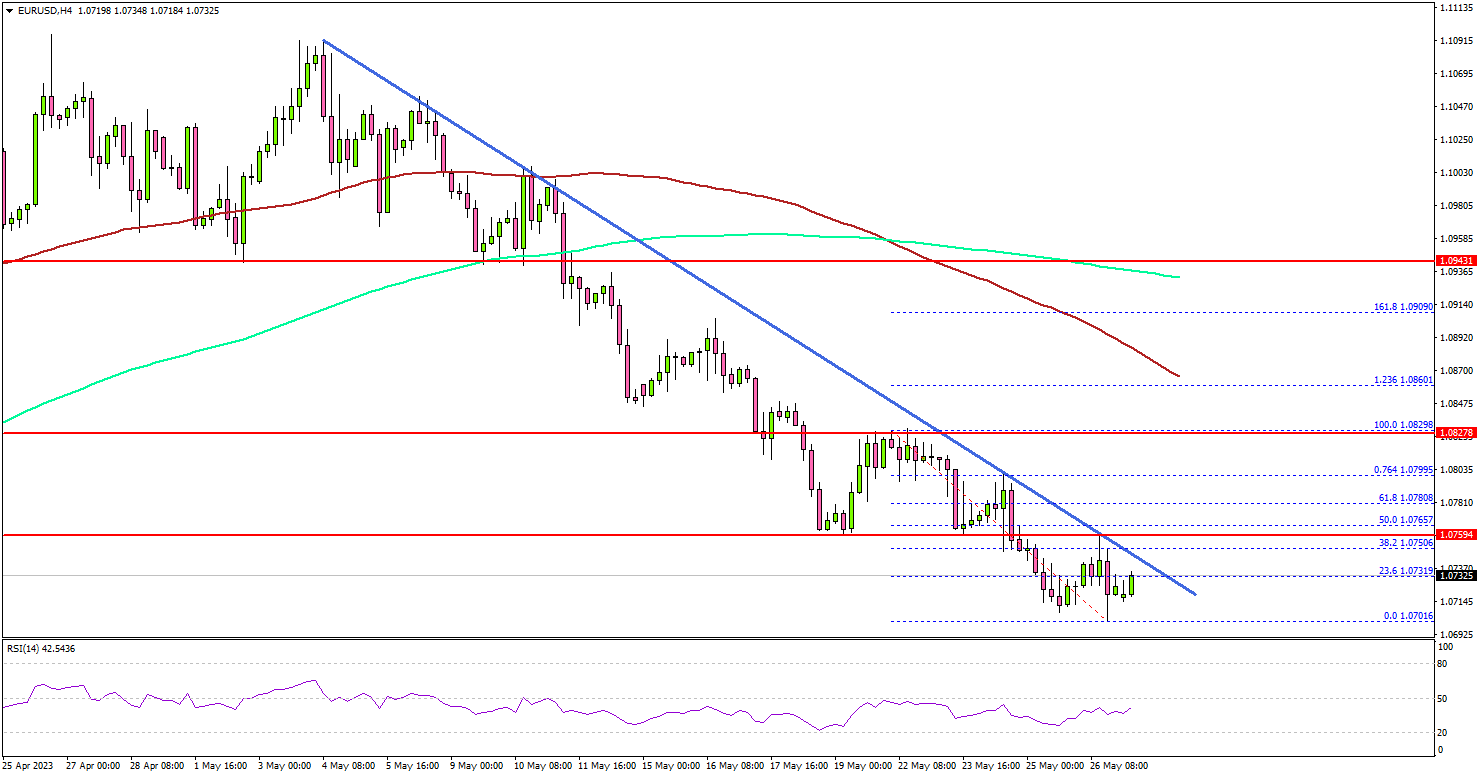
Looking at the 4-hour chart, the pair settled below the 1.0780 level, the 100 simple moving average (red, 4 hours), and the 200 simple moving average (green, 4 hours).
The decline gained pace below the 1.0750 level and the pair traded close to 1.0700. If the bears remain in action, there is a risk of a move toward the 1.0660 level. The next major support is near the 1.0625 level.
If there is a downside break below the 1.0625 support, the pair could decline toward the 1.0550 support level. The next major support sits near the 1.0500 level.
On the upside, the pair might face resistance near the 1.0750 level. There is also a major bearish trend line forming with resistance near 1.0765 on the same chart. The next major resistance is near 1.0780, above which the pair could rise toward the 1.0820 level.
Looking at USD/JPY, the pair started a major increase and recently was able to clear the key 140.00 resistance zone.
Economic Releases
- Italy Zone Trade Balance for April 2023 – Forecast -€8.42B versus -€8.45B previous.
Platinum (PL) Correction in Progress
Platinum (PL) shows a higher high (bullish sequence) from 9.1.2022 low favoring further upside. Since forming the intermediate top at 1148.9 on April 21, the metal has corrected cycle from 2.27.2023 low at 903.9. The correction can still extend lower in the near term but it should end above 903.9 before the next leg higher resumes.
Platinum Monthly Elliott Wave Chart
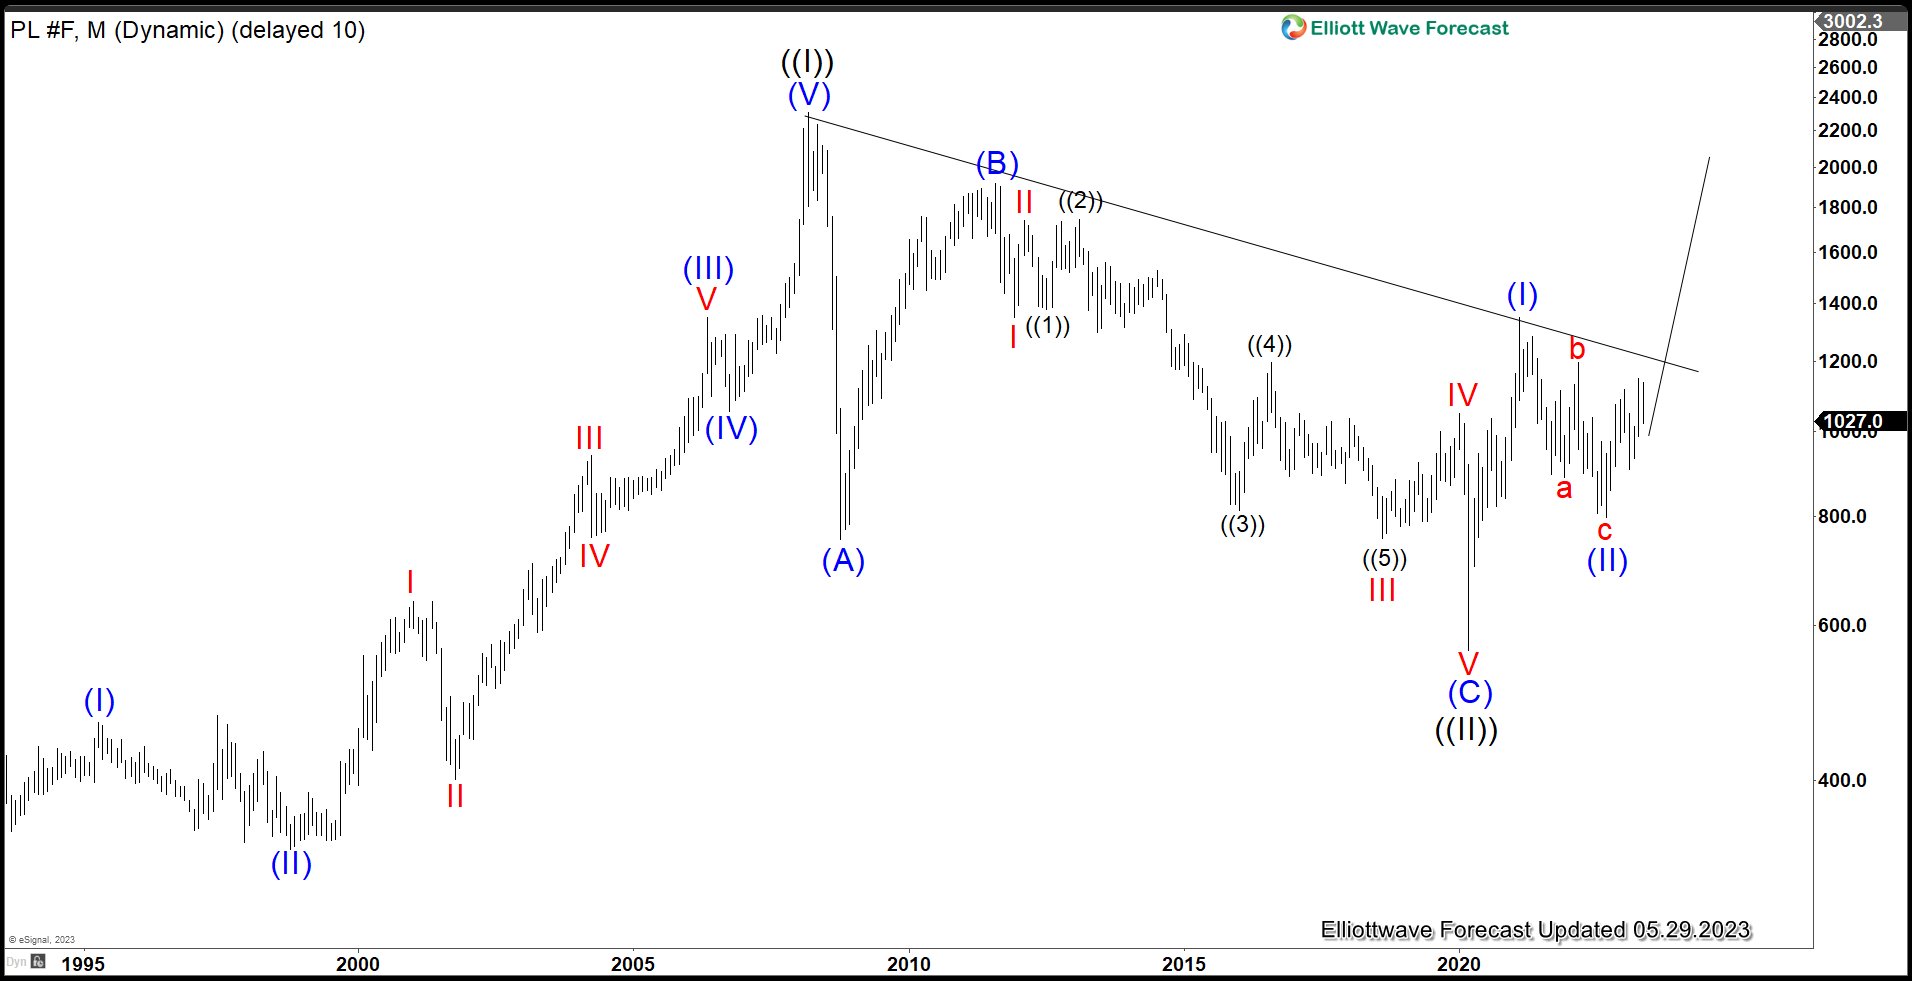
Monthly Elliott Wave Chart of Platinum above shows that the metal ended wave ((I)) at 2308.8 and pullback in wave ((II)) ended at 562. The metal then extended higher again in wave ((III)) with internal subdivision as a 5 waves impulse. Up from wave ((II)), wave (I) ended at 1348.2 and pullback in wave (II) ended at 796.8. Internal subdivision of wave (II) unfolded as a zigzag structure where wave a ended at 886, wave b ended at 1197, and wave c lower ended at 796.8. The metal has turned higher in wave (III), but it still needs to break above wave (I) at 13487.2 to rule out a double correction.
Platinum Daily Elliott Wave Chart
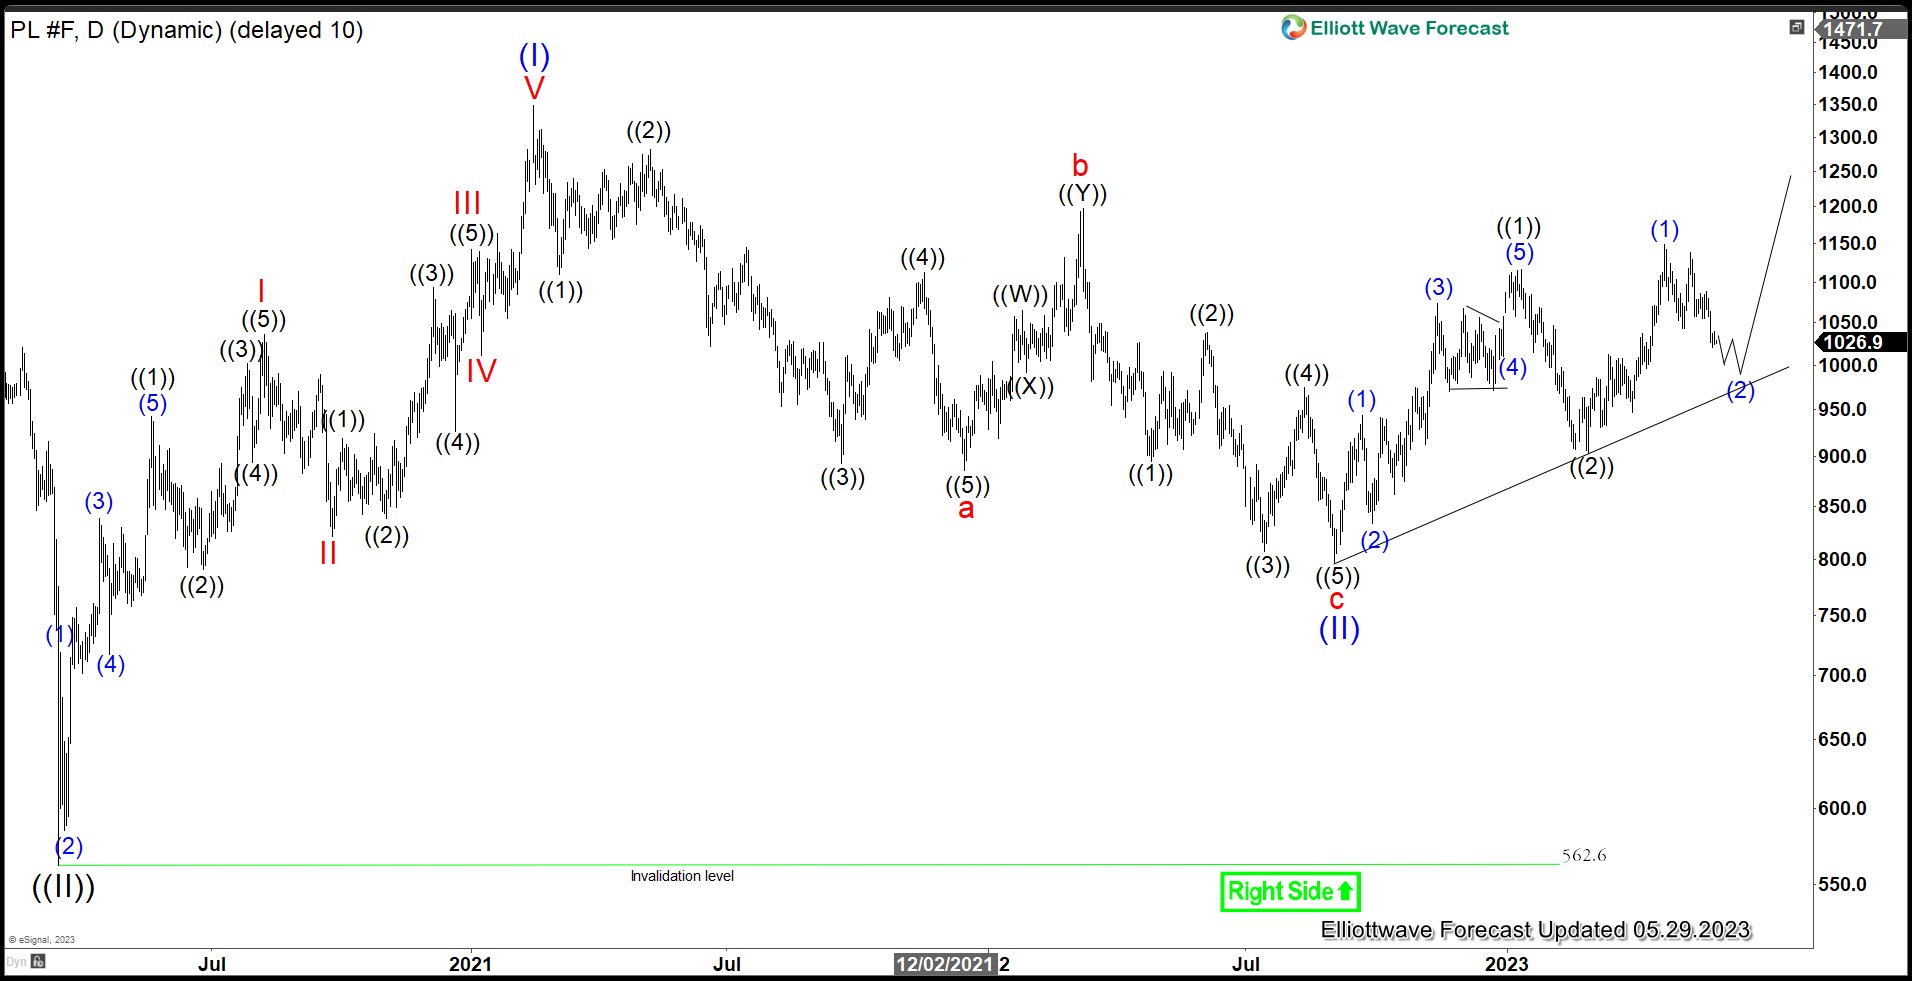
Daily Chart of Platinum above shows the metal ended wave (II) at 796.8. The metal has started wave (III) with internal subdivision as a 5 waves with extension (nest). Up from wave (II), wave (1) ended at 943.5 and pullback in wave (2) ended at 833.7. The metal extends higher in wave (3) towards 1074.1 and pullback in wave (4) ended at 1006.3. Wave (5) higher ended at 1117 which completed wave ((1)). Dips in wave ((2)) ended at 903.9. The metal extends higher in wave ((3)) with internal subdivision as another 5 waves. Up from wave ((2)), wave (1) ended at 1148.9. Expect pullback in wave (2) to find support in 3, 7, or 11 swing for further upside.
EUR/USD Weekly Outlook
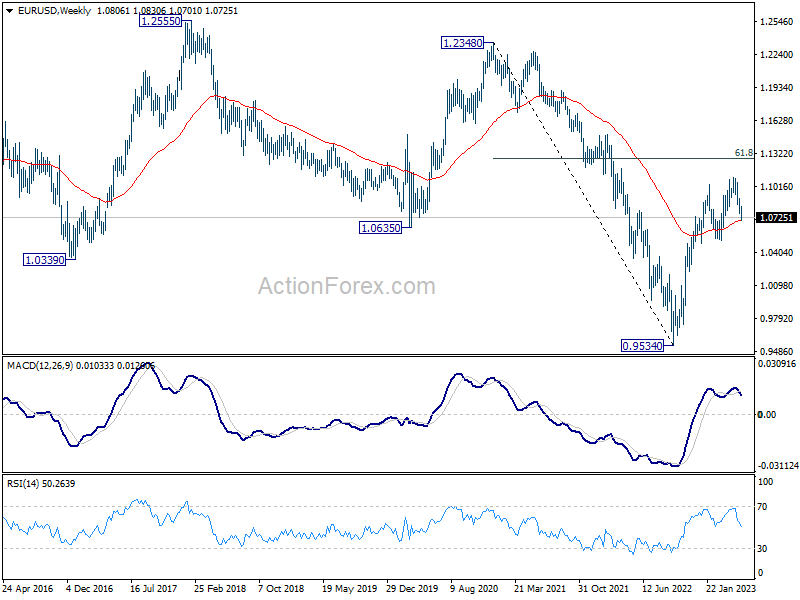
EUR/USD's decline from 1.1094 continued last week despite some loss of downside momentum. Further fall is expected this week as long as 1.0830 resistance holds. Current fall from 1.1094 is seen as correcting whole up trend from 0.9534, and should target 1.0515 cluster support, 38.2% retracement of 0.9534 to 1.1094 at 1.0498. On the upside, however, above 1.0830 minor resistance will turn bias to the upside for stronger rebound.
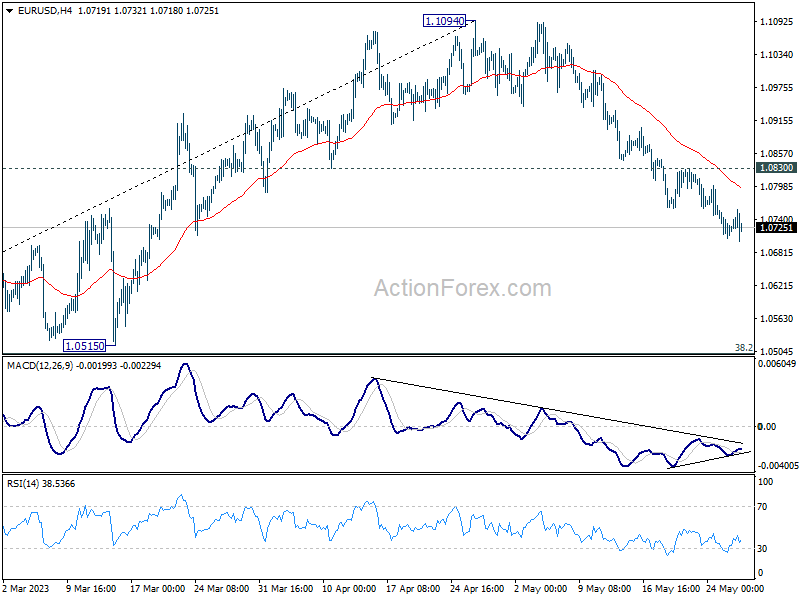
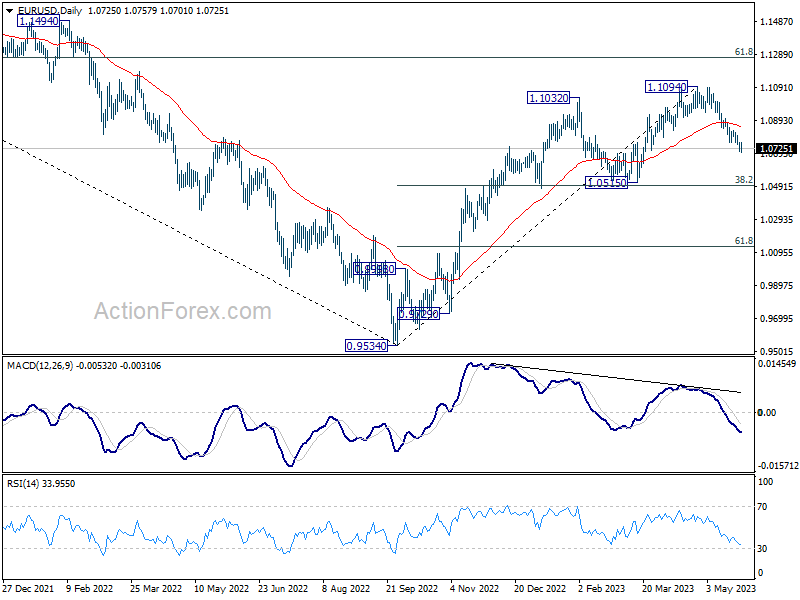
In the bigger picture, as long as 1.0515 support holds, rise from 0.9534 (2022 low) would still extend higher. Sustained break of 61.8% retracement of 1.2348 (2021 high) to 0.9534 at 1.1273 will solidify the case of bullish trend reversal and target 1.2348 resistance next (2021 high).
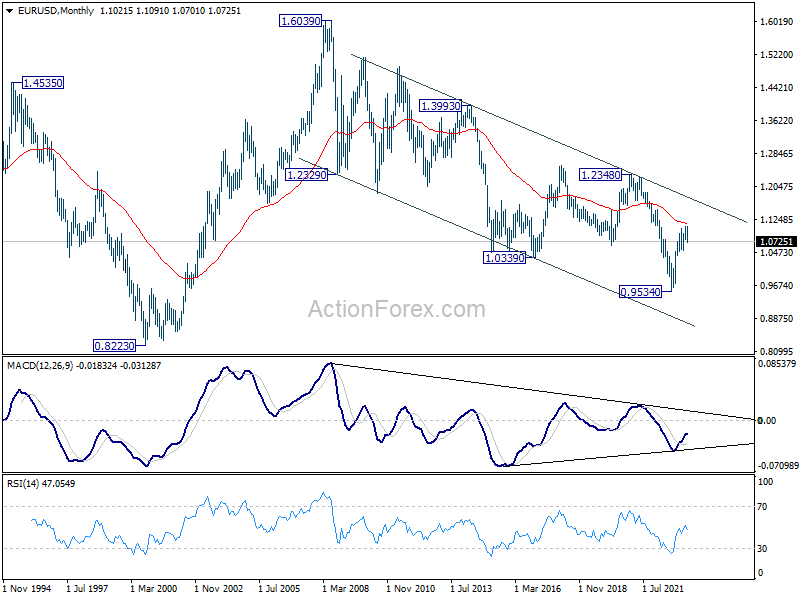
In the long term picture, focus is now on 55 M EMA (now at 1.1156). Rejection by this EMA will revive long term bearishness. However, sustained break above here will be affirm the case of long term bullish reversal and target 1.2348 resistance next.