Sample Category Title
USD/JPY: Bulls Started to Lose Traction on Strongly Overbought Studies/Weaker Dollar
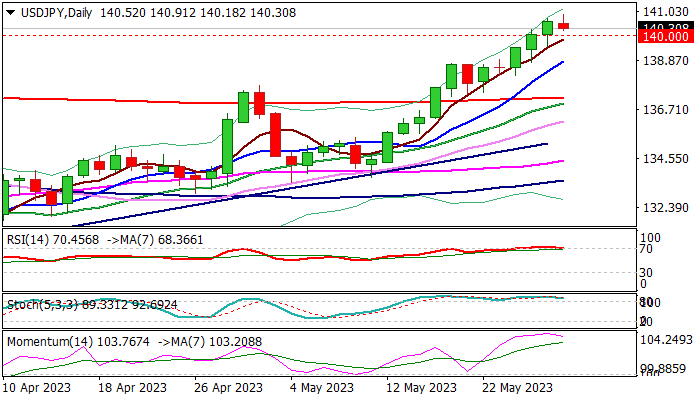
The USDJPY eases from new over six-month high on Monday, as strongly overbought conditions on daily chart prompted traders to start collecting profits.
The dollar started to lose traction after rallying for three consecutive weeks and closed above psychological 140 barrier for the first time since Nov 17, pressured by growing prospects of debt ceiling deal which dented safe haven demand and boosted appetite for riskier assets.
Initial reversal signals still need to be verified, with minimum requirement seen on return and close below former strong barriers at 140.00/139.58 (psychological / broken 50% retracement of 151.94/127.22) with extension below rising 10DMA (138.80) to further weaken near-term structure and risk deeper pullback towards 138.08 (Fibo 38.2% of 133.50/140.91) and 137.20 (200DMA / 50% retracement).
Res: 140.91; 141.97; 142.50; 143.00.
Sup: 140.00; 139.58; 139.16; 138.08.
GBP/USD: Near-Term Action Looks for Clearer Direction Signal as Daily Studies Mixed
Cable is standing at the front foot at the start of the week, though recovery attempts were so far limited.
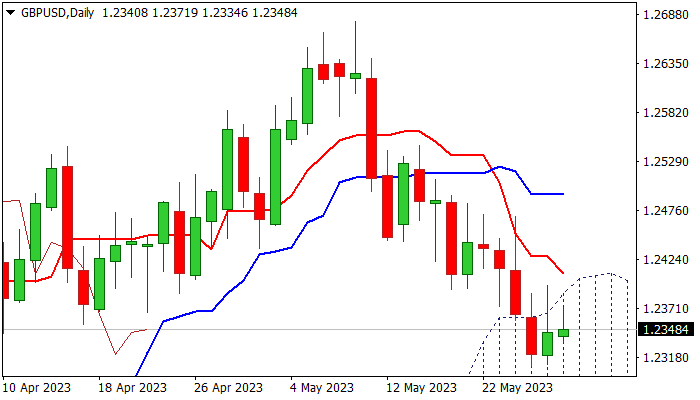
Near-term action remains capped by the top of rising daily cloud for the third consecutive day, with strong upside rejection on Friday, signaling lack of strength for more significant recovery for now.
Signals on daily chart are mixed, as daily cloud top and formation of 10/55DMA bear cross (1.2404) weigh, while fading negative momentum and north-heading stochastic about break out of oversold zone, underpins.
We look for initial signals on clear break above 1.2400 resistance zone (bullish) or loss of 1.2300 support zone (new two-month low / 100DMA) to signal near-term direction.
Violation of upper pivots would open way for stronger recovery and expose targets at 1.2450/1.2500 zone, while break below lower triggers would risk extension of pullback from 1.2679 (2023 high) towards supports at 1.2240/1.2180.
Res: 1.2400; 1.2450; 1.2472; 1.2500.
Sup: 1.2310; 1.2288; 1.2241; 1.2180.
New Zealand Dollar Stems Nasty Slide
- US markets closed for a bank holiday
- New Zealand dollar steadies after a 3.6% plunge last week
- US inflation higher than expected
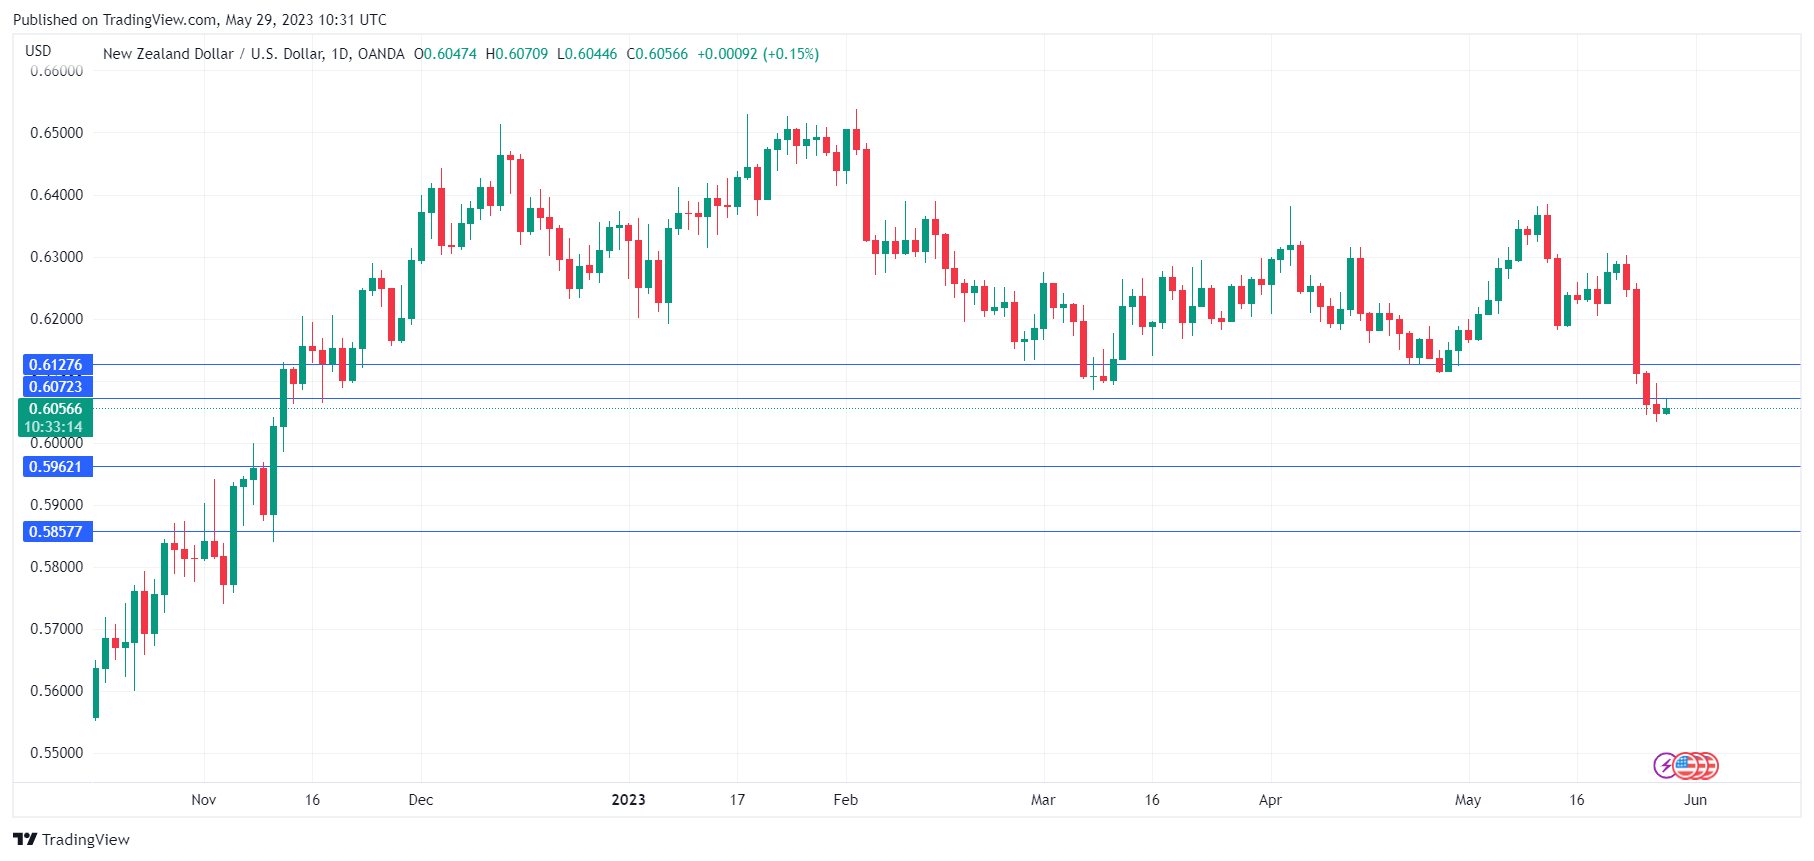
The New Zealand dollar has stabilized on Monday after a disastrous week. In the European session, NZD/USD is trading at 0.6057, up 0.17%.
US reaches debt ceiling deal
US lawmakers hammered out a debt ceiling deal over the weekend. The agreement means that the US will avoid defaulting on its debt, which would have had disastrous implications on the US economy and on global markets. The bitter negotiations between Republicans and Democrats caused plenty of angst in the financial markets and pushed US Treasury yields and the US dollar higher. The agreement now moves to Congress, where it is expected to be ratified this week.
With the debt ceiling crisis behind us, risk sentiment has improved and the New Zealand dollar is in positive territory today. The kiwi was pummelled last week, plunging 3.6% and falling as low as 0.6033, its lowest level since November 7. The New Zealand dollar fell over 2% on Wednesday after the Reserve Bank of New Zealand surprised the markets by signalling that last week’s rate hike was likely the last in the current tightening cycle.
New Zealand’s retail sales also contributed to last week’s woes, with retail sales contracting for a second straight quarter, as high interest rates have cooled the economy. The RBNZ is projecting that the economy will contract in the second and third quarters, which should bring down inflation, which is running at 6.7%, well above the target of 2%.
In the US, inflation continues to surprise on the upside. On Friday, the headline PCE price index climbed 0.4% on the month, versus an estimate of 0.0%, while the core reading jumped 0.8%, double the estimate. Only a month ago, the markets had pegged the probability of a pause at 64%, but currently there is a 64% of a 25-bp rate hike, according to CME’s Fed Watch. Stubborn inflation has interfered with the Fed’s hope of a pause, and this week’s employment report will likely determine whether the Fed goes for a pause or hikes yet again.
NZD/USD Technical
- 0.6072 is a weak resistance line. This is followed by 0.6127
- 0.5962 and 0.5857 are providing support
AUD/JPY Technical: Bulls Got Stalled Again at 200-day MA
AUD/JPY Technical: Bulls Got Stalled Again at 200-day MA
- The medium-term up move of AUD/JPY from the 24 March 2023 swing low of 86.06 got stalled again at the key 200-day moving average.
- Short-term downside movement seems to have resurfaced as indicated by the 4-hour RSI.
- Key resistance to watch will be at 92.70.
Fig 1: AUD/JPY trend as of 26 May 2023 (Source: TradingView, click to enlarge chart)
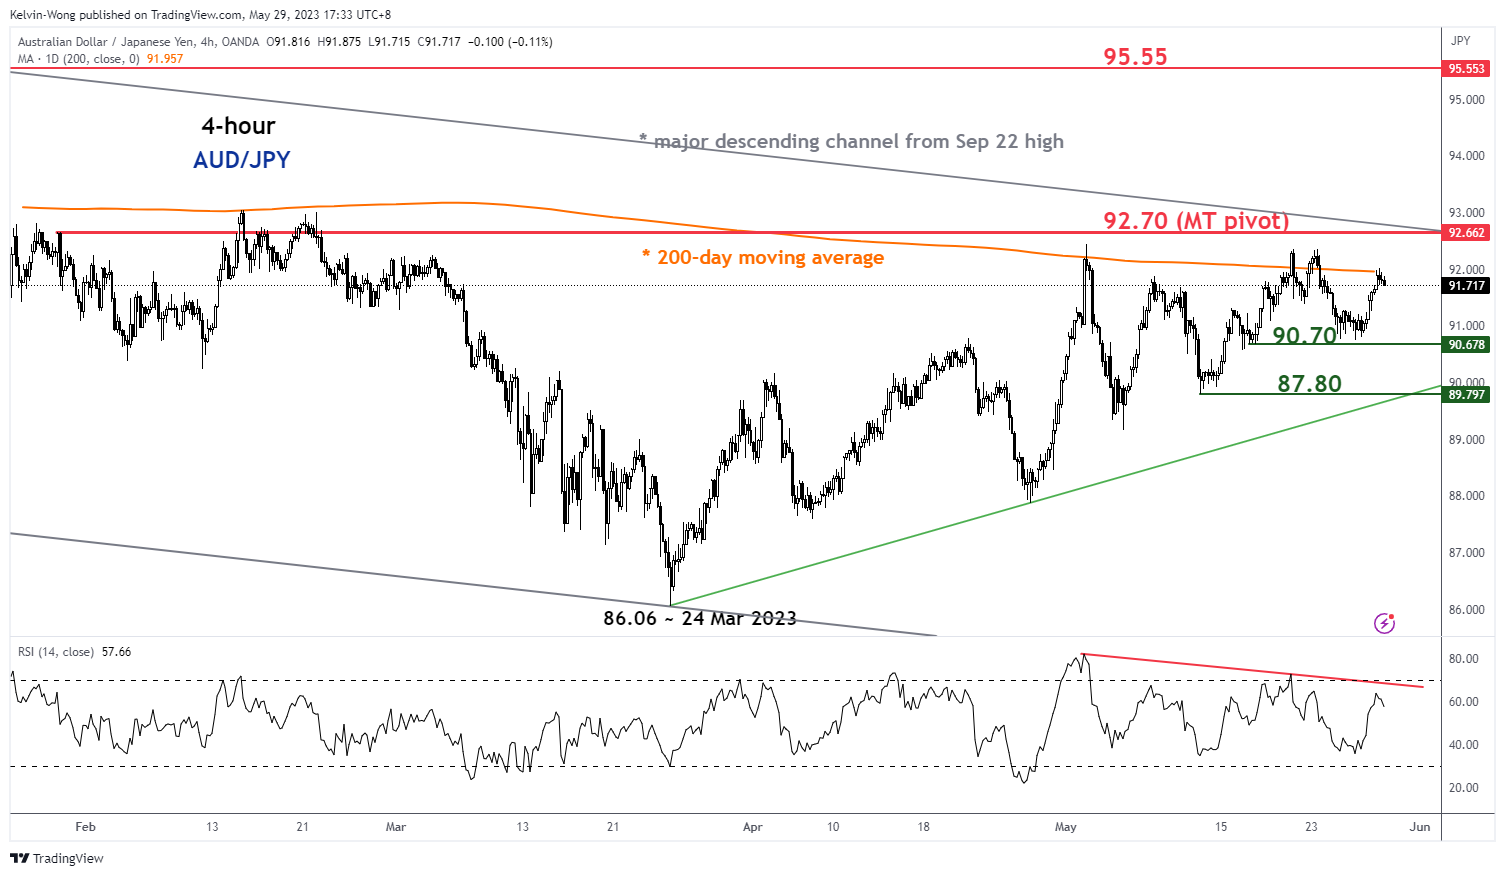
The recent 460 pips rally of the AUD/JPY from its 26 April 2023 minor swing low of 87.87 has stalled at the key 200-day moving average again (now acting as a resistance at around 91.95), thrice so far (on 2 May, 19 May & 23 May) since it’s corrective medium-term up move from 24 March 2023 swing low of 86.06.
In the longer term, the price actions of AUD/JPY are likely considered to be still evolving in a major downtrend phase as it continues to oscillate within a major descending channel in place since its 13 September 2022 high of 92.01.
Short-term downside momentum seems to have resurfaced as observed by the 4-hour RSI oscillator where it has just started to inch down right below a corresponding resistance at the 67% level. The near-term support to watch will be at 90.70 followed by 87.80 (the 11 May swing low & the ascending trendline that is supporting the current corrective medium-term up move since the 24 March 2023 low).
On the flip side, clearance above the 92.70 key medium-term pivotal resistance invalidates the bearish tone to see the next resistance coming in at 95.55 (swing high areas of 21 October/1 November 2022 & close to the 76.4% Fibonacci retracement of the multi-month down move from 13 September 2022 high to 24 March 2023 low.
Moving Past Debt-Ceiling Woes, Bitcoin Turns Attention to Bigger Issues
Market picture
The announcement of the debt ceiling deal triggered a natural spike in interest in Bitcoin on the expectation of increased retail interest in risk assets as institutional investors in Europe and America head off for a long weekend.
Bitcoin traded as high as $28.4K at the start of Monday’s Asian session but fell back to $27.8K by the beginning of European trading. Meanwhile, the top cryptocurrency has been rising daily since the 25th, pushing back from support at $25.8K, near the 200-week moving average. This move looks like an exit for speculators. However, the market’s attention may shift to more market-heavy issues, such as slowing economic growth and high-interest rates.
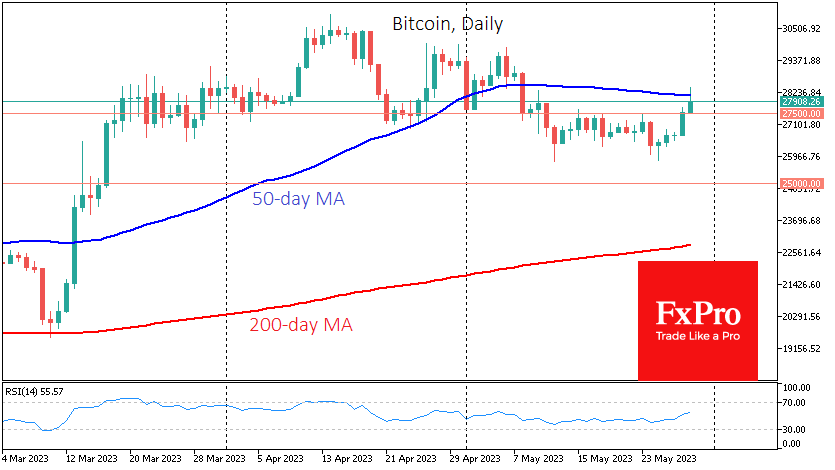
The bulls are now trying to get Bitcoin back above its 50-day moving average, which would signal a return to a medium-term uptrend. The ability to close above $28.15 at the end of the day could attract more buyers to Bitcoin, while staying lower would be a reason to sell on the upside.
News background
Commodity Futures Trading Commission (CFTC) commissioner Christy Goldsmith Romero said she is ready to regulate the crypto industry with the US Securities and Exchange Commission (SEC).
Users of cryptocurrency exchange Tornado Cash have sued the US Treasury Department for imposing sanctions on the service, claiming that banning open-source software violates the US Constitution.
ECB board member Fabio Panetta assured that the regulator would not have access to the personal data of digital euro holders (CBDC). He noted the need to balance ensuring privacy and combating money laundering and terrorist financing.
High profitability enables stablecoin issuer Tether to venture into new business areas, according to the company’s CTO Paolo Ardoino. Tether made a net profit of $1.48 billion in the first quarter, double that of the previous period.
The National Debt Ceiling to Be Raised — the Price of Bitcoin Is Growing
US President Joe Biden and top Republican Kevin McCarthy reached a tentative agreement Saturday night to suspend the federal government's USD 31.4 trillion debt ceiling, ending a months-long deadlock. Biden said that the deal is a compromise, and the parties discussing the ceiling increase will not get everything they want.
The deal has yet to pass congressional approval, but the stock market reacted positively as the price of the E-mini S&P 500 futures reached a year's high on Monday morning. The positive effect may intensify tomorrow — after all, today the financiers of the USA, Europe and Britain have a day off (Memorial Day).
But the price of bitcoin seems to have fully reflected the positive impact of the increase in the national debt ceiling; on Sunday, the BTC exchange rate against the US dollar rose by about 4.5%.
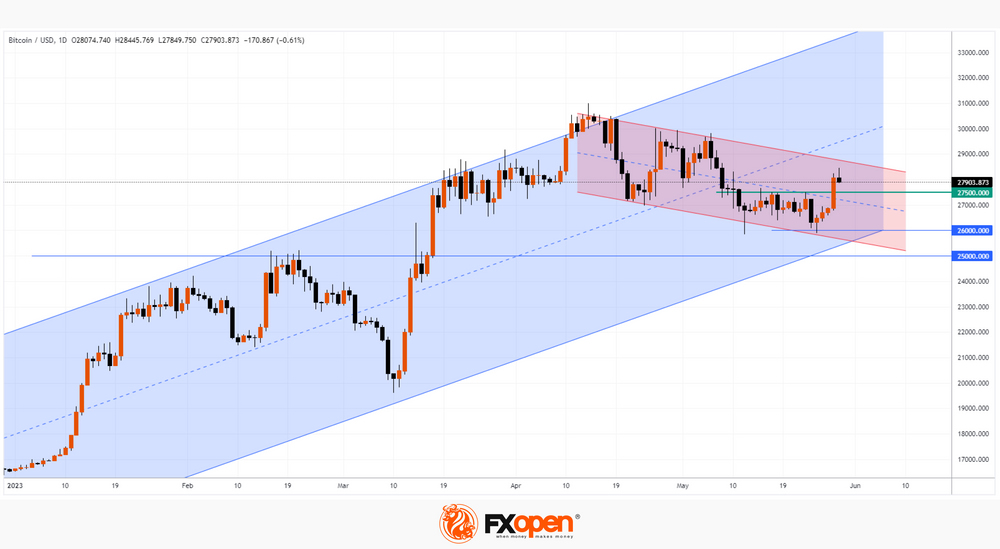
The bitcoin chart shows that the BTC price has found support in the area of the intersection:
→ the lower line of the descending channel (shown in red);
→ support from the psychological mark of USD 26k for bitcoin — it showed its effect on May 12.
However, this morning the price of bitcoin is decreasing. As long as the price is above the level of 27,500 (which served as resistance in the second half of May), this decrease can be regarded as a technical correction from the upper line of the red descending channel after the Sunday impulse. Perhaps, after the correction, the bulls will attempt to overcome it.
GBP/USD Eyes Fresh Increase While USD/CAD Dips To Support
GBP/USD is attempting a fresh increase from the 1.2310 support. USD/CAD is correcting gains and approaching the 1.3585 support.
Important Takeaways for GBP/USD and USD/CAD Analysis Today
- The British Pound declined steadily from the 1.2475 resistance zone.
- There is a key bearish trend line forming with resistance near 1.2360 on the hourly chart of GBP/USD at FXOpen.
- USD/CAD is correcting gains from the 1.3650 resistance zone.
- There is a declining channel or a bullish flag pattern forming with resistance near 1.3620 on the hourly chart at FXOpen.
GBP/USD Technical Analysis
On the hourly chart of GBP/USD at FXOpen, the pair started a major decline from the 1.2475 zone. The British Pound declined below the 1.2390 support against the US Dollar.
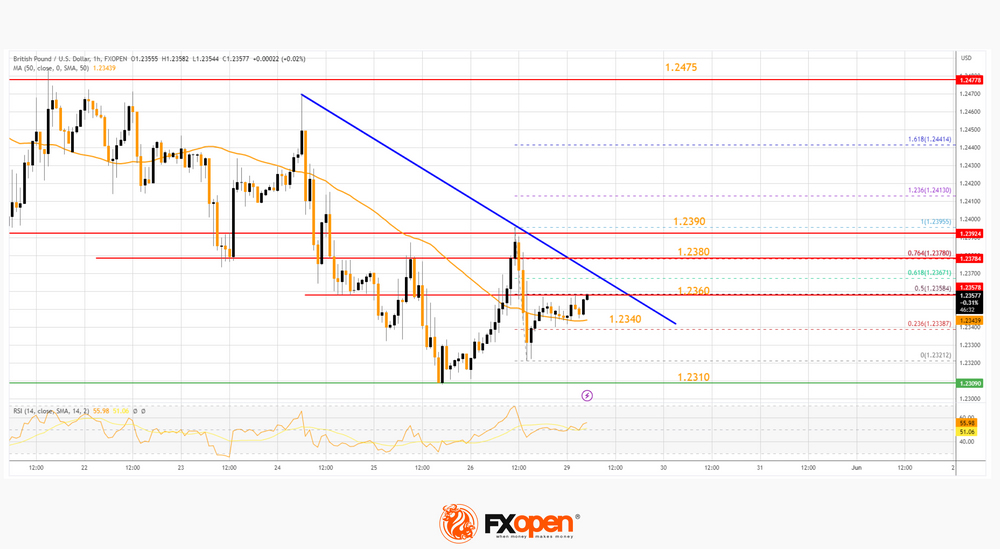
The bears pushed the pair below the 1.2360 support and the 50-hour simple moving average. It retested the 1.2310 support. The recent low was formed near 1.2321 and the price is now attempting a fresh increase.
It is back above the 23.6% Fib retracement level of the downward move from the 1.2395 swing high to the 1.2321 low. Immediate resistance is near a key bearish trend at 1.2360.
The 50% Fib retracement level of the downward move from the 1.2395 swing high to the 1.2321 low is also near the trend line resistance. The first major resistance on the GBP/USD chart is near the 1.2380 level. The next major resistance is near the 1.2390 level. Any more gains could lead the pair toward the 1.2475 resistance in the near term.
If there is no upside break and RSI dips below 50, the pair might start a fresh decline. Initial support sits near the 50-hour simple moving average at 1.2340. The next major support sits at 1.2310, where the bulls might take a stand. If there is a downside break, GBP/USD might test the 1.2240 support.
USD/CAD Technical Analysis
On the hourly chart of USD/CAD at FXOpen, the pair was able to climb above the 1.3550 resistance. However, the US Dollar struggled near 1.3650 against the Canadian Dollar.
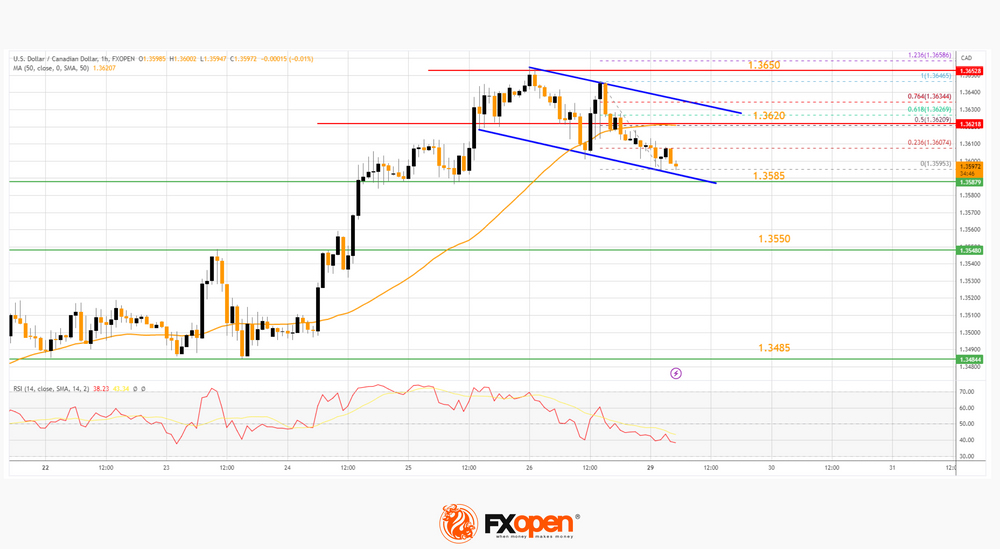
A high was formed near 1.3646 and the pair is now correcting gains. There was a move below the 1.3620 support and the 50-hour simple moving average. A low is formed near 1.3595 and the pair is now consolidating.
Immediate resistance is near the 23.6% Fib retracement level of the downward move from the 1.3646 swing high to the 1.3595 low at 1.3608. The next major resistance is near the 50-hour simple moving average.
There is also a declining channel or a bullish flag pattern forming with resistance on the same USD/CAD chart. It is close to the 50% Fib retracement level of the downward move from the 1.3646 swing high to the 1.3595 low.
A close above the 1.3620 level might send the pair toward the 1.3650 level. Any more gains could open the doors for a test of the 1.3700 level.
On the downside, the pair is likely to find bids near 1.3585. The next major support is near the 1.3550 level. A downside break below the 1.3550 support level could push the pair further lower. The next major support is near the 1.3500 zone, below which the pair might revisit the 1.3440 level.
EURUSD Turns Green But Not Bullish Yet
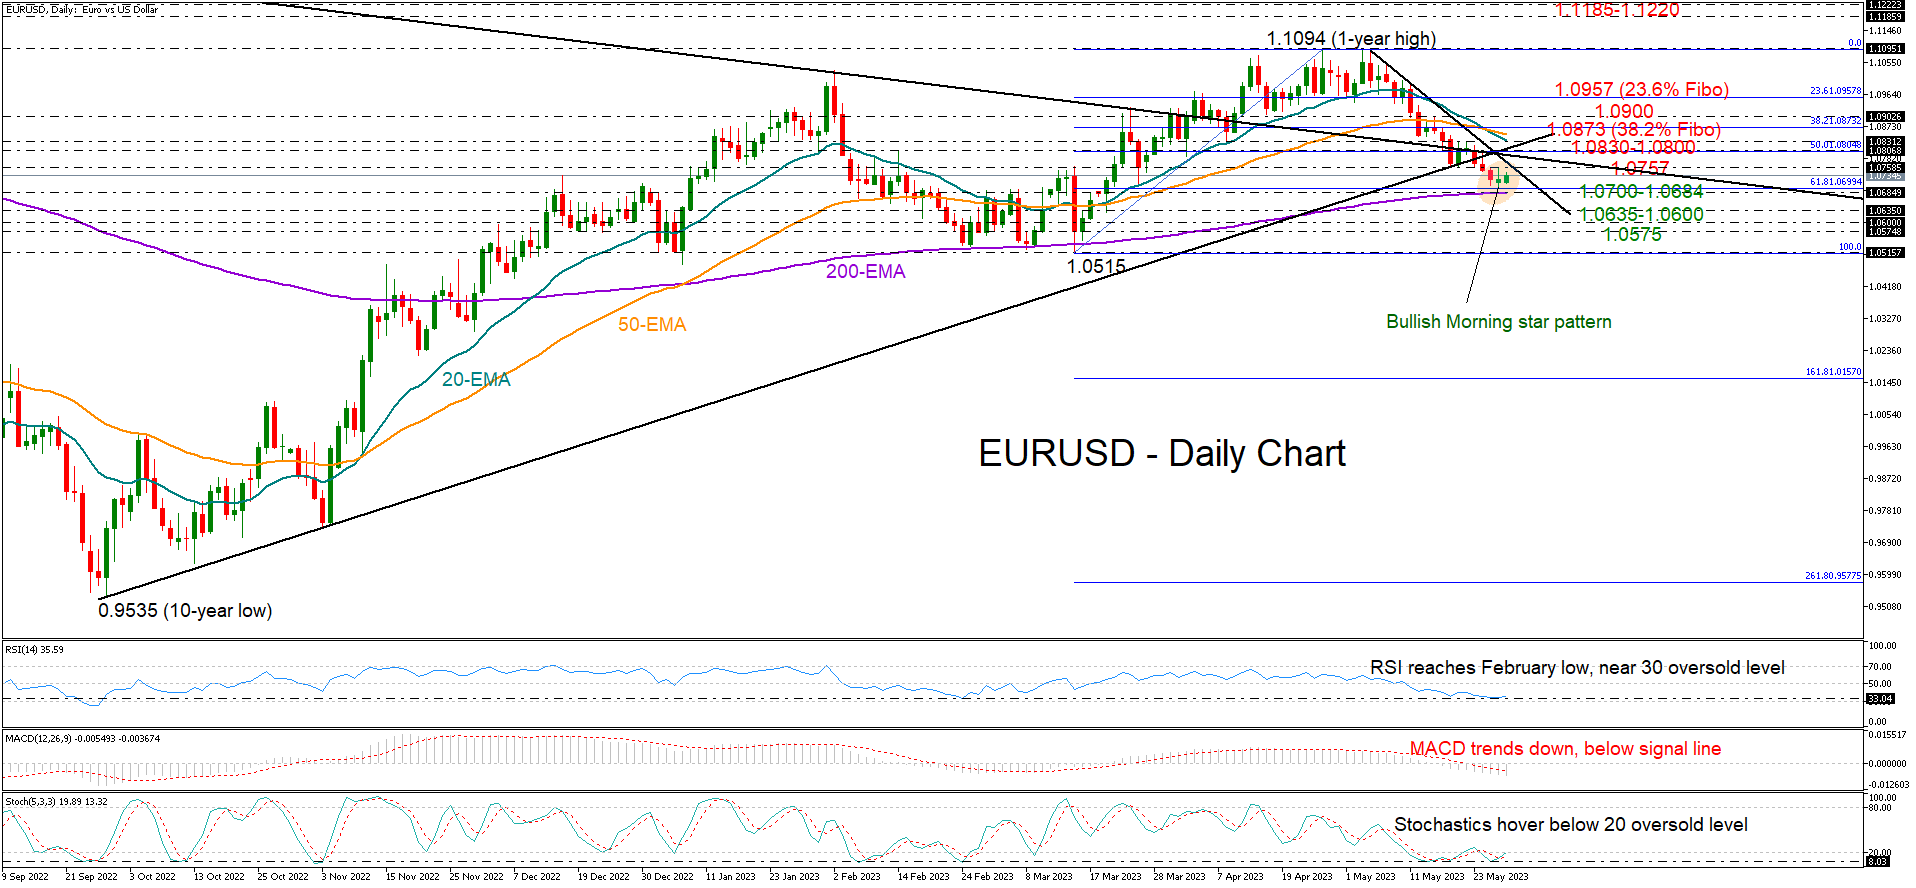
EURUSD switched to recovery mode after its bearish wave from a one-year high stabilized around a two-month low of 1.0700 on Friday. Interestingly, the 61.8% Fibonacci retracement zone of the previous bullish run cemented that floor.
Technically, the pair needs to create a long green candlestick in order to confirm a bullish three-candle morning star pattern. Ideally, a close above Friday’s high of 1.0757 could boost recovery towards the key constraining zone of 1.0800 formed by September’s broken support trendline and the 50% Fibonacci area. Notably, the resistance line from May 2021 is located in the same region. Not far above, the 20- and 50-day exponential moving averages (EMAs) could be the next challenge, likely delaying an extension towards the 38.2% Fibonacci of 1.0873. If the latter point gives way, we expect the price to face some consolidation around the 1.0900 psychological mark before speeding up to the 23.6% Fibonacci of 1.0957.
Discouragingly, the technical indicators cannot promise a meaningful rally. Even though the RSI has reached its February low near its 30 oversold mark, it’s still comfortably below its 50 neutral mark. Also, the stochastic oscillator has yet to exit the oversold zone. Meanwhile, the MACD is some distance below its red signal line and well below zero.
In trend signals, the 20-day EMA has posted a clear bearish cross with the 50-day EMA for the first time since June 2021, endorsing the short-term negative direction in the market.
Still, sellers may not take control unless the price tumbles below its 200-day EMA at 1.0684. If that proves to be the case, selling pressures may intensify towards the 1.0635-1.0600 region, where the pandemic downfall bottomed out in March 2020. A sharper decline could initially test the 1.0575 barrier before heading for the March 2023 low of 1.0515. Another failure here would downgrade the long-term outlook to negative.
Summing up, although EURUSD seems to be looking for a rebound, a potential bullish climb could prove short-lived if the pair fails to overcome the 1.0800 mark.
Gold Pauses Decline But Bearish Bias Holds
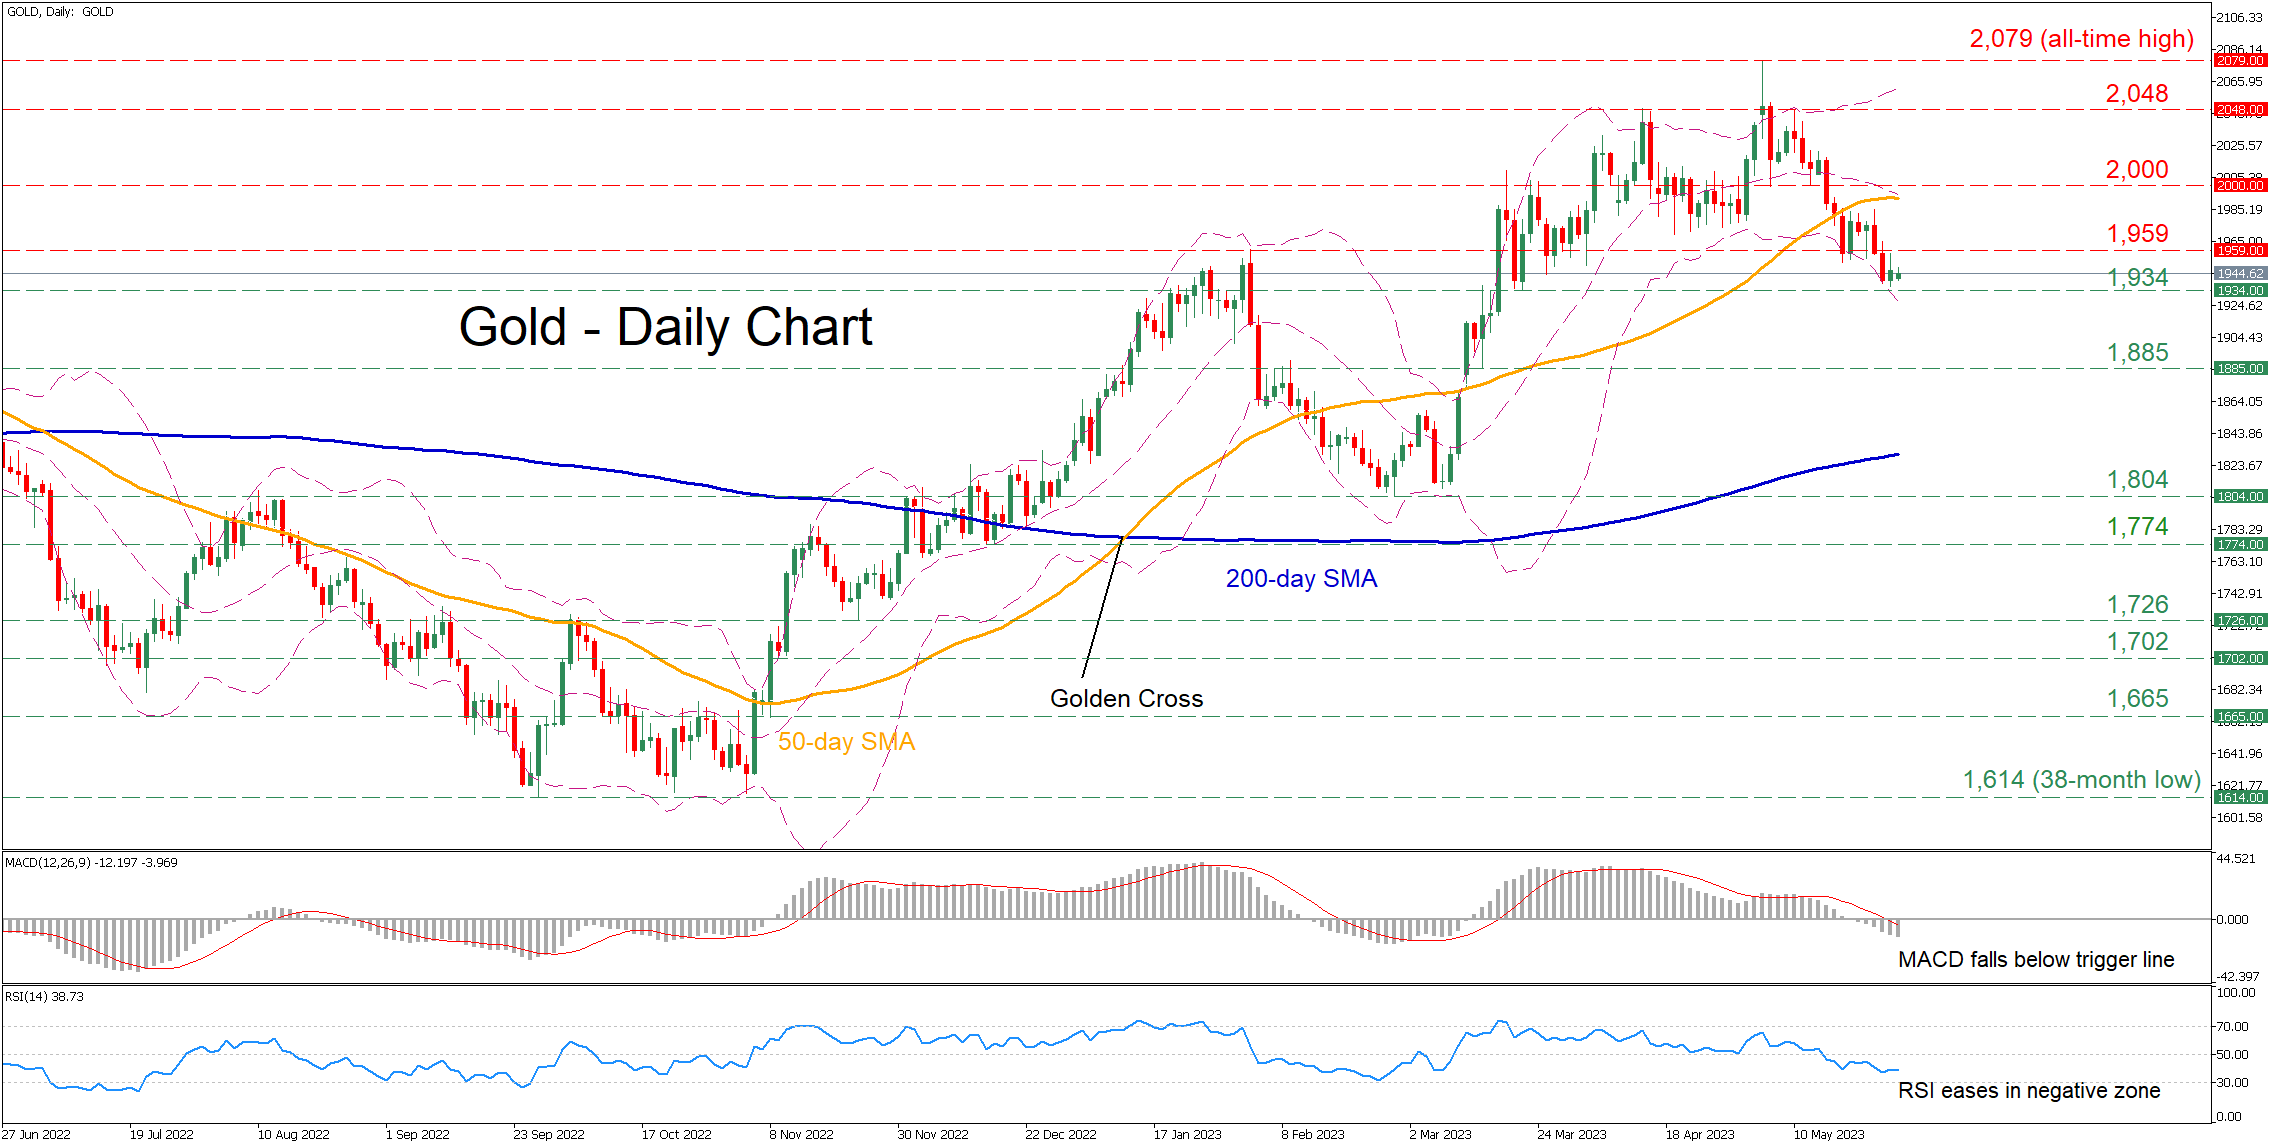
Gold experienced a remarkable surge since early March, surpassing some crucial technical levels to peak near the all-time high of 2,079 in early May. However, bullion has been in a steady downtrend since then, falling beneath its 2,000 psychological mark and creating a bearish structure of consecutive lower lows.
The momentum indicators currently suggest that bearish forces reign supreme. Specifically, the MACD is softening beneath zero and its red signal line, while the RSI has flatlined below its 50-neutral mark.
If the downside correction extends, the price could challenge the March support of 1,934. Should that barricade fail, the spotlight could turn towards 1,885 before the 2023 bottom of 1,804 gets tested. Further declines might then cease at 1,774.
Alternatively, should buyers regain the upper hand, the February high of 1,959 could prove to be the first barrier for the price to clear. A violation of that zone could set the stage for the 2,000 psychological mark before 2,048 comes under examination. Failing to halt there, the price could ascend to test the all-time high of 2,079.
Overall, gold has been losing ground in the short-term, appearing to be unable to halt its retreat. For that bearish sentiment to alter, the price needs to reclaim the 50-day simple moving average (SMA).
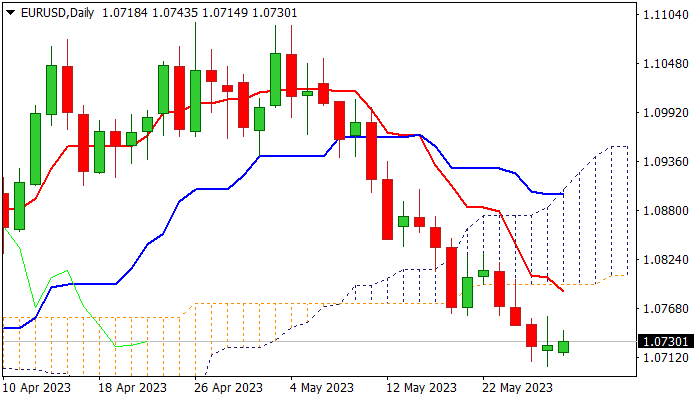
EUR/USD: Larger Bears to Remain Intact While Key 1.0800 Resistance Zone Caps Recovery
The Euro edges higher in early Monday trading, generating initial bullish signal on formation of reversal pattern on daily chart, after Friday’s Doji candle signaled indecision.
Oversold daily studies and weaker dollar on growing optimism about US debt ceiling deal, contribute to euro’s fresh strength.
Stochastic is emerging from oversold territory on daily chart and 14-d momentum turned up (still deeply in the negative zone) sending initial positive signals.
Today’s close above Friday’s high (1.0758) is seen as a minimum requirement in formation of reversal pattern, which will keep renewed bulls in play for attack at key barriers at 1.0800 zone (falling daily Tenkan-sen / Fibo 23.6% of 1.1095/1.0701 / base of thickening daily cloud).
Sustained break here is needed to generate stronger bullish signal and open way for recovery towards 1.0852 (Fibo 38.2%) and 1.0898 (daily Kijun-sen / 50% retracement of 1.1095/1.0701).
Conversely, failure to clear pivotal 1.0800 zone would keep larger bearish structure intact and offer better selling opportunities.
Res: 1.0758; 1.0800; 1.0831; 1.0852.
Sup: 1.0700; 1.0652; 1.0631; 1.0600.