Sample Category Title
Aussie Unchanged ahead of Lowe, CPI
- RBA testifies before a Senate Committee
- Australia releases CPI
- US debt ceiling deal likely to be approved by Congress
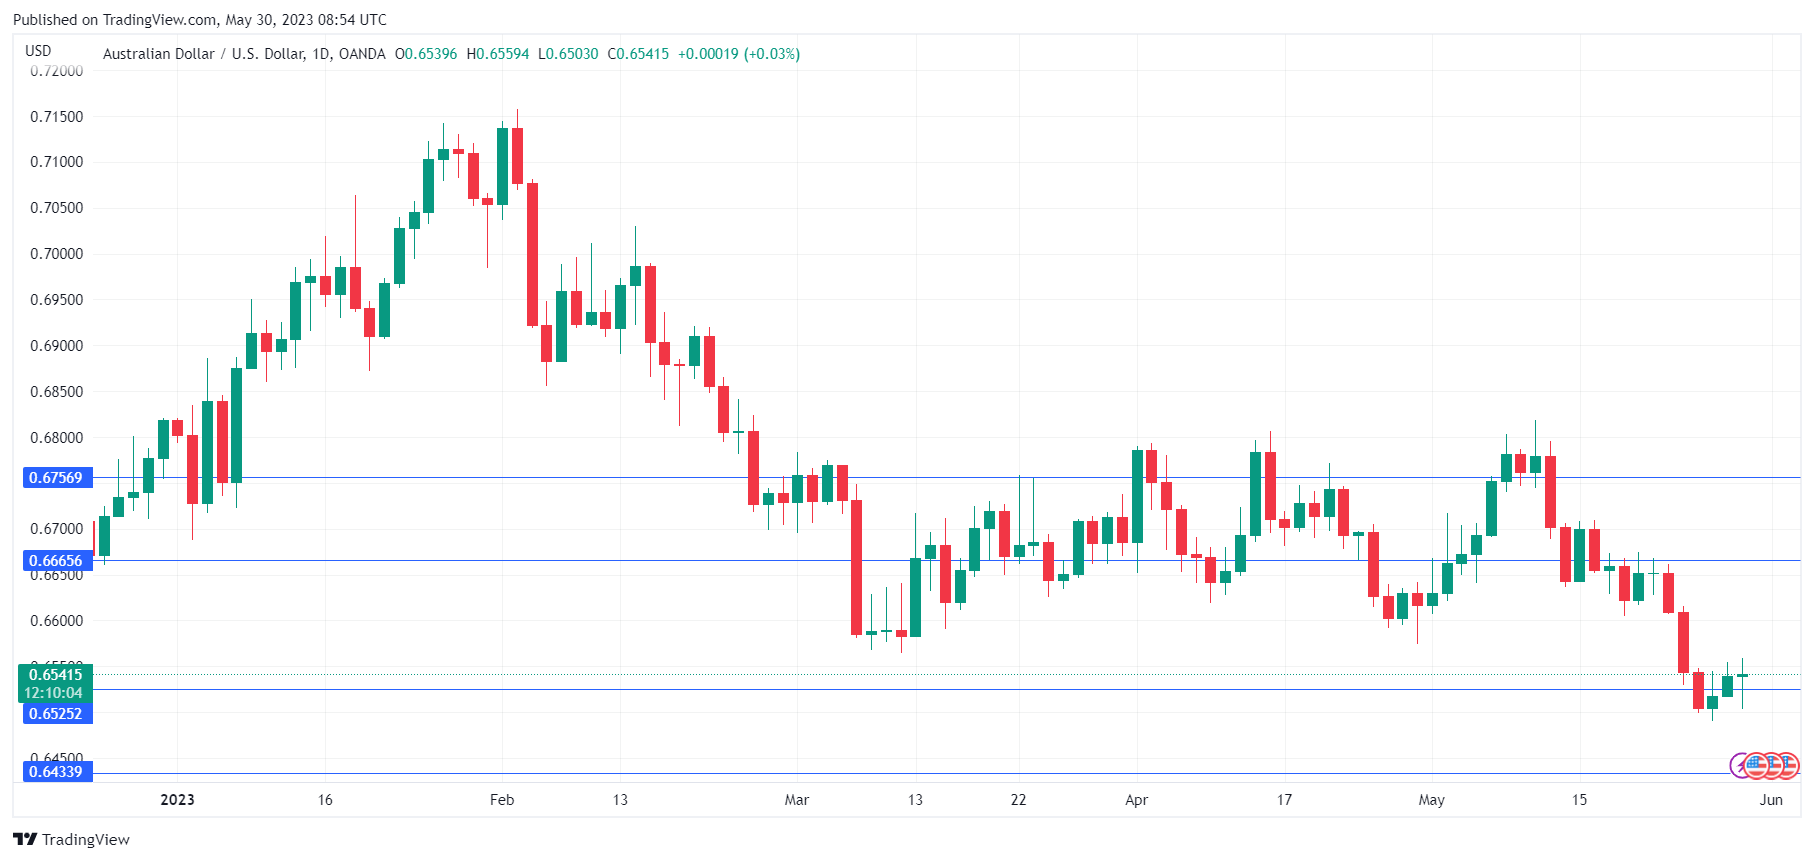
The Australian dollar is drifting lower on Tuesday. AUD/USD is trading at 0.6538 in Europe, unchanged on the day.
RBA Governor Lowe testifies before a Senate Committee later today. Lawmakers will likely press Lowe about rate policy and the battle against inflation. Earlier this month, the RBA shocked the markets by delivering a 25-basis point hike. At the April meeting, the RBA had paused in order to assess the effect of its aggressive rate-hike cycle, and the markets had expected another pause at the May meeting. Lowe will have to reassure the committee that the RBA is following a plan and is not zig-zagging between hikes and pauses.
Attention will quickly shift to inflation, with the release of Australian CPI on Wednesday. Inflation has been falling, and the downturn is expected to continue, with a consensus estimate of 6.4%, down from 7.0% prior. The RBA has pledged to bring inflation back down to its 2% target, but there’s no doubt that it will be a long and bumpy road. The central bank meets on June 6th and is widely expected to pause and maintain the benchmark rate at 3.85%.
The US debt ceiling agreement is a done deal. Well, almost. President Biden and Republican Speaker McCarthy have reached an agreement in principle which must be ratified by both houses of Congress. Some Republicans have threatened to vote against the deal, but with overwhelming support from the Democrats, approval of the deal is very likely. The weeks of uncertainty prior to the deal weighed on risk appetite, and the big winners have been US Treasury yields and the US dollar.
AUD/USD Technical
- There is resistance at 0.6665 and 0.6756
- 0.6525 is a weak support line, followed by 0.6434
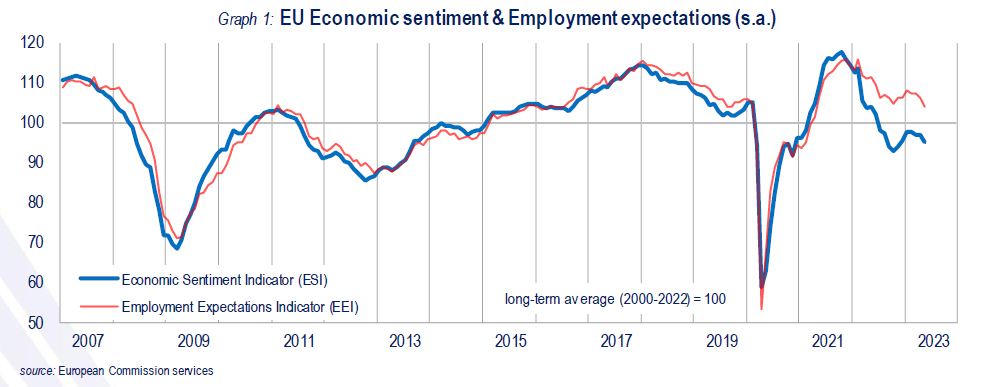
Eurozone economic sentiment dropped to 96.5, EU down to 95.1
Eurozone Economic Sentiment Indicator fell from 99.0 to 96.5 in May. Employment Expectation Indicator dropped from 107.5 to 104.7. Economic Uncertainty Indicator dropped from 22.2 to 21.8.
Eurozone Industry confidence dropped from -2.8 to -5.2. Services confidence dropped from 9.9 to 7.0. Consumer confidence dropped from -17.5 to -17.4. Retail trade confidence dropped from -0.9 to -5.3. Construction confidence dropped from 0.9 to 0.2.
EU ESI dropped from 97.1 to 95.1. EEI dropped from 106.2 to 104.0. EUI dropped from 21.8 to 21.3. Amongst the largest EU economies, the ESI deteriorated in Spain (-3.0), Germany (-2.9), Italy (-2.3) and the Netherlands (-1.5), whereas it improved in Poland (+1.9) and France (+1.5).
EURJPY Fails to Retest 15-Year Peak
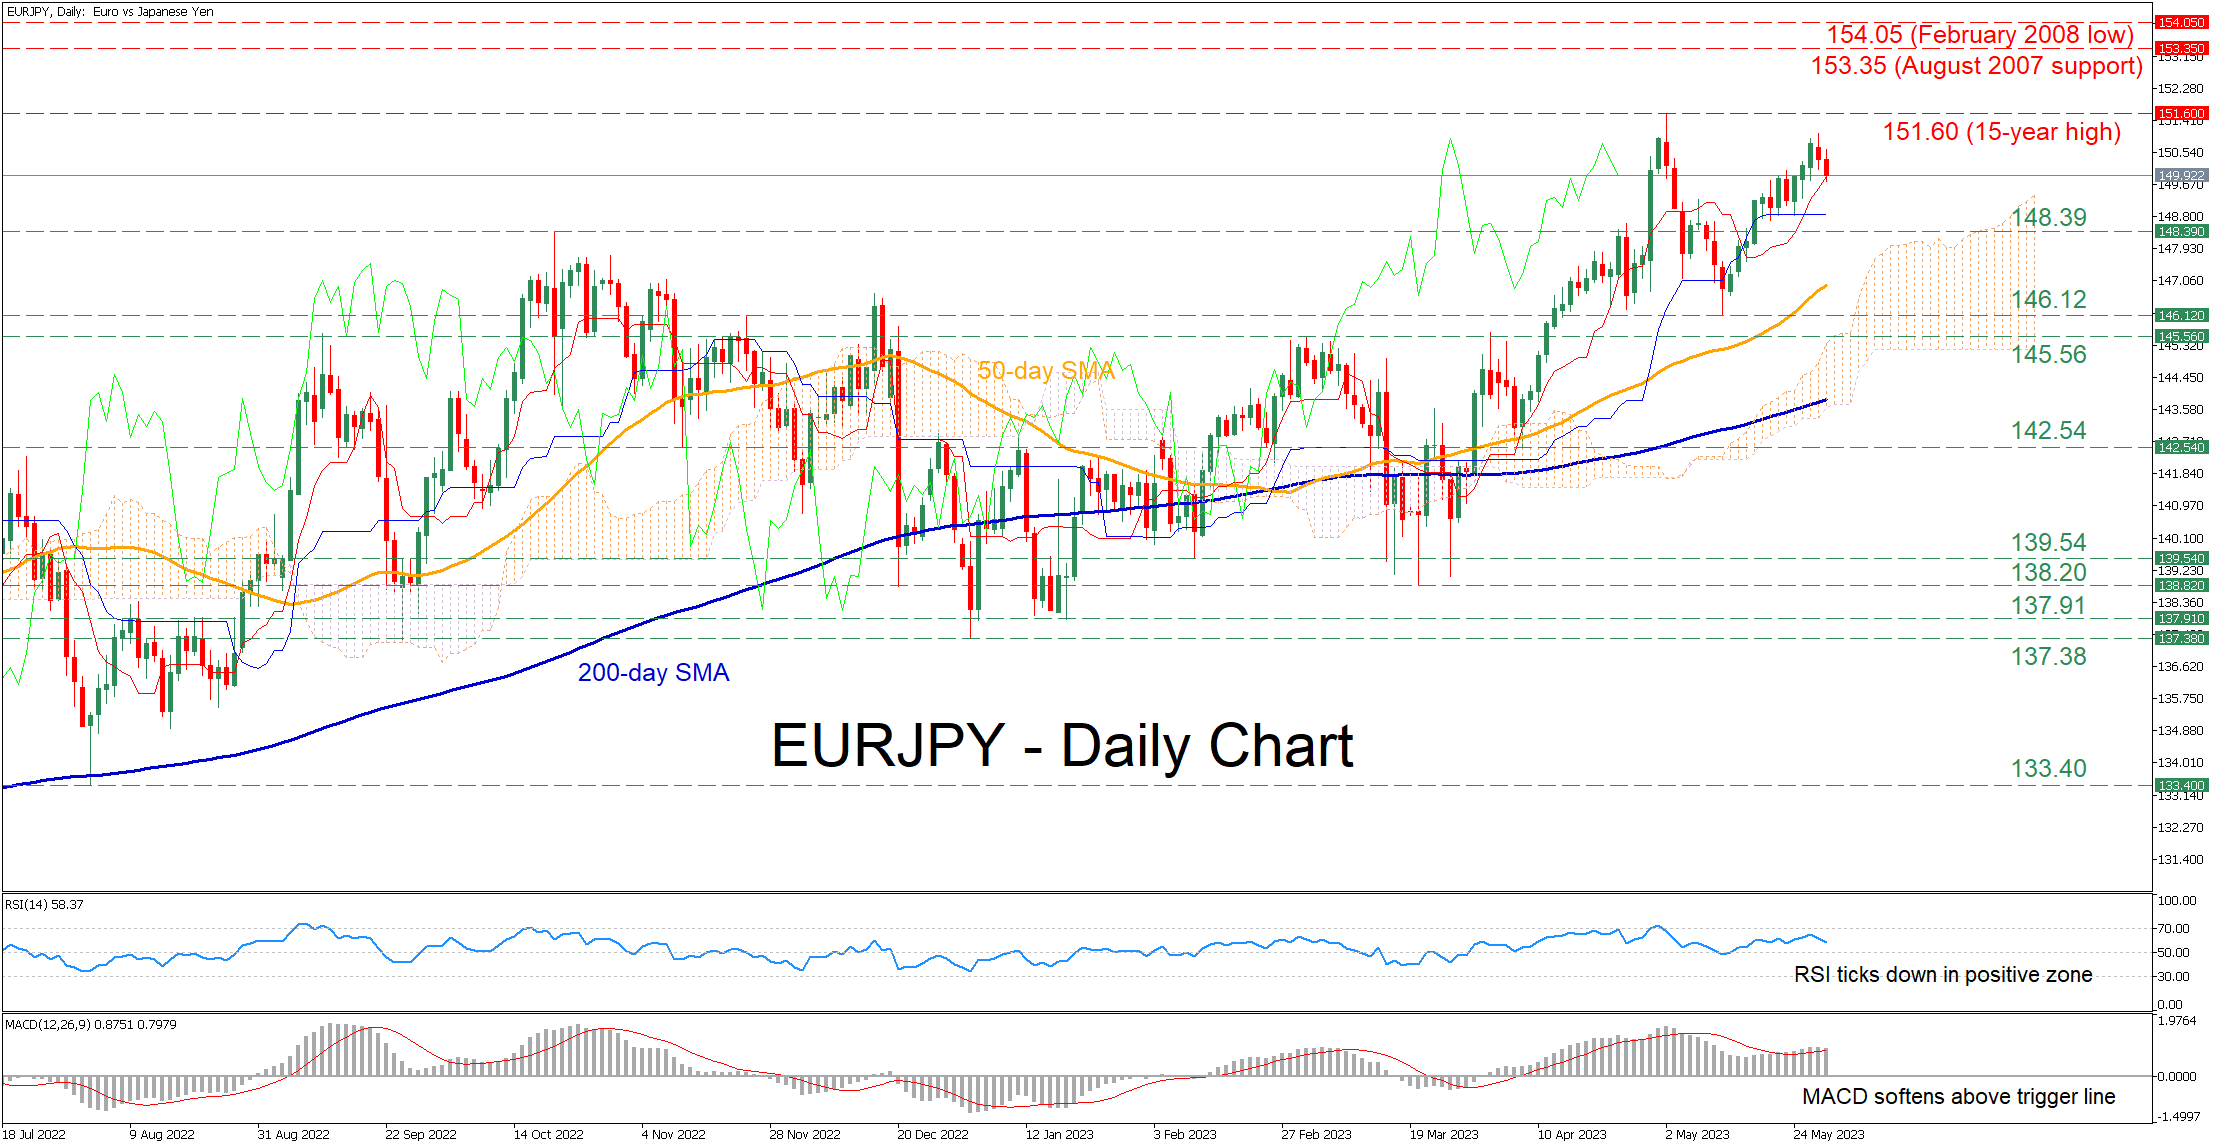
EURJPY had been in a strong uptrend, which ceased at a fresh 15-year high of 151.60 in early May and the pair corrected to the downside. Even though it quickly found its feet and stormed back higher, the latest rebound seems to have faltered just shy of the recent high, potentially forming a double-top pattern.
The short-term oscillators currently reflect a loss of positive momentum. Specifically, the RSI lost some ground but still holds above its 50-neutral mark, while the MACD softened above both zero and its red signal line.
If the recent weakness persists, the October 2022 high of 148.39 could serve as initial support. Retreating lower, the pair could challenge the May low of 146.12 before the 145.56 hurdle appears on the radar. Should that barricade fail, the April bottom of 142.52 could prove to be a tough one for the bears to overcome.
On the flipside, bullish actions could trigger an advance towards the 15-year peak of 151.60. Jumping above that zone, the pair might ascend to form fresh multi-year highs, where the August 2007 support of 153.35 may cap the upside. A violation of that region could set the stage for the February 2008 low of 154.05.
Overall, EURJPY’s latest rebound seems to be running out of steam, with a potential extension of the recent pullback hinting towards the formation of a double-top pattern. Nevertheless, a fresh higher high could open the door for the resumption of the medium-term uptrend.
GBPUSD Stays Under Sellers’ Control Despite Pause
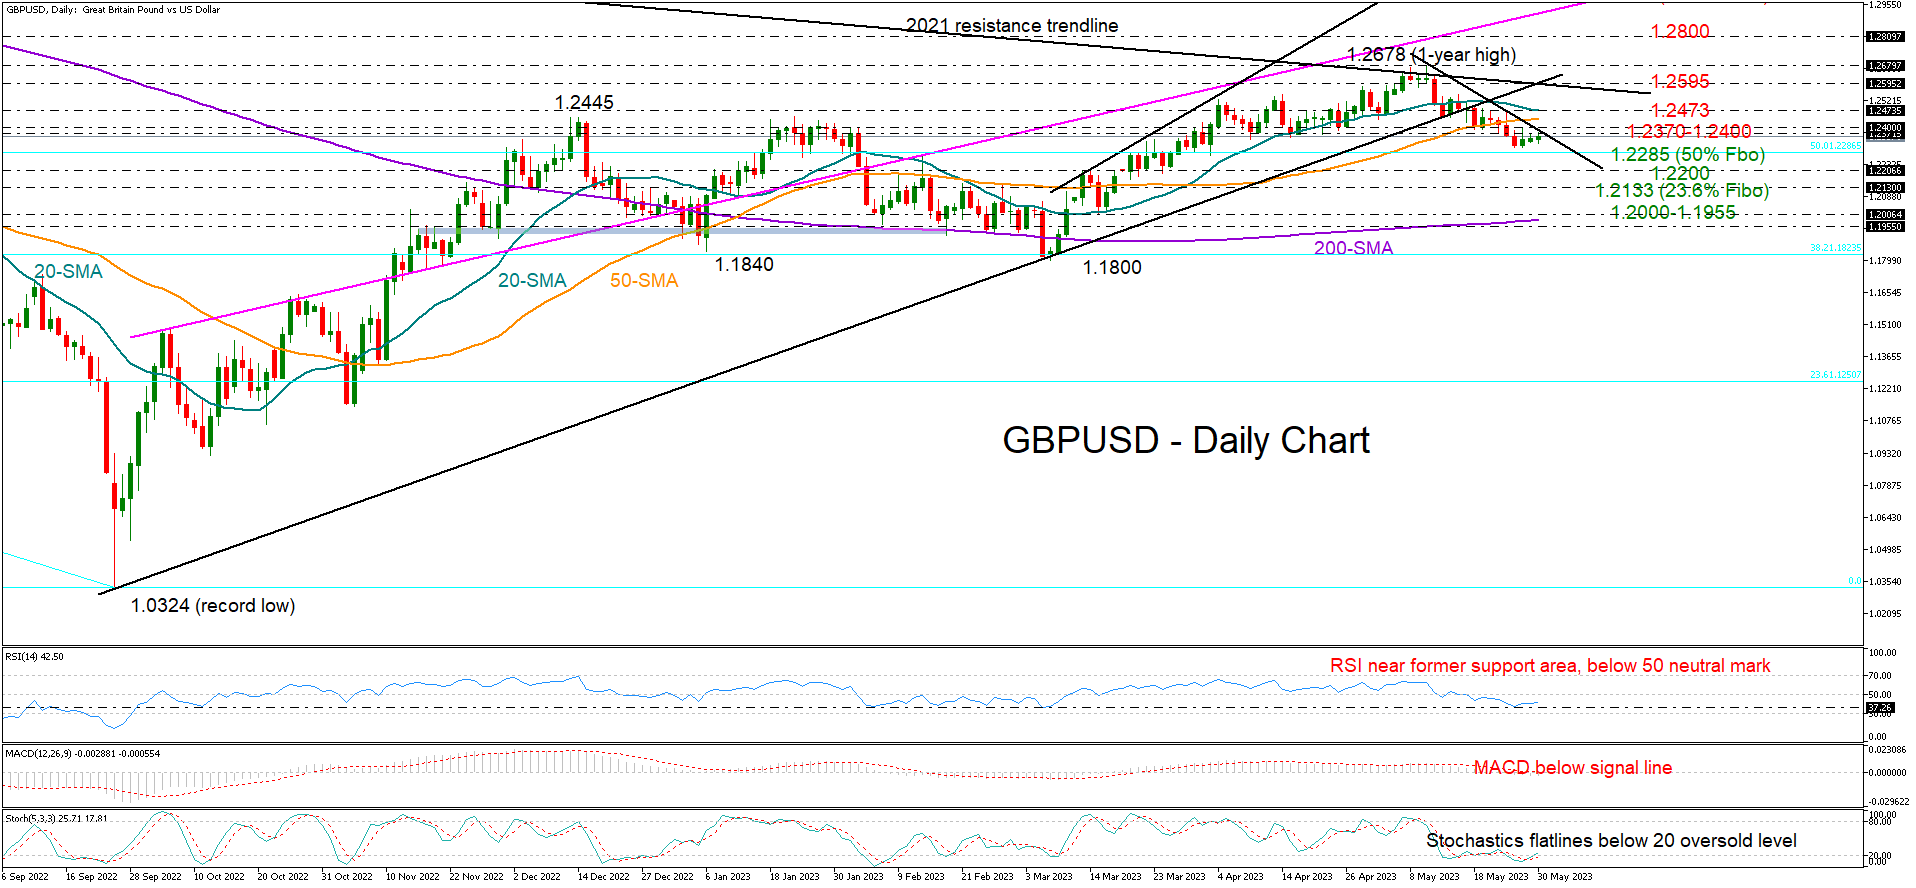
GBPUSD opened the week on a neutral note, consolidating its bearish correction from a one-year high within the 1.2300 zone.
According to the technical picture, the sideways move could be temporary within the bearish wave. The downfall below the 20- and 50-day simple moving averages (SMAs) and beneath the former 1.2445 ceiling could motivate more selling in the short term. The negative trajectory in the RSI and the MACD is another sign that the sell-off has not bottomed out yet.
An upside correction, however, cannot be ruled out either as the RSI has reached its previous support area, while the stochastic oscillator has been flattening within the oversold region for two weeks now.
If selling pressures resume, the 50% Fibonacci retracement of the 2021-2022 downtrend could provide a footing around 1.2285, preventing a continuation towards the 1.2200 mark. A steeper decline could stabilize around the 1.2130 constraining zone, while lower, the door would open for the 1.2000 number and the 200-day SMA.
On the upside, traders will likely wait for a bounce back above 1.2370-1.2400 before they target the 20-day SMA at 1.2473. A successful move above the latter could clear the way towards the tough resistance trendline at 1.2595, which has been capping bullish actions since May 2021. If buying interest persists, the pair may attempt to climb above May’s peak of 1.2678 and continue towards 1.2800, where it paused several times during 2019.
All in all, GBPUSD keeps facing a blurry short-term outlook. The next bearish round could start below 1.2285.
AUDUSD Trades in Bearish Mode
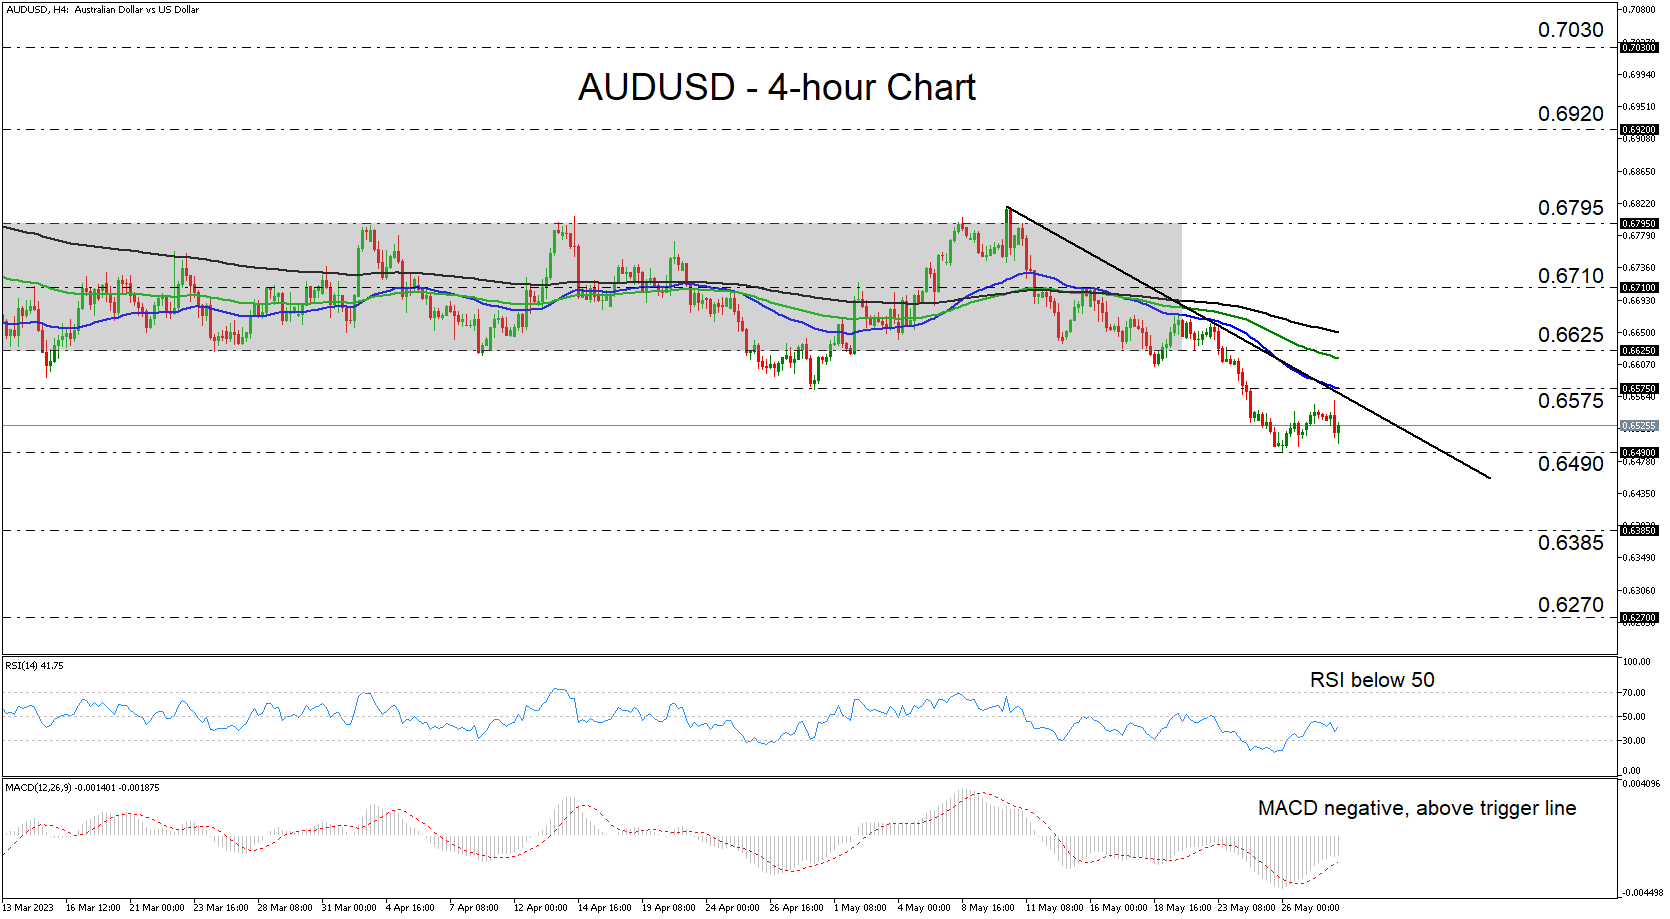
AUDUSD traded lower today after triggering some selling orders slightly below the downtrend line drawn from the high of May 10. In the bigger picture, the pair is not only trading below that line, but also below the key area of 0.6625, which acted as the lower boundary of the sideways range that contained most of the price action between February 24 and May 23. This paints a negative short-term outlook for now.
Both the RSI and the MACD are lying below their equilibrium lines, indicating bearish momentum, and corroborating the notion of further declines. Although the MACD is still running above its trigger line, it shows signs of topping, suggesting that it could cross below that line soon.
That said, for the short-term downtrend to continue, the pair may need to break below the low of May 26 at 0.6490. This will confirm a lower low and may see scope for declines towards the 0.6385 zone, marked by the low of November 10. If the bears don’t stop there, then they may extend their march towards the 0.6270 territory, defined as support by the lows of October 24 and November 3.
On the upside, a break back above 0.6625 will turn the bias back to neutral, while for the picture to brighten, the bulls may have to reach and breach the 0.6795 territory, which is the upper boundary of the aforementioned sideways range. Such a move could set the stage for advances towards the 0.6920 hurdle, marked by the high of February 21, the break of which could pave the way towards the peak of February 14, at around 0.7030.
To sum up, AUDUSD has been trading in downtrend mode below the lower end of a prior sideways range that contained the price action between late February and late May. This suggests that another round of declines is possible, but a dip below 0.6490 may be the move to confirm that.
GBP/JPY Daily Outlook
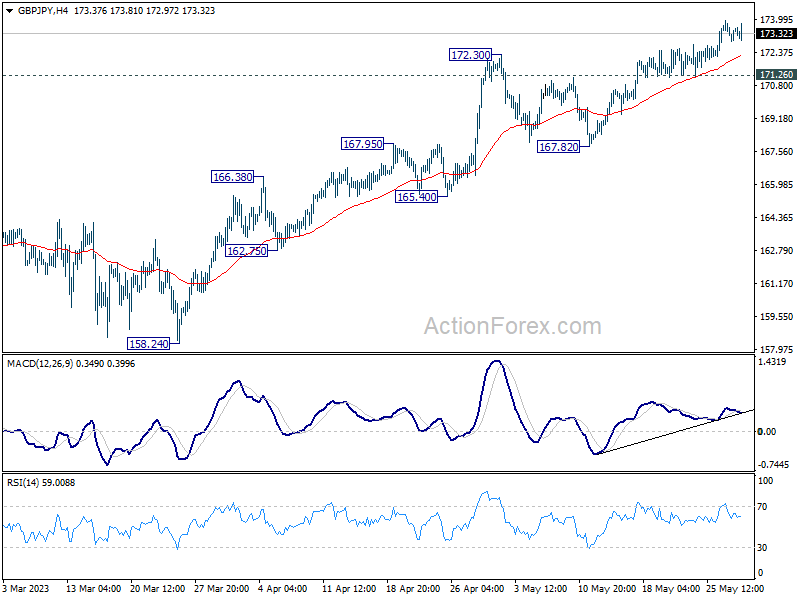
Daily Pivots: (S1) 172.99; (P) 173.48; (R1) 174.02; More...
Further rally is expected in GBP/JPY as long as 171.26 support holds. Current up trend should target 100% projection of 148.93 to 172.11 from 155.33 at 178.51. Nevertheless, break of 171.26 minor support will delay the bullish case, and turn bias to the downside for deeper retreat.
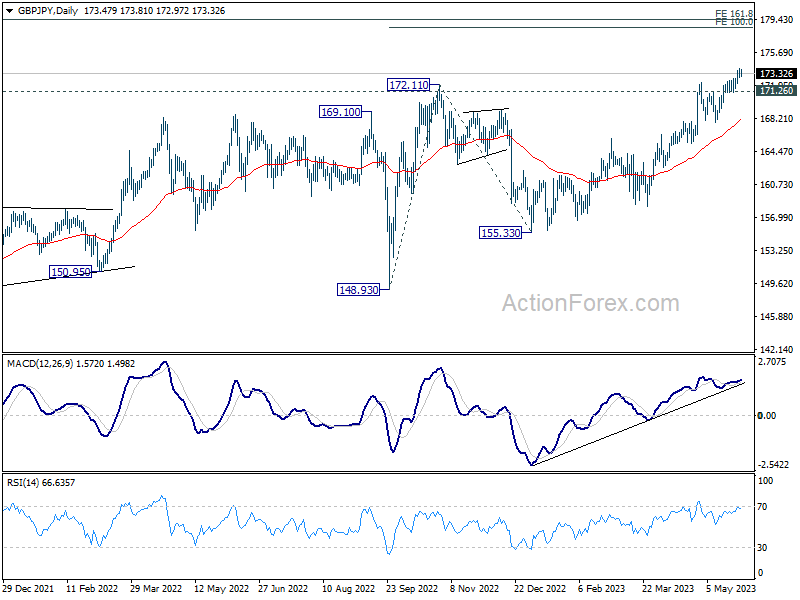
In the bigger picture, up trend from 123.94 (2020 low) is extending. Next target will be 161.8% projection of 122.75 (2016 low) to 156.59 (2018 high) from 123.94 at 178.69. For now, medium term outlook will remain bullish as long as 155.33 support holds, even in case of deep pull back.
EUR/JPY Daily Outlook
Daily Pivots: (S1) 149.98; (P) 150.53; (R1) 150.95; More....
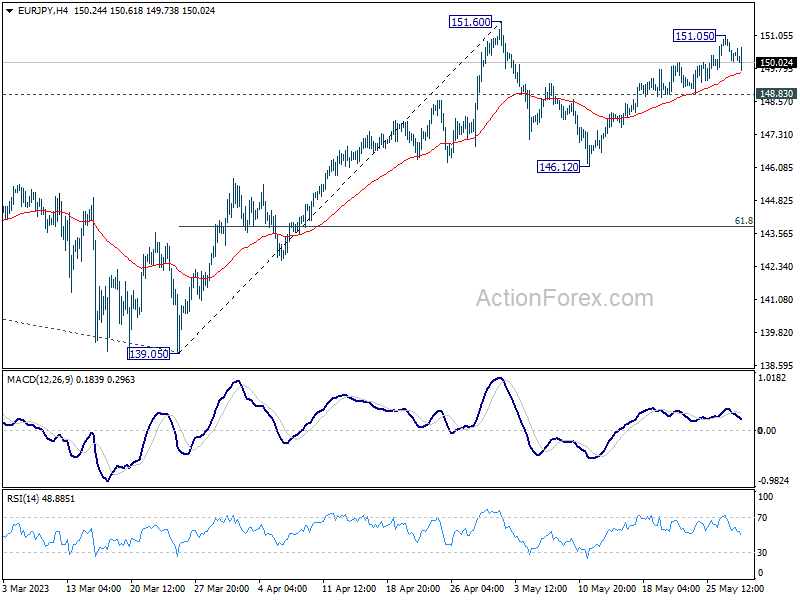
EUR/JPY lost momentum after edging higher to 151.05 and intraday bias is turned neutral first. Above 151.05 will target 151.60 high. Firm break there will resume larger up trend to 153.64 projection level. On the downside, however, break of 148.83 will extend the corrective pattern from 151.60 with another falling leg, back towards 146.12 support.
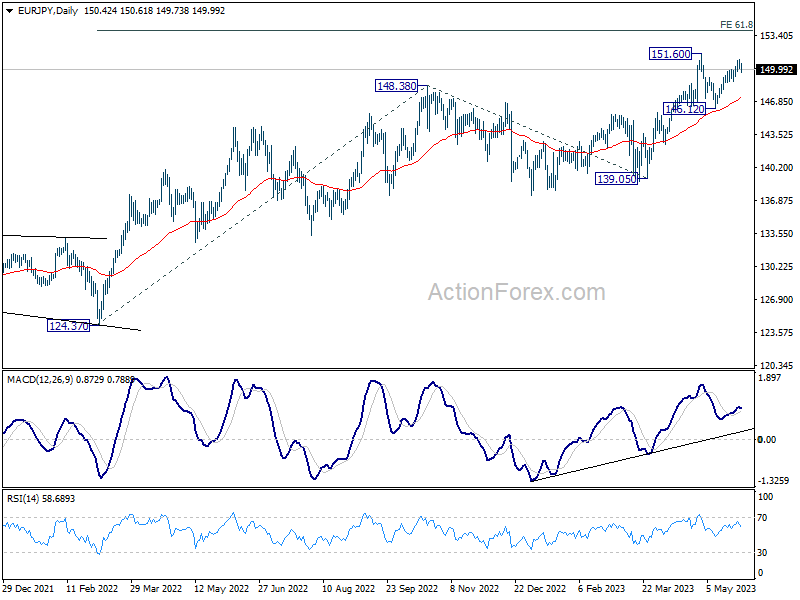
In the bigger picture, rise from 114.42 (2020 low) is in progress. Next target is 61.8% projection of 124.37 to 148.38 from 138.81 at 153.64. Sustained break there will pave the way to 100% projection at 162.82. For now, medium term outlook will remain bullish as long as 139.05 support holds, even in case of deep pull back.
EUR/GBP Daily Outlook
Daily Pivots: (S1) 0.8658; (P) 0.8676; (R1) 0.8687; More...
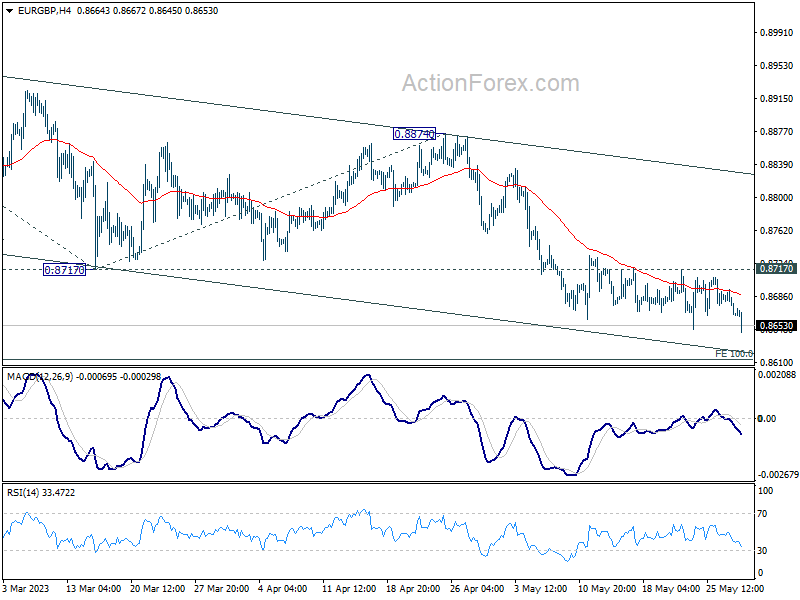
No change in EUR/GBP's outlook. Further decline is expected as long as 0.8717 resistance holds. Current fall from 0.8977 should target 100% projection of 0.8977 to 0.8717 from 0.8874 at 0.8614. On the upside, however, break of 0.8717 will indicate short term bottoming, and turn bias back to the upside for stronger rebound.
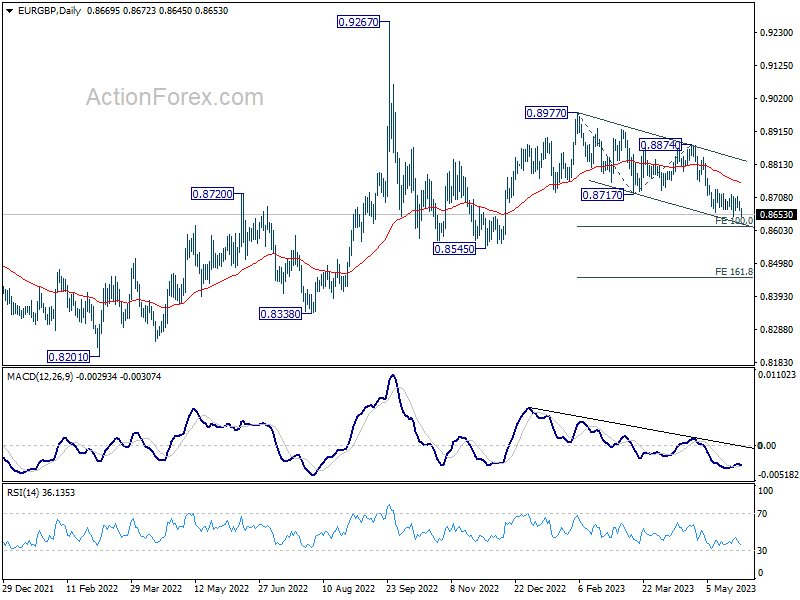
In the bigger picture, current development argues that whole decline from 0.9267 (2022 high) is still in progress. This is part of the long term range pattern from 0.9499 (2020 high). Deeper fall would be seen through 0.8545 support. This will now remain the favored case as long as 0.8874 resistance holds.
EUR/AUD Daily Outlook
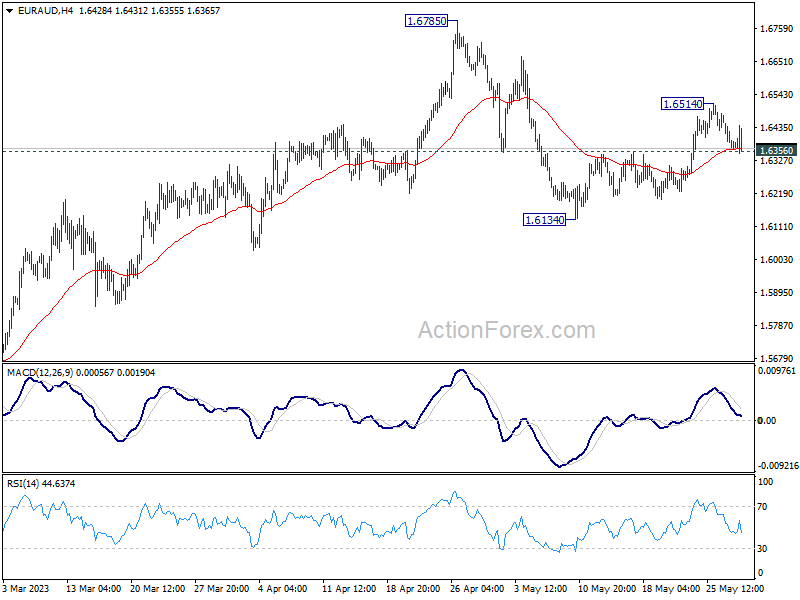
Daily Pivots: (S1) 1.6346; (P) 1.6399; (R1) 1.6428; More...
Intraday bias in EUR/AUD stays neutral at this point. Further rise is expected as long as 1.6356 minor support holds. Firm break of 1.6514 will resume the rebound from 1.6134 to retest 1.6785 high. On the downside, however, break of 1.6309 minor support will turn bias back to the downside for 1.6134 support and below, to resume the fall from 1.6785.
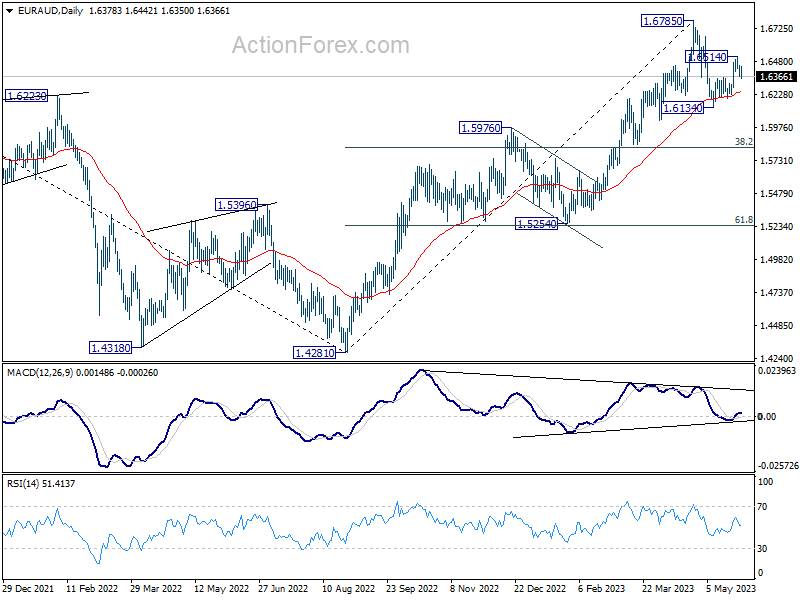
In the bigger picture, whole down trend from 1.9799 (2020 high) should have completed at 1.4281 (2022 low). Further rise should be seen to 61.8% retracement of 1.9799 to 1.4281 at 1.7691 next. For now, outlook will stay bullish as long as 1.5976 resistance turned support holds, even in case of deep pull back.
EUR/CHF Daily Outlook
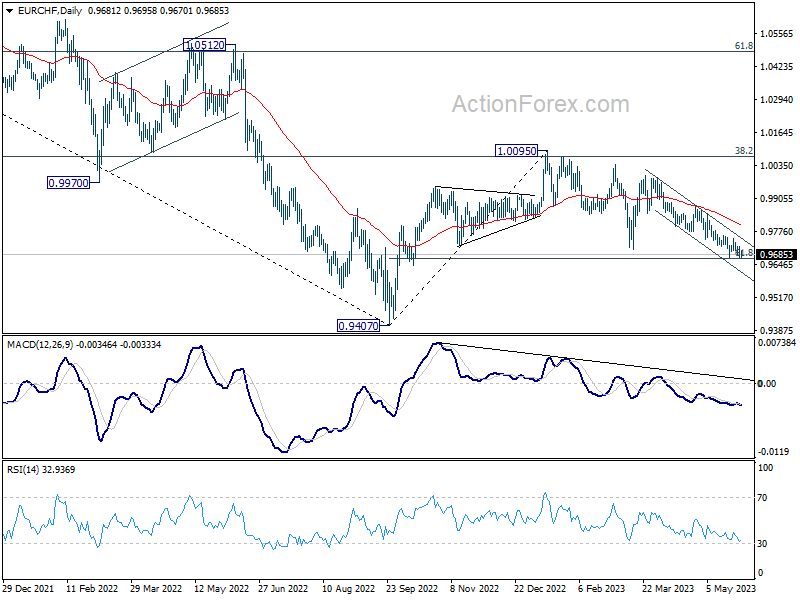
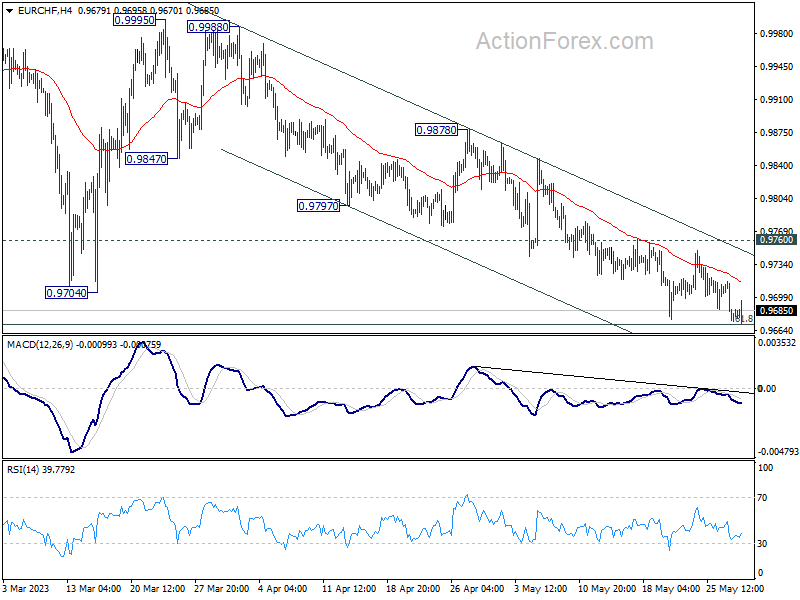
Daily Pivots: (S1) 0.9669; (P) 0.9693; (R1) 0.9710; More...
At this point, strong support is still expected around 61.8% retracement of 0.9407 to 1.0095 at 0.9670 to complete the whole corrective pattern from 1.0095. On the upside, firm break of 0.9760 resistance will confirm short term bottoming, and turn bias back to the upside for 0.9878 resistance next. However, sustained break of 0.9670 will pave the way back to 0.9407 low instead.
In the bigger picture, prior rejection by 38.2% retracement of 1.1149 to 0.9407 at 1.0072 suggests that medium term outlook is staying bearish. The pair is also capped below 55 W EMA (now at 0.9945). Down trend from 1.2004 (2018 high) is not completed yet and is in favor to resume through 0.9407 at a later stage. However, decisive break of 1.0095 resistance will raise the chance of bullish trend reversal. Rise from 0.9407 should then target 1.0505 cluster resistance (2020 low at 1.0505, 61.8% retracement of 1.1149 to 0.9407 at 1.1484).