Sample Category Title
USD/JPY Mid-Day Outlook
Daily Pivots: (S1) 140.08; (P) 140.50; (R1) 140.88; More...
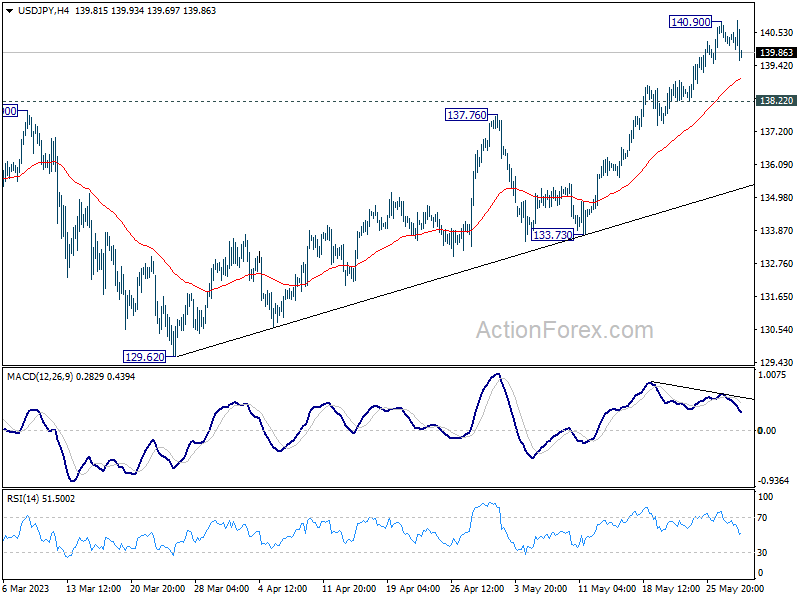
Intraday bias in USD/JPY stays neutral as consolidation from 140.90 is extending. Downside of retreat should be contained above 138.22 support to bring another rally. Break of 140.90 will resume larger rise from 127.20 to 142.48 fibonacci level. However, considering bearish divergence condition in 4 hour MACD, break of 138.22 will confirm short term topping, and turn bias back to the downside for 55 D EMA (now at 135.78).
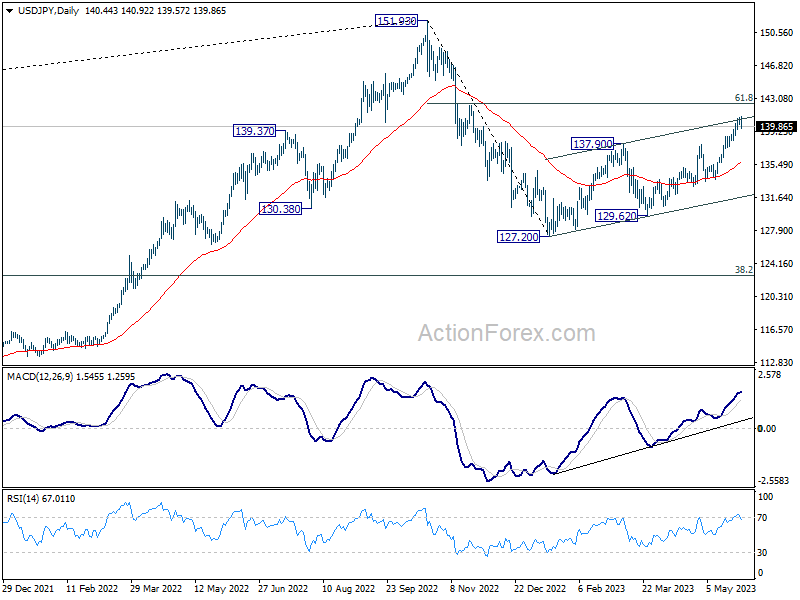
In the bigger picture, rise from 127.20 is seen as the second leg of the corrective pattern from 151.93 high. Stronger rally would be seen to 61.8% retracement of 151.93 to 127.20 at 136.34. Sustained break there will pave the way back to retest 151.93. On the downside, however, break of 133.73 support will argue that the pattern could have started the third leg through 127.20 low.
USD/CHF Mid-Day Outlook
Daily Pivots: (S1) 0.9028; (P) 0.9045; (R1) 0.9062; More...
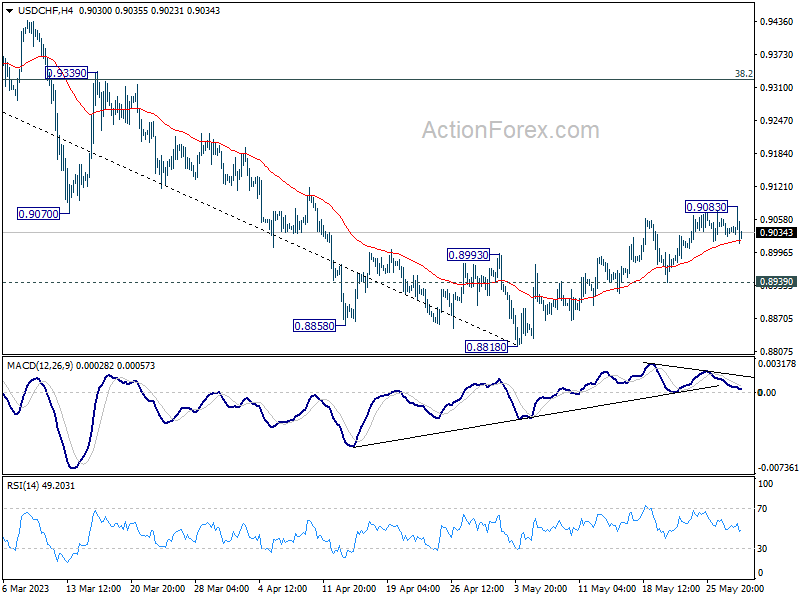
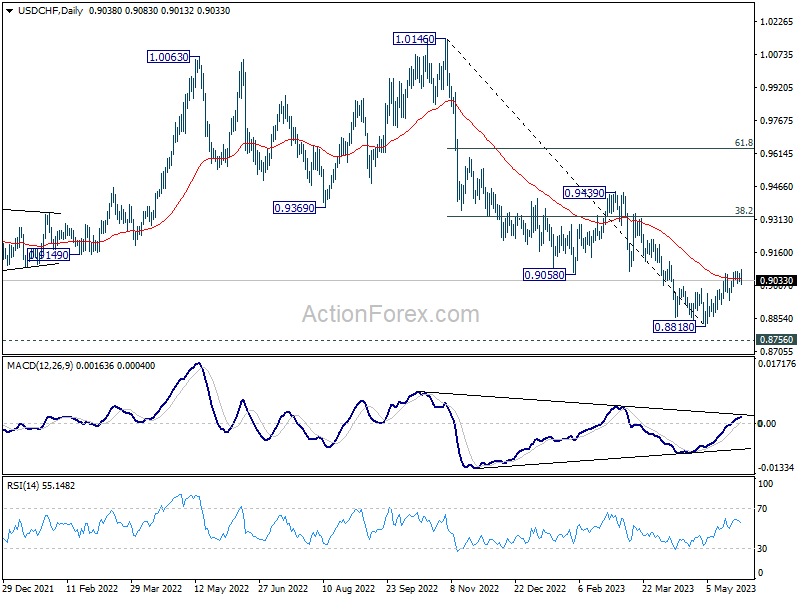
USD/CHF retreated again after edging higher to 0.9083. Intraday bias stays neutral for the moment. Further rally is in favor as long as 0.8939 support holds. On the upside, sustained trading above 55 D EMA (now at 0.9039) should confirm that current rally is at least correcting whole down trend from 1.0146. Further rise should then be seen to 38.2% retracement of 1.0146 to 0.8818 at 0.9325. On the downside, though, break of 0.8939 will bring retest of 0.8818 low instead.
In the bigger picture, fall from 1.1046 (2022 high) is seen as a leg in the long term range pattern from 1.0342 (2016 high). So, downside should be contained by 0.8756 to bring reversal. Sustained break of 0.9058 support turned resistance will be the first sign of medium term bottoming. However, decisive break of 0.8756 will carry larger bearish implications.
EUR/USD Mid-Day Outlook
Daily Pivots: (S1) 1.0695; (P) 1.0720; (R1) 1.0733; More...
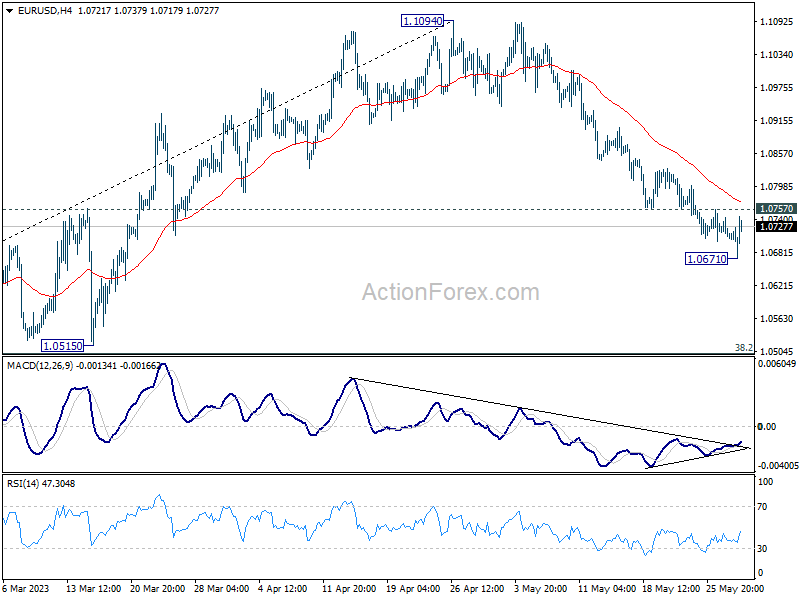
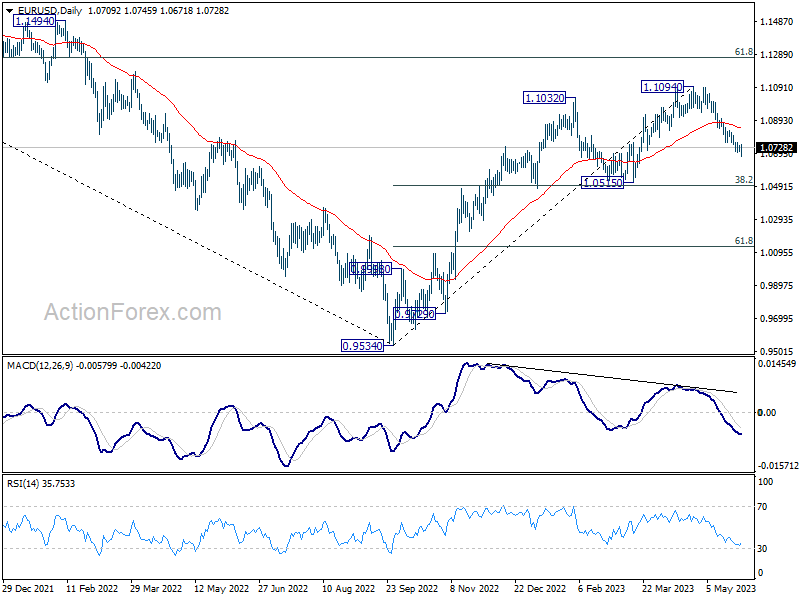
Intraday bias in EUR/USD is turned neutral for consolidations first. Considering bullish convergence condition in 4 hour MACD, break of 1.0757 resistance will indicate short term bottoming at 1.0671. Stronger rebound would be seen back to 55 D EMA (now at 1.0846). On the downside, break of 1.0671 will resume the fall from 1.1094 to 1.0515 cluster support, 38.2% retracement of 0.9534 to 1.1094 at 1.0498.
In the bigger picture, as long as 1.0515 support holds, rise from 0.9534 (2022 low) would still extend higher. Sustained break of 61.8% retracement of 1.2348 (2021 high) to 0.9534 at 1.1273 will solidify the case of bullish trend reversal and target 1.2348 resistance next (2021 high).
GBP/USD Mid-Day Outlook
Daily Pivots: (S1) 1.2336; (P) 1.2354; (R1) 1.2373; More...
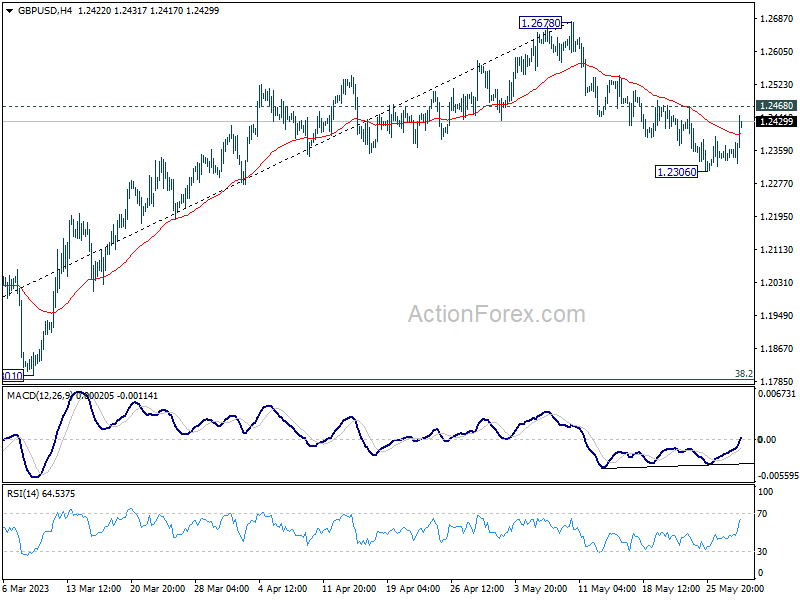
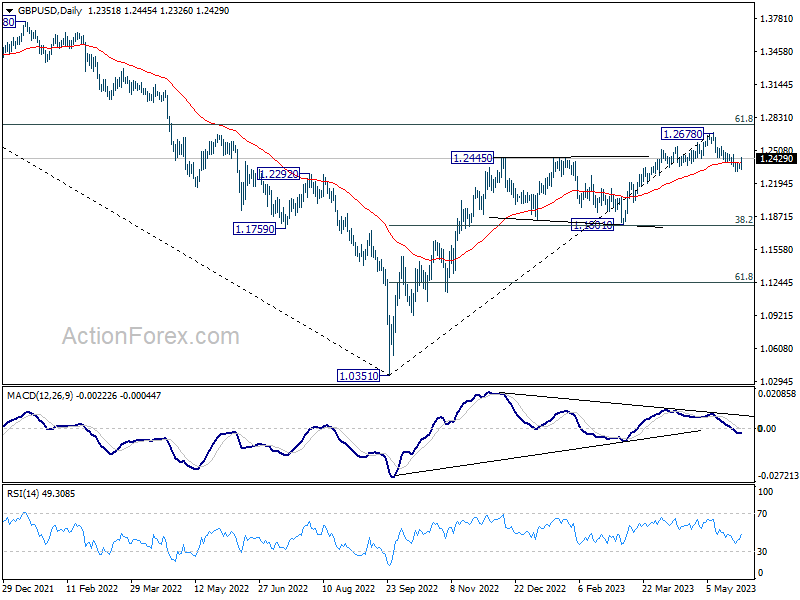
GBP/USD's recovery from 1.2306 extends higher today but stays below 1.2468 minor resistance. Intraday bias remains neutral first and further decline is in favor. Break of 1.2306 will resume the fall from 1.2678, as correcting whole up trend from 1.0351, to 1.1801 cluster support (38.2% retracement of 1.0351 to 1.2678 at 1.1789). On the upside, however, firm break of 1.2468 will turn bias back to the upside for stronger rebound.
In the bigger picture, as long as 1.1801 support holds, rise from 1.0351 medium term bottom (2022 low) is expected to extend further. Sustained break of 61.8% retracement of 1.4248 (2021 high) to 1.0351 at 1.2759 will add to the case of long term bullish trend reversal. However, firm break of 1.1801 will indicate rejection by 1.2759, and bring deeper decline, even as a correction.
Sterling Jumps Broadly While Dollar Retreats as Month-End Trading Sets in
Dollar appears to be taking a breather, experiencing a broad decline in month-end trading as it reverses some of its recent gains. The initial support from the debt ceiling deal seems to be waning, while market participants are adopting a cautious stance ahead of this week's crucial non-farm payroll data. The figures are expected to influence bets on whether Fed will hike rates again in June.
Commodity currencies are feeling the heat, underperforming due to uninspiring risk sentiment. Meanwhile, British Pound has been rallying in the European session, helping to lift both Euro and Swiss Franc. Japanese Yen is also furthering its recovery, buoyed by pullback in benchmark yields.
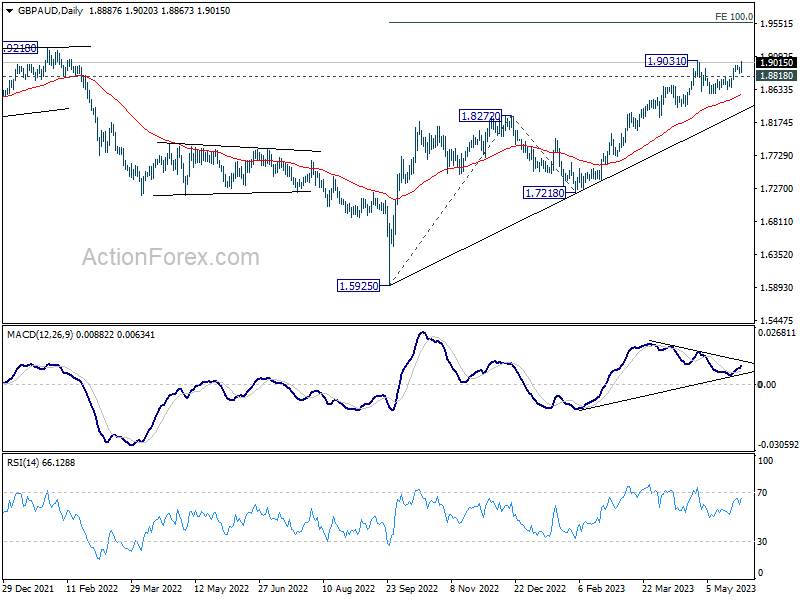
Technically, GBP/AUD is tentatively seen as ready for upside break out. Firm break of 1.9031 will resume whole up trend from 1.5925. Next target will be 100% projection of 1.5925 to 1.8272 from 1.7218 at 1.9565. However, break of 1.8818 minor support will delay the bullish case, and bring another fall to extend the consolidation pattern from 1.9031 first.
 In Europe, at the time of writing, FTSE is down -0.61%. DAX is up 0.44%. CAC is down -0.53%. Germany 10-year yield is down -0.0584 at 2.385. Earlier in Asia, Nikkei rose another 0.30%. China Shanghai SSE rose 0.09%. Hong Kong HSI rose 0.24%. Singapore Strait Times dropped -0.24%. Japan 10-year JGB yield rose 0.0004 to 0.436.
Eurozone economic sentiment dropped to 96.5, EU down to 95.1
Eurozone Economic Sentiment Indicator fell from 99.0 to 96.5 in May. Employment Expectation Indicator dropped from 107.5 to 104.7. Economic Uncertainty Indicator dropped from 22.2 to 21.8.
Eurozone Industry confidence dropped from -2.8 to -5.2. Services confidence dropped from 9.9 to 7.0. Consumer confidence dropped from -17.5 to -17.4. Retail trade confidence dropped from -0.9 to -5.3. Construction confidence dropped from 0.9 to 0.2.
EU ESI dropped from 97.1 to 95.1. EEI dropped from 106.2 to 104.0. EUI dropped from 21.8 to 21.3. Amongst the largest EU economies, the ESI deteriorated in Spain (-3.0), Germany (-2.9), Italy (-2.3) and the Netherlands (-1.5), whereas it improved in Poland (+1.9) and France (+1.5).
Swiss economic outlook worsens as KOF economic barometer plunges
May has brought a significant dip in Swiss KOF Economic Barometer, which fell sharply from 96.1 to 90.2, a figure notably below the anticipated 95.3. This reading, barely above the cyclic trough of 89.3 recorded last November, indicates a continued deteriorating outlook for the Swiss economy for mid-2023.
In a statement, KOF noted, "This is the second time in a row that the barometer has fallen sharply. The outlook for the Swiss economy for the middle of 2023 is thus deteriorating further and remains at a below-average level."
The sharp decline of the barometer, an important indicator of Switzerland's economic health, is largely attributed to the manufacturing sector and financial and insurance services. Other economic sectors and foreign demand also contributed negative signals.
In contrast, "indicators covering private consumption are slightly positive," providing a slight glimmer of optimism amid a broadly dimming economic forecast.
BoJ Ueda: Will patiently continue monetary easing
In today's parliamentary address, BoJ Kazuo Ueda laid out the central bank's approach to an evolving inflation scenario in Japan. Governor Ueda announced, "We expect inflation to quite clearly slow below 2%" as we move further into the current fiscal year.
Despite this imminent deceleration, BoJ is forecasting a subsequent rebound, albeit with a degree of caution. Ueda added, "Inflation is likely to rebound thereafter ... though there is high uncertainty" about the future direction of inflation rates.
In response to these trends, BoJ plans to remain patient and maintain its current approach to monetary policy. Ueda affirmed the central bank's commitment to its strategy, stating, "(We) will patiently continue monetary easing as there's still distance to achievement of sustainable and stable 2% price hikes together with continued rises in wages."
GBP/USD Mid-Day Outlook
Daily Pivots: (S1) 1.2336; (P) 1.2354; (R1) 1.2373; More...
GBP/USD's recovery from 1.2306 extends higher today but stays below 1.2468 minor resistance. Intraday bias remains neutral first and further decline is in favor. Break of 1.2306 will resume the fall from 1.2678, as correcting whole up trend from 1.0351, to 1.1801 cluster support (38.2% retracement of 1.0351 to 1.2678 at 1.1789). On the upside, however, firm break of 1.2468 will turn bias back to the upside for stronger rebound.
In the bigger picture, as long as 1.1801 support holds, rise from 1.0351 medium term bottom (2022 low) is expected to extend further. Sustained break of 61.8% retracement of 1.4248 (2021 high) to 1.0351 at 1.2759 will add to the case of long term bullish trend reversal. However, firm break of 1.1801 will indicate rejection by 1.2759, and bring deeper decline, even as a correction.
Economic Indicators Update
| GMT | Ccy | Events | Actual | Forecast | Previous | Revised |
|---|---|---|---|---|---|---|
| 22:45 | NZD | Building Permits M/M Apr | -2.60% | 7.00% | 6.60% | |
| 23:30 | JPY | Unemployment Rate Apr | 2.60% | 2.70% | 2.80% | |
| 01:30 | AUD | Building Permits M/M Apr | -8.10% | 2.30% | -0.10% | -1.00% |
| 07:00 | CHF | KOF Leading Indicator May | 90.2 | 95.3 | 96.4 | 96.1 |
| 07:00 | CHF | GDP Q/Q Q1 | 0.30% | 0.10% | 0.00% | |
| 08:00 | EUR | Eurozone M3 Money Supply Y/Y Apr | 1.90% | 2.10% | 2.50% | |
| 09:00 | EUR | Eurozone Economic Sentiment May | 96.5 | 99 | 99.3 | 99 |
| 09:00 | EUR | Eurozone Industrial Confidence May | -5.2 | -4 | -2.6 | -2.8 |
| 09:00 | EUR | Eurozone Services Sentiment May | 7 | 10 | 10.5 | 9.9 |
| 09:00 | EUR | Eurozone Consumer Confidence May F | -17.4 | -17.4 | -17.4 | |
| 12:30 | CAD | Current Account (CAD) Q1 | -6.2B | -9.9B | -10.6B | -8.1B |
| 13:00 | USD | S&P/CS Composite-20 HPI Y/Y Mar | -1.15% | -1.70% | 0.40% | |
| 13:00 | USD | Housing Price Index M/M Mar | 0.60% | 0.30% | 0.50% | 0.70% |
| 14:00 | USD | Consumer Confidence May | 99.1 | 101.3 |
BTCUSD Gets Rejected by 50-day SMA
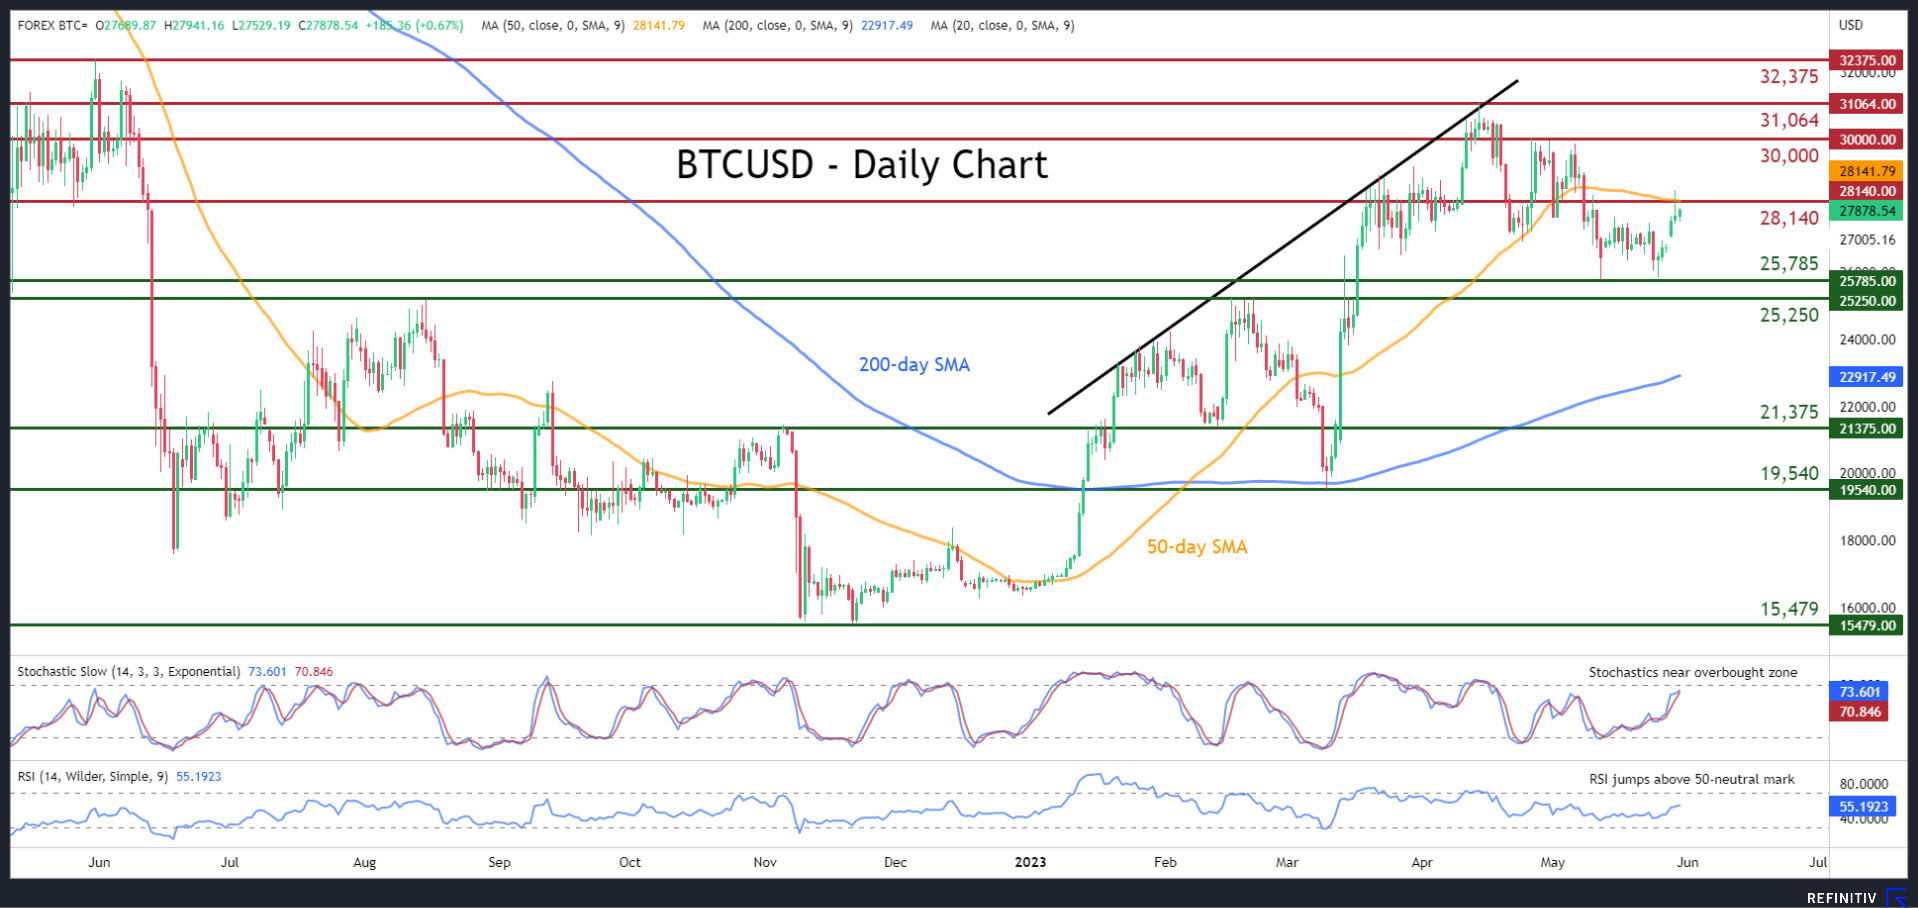
BTCUSD (Bitcoin) had been generating a structure of lower highs and lower lows after peaking at the 10-month high of 31,064 in mid-April. Nevertheless, after two weeks of consolidation, the king of cryptos spiked to the upside, with the price temporarily jumping above its 50-day simple moving average (SMA) before paring some gains.
The momentum indicators are reflecting a cautiously positive tone. Specifically, the stochastic oscillator is ascending near the 80-overbought zone, while the RSI crossed above its 50-neutral mark.
If the bulls manage to push the price higher, immediate resistance could be met near the 50-day SMA, currently at 28,140. Surpassing that zone, Bitcoin could ascend towards the crucial 30,000 psychological level. A break above that region may open the door for the 10-month peak of 31,064.
Alternatively, bearish actions could send the price to test the recent double-bottom region of 25,785. Piercing through that wall, the bears might aim for the 25,250 resistance, which could serve as support in the future. Even lower, the 21,375 hurdle could provide downside protection.
Overall, BTCUSD attempted to escape its short-term rangebound pattern to the upside, but the 50-day capped its advance. Thus, a clear break above the latter is needed to revive bulls’ hopes for a trend reversal.
UK 100 Cash Index Back Inside Key Range
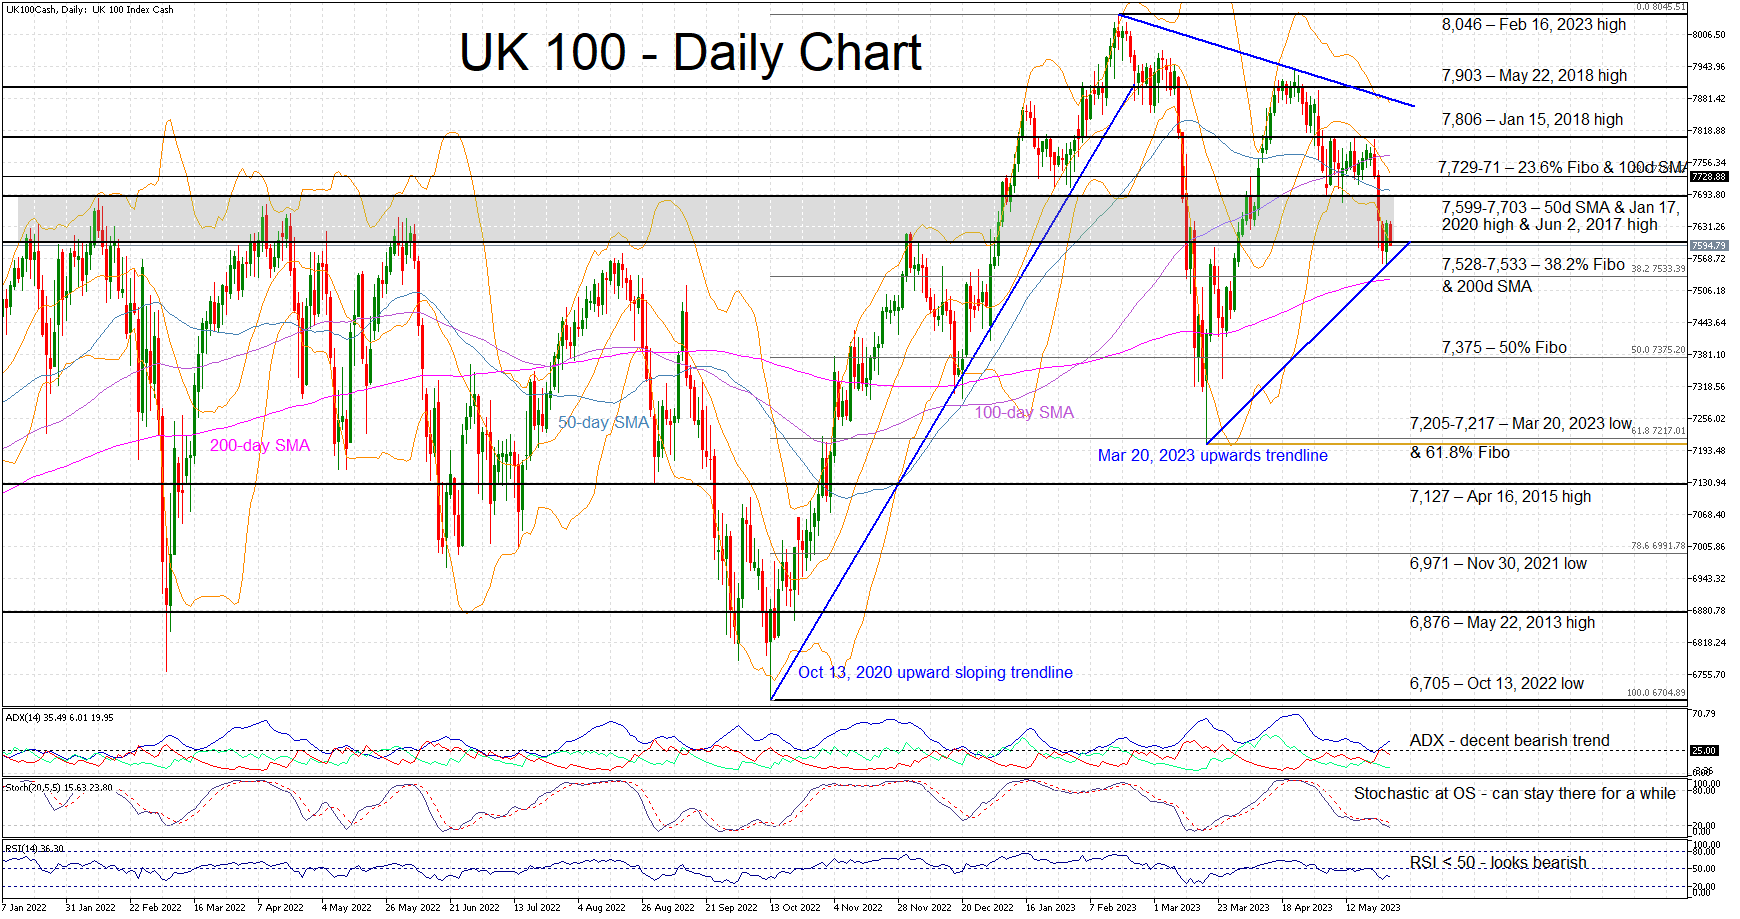
The UK 100 cash index has been trading sideways over the past few trading sessions, as it has returned inside the 7,599-7,689 range that acted as strong resistance during the January-December 2022 period. This area was eventually broken forcefully in January 2023, but it has now come into play again. In addition, a series of lower highs and higher lows is supporting the current index move.
The momentum indicators appear to be mixed at this stage. The Average Directional Movement Index (ADX) is edging higher and signaling a decent bearish trend, and the RSI is hovering below its 50-threshold point. On the other hand, the stochastic oscillator has dropped to its oversold area. However, it can stay there for a while, allowing the bears to keep pushing the index even lower.
Should the bears manage to overcome the lower boundary of the aforementioned range, they would quickly come up against the support set by the 200-day simple moving average (SMA) and the 38.2% Fibonacci retracement level of the October 13, 2022 – February 16, 2023 uptrend at 7,528-7,533 range. The path then looks clear until the 7,375 level.
On the other hand, the bulls are keen on pushing the index above the 7,703 level. The 7,729-7,771 area, populated by the 23.6% Fibonacci retracement and the 100-day SMA respectively, awaits them, a tad below the Jan 15, 2018 high of 7,806.
To sum up, the UK 100 cash index appears to be stuck in a key range. A break lower could quickly lead the index towards the 7,375 area. On the other hand, the path higher looks much tougher.
Dollar Overbought and Vulnerable to a Pullback
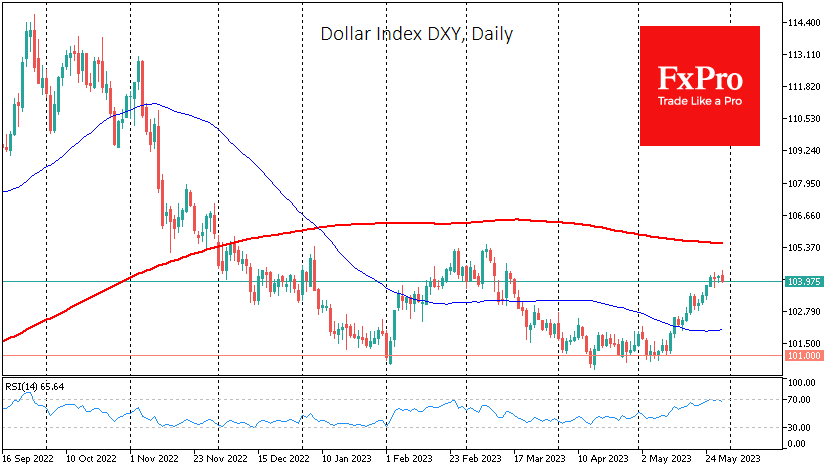
The dollar continues to rally, having gained around 3.4% from its early May lows, and has hovered around 104.2 for the past four trading sessions. The dollar is in locally overbought territory against a basket of major currencies, the euro and the yen.
The main reason for this is the increase in expectations that the Fed will raise interest rates again in mid-June. As of Tuesday morning, the odds of this outcome are above 64%, compared to almost zero at the start of the last rally in early May. A rate hike is expected to attract capital into the dollar from which it fled during the regional banking crisis.
The last time we saw a similar rise in rate expectations was in early February. Interestingly, the dollar index then fell into the same area around 101 but turned sharply on a strong jobs report, which was later supported by inflation.
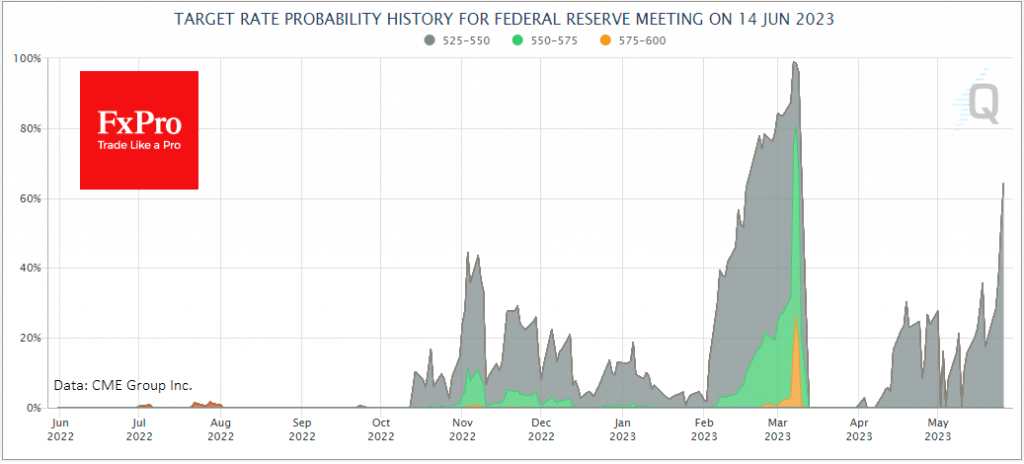
The reversal was due to the regional banking crisis, which sent investors looking for alternatives, including gold and bitcoin. The regional banking problems disappeared from the agenda and no longer weighed on the markets. But we have only stopped seeing the symptoms, while the disease is unlikely to be cured as the Fed has raised interest rates.
The Fed is probably aware of this and is sounding increasingly cautious about future rate hikes.
At the same time, the USD index has entered the over-bought territory on the daily RSI. Technically, the signal for the beginning of the correction will be a decline at the end of the day with a return to normal territory. If this happens from the current level of 104.20, it would be a lower local high than the March peak above 105. In turn, such a reversal would be a reason to look for the Dollar Index to rewrite local lows in the coming weeks, approaching or falling below 100.
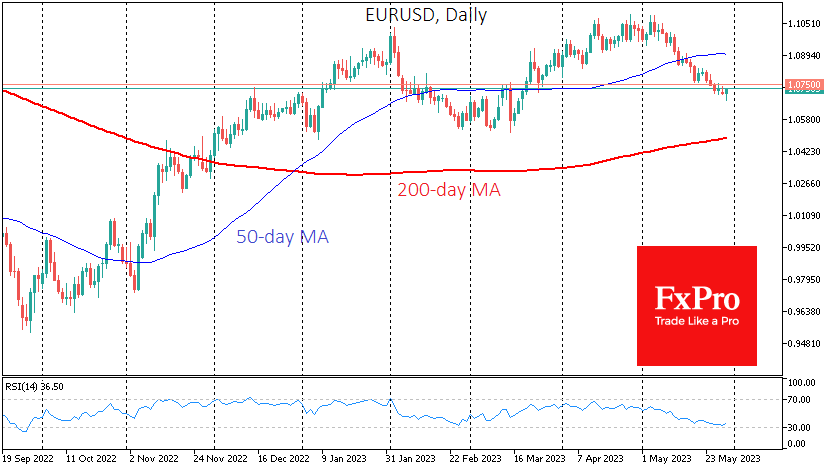
The EURUSD is now trading around the same level as it was at the start of the year and a year ago, trying to break below 1.07 and struggling with an oversold RSI on the daily time frames. The USDJPY traded above 140 on Monday and early Tuesday, reaching highs not seen since last November. Overbought dollars have also accumulated, which has become a concern for Treasury and central bank officials.
EUR/GBP — Bears Attack Year’s Lows
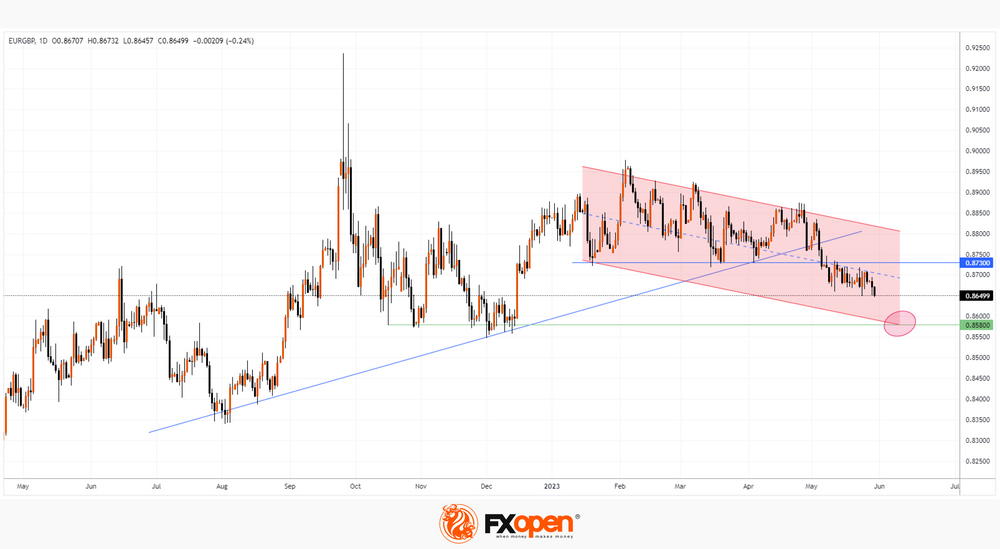
On Tuesday morning, the EUR/GBP broke through the low of the year, set last week around 0.8648.
Bearish sentiment in the market is influenced by:
→ discrepancy in bond yields. For example, the yield on 10-year bonds in Germany is 2.43% per annum. And in the UK, 4.37%;
→ worrisome market sentiment ahead of the German inflation news (during the day tomorrow), as well as ahead of ECB President Christine Lagarde's speech (scheduled for Thursday at 12:30 GMT+3).
The technical analysis of the EUR/GBP chart shows evidence of supply dominating demand in May:
→ the uptrend line (shown in blue) is broken from top to bottom;
→ horizontal level 0.873, which served as support since the beginning of the year, was broken in May and also tested;
→ now the dynamics of the EUR/GBP rate is increasingly clearly forming a downward channel (shown in red).
In a bearish scenario, the rate may continue to decline within the descending channel, and even reach the area around 0.858, where the important support line (shown in green) and the lower line of the red descending channel intersect.
USD/JPY Punches Above 140, Tokyo Issues Warning
- Japanese yen falls below 140
- Japan’s Ministry of Finance issues warning
- US debt ceiling heads to Congress
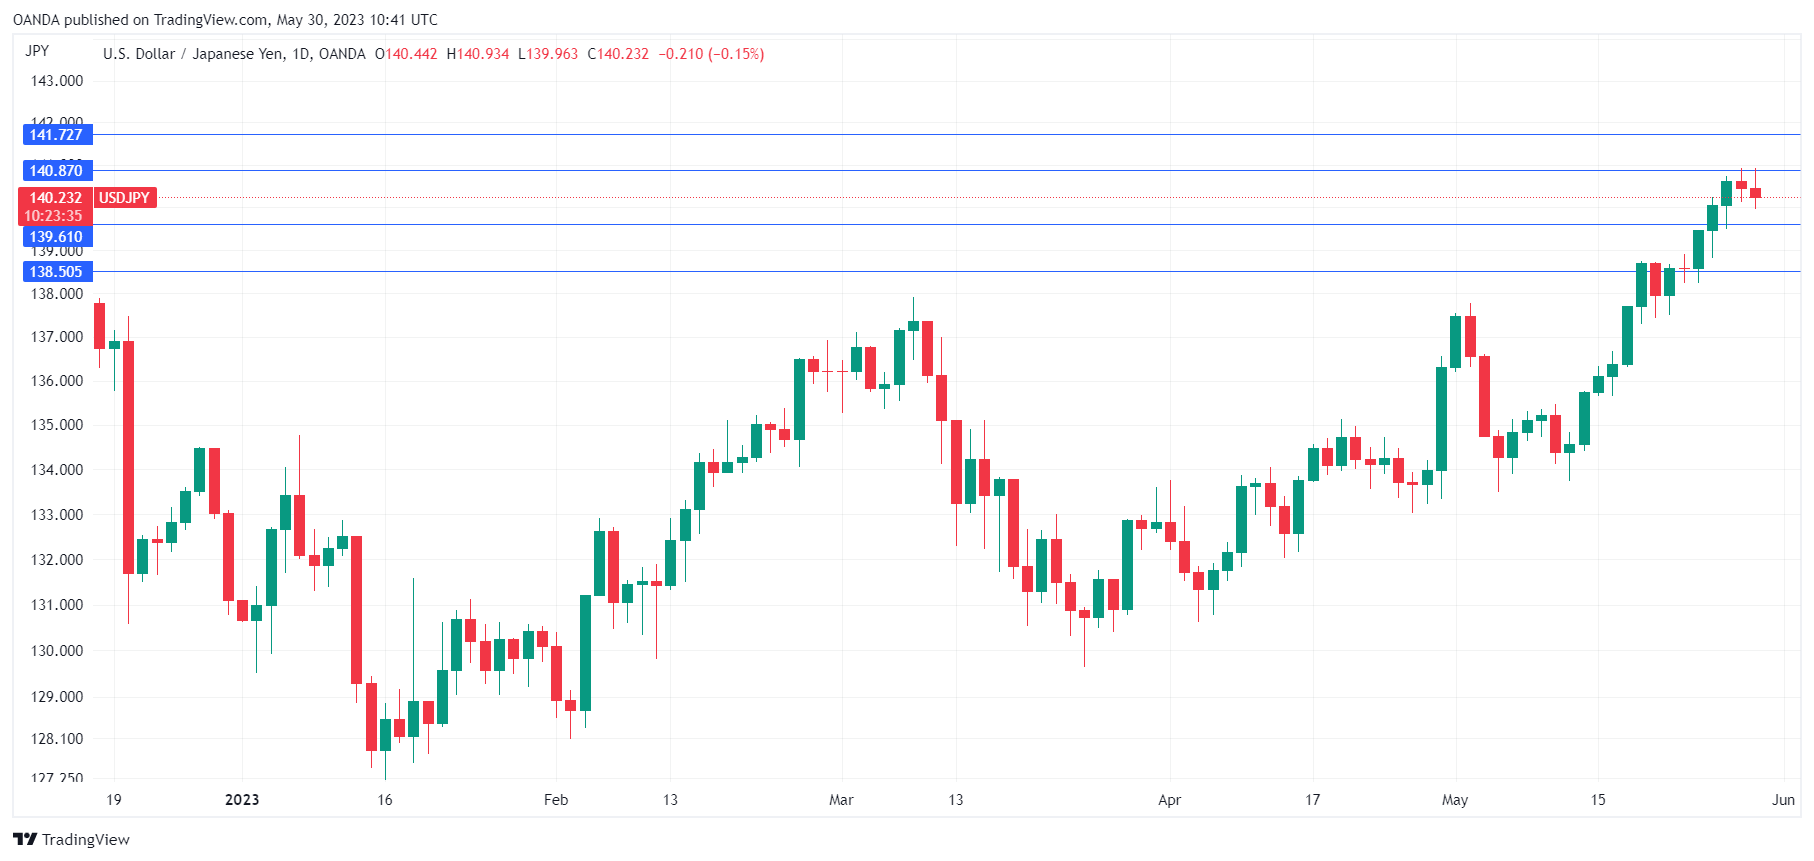
USD/JPY is showing little movement on Tuesday. In the European session, USD/JPY is trading at 140.17, down 0.19%.
The Japanese yen continues to underperform and has plunged 2.8% in May. The yen fell as low as 140.93 on Monday, its lowest level since November 21st. The sharp depreciation is raising concerns in Tokyo and Masota Kanda, a top official at the Ministry of Finance (MOF) weighed in on Tuesday. Kanda said officials were not focussing on particular exchange rate levels but said they were monitoring the forex market and “would respond appropriately”. Kanda’s veiled warning should not be ignored, as he blindsided the markets back in December when the MoF intervened in the currency markets in order to prop up the yen.
Japanese releases have been solid, reinforcing speculation that inflation isn’t going anywhere and the Bank of Japan may have to tighten policy. Service and manufacturing PMIs showed slight expansion last week and retail sales and industrial production will be released on Wednesday. Retail sales are expected to remain strong at 7.0% y/y in April, following a prior reading of 7.1%. Industrial production is projected to improve to 1.5% m/m in April, up from 1.1% in March.
President Biden and Republican Speaker McCarthy have reached an agreement in principle on the debt ceiling, after weeks of brinkmanship between Republicans and Democrats. The deal must be approved in both houses of Congress, which is expected to happen despite grumblings from some Republicans. The weeks of uncertainty prior to the deal weighed on risk appetite and the big winners have been US Treasury yields and the US dollar.
USD/JPY Technical
- USD/JPY has support at 139.61 and 138.50
- There is resistance at 140.88 and 141.73