

Sample Category Title
USD/CHF Daily Outlook
Daily Pivots: (S1) 0.9021; (P) 0.9052; (R1) 0.9091; More...
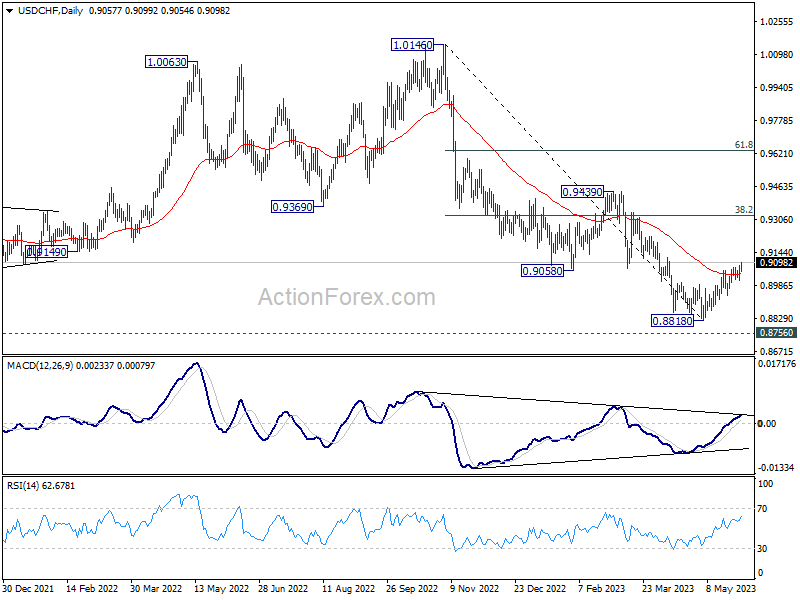
USD/CHF's rally from 0.8818 resumed by breaking through 0.9083. Intraday bias is back on the upside. Current rise is seen as correcting whole down trend from 1.0146. Further rise should then be seen to 38.2% retracement of 1.0146 to 0.8818 at 0.9325. On the downside, below 0.9013 minor support will turn intraday bias neutral first.
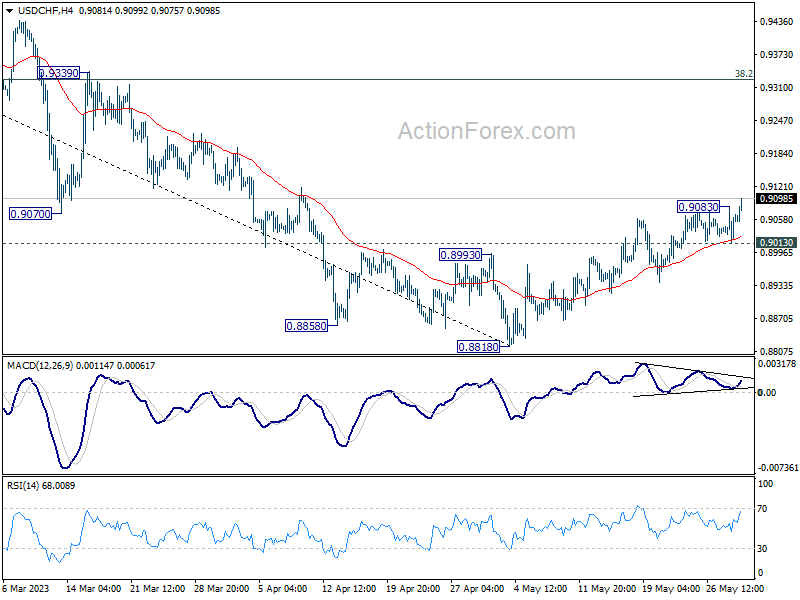
In the bigger picture, fall from 1.1046 (2022 high) is seen as a leg in the long term range pattern from 1.0342 (2016 high). So, downside should be contained by 0.8756 to bring reversal. Sustained break of 0.9058 support turned resistance will be the first sign of medium term bottoming. However, decisive break of 0.8756 will carry larger bearish implications.
USD/JPY Daily Outlook
Daily Pivots: (S1) 139.26; (P) 140.10; (R1) 140.62; More...
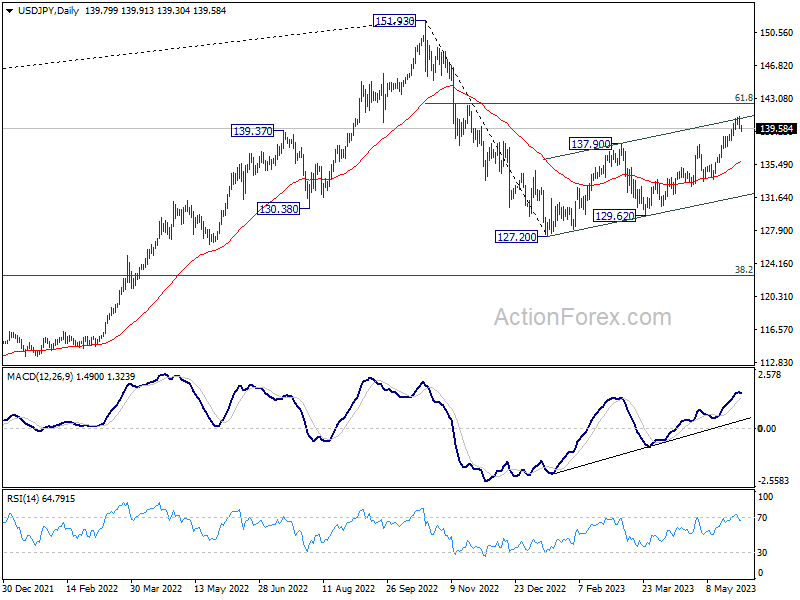
USD/JPY is staying in consolidation below 140.90 and intraday bias remains neutral. Downside of retreat should be contained above 138.22 support to bring another rally. Break of 140.90 will resume larger rise from 127.20 to 142.48 fibonacci level. However, considering bearish divergence condition in 4 hour MACD, break of 138.22 will confirm short term topping, and turn bias back to the downside for 55 D EMA (now at 135.89).
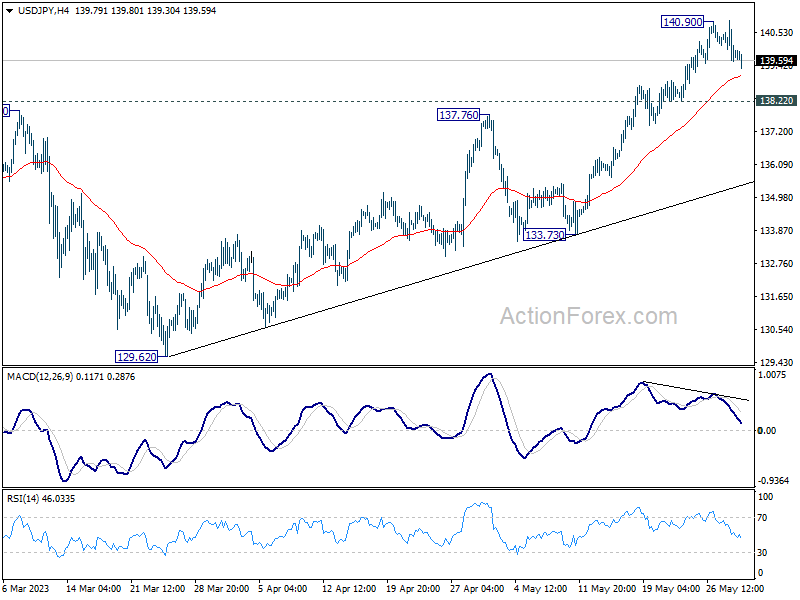
In the bigger picture, rise from 127.20 is seen as the second leg of the corrective pattern from 151.93 high. Stronger rally would be seen to 61.8% retracement of 151.93 to 127.20 at 136.34. Sustained break there will pave the way back to retest 151.93. On the downside, however, break of 133.73 support will argue that the pattern could have started the third leg through 127.20 low.
USD/CAD Daily Outlook
Daily Pivots: (S1) 1.3574; (P) 1.3594; (R1) 1.3619; More....
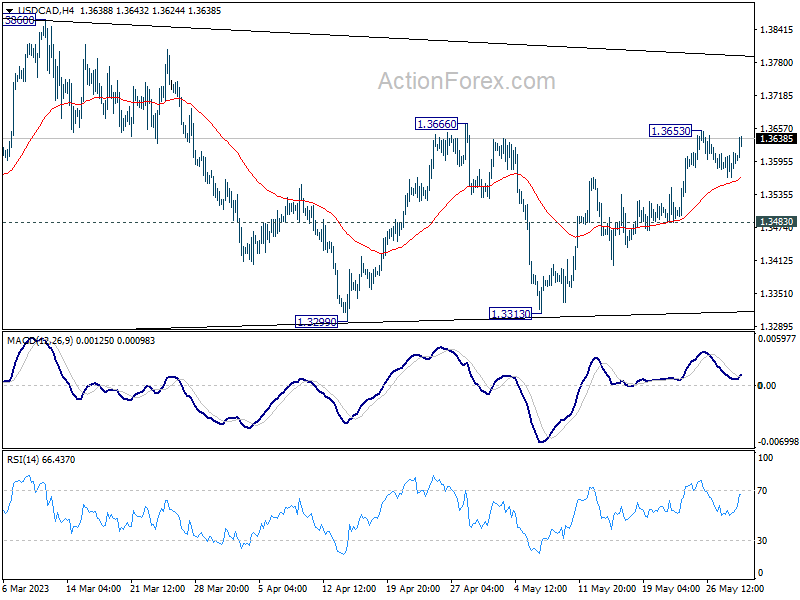
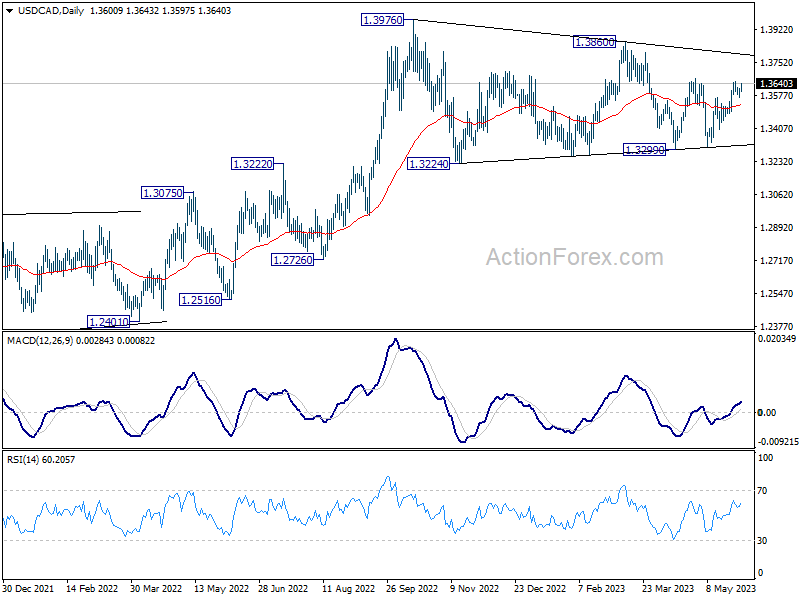
Intraday bias in USD/CAD remains neutral for the moment and outlook is unchanged. Price actions from 1.3976 are seen as a triangle consolidation pattern. Above 1.3666 will target 1.3860 resistance first. Firm break of 1.3860 will argue that larger up trend is ready to resume through 1.3976 high.
In the bigger picture, rise from 1.2005 (2021 low) is expected to resume through 1.3976 after consolidation from there completes. On decisive break of 1.3976, next target will be 1.4667/89 long term resistance zone. This will remain the favored case as long as 38.2% retracement of 1.2005 to 1.3976 at 1.3233 holds.
GBP/USD Technical Analysis
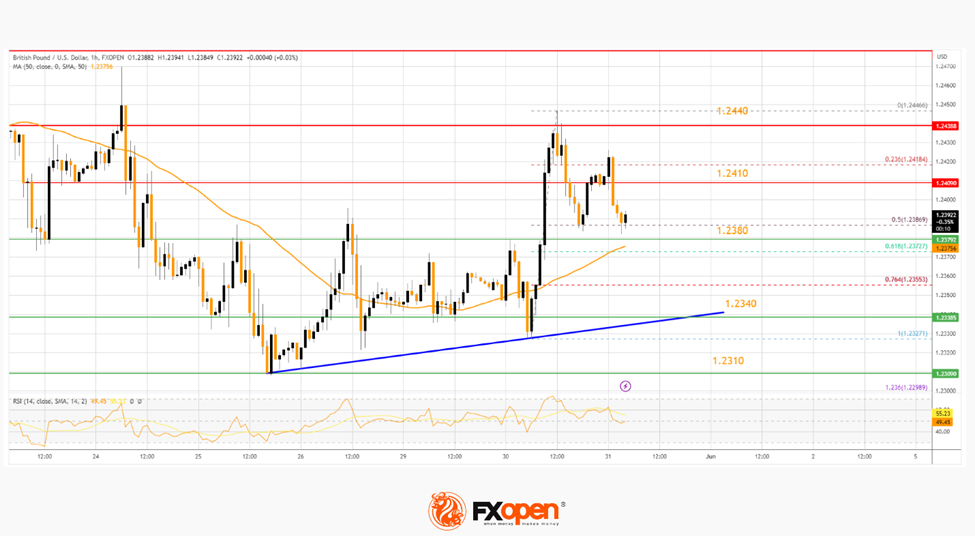
On the hourly chart of GBP/USD at FXOpen, the pair seems to be struggling near the 1.2440 resistance zone. The British Pound is moving lower below the 1.2410 level against the US Dollar.
It tested the 1.2380 support and stayed above the 50-hour simple moving average. To start a fresh increase, the pair must clear and settle above the 1.2410 resistance zone.
The first major resistance is near the 1.2440 level. If there is a clear upside break above the 1.2440 resistance, the pair could rise toward the 1.2480 level in the near term. The next major resistance sits near the 1.2500 level.
On the downside, the first major support is near the 1.2380 level. The main support is forming near the 1.2340 level. A break below the 1.2340 support could send the pair toward 1.2310 or even 1.2250.
EUR/USD Remains At Risk While USD/JPY Trims Gains
EUR/USD started a fresh decline below the 1.0765 support. USD/JPY rallied significantly above 140.00 and recently started a downside correction.
Important Takeaways for EUR/USD and USD/JPY Analysis Today
- The Euro is declining and showing bearish signs below the 1.0745 resistance zone.
- There is a key bearish trend line forming with resistance near 1.0715 on the hourly chart of EUR/USD at FXOpen.
- USD/JPY started a major rally above the 138.88 and 140.00 levels.
- There is a major bullish trend line forming with support near 139.65 on the hourly chart at FXOpen.
EUR/USD Technical Analysis
On the hourly chart of EUR/USD at FXOpen, the pair started a fresh decline from the 1.0790 resistance. The Euro declined below the 1.0745 support zone against the US Dollar.
It settled below the 50-hour simple moving average and spiked below 1.0690. A low was formed near 1.0672 before there was a minor recovery. The pair climbed above 1.0715 but the bears were active near the 1.0745 resistance.
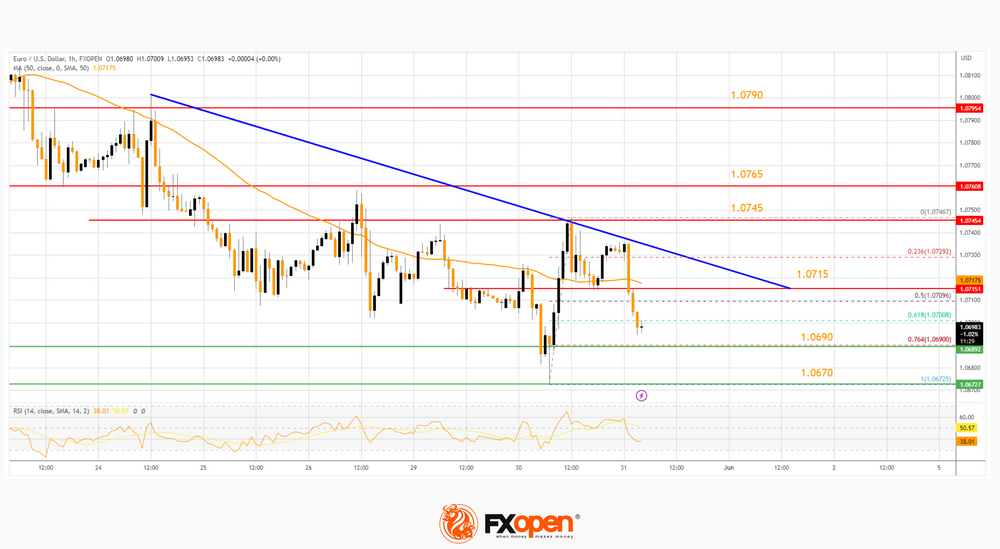
A high is formed near 1.0746 and the pair is again moving lower. There was a move below the 50% Fib retracement level of the upward move from the 1.0672 low to the 1.0746 high.
The RSI is dipping and EUR/USD is approaching the 76.4% Fib retracement level of the upward move from the 1.0672 low to the 1.0746 high at 1.0690. The first major support is near the 1.0670 level, below which the pair could start a major decline. In the stated case, the pair might dive toward the 1.0620 support zone.
On the EUR/USD chart, the pair is now facing resistance near a key bearish trend line at 1.0715. The next major resistance is near the 1.0745 level. An upside break above 1.0745 could set the pace for another increase. In the stated case, the pair might visit 1.0790.
USD/JPY Technical Analysis
On the hourly chart of USD/JPY at FXOpen, the pair started a fresh increase from the 138.88 zone. It gained bullish momentum and was able to clear the 140.00 resistance.
Finally, there was a move above 140.50 and the pair spiked toward 141.00. A high was formed near 140.90 before the pair corrected lower. There was a drop below the 50-hour simple moving average at 140.20.
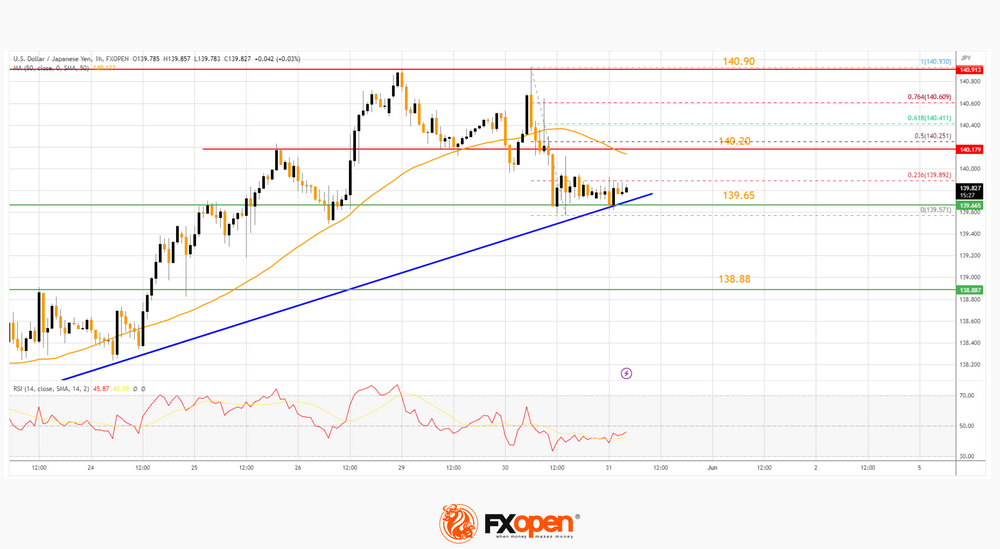
However, the bulls are active near a major bullish trend line at 139.65. A low is formed near 139.57 and the pair is now consolidating.
On the upside, the pair is facing resistance near the 23.6% Fib retracement level of the recent decline from the 140.93 swing high to the 139.57 low. The first major resistance is near the 50-hour simple moving average at 140.20. It is close to the 50% Fib retracement level of the recent decline from the 140.93 swing high to the 139.57 low.
If there is a close above the 140.20 level and RSI moves above 50, the pair could revisit 140.90. The next major resistance is near 141.20, above which the pair could test 142.00.
Conversely, the pair might break the trend line support. The next major support is near the 138.88 level, below which the pair could start a major decline. In the stated case, the pair might dive toward the 138.00 support.
China’s Deflationary Spiral Bumps Up FX Risk Aversion
- China’s NBS Manufacturing and Non-Manufacturing PMIs for May have increased the risk of a deflationary spiral in China.
- A weaker Chinese yuan may be required to counter and smooth the adverse effects of the deflationary spiral at least in the short-term.
- Risk aversion has resurfaced in the FX market via weakness seen in the G-10 JPY crosses.
In stark contrast to the recent findings of China’s manufacturing sector survey done by China Beige Book, a US-based data provider that has indicated a rebound in manufacturing activities in May from April, the latest data released today on the official NBS Manufacturing PMI as well as the Non-Manufacturing PMI have showed another month of contraction and growth slowdown in May.
The second consecutive month of weak manufacturing and services activities in China
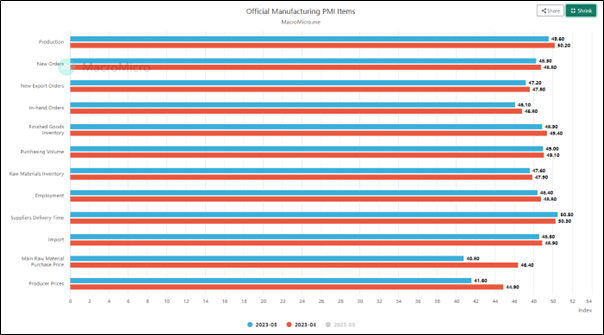
Fig 1: NBS Manufacturing PMI for May 2023 (Source: MacroMicro, click to enlarge chart)
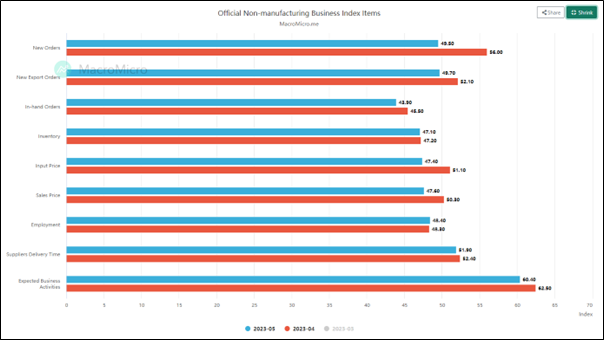
Fig 2: NBS Non-Manufacturing PMI for May 2023 (Source: MacroMicro, click to enlarge chart)
Headline manufacturing activities (PMI) contracted further to a five-month low at 48.8 in May from 49.2 in April; two consecutive months of contraction and came in below consensus estimates of 49.4. Key sub-components of NBS Manufacturing PMI such as new orders (48.3 vs 48.8), new export orders (47.2 vs. 47.6), and purchasing volume (49.0 vs. 49.1) have shrunk at a faster rate too. In addition, the production output sub-component contracted for the first time in four months to 49.6 in May from April’s 50.2.
Services activities (Non-Manufacturing PMI) also further cooled down to 54.5 in May from April’s 56.4, its second consecutive month of growth slowdown and its softest pace since January.
Weak demand conditions plus declining input and output prices increase deflationary risk
The latest reading from China’s PMI data for May has further reinforced an increasing slowdown in external demand (global growth) and lacklustre internal domestic demand ex-post re-opening from Covid-19 stringent lockdowns.
A closer inspection of the input and output prices sub-components for both the PMIs has indicated a risk of a deflationary spiral at play. The input cost (main raw material purchase price) sub-component of the Manufacturing PMI declined at the fastest pace in May since July 2022 (40.8 vs. 46.4) while the output cost (producer prices) sub-component fell for the third consecutive and recorded its steepest decline for ten months in May to 41.6 from 44.9.
Also, the input price sub-component of the Non-Manufacturing PMI contracted for the first time in five months to 47.4 in May from 51.1 coupled with a downside reversal in the sales price sub-component that slipped back to a contraction mode of 47.60 in May from a prior rise of 50.3 in April.
All in all, these weak input and output prices surveyed from the manufacturing and services sector in China are likely to cause a further dampening in the upcoming May reading for consumer inflation and factory gate prices (PPI) that are scheduled to release next Friday, 9 June. April’s reading of 0.1% year-on-year for consumer inflation and -3.6% year-on-year for PPI were the weakest inflationary data for China within the G-20 nations.
China policymakers may need a weaker yuan to stabilize internal growth
Given China’s central bank, PBoC current accommodative monetary policy stance is to adopt a targeted and “wait and see” approach rather than “opening the liquidity floodgates”, the foreign exchange rate may be used as a tool in the short term to alleviate the current downturn.
As highlighted above on the risk of the deflationary spiral in China, a weaker yuan at this juncture is unlikely to trigger a significant spike in imported inflation, and on the contrary, it may help to improve export numbers in the short term.
Hence, Chinese authorities and PBoC seems to be willing to accept a weaker yuan in the past two weeks and allow market forces to dictate its move. Yesterday’s onshore USD/CNY mid-point fixing rate was set at 7.0818, the weakest for the CNY seen in six months and today’s (31 May) fixing was set slightly higher at 7.0821.
This latest “implied weak onshore CNY guidance” from PBoC has further reinforced weakness in the offshore CNH. As seen from a technical analysis perspective, the bullish momentum of the medium-term uptrend phase of the USD/CNH in place since 16 January 2023 remains intact. The key medium-term resistance zone to watch will be at 7.1445/7.1730.
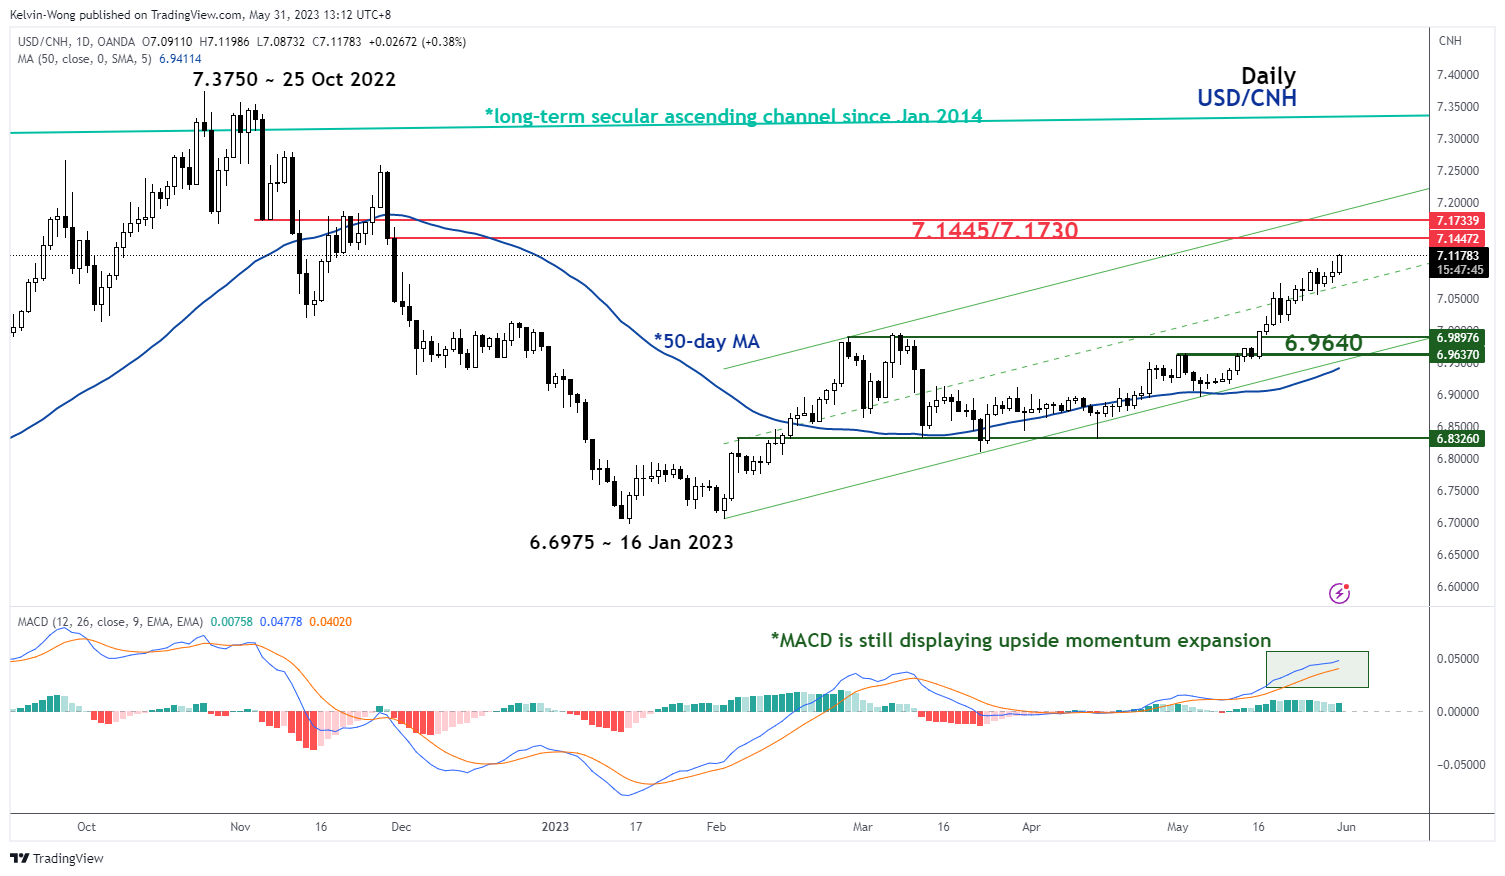
Fig 3: USD/CNH trend as of 31 May 2023 (Source: TradingView, click to enlarge chart)
Implications of a weaker yuan
The continuation of weaknesses and underperformance of China equities and its proxies. At this time of writing, the CSI 300, Hong Kong’s Hang Seng Index, Hang Seng Technology Index, and Hang Seng China Enterprises Index have shed between -1.2% to -3.00% intraday. China’s export-dependent Asia ex-Japan markets such as Singapore and Australia equities may also face renewed downside prices in the short to medium term.
Risk aversion has also crept into the FX market
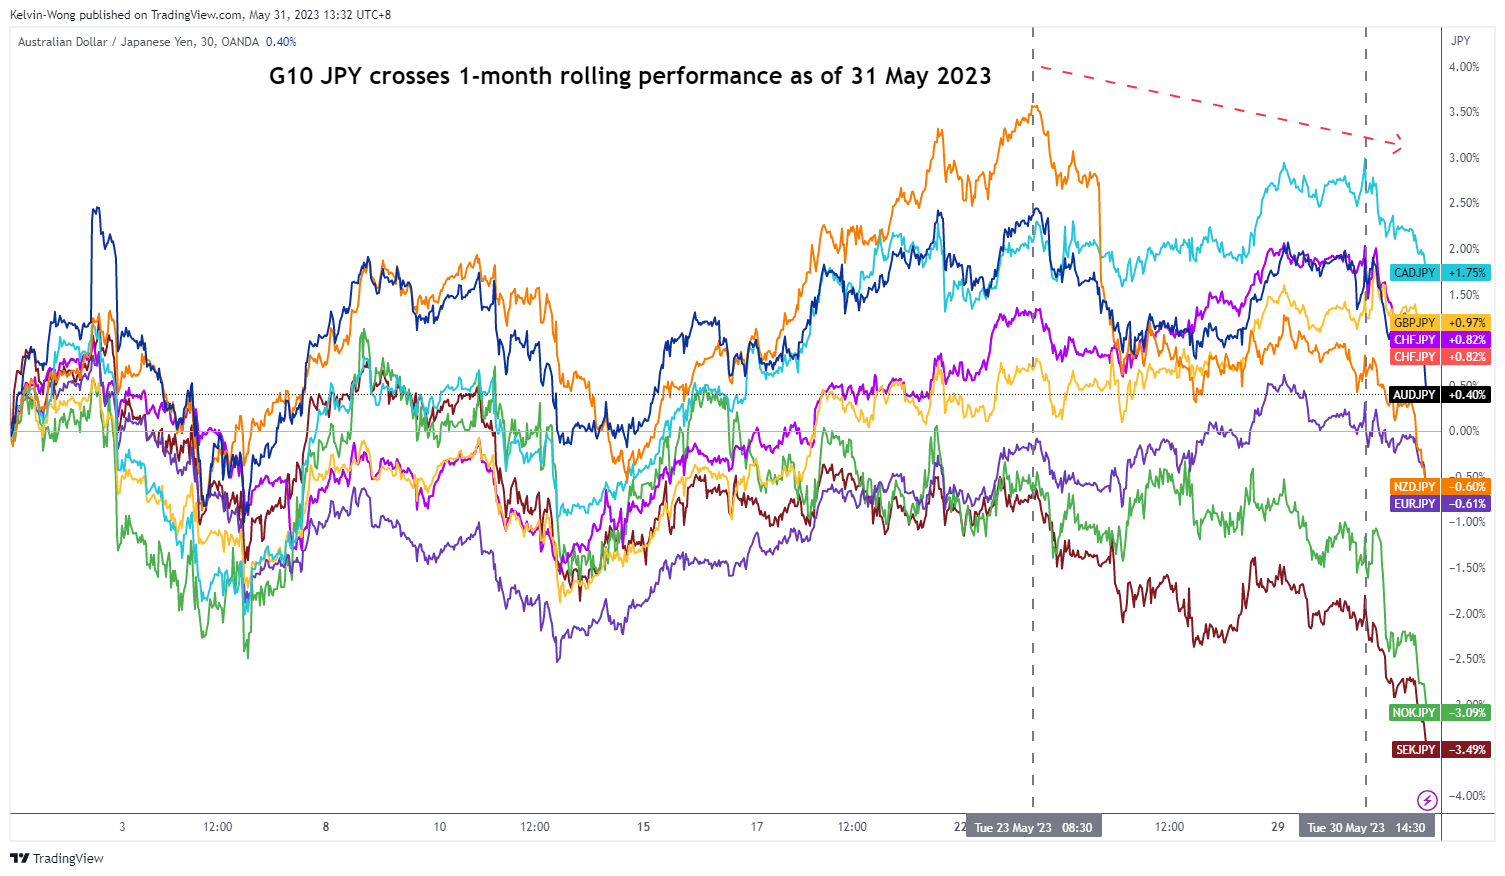
Fig 4: G-10 JPY crosses trend as of 31 May 2023 (Source: TradingView, click to enlarge chart)
Thus, if a weaker yuan continues to play out and the tentative US debt ceiling extension deal vote that is being scheduled later today in the House hits a roadblock, these JPY crosses may see further weakness at least in the short term.
Gold Remains Under Pressure
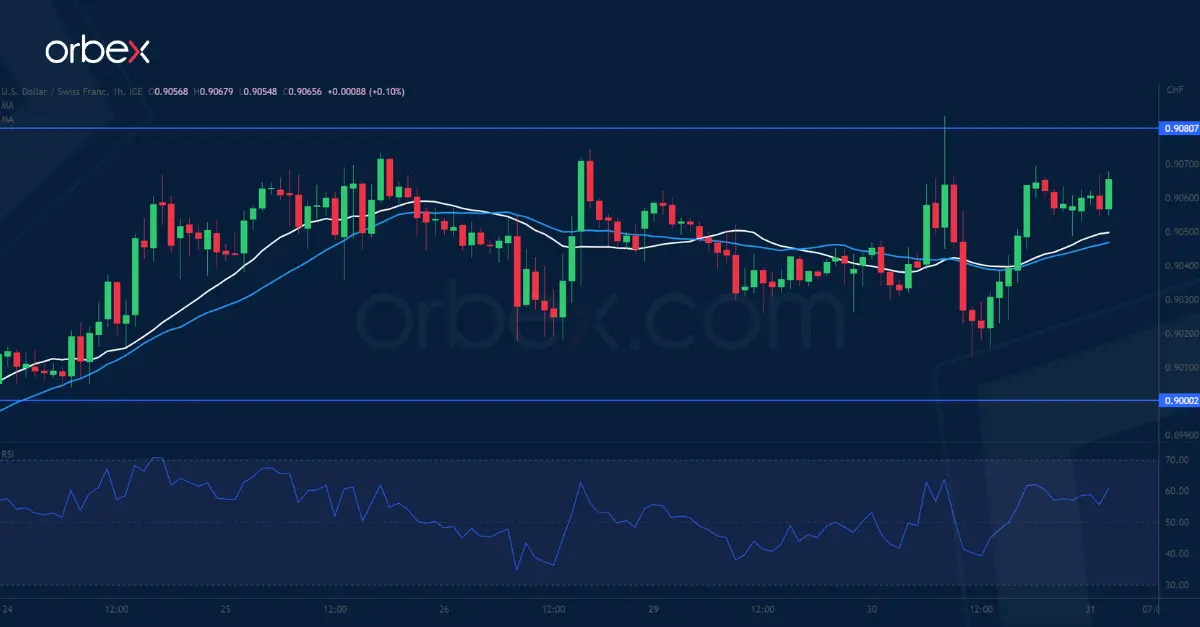
USD/CHF awaits breakout
The Swiss franc recouped some losses after a lift in the Q1 GDP. As the pair grinds its way up from 0.8830 near January 2021’s lows, a bullish MA cross on the daily chart is a sign of stabilisation. The latest series of higher lows suggests growing interest from the buy side but they will need to lift offers in the supply zone 0.9080-0.9120 before a meaningful recovery could take shape. The psychological level of 0.9000 is key in keeping the momentum intact and its breach would trigger a fallback to the swing low at 0.8940.
AUD/USD struggles to bounce back
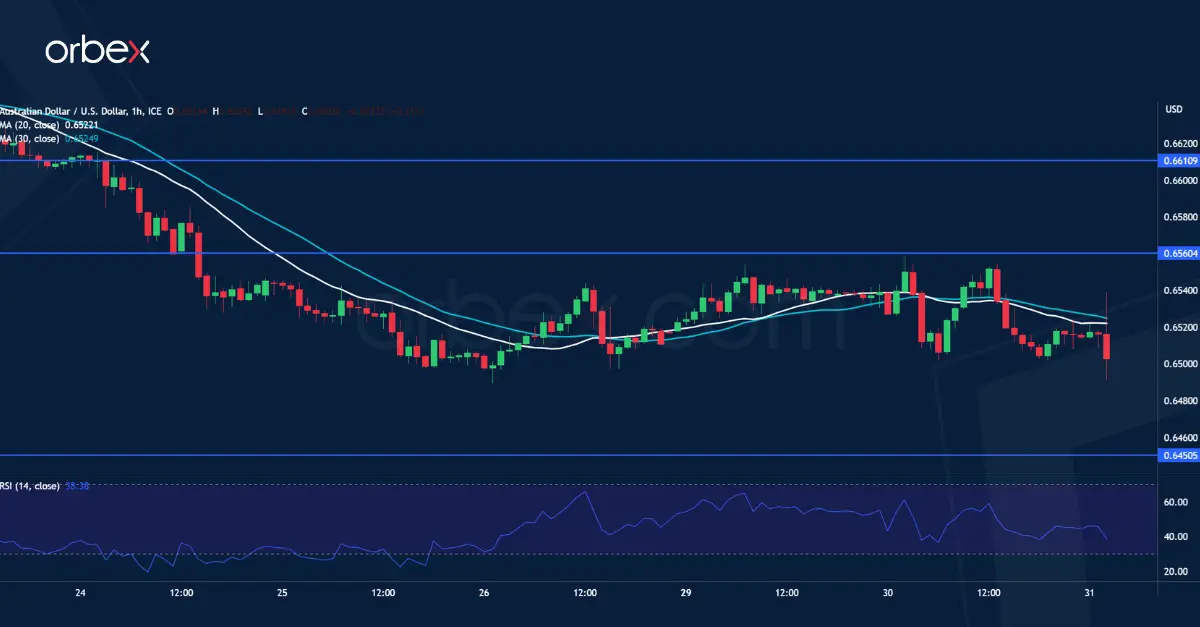
The Australian dollar tries to hold its ground after April’s CPI beat expectations. The pair is struggling to stay above 0.6450 which coincides with the start of a breakout rally last November. The RSI’s repeatedly oversold situation attracted some bargain hunters, but they have to break above the immediate resistance of 0.6560 before the rebound could gain traction and send the pair to the support-turned-resistance of 0.6610. On the downside, a bearish breakout would lead to another round of sell-off below 0.6400.
XAU/USD tests demand zone
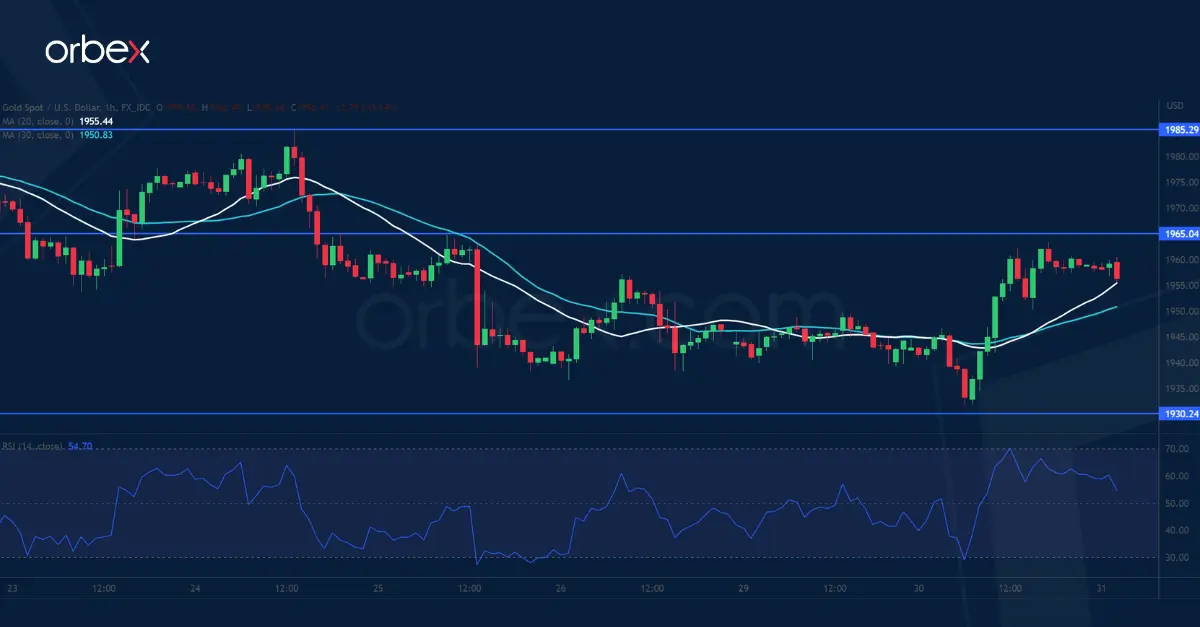
Gold edged higher on some short covering near a nine-week low. The metal is testing the demand zone 1930-1940 near the base of a breakout rally from mid-March. An initial bounce is a sign of profit-taking by short-term sellers in this area of significance, which would ease the downward pressure in the process. 1965 is the closest hurdle and 1985 at the top of a previously faded rebound is a major ceiling and its breach would force remaining selling interests out and open the door to a sustained rally.
Softer than Expected Chinese PMI’s Put Markets in Risk-off Modus
Markets
Correction time yesterday on the EMU and US yield markets after last week’s hawkish repositioning. The trend was already visible on Monday in thin European trading and deepened. A further easing of Spanish inflation (HICP -0.2% M/M and 2.9% Y/Y from 3.8%; core CPI declining from 6.6% to 6.1%) and Belgian headline inflation (5.2% Y/Y from 5.6% Y/Y) were a good enough reason for investors to pick up bonds after their recent setback. German yields ceded between 10.4 bps (5-y) and 6.9 bps (30-y). US data provided less of a reason for a rebound in Treasuries. US house prices rose more than expected and consumer confidence (conference board) held up better than feared (102.3 from an upwardly revised 103.7). Fed’s Barkin repeated that inflation stays too high. US yields early in US dealings tried to row against the downtrend in Europe, but finally succumbed. US yields lost between 12 bps (5-y) and 7 bps (30-y), mainly driven by a correction in real yields (10-y: -8 bps). The proposal to suspend the US debt ceiling was cleared by the House rules committee and sent for approval to the House. Equities showed no clear directional trend. US indices closed mixed (Dow -0.15%, Nasdaq +0.3%). The DXY dollar index intraday reversed an early up-tick to close modestly lower at 104.16 (from 104.3). However, this move was at least partially due to an intraday decline in USD/JPY as Japanese authorities (BOJ, MOF, FSA) held an unscheduled meeting to discuss recent yen weakness. USD/JPY declined from an intraday top just below 141 to close at 139.79. USD/JPY 140 apparently is a first line in the sand for Japanese authorities. EUR/USD briefly dropped below the 1.07 big figure but also rebounded intraday to close at 1.0734. Sterling outperformed even as UK yields intraday joined the setback in the US and Europe. EUR/GBP closed just below the 0.8650 key support.
Softer than expected Chinese PMI’s (cf infra) put markets in risk-off modus this morning with Japan and China losing about 1-1.5%. Hong Kong even cedes about 2.5%. Korea outperforms. US yields decline modestly even as Fed Mester advocates the case for further rate hikes in an interview with the FT. USD/JPY extends yesterday’s setback below 140 (139.55). EUR/USD remains in the defensive (1.069). Later today, the focus turns to national EMU CPI data (Germany, France, Italy). Lower energy prices and favourable base effects suggest a further decline in headline CPI. This might reinforce the bid for EMU bonds. It probably won’t help the euro. In the US, we keep and eye at the JOLTS jobs openings. A lower than expected figure might also confirm the bond-friendly short-term momentum. The 4.25% area for the US 2-y yield is a first high profile support. For the 10-y German yield the 2.2% area remains an important reference. The ECB will publish its financial stability review.
News and views
Official May Chinese PMIs underwhelmed this morning. The manufacturing PMI unexpectedly ventured deeper in contraction area, from 49.2 to 48.8 (49.5 expected) with every sub indicator but one (delivery time) printing lower compared to April. Non-manufacturing business confidence eased from 56.4 to 54.5, still above the neutral 50 but less than the 55.2 consensus estimate. New orders slumped 6.5 points to 49.5 and employment remains stuck <50 (48.4). Business activity expectations remain at a lofty 60.4, although that’s down from 62.5 last month. The data again highlight the difficulties China’s economy is experiencing to really gain traction after a burst of consumer activity in Q1. Calls for economic stimulus measures grow louder. China’s yuan slips this morning with USD/CNY rising to the highest level (7.10) since November 2022. Chinese and Hong Kong stocks underperform regional peers.
Australian inflation in April accelerated to a faster-than-expected 6.8%. That’s up from 6.3% in March. The end of a temporary government fuel subsidy boosted last month’s inflation. That said, the likes of housing are still contributing strongly (8.9% y/y). Monthly figures are not as comprehensive as the quarterly readings but do give an idea of how prices are evolving. Shortly before the release, Reserve Bank of Australia governor Lowe reiterated the central bank’s data-dependent mode on interest rates. Australian swap yields rose about 7 bps at the front end before paring gains to 2.9-3.9 bps currently after Chinese PMI data dampened optimism. Money markets nevertheless almost fully price in one additional hike by August/September. Longer tenors add less than 1 bp. The Australian dollar CPI-driven rebound was very short lived. AUD/USD is testing the YtD lows around 0.6489..
What if Russia Didn’t Follow OPEC’s Output Cuts?
The US 2-year yield fell sharply, while the S&P500 ended flat after hitting a fresh high since last summer on optimism that the US will finally agree to raise the debt ceiling.
The House will vote today to decide whether the debt limit bill gets approved at time to get a Senate approval by next Monday deadline.
The deal between Biden and McCarthy freezes discretionary spending for the next two years, which excludes weighty plans like Medicare or social care, and will only have a minor impact on around $20 trillion budget deficit projected for the next decade. Frozen spending means a spending cut in real terms as long as inflation remains high. The higher the inflation, the higher the spending cut in real terms.
But the problem is that at least 20 conservative Republicans of the House rejected Kevin McCarthy’s compromise on debt ceiling, saying that spending cuts are not enough. One hardcore Republican, Dan Bishop of North Carolina, threatened to vote to oust McCarthy because he ‘capitulated’ to Democrats. Democrats, on the other hand, are not fully happy either as they don’t want to freeze or to cut spending.
This is what a compromise is: accepting something without being fully satisfied to avoid a self-induced world economic crisis!
Anyway, any misstep at today’s House vote could send the US yields higher and stocks lower.
So far, there has been a widening gap between the way the stock and bond markets priced the threat of a US government default. While the US sovereign bonds cheapened across the board, and violently at the short end, stock investors were confident that a ceiling deal would be reached and weren’t discouraged by the rising US yields to stop buying.
And even the fact that the Federal Reserve’s (Fed) hawkish stance has a material impact on yields’ upside trajectory since the bank-stress dip, stock markets kept on climbing. Looking at how Nasdaq behaved since the bank stress rebound in yields, you could barely guess that there are rate-sensitive stocks in it.
But the reality check is that Nasdaq stocks are rate sensitive, and cannot be rate-hike proof if the Fed continues hiking the rates. It would, however, also be a good thing for the Fed members to consider pulling some liquidity out of the market as the Fed’s balance sheet is still worth more than before the bank crisis.
What if Russia refuses to cut output?
In energy, US crude tanked nearly 5% yesterday, and tipped a toe below the $69 pb mark on worries that Russia may not follow OPEC’s output cuts, in which case the internal conflict may prevent the cartel from reducing supply in a way to give a jolt to oil prices. There is little chance that we see the kind of discord like back in 2020, as the Ukrainian war strengthen the ties between two allies. But any Russian veto could materially reduce OPEC’s power of hit on oil prices.
Elsewhere, the Chinese manufacturing PMI showed that contraction in activity accelerated in May instead of stepping back to the expansion zone. The faster Chinese manufacturing contraction also weighs on the sentiment this morning.
We shouldn’t expect China to post growth numbers comparable to levels pre-2020 because China under Xi Jinping’s rule is willing to avoid euphoric, and unhealthy growth. This is why the government put in place severe crackdown measures on real estate, tech and education. That does not mean that China won’t get back in shape, but recovery will likely take longer, and growth will likely be more reasonable and a better reflection of the reality of the field.
Bond Yields Continue to Decline on the Back of Softer European Inflation Data
Market movers today
On the macro data front, markets will closely follow the French and German flash inflation figures for May following the downside surprise in the Spanish data yesterday.
From the US, the April JOLTs data will be released, where the job openings have been a good leading indicator for wage growth in the past. Consensus is looking for a gradual moderation, although from a still elevated level.
A range of central bank speakers will also be on the wires, including ECB's Visco and Lagarde as well as the Fed's Collins, Bowman, Jefferson and Harker.
Overnight, Caixin manufacturing PMI will be released from China.
The 60 second overview
Asian equity markets slides on the back of weaker than expected PMI data out of China. The Chinese manufacturing PMI fell to 48.8 versus the consensus expectation of 49.5. This is the lowest number since December 2022. The non-manufacturing PMI also fell more than expected.
Yesterday, global bond yields and interest rates continued to decline on the back of softer European inflation data from Spain (CPI), Austria (PPI) and Italy (PPI). Furthermore, the Euro area money supply M3 declined as well. On top of the lower inflation from the Euro area, there is also more certainty regarding a deal between the Democrats and Republicans regarding the debt ceiling. This is supportive for the Treasury market and T-bill market, where June T-bills is now back to the levels seen in early May.
Today, there will be more inflation data from the Euro area as we have flash inflation data from Germany and France as well as several other Euro area countries. Inflation is expected to decline, but how fast is the key to the market reaction. In France the expected m/m rise for May is expected to be 0.3% relative to 0.6% m/m in April. For Germany, the expected m/m rise for May is 0.2% relative to 0.4% in April.
The periphery continues to outperform core-EU countries and the 10Y BTPS-Bund spread is back to the 180bp-level. Furthermore, the periphery also outperforms EU bonds and 10Y Portugal (BBB-rated) is now close to be being flat to 10Y EU (Aaa-rated). The Bund ASW-spread remains fairly stable.
In the Scandies the big topic is the continued decline in both SEK and NOK versus the Euro. There seems to be little to stop the slide in both currencies. Today, we have FX transaction data from Norges Bank, and if they lift the FX sale to NOK 1.7-1.8bn per day this is likely to be negative for NOK relative to EUR as we also have lower oil prices combined with the recession/tighter global liquidity narrative.
Equities: Global equities marginally lower yesterday despite the AI euphoria rally continuing. May will end up being a very interesting month with excessively strong gains in tech stocks, while defensive will be lower for the month, unless something unlikely is happening today. Please note, the tech boom in May, and year today is purely driven by multiple expansive. In fact, tech have had the second worst earnings revisions of all sectors and the best performance year to date. Hence, the tech sector is now 40% more expensive base on 2023 earnings estimates than Jan-1st. What's even more interesting is the tech/growth rally in May has happened alongside increase in interest rates. Hence, the yield driven relationship between value and growth has broken down the past month.
In US yesterday Dow -0.2%, S&P 500 +0.0%, Nasdaq +0.3% and Russell 2000 -0.3%. Asian markets are lower across the board this morning with China once again leading the declines. NBS PMIs this morning weaker than expected with manufacturing sector in contraction territory and service down from the post Covid high last month. Both European and US futures are lower this morning.
FI: Yesterday, global bond yields and interest rates continued to decline on the back of softer inflation data from the Euro area. Furthermore, there is also more certainty about a deal between the democrats and republicans regarding the debt ceiling. This has been supportive for US Treasuries and US T-bills. In the T-bill market, the yield on a June T-bill has declined from 6.5% to 5.30% over the past week.
FX: EUR/USD continues to trade around 1.07. USD/JPY dropped toward and slightly below 140 after the MOF 'verbal intervention'. Scandies remain under hard pressure with EUR/NOK breaching 12.00 and EUR/SEK at 11.68 this morning.
Credit: Following the public holiday on Monday, supply resumed in the EUR credit market yesterday. In financials, senior deals were launched by SocGen, Sabadell, MUFG, KBC and Bank of Montreal, while SocGen also priced a Tier 2 note. Meanwhile, Credit Agricole became the first non-German name to print a 10Y covered following the SVB collapse and drew solid demand. In the corporate segment Bouygues and ASML were in the market. CDS indices were broadly flat with iTraxx Main at 80bp (unchanged since Friday's close) and Xover at 427bp (+2bp).