Sample Category Title
EUR/GBP Daily Outlook
Daily Pivots: (S1) 0.8626; (P) 0.8650; (R1) 0.8673; More...
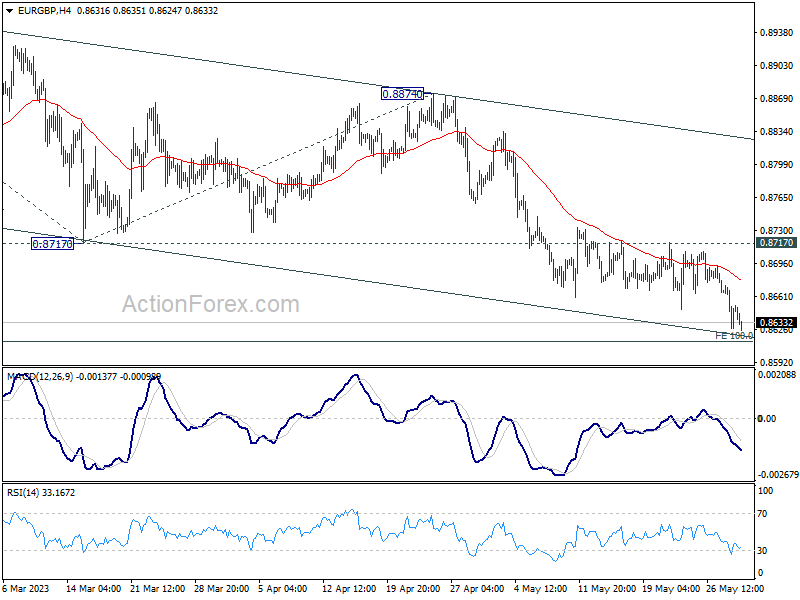
Intraday bias in EUR/GBP stays on the downside for 100% projection of 0.8977 to 0.8717 from 0.8874 at 0.8614. Decisive break there will extend the fall from 0.8977 through 0.8545 support to 161.8% projection at 0.8453. On the upside, however, break of 0.8717 will indicate short term bottoming, and turn bias back to the upside for stronger rebound.
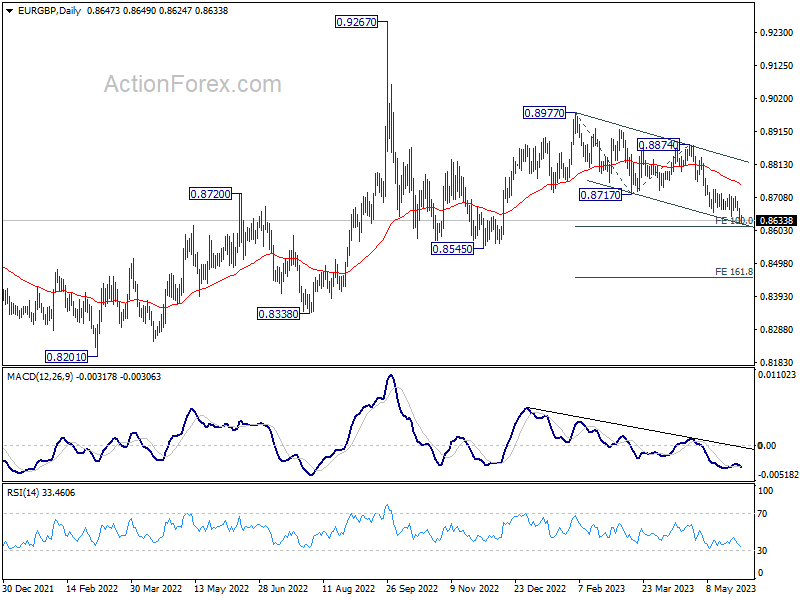
In the bigger picture, current development argues that whole decline from 0.9267 (2022 high) is still in progress. This is part of the long term range pattern from 0.9499 (2020 high). Deeper fall would be seen through 0.8545 support. This will now remain the favored case as long as 0.8874 resistance holds.
EUR/AUD Daily Outlook
Daily Pivots: (S1) 1.6388; (P) 1.6433; (R1) 1.6515; More...
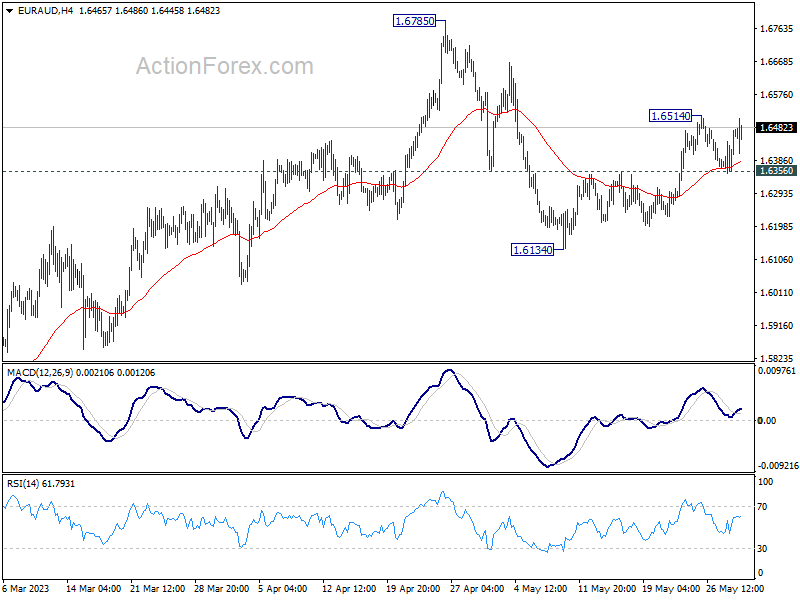
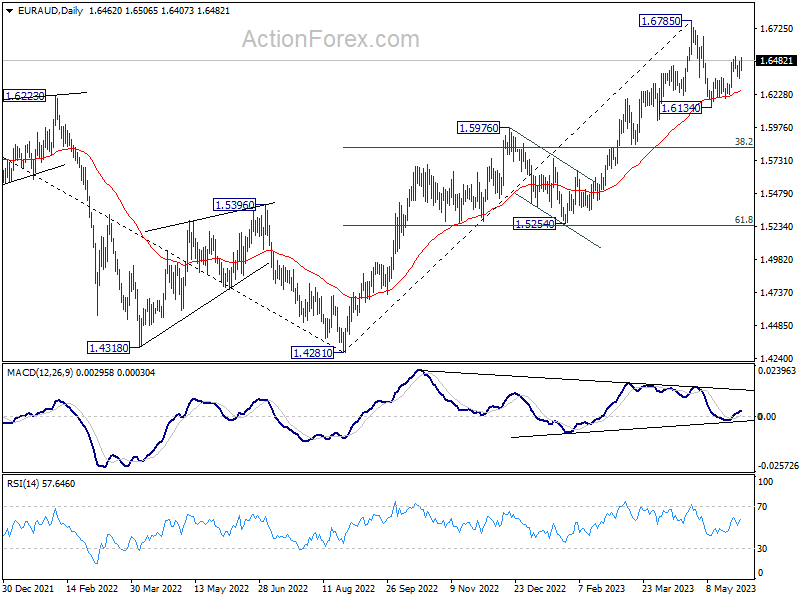
EUR/AUD recovered after hitting 1.6356 support. Intraday bias remains neutral and further rise is in favor. Break of 1.6514 will resume the rebound from 1.6134 to retest 1.6785 high. On the downside, however, firm break of 1.6356 minor support will turn bias back to the downside for 1.6134 support and below, to resume the fall from 1.6785.
In the bigger picture, whole down trend from 1.9799 (2020 high) should have completed at 1.4281 (2022 low). Further rise should be seen to 61.8% retracement of 1.9799 to 1.4281 at 1.7691 next. For now, outlook will stay bullish as long as 1.5976 resistance turned support holds, even in case of deep pull back.
EUR/CHF Daily Outlook
Daily Pivots: (S1) 0.9689; (P) 0.9707; (R1) 0.9742; More...
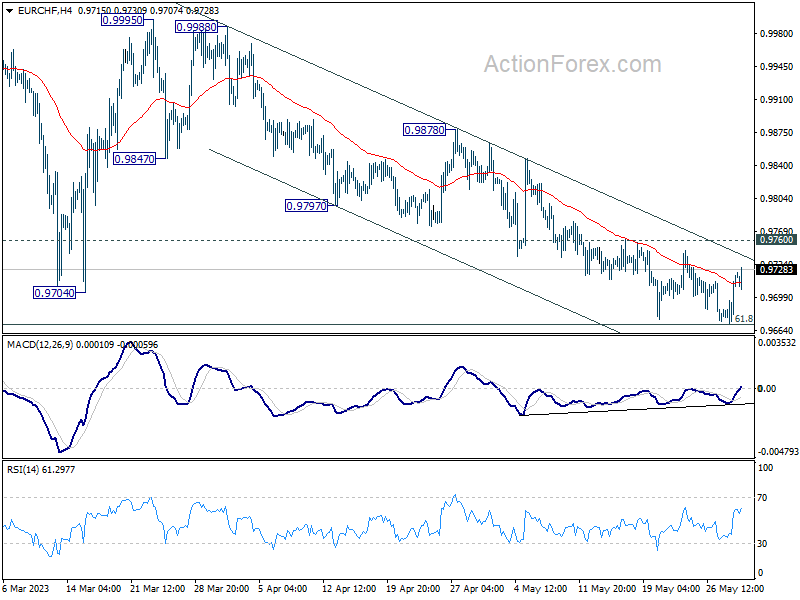
Intraday bias in EUR/CHF remains neutral first. Strong support is still expected around 61.8% retracement of 0.9407 to 1.0095 at 0.9670 to complete the whole corrective pattern from 1.0095. On the upside, firm break of 0.9760 resistance will confirm short term bottoming, and turn bias back to the upside for 0.9878 resistance next. However, sustained break of 0.9670 will pave the way back to 0.9407 low instead.
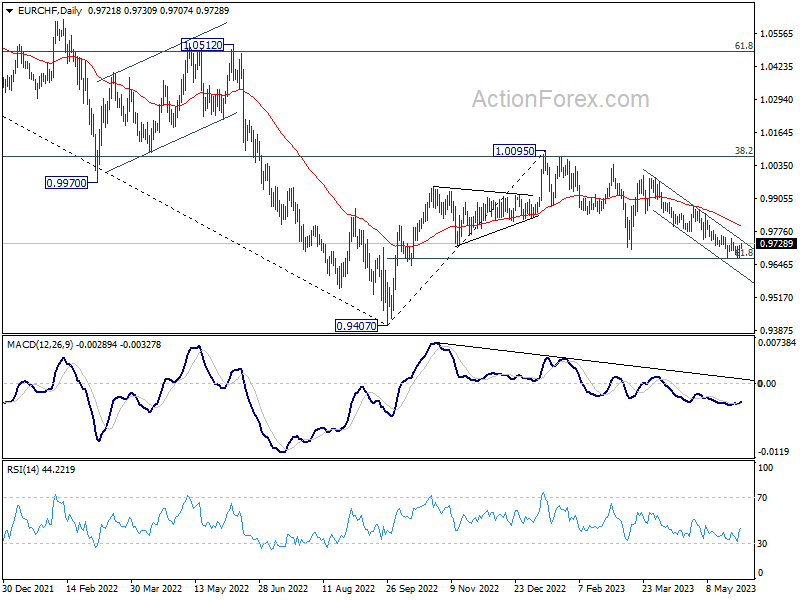
In the bigger picture, prior rejection by 38.2% retracement of 1.1149 to 0.9407 at 1.0072 suggests that medium term outlook is staying bearish. The pair is also capped below 55 W EMA (now at 0.9945). Down trend from 1.2004 (2018 high) is not completed yet and is in favor to resume through 0.9407 at a later stage. However, decisive break of 1.0095 resistance will raise the chance of bullish trend reversal. Rise from 0.9407 should then target 1.0505 cluster resistance (2020 low at 1.0505, 61.8% retracement of 1.1149 to 0.9407 at 1.1484).
USD Can Make a Pullback as US Yields Drop
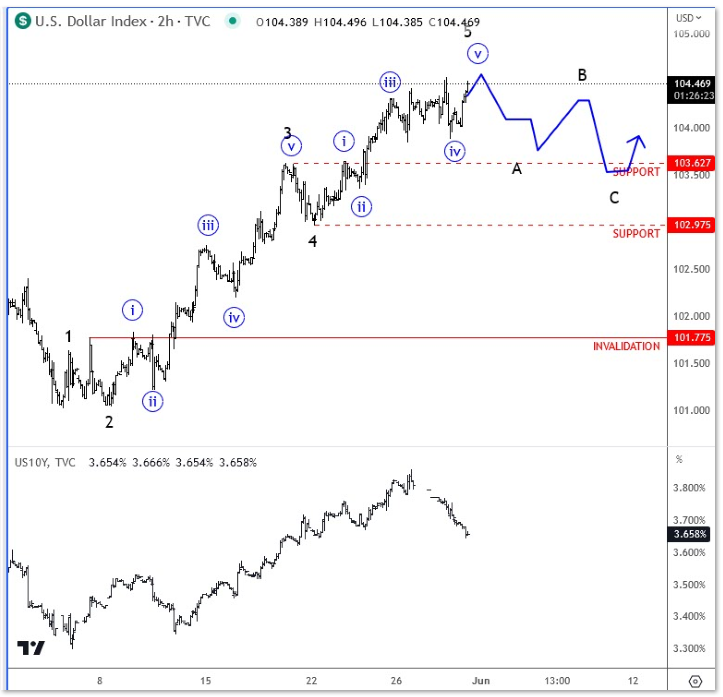
USD keeps moving higher, possibly on speculation that House vote on U.S. debt ceiling today will pass today. However, stocks are down, which can have something to do with China, where the PMI index declined once again, and also faster than expected. Technically speaking, USD is in uptrend, but yields found some resistance recently so I am wondering if USD is possibly also going tohav elimited gains. Looking at DXY hourly chart we see nice recovery, but now in late stages of an impulse from May 04 so we are aware of a pullback, possibly will show up as we will get an outcomen from the House vote, or USD can slow down later this week when we will get the US NFP data. But keep in mind that we will be tracking only a correction here on XXX/USD pairs and that more upside will be expected for the USD, once DXY makes three wave retracement.
JP225 Cash Index Correction Could Morph into a Bearish Trend
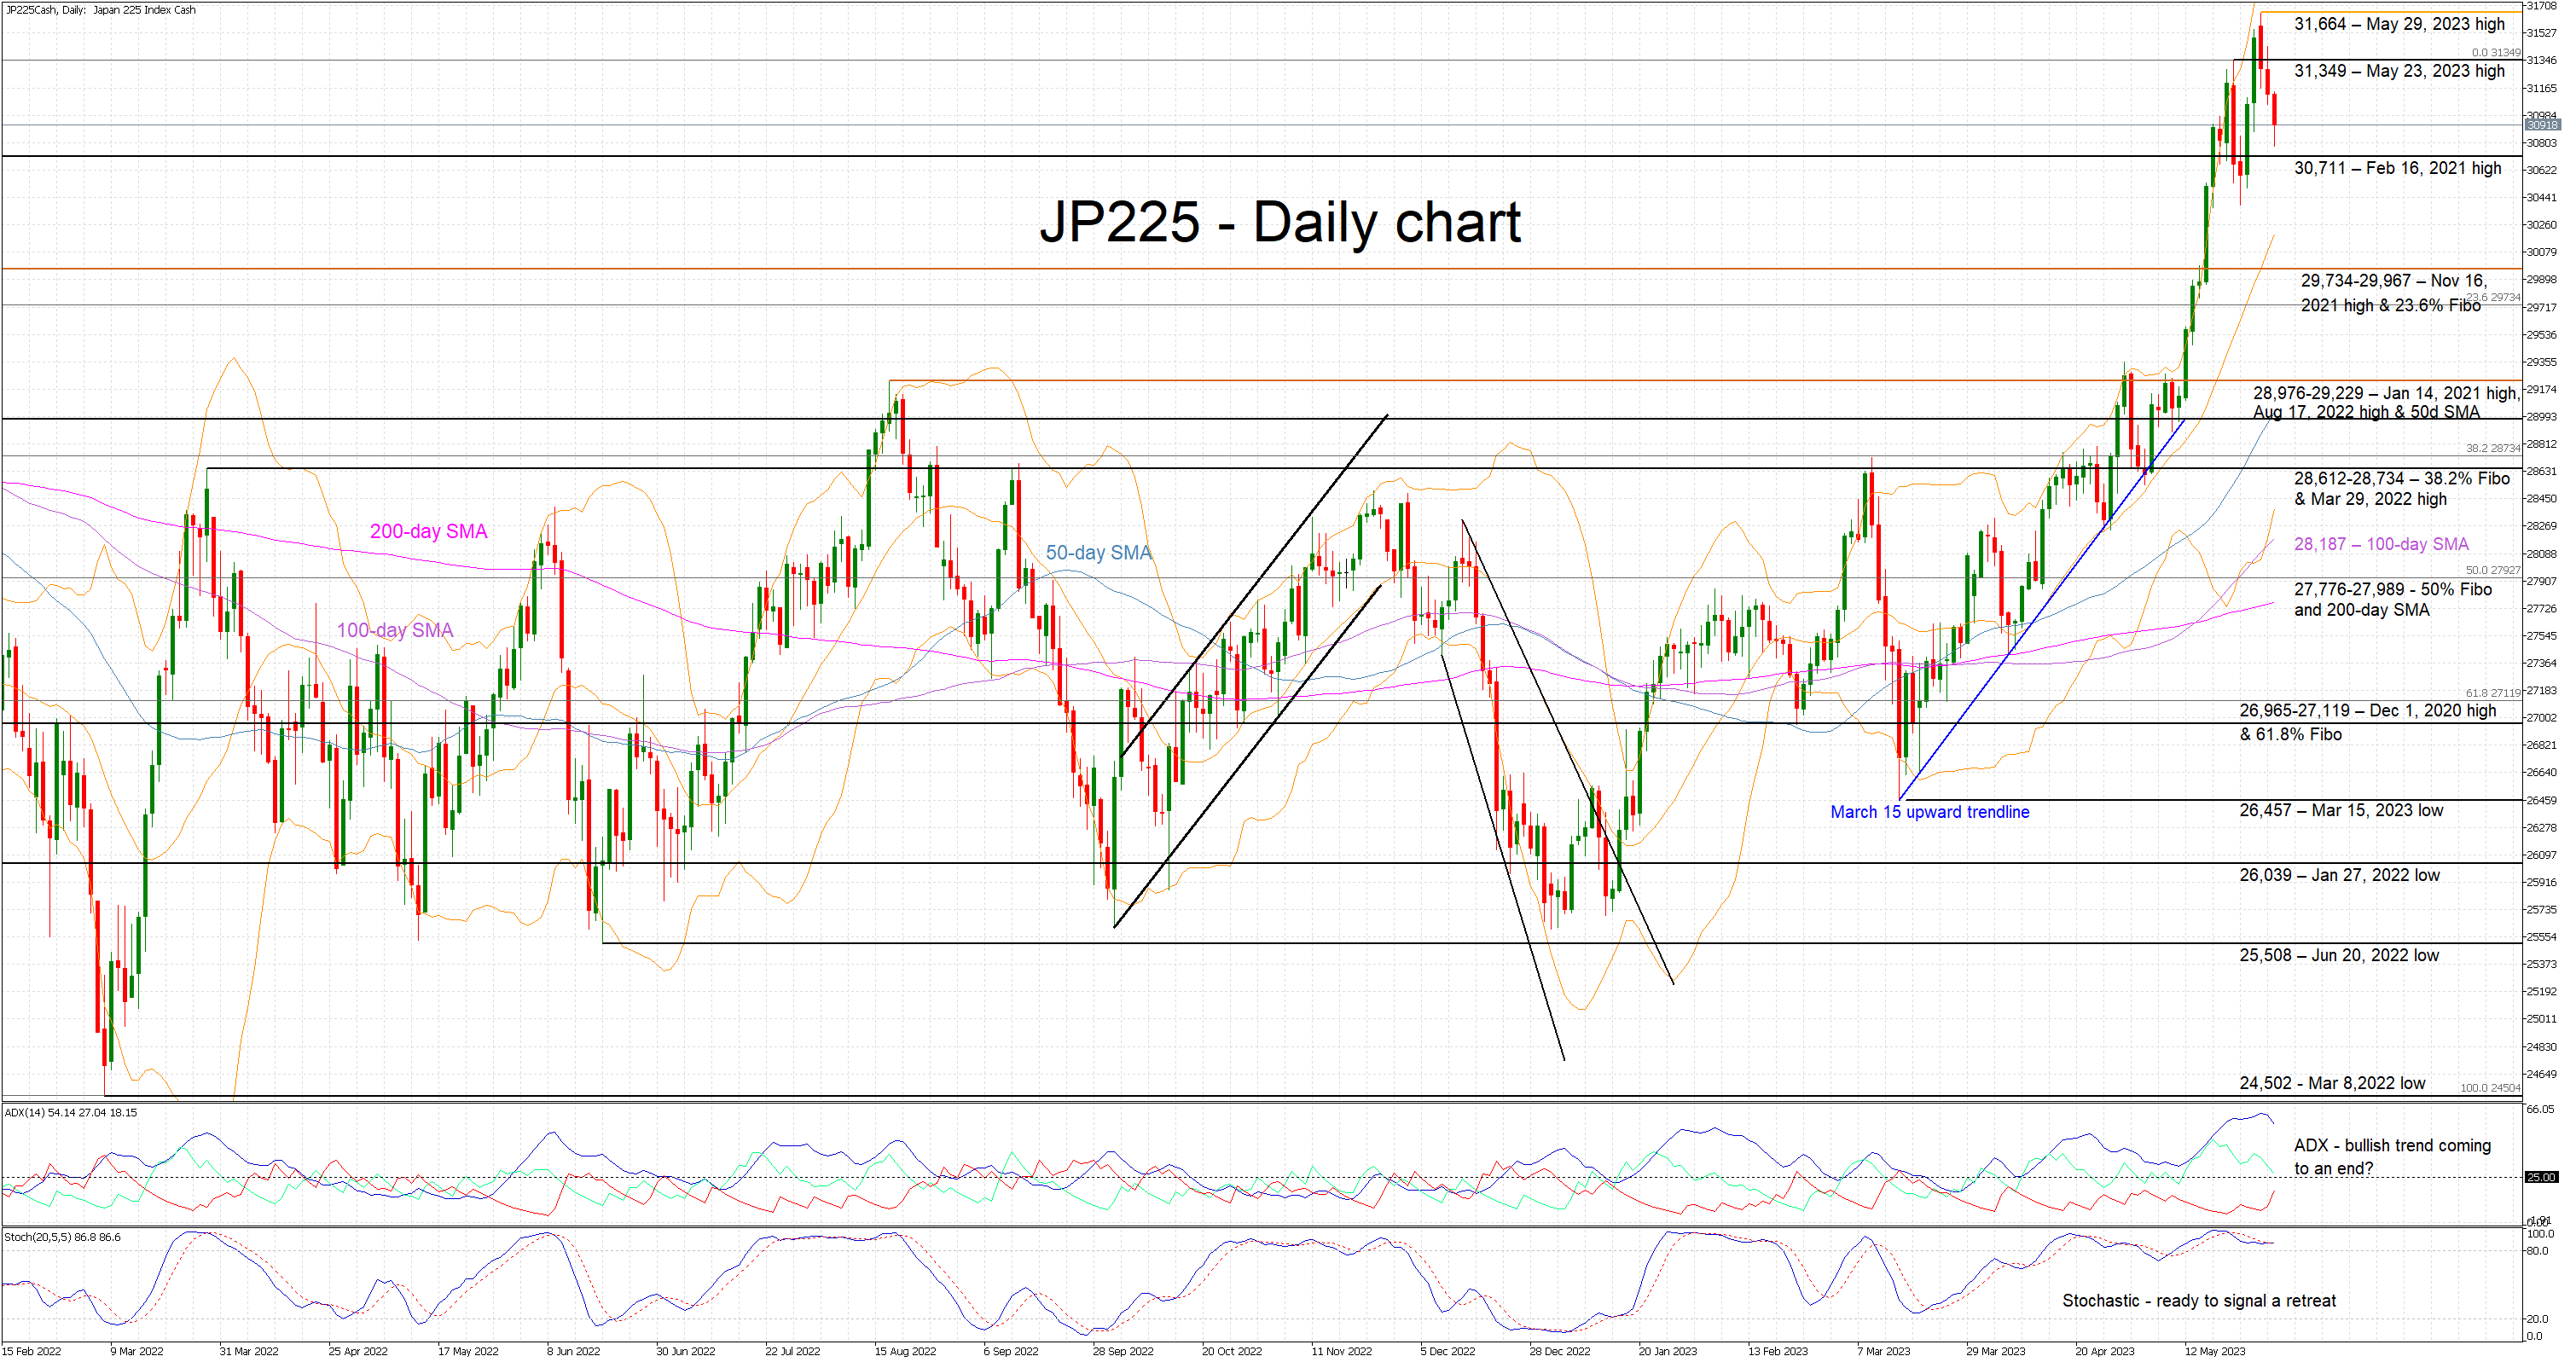
The JP225 cash index is on a streak of downward moves, dropping from the all-time high of 31,664 and it is currently a tad above the 30,711 level. This correction was not unexpected considering the aggressive nature of the recent upleg. However, the momentum indicators might point to a stronger downwards move, and not just a short-term correction.
The Average Directional Movement Index (ADX) is edging lower from its highest peak since the September 2021 rally. Usually, a drop from such high levels is associated with a reversal of the prevailing bullish trend. The stochastic oscillator could offer some assistance in signaling the start of a bearish trend. This indicator is still hovering inside its overbought (OB) territory, but it appears to be toppy. Therefore, the bears should be patient until it finally breaks below its OB region in order to jump on the bandwagon.
If the stochastic delivers a bearish signal, the bears would quickly like to break the 30,711 level and target the busier 29,734-29,967 area that is defined by the 23.6% Fibonacci retracement level of the March 8, 2022 – May 23, 2023 uptrend and the November 16, 2021 high. Even lower, the 28,976-29,229 area is key from a market sentiment perspective.
If the bulls decide to ignore the mixed technical signs, they will most likely have to keep the JP225 index above the 30,711 level. The next step would be to retest the May 23, 2023 high at 31,349 and try to match the all-time high of 31,664.
To sum up, even the JP225 index bulls accept the need for a short-term correction following the aggressive rally. However, they should remain on their toes as bearish evidence is mounting and the correction could quickly transform into a short-term bearish trend.
EUR/USD Daily Outlook
Daily Pivots: (S1) 1.0689; (P) 1.0718; (R1) 1.0763; More...
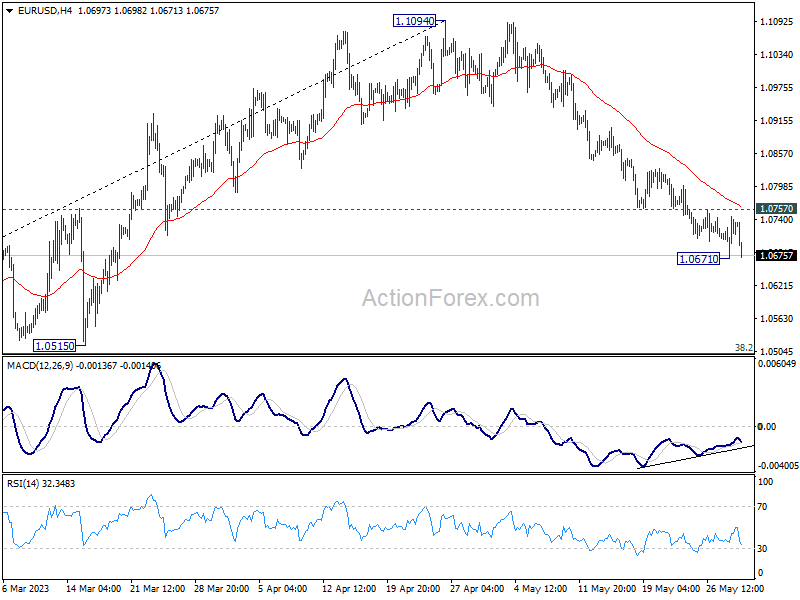
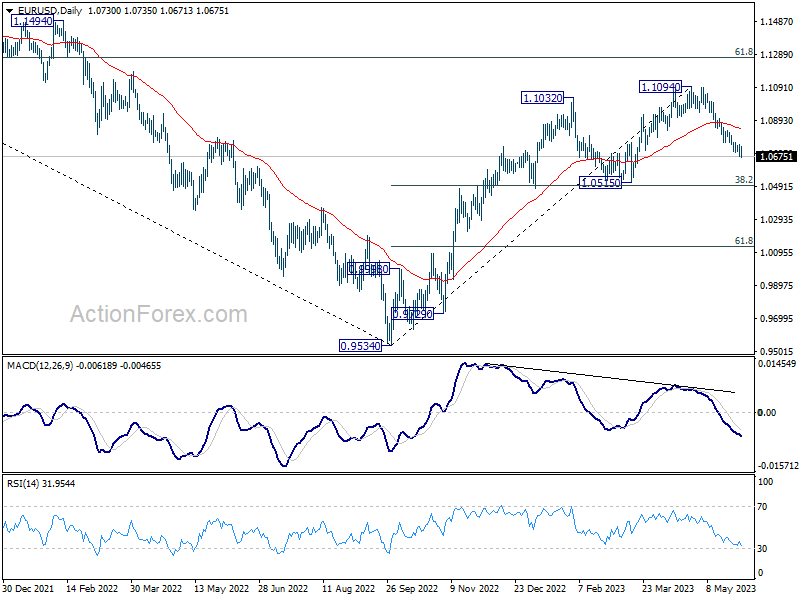
Intraday bias in EUR/USD stays neutral and further decline is expected with 1.0757 minor resistance intact. On the downside, break of 1.0671 will resume the fall from 1.1094 to 1.0515 cluster support, 38.2% retracement of 0.9534 to 1.1094 at 1.0498. On the upside, however, break of 1.0757 resistance will indicate short term bottoming. Stronger rebound would be seen back to 55 D EMA (now at 1.0836).
In the bigger picture, as long as 1.0515 support holds, rise from 0.9534 (2022 low) would still extend higher. Sustained break of 61.8% retracement of 1.2348 (2021 high) to 0.9534 at 1.1273 will solidify the case of bullish trend reversal and target 1.2348 resistance next (2021 high).
GBP/USD Daily Outlook
Daily Pivots: (S1) 1.2344; (P) 1.2395; (R1) 1.2463; More...
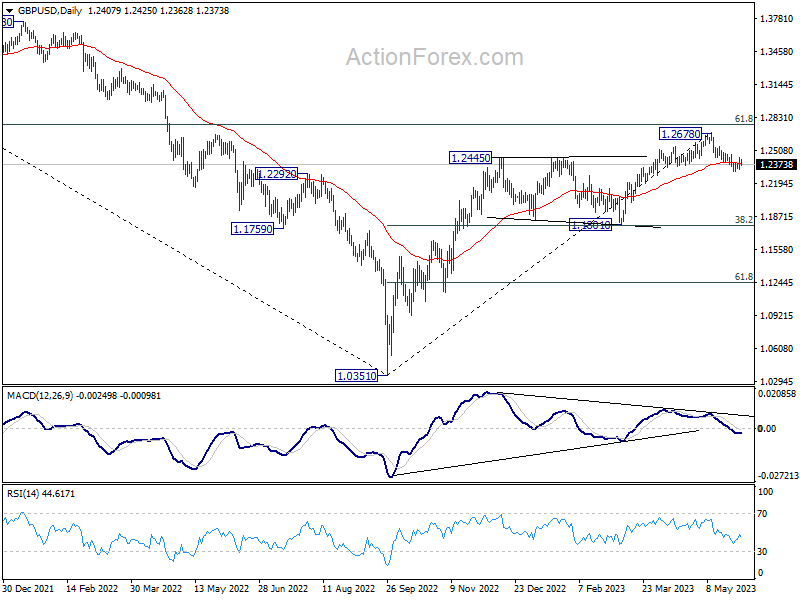
Intraday bias in GBP/USD remains neutral for the moment. Further decline is expected with 1.2468 minor resistance intact. On the downside, break of 1.2306 will resume the fall from 1.2678, as correcting whole up trend from 1.0351, to 1.1801 cluster support (38.2% retracement of 1.0351 to 1.2678 at 1.1789). On the upside, however, firm break of 1.2468 will turn bias back to the upside for stronger rebound.
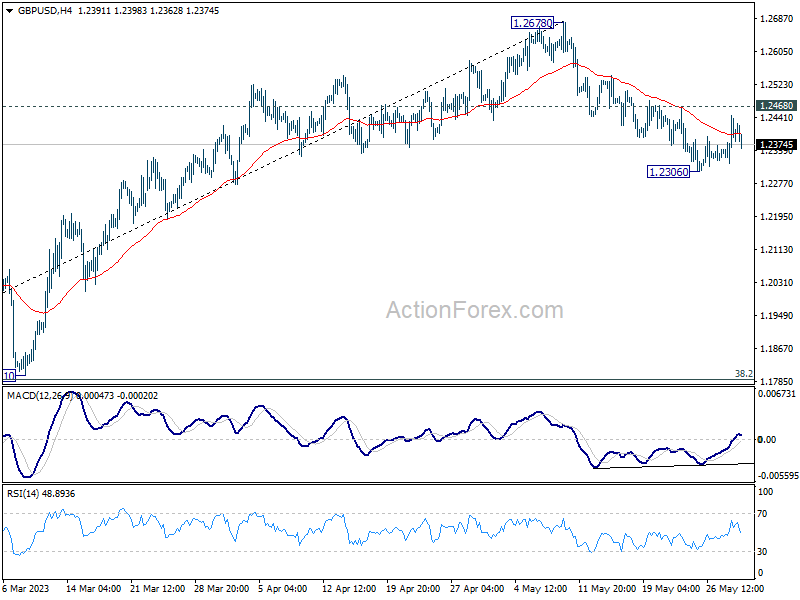
In the bigger picture, as long as 1.1801 support holds, rise from 1.0351 medium term bottom (2022 low) is expected to extend further. Sustained break of 61.8% retracement of 1.4248 (2021 high) to 1.0351 at 1.2759 will add to the case of long term bullish trend reversal. However, firm break of 1.1801 will indicate rejection by 1.2759, and bring deeper decline, even as a correction.
USD/CHF Daily Outlook
Daily Pivots: (S1) 0.9021; (P) 0.9052; (R1) 0.9091; More...
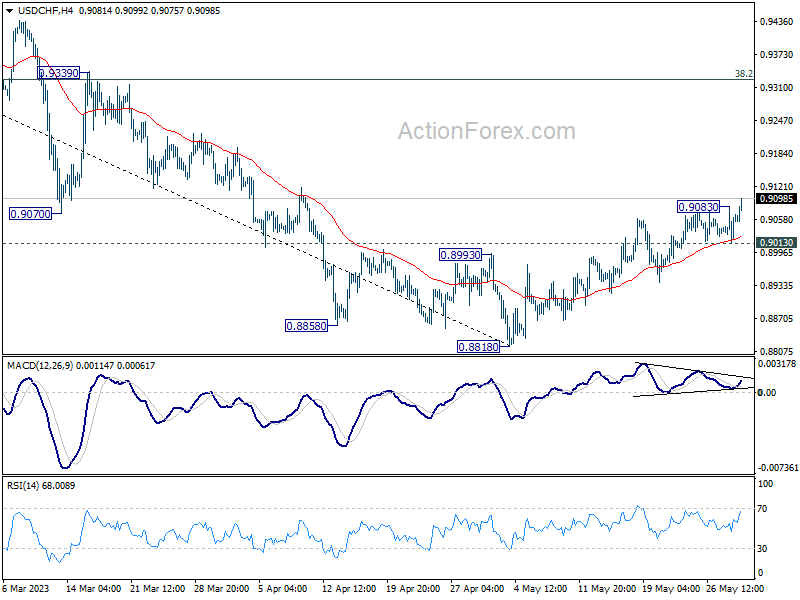
USD/CHF's rally from 0.8818 resumed by breaking through 0.9083. Intraday bias is back on the upside. Current rise is seen as correcting whole down trend from 1.0146. Further rise should then be seen to 38.2% retracement of 1.0146 to 0.8818 at 0.9325. On the downside, below 0.9013 minor support will turn intraday bias neutral first.
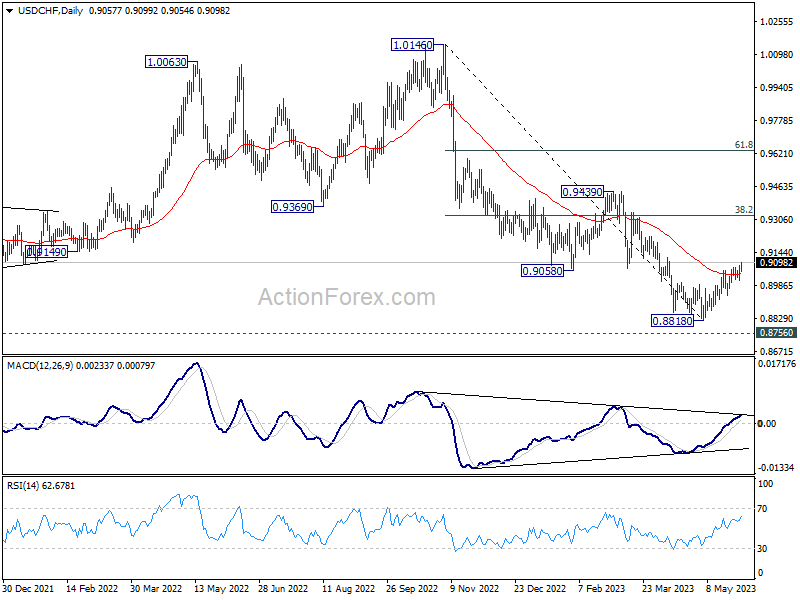
In the bigger picture, fall from 1.1046 (2022 high) is seen as a leg in the long term range pattern from 1.0342 (2016 high). So, downside should be contained by 0.8756 to bring reversal. Sustained break of 0.9058 support turned resistance will be the first sign of medium term bottoming. However, decisive break of 0.8756 will carry larger bearish implications.
USD/JPY Daily Outlook
Daily Pivots: (S1) 139.26; (P) 140.10; (R1) 140.62; More...
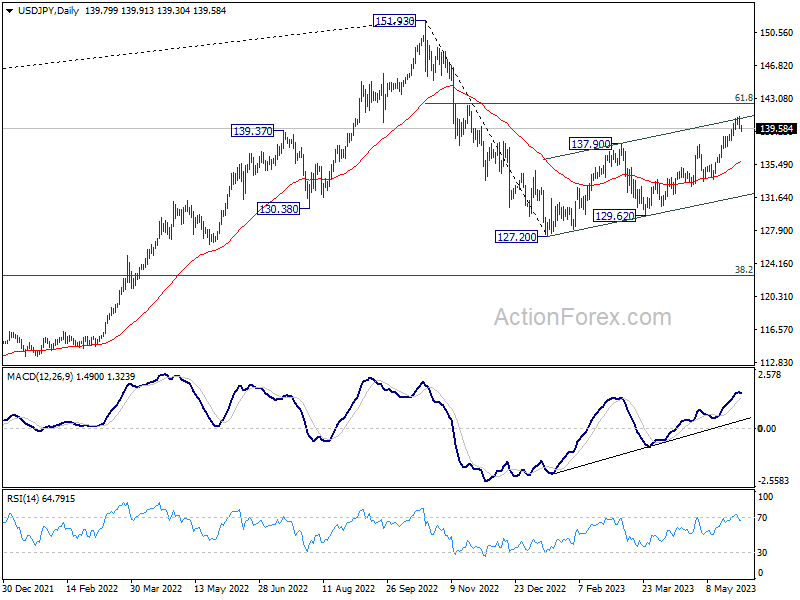
USD/JPY is staying in consolidation below 140.90 and intraday bias remains neutral. Downside of retreat should be contained above 138.22 support to bring another rally. Break of 140.90 will resume larger rise from 127.20 to 142.48 fibonacci level. However, considering bearish divergence condition in 4 hour MACD, break of 138.22 will confirm short term topping, and turn bias back to the downside for 55 D EMA (now at 135.89).
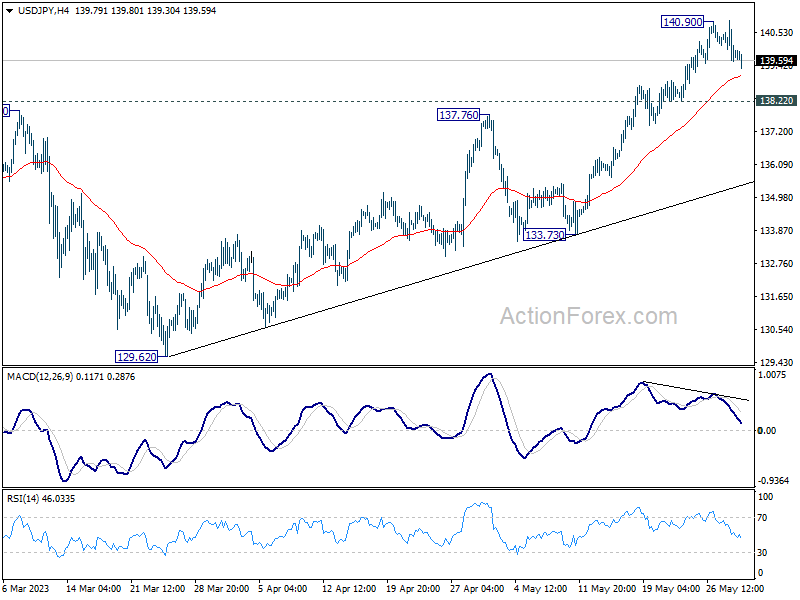
In the bigger picture, rise from 127.20 is seen as the second leg of the corrective pattern from 151.93 high. Stronger rally would be seen to 61.8% retracement of 151.93 to 127.20 at 136.34. Sustained break there will pave the way back to retest 151.93. On the downside, however, break of 133.73 support will argue that the pattern could have started the third leg through 127.20 low.
USD/CAD Daily Outlook
Daily Pivots: (S1) 1.3574; (P) 1.3594; (R1) 1.3619; More....
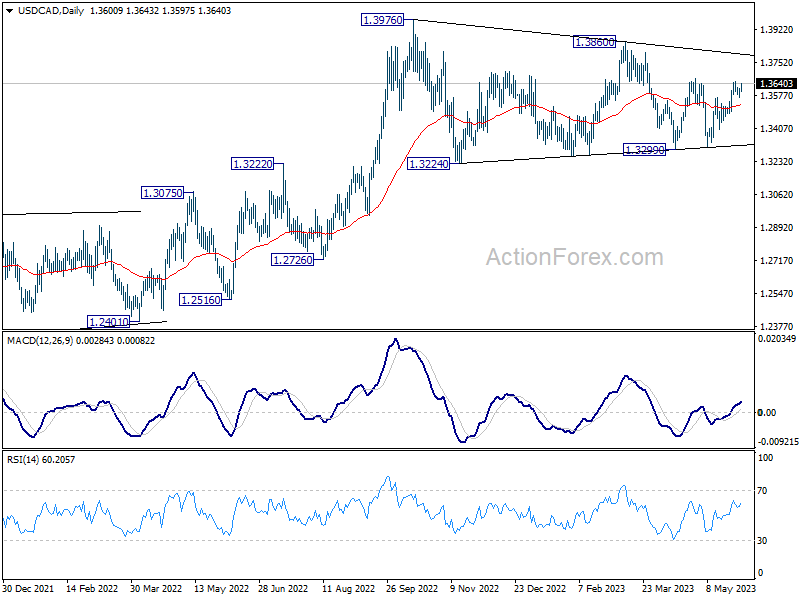
Intraday bias in USD/CAD remains neutral for the moment and outlook is unchanged. Price actions from 1.3976 are seen as a triangle consolidation pattern. Above 1.3666 will target 1.3860 resistance first. Firm break of 1.3860 will argue that larger up trend is ready to resume through 1.3976 high.
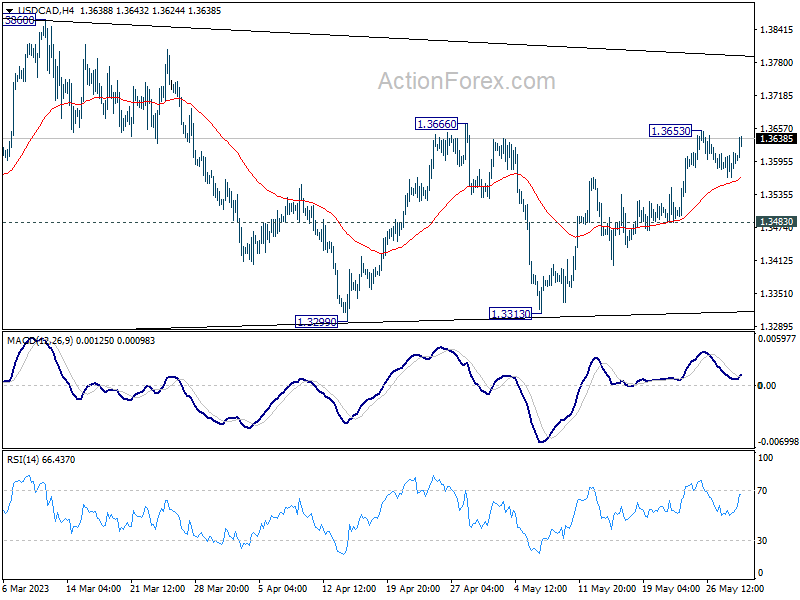
In the bigger picture, rise from 1.2005 (2021 low) is expected to resume through 1.3976 after consolidation from there completes. On decisive break of 1.3976, next target will be 1.4667/89 long term resistance zone. This will remain the favored case as long as 38.2% retracement of 1.2005 to 1.3976 at 1.3233 holds.