Sample Category Title
EURCHF Wave Analysis
- EURCHF reversed from support zone
- Likely to rise to resistance level 0.9750
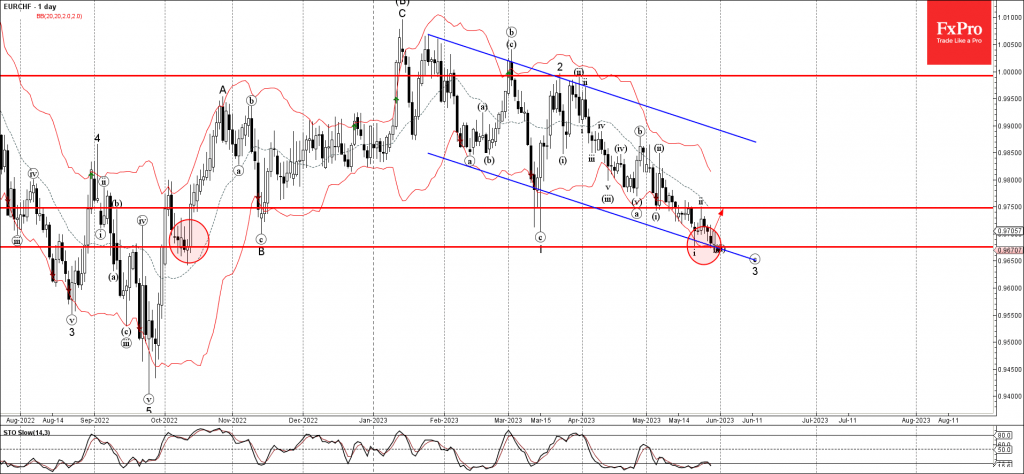
EURCHF currency pair recently reversed up from the support zone located between the key support level 0.9675 (which has been reversing the pair from last October).
The support level 0.9675 was strengthened by the lower daily Bollinger Band and by the support trendline of the daily down channel from January.
Given the oversold daily Stochastic and the strength of the nearby support zone, EURCHF can be expected to rise toward the next resistance level 0.9750.
NZDJPY Wave Analysis
- NZDJPY falling inside impulse wave (3)
- Likely to reach support level 83.80
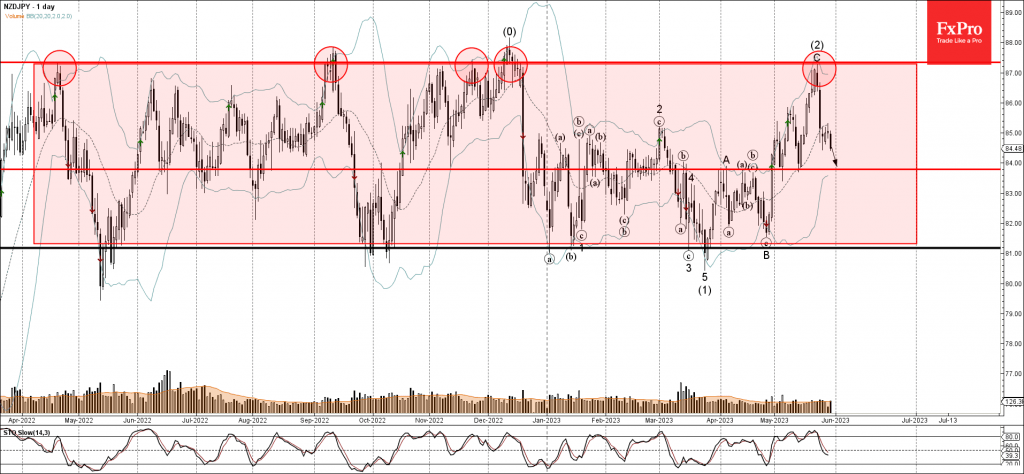
NZDJPY currency pair continues to fall inside the intermediate impulse wave (3), which started earlier from the key resistance level 87.35 (upper border of the wide weekly sideways price range inside which the pair has been trading from last year).
The current impulse wave (3) belongs to the intermediate downward impulse sequence (3) from the start of December.
NZDJPY can be expected to fall further toward the next support level 83.80 (which reversed the pair sharply twice earlier this month).
Dollar Turns to US Employment Report for More Fuel
The US dollar has been firing on all cylinders lately, capitalizing on bets that the Fed will raise rates one final time this summer. Yet, Fed officials seem split on whether more tightening is needed. This puts more emphasis on the upcoming nonfarm payrolls on Friday. Most signs point to another solid employment report, which could cement expectations of higher-for-longer rates and thereby, add fuel to the dollar’s recovery.
One final hike
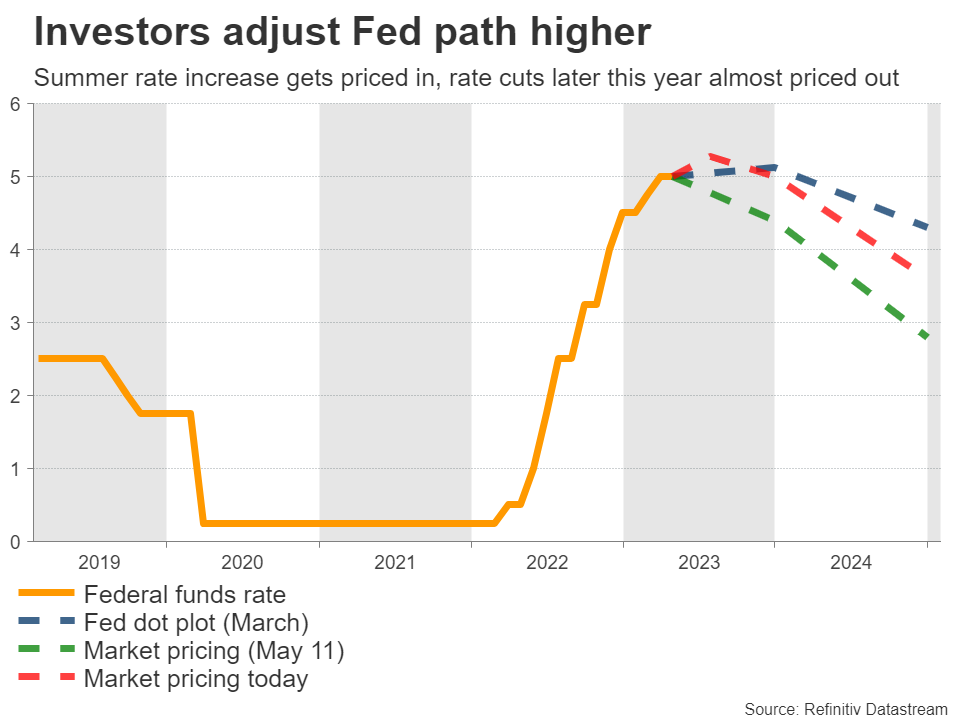
Following a streak of encouraging data releases that highlighted the resilience of the US economy and the persistence of inflationary pressures, there has been a dramatic repricing of the Fed’s interest rate trajectory in recent weeks.
Market participants now assign a 60% probability for the Fed to raise rates again in June, which jumps to 95% for the July meeting. Similarly, the rate cuts that were priced in for the second half of this year have been mostly unwound, as fears of an imminent recession faded.
This repricing has helped to resurrect the dollar. With investors suddenly betting on a higher-for-longer Fed scenario, rate differentials have widened back into the dollar’s benefit. Signs that the European economy is losing steam also played a role, by diminishing the euro’s appeal.
Now the question is whether Fed officials share the view of investors. That’s not clear yet, as some FOMC members have voiced support for ‘pausing’ their tightening cycle. Hence, incoming data will be vital in settling this debate.
Another solid NFP report?This week, the show will get started on Wednesday with the JOLTS survey, ahead of the ADP jobs report and the ISM manufacturing index on Thursday. But the main event will be on Friday, when the latest employment data hits the markets.
Nonfarm payrolls are expected to have risen by 195k in May, which is a healthy number. The unemployment rate is anticipated to tick up to 3.5%, although that would still leave it very close to five-decade lows. Meanwhile, wage growth is projected unchanged at 4.4% in yearly terms.
It’s crucial to note that nonfarm payrolls have exceeded consensus forecasts 12 times in the last 13 months, as economists seem to consistently underestimate the strength of the US labor market.
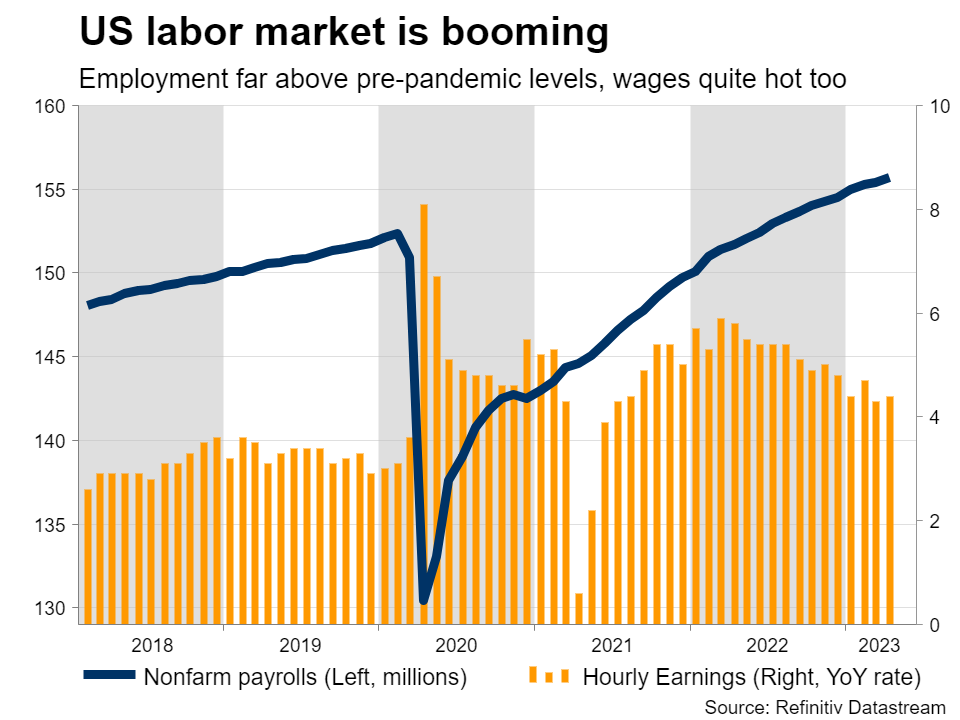
Some early signs suggest this pattern could be repeated this time. Business surveys from S&P Global revealed the strongest increase in employment growth for ten months in May, and also highlighted growing salary pressures as workers demanded higher compensation.
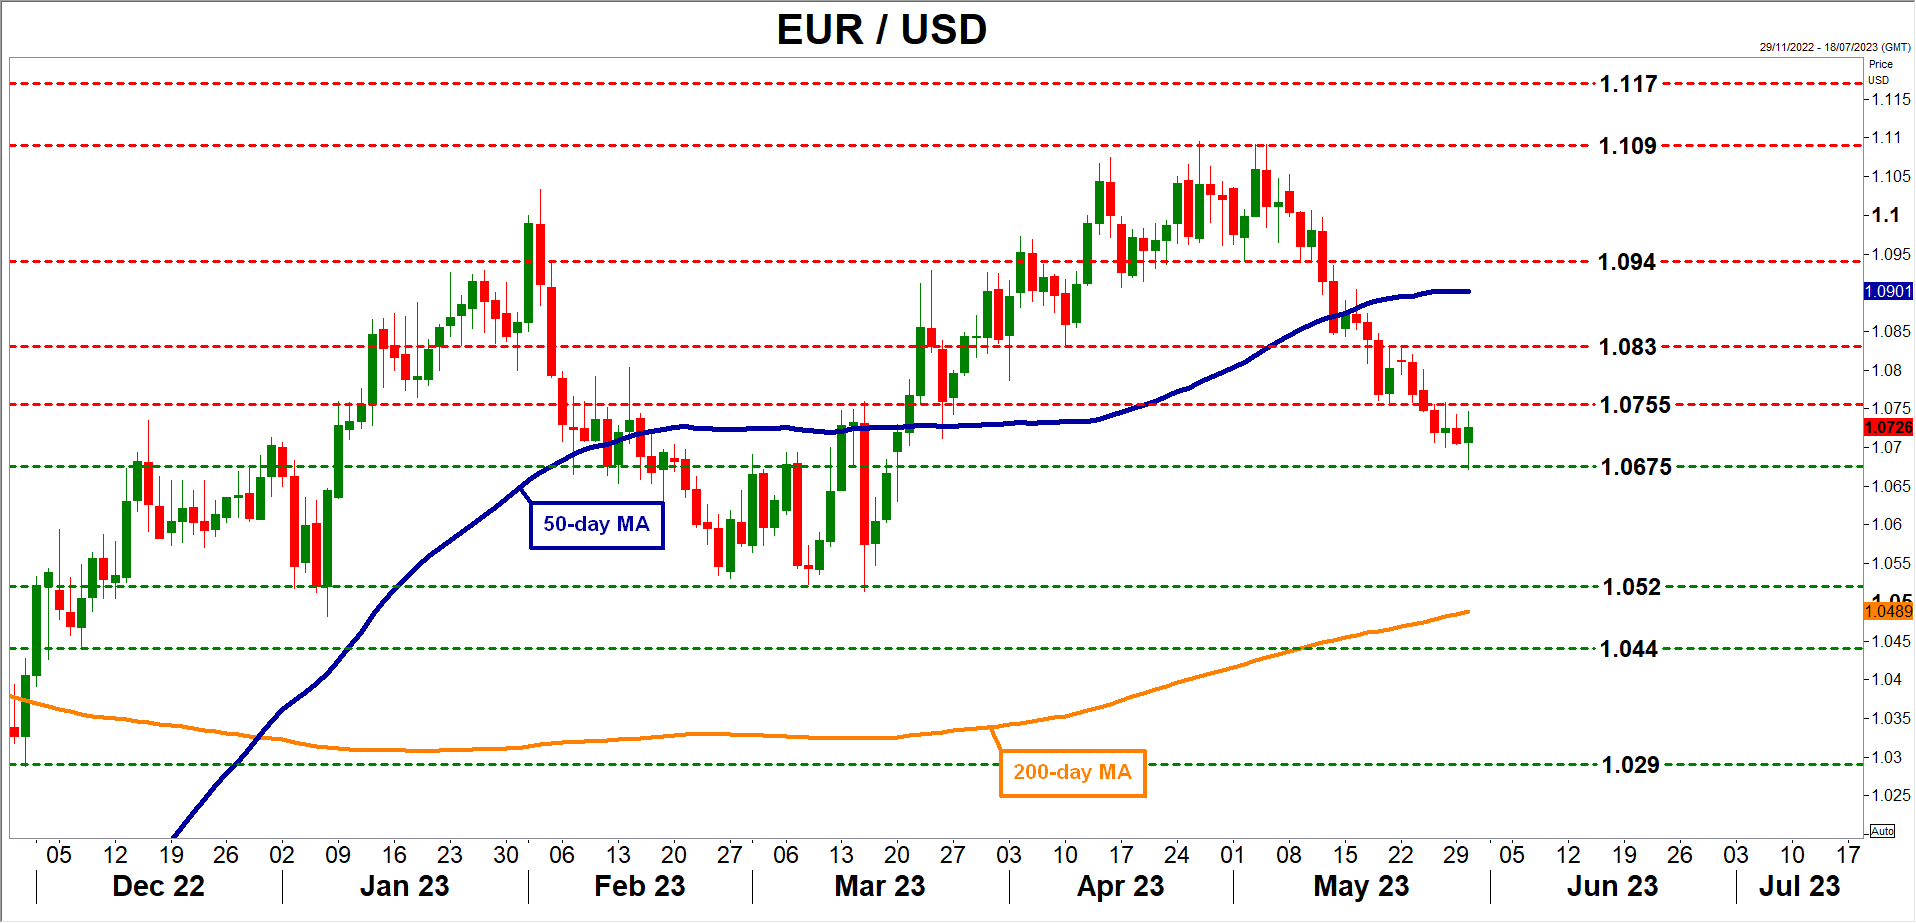
A surprisingly strong report could cement hawkish Fed bets and boost demand for the dollar. Taking a technical look at euro/dollar, the first downside barrier might be the 1.0675 area.
On the flipside, a disappointing report has the capacity to spark a wave of profit-taking in the dollar, propelling euro/dollar higher to challenge the 1.0755 zone again.
More euro/dollar losses?
Looking ahead, in the scenario where US data remains resilient, there is scope for euro/dollar to decline further as traders unwind the surviving rate-cut bets for later this year. In addition, the summer months could be marked by tighter liquidity conditions as the Treasury replenishes its cash buffer, which is another positive force for the greenback.
On the euro side of the equation, with the Eurozone economy slowing down and inflationary pressures finally cooling, market pricing for another 60bps worth of ECB rate increases seems a little unrealistic. If those rate-hike bets are dialed back, the euro could remain under pressure.
From a chart perspective, the ‘line in the sand’ for euro/dollar is the 1.0530 region. A downside violation would mark a lower low on the daily chart, signaling that the longer-term uptrend is no longer in play.
Could a Strong Inflation Print Reignite Hawkish RBA Expectations?
A week before the monthly RBA meeting and the aussie is trying to recover some of its recent losses. For this tendency to accelerate, it needs a good set of data releases this week, and predominantly a stronger monthly CPI. However, the overall environment is not supportive of hawkish market repricings, making the aussie bulls’ task even tougher.
RBA meeting again next week
The RBA holds its monthly meeting on June 6 with the market expecting no change at the current 3.85% cash target rate. A total of 20 bps of rate hikes are priced in by the September 2023 meeting, implying an 80% chance of a full 25 bps rate hike. While we don’t exclude a surprise at next week’s meeting, the overall environment appears to be less supportive of hawkish surprises. Especially as the neighbouring RBNZ has probably announced its last hike in the current cycle and the Fed is almost ready to keep rates unchanged in its upcoming meeting for the first time since March 2022.
However, as seen in early May, the RBA could pull another rate hike out of the hat. The bar though appears to be higher now, especially as the preliminary PMIs were not a pleasant reading, unemployment is edging higher again and retail sales surprised on the downside. But the key data print remains inflation.
Monthly CPI is not really “monthly CPI”
The monthly CPI figure will be released on Wednesday, and it is expected to remain comfortably above 6% and very close to April's 6.3% year-on-year change. Confirmation of the consensus forecast, or an even lower print, would probably cement the very low market expectations for the June meeting. On the other hand, a stronger print, especially if it climbs above 7%, would hesitantly bring back to the table the possibility of another rate hike, giving the aussie a much-needed boost.
The market is very keen on the monthly inflation updates, but here lies a critical issue for the RBA. The official inflation figures for Australia are published on a quarterly basis. In October 2022 the Bureau of Statistics started to publish a monthly figure which is only two-thirds representative of the quarterly CPI basket. This means that revisions take place and could be significant.
Housing sector still under pressure
Another sector that continues to get significant airtime, mostly for negative reasons, is the housing sector. With the building approvals moving again in negative territory, the focus now turns to home loans. This tends to be a leading indicator of demand in the housing sector with the March figure finally showing a positive change after 9 straight months of negative growth. The year-on-year figures remain almost 25% lower, but another positive monthly change would be seen as a positive signal despite the aggressive rate hikes.
Euro/aussie experiencing bullish pressure
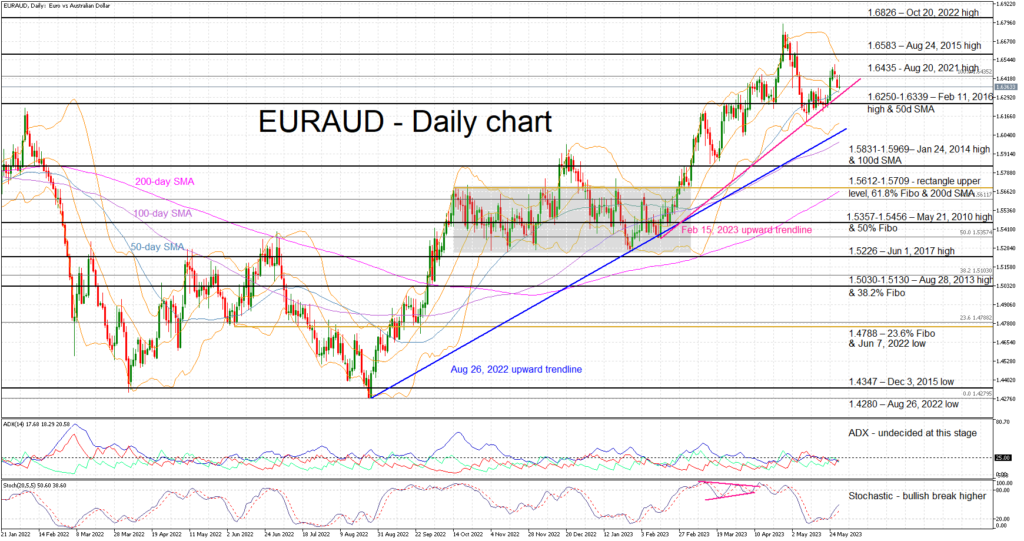
The aussie has been on the back foot since August 2022, underperforming the euro by around 15%. Recently, it has been trying to recover part of these losses, especially following the recent streak of weak euro area data. However, any attempt for a significant correction at the euro/aussie pair has halted at the February 15, 2023 upward sloping trendline. In addition, with the stochastic edging almost vertically higher, the onus is on aussie bulls to stop this pair from recording higher highs.
A positive set of data this week, and particularly an upside inflation surprise, would help the aussie bulls retest and potentially break the aforementioned trendline and the busy 1.6250-1.6339 area. On the other hand, weak data figures, which would essentially negate any change for a surprise rate hike at the next week’s meeting, would open the door for a break of the 1.6583 level and a retest of the October 20, 2022 high at 1.6826.
Euro Touches 9 Week Low, German CPI Next
- Spain’s CPI eases in May
- German CPI to be released on Wednesday
- Debt ceiling likely to be approved in Congress
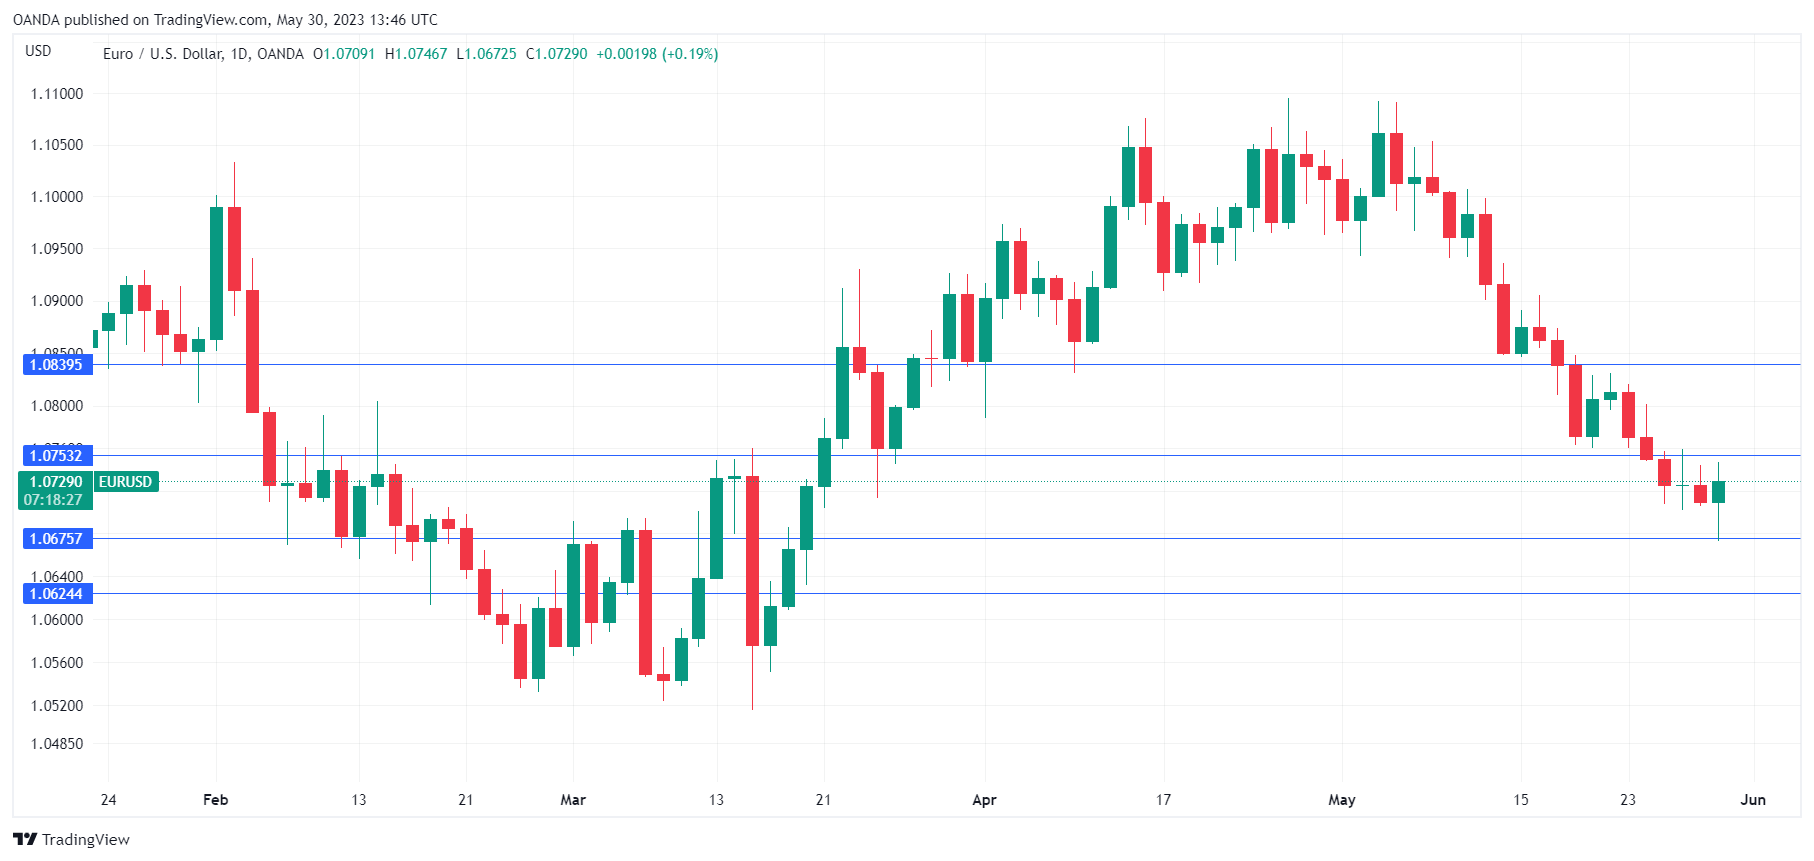
EUR/USD has edged higher on Wednesday. In the European session, EUR/USD is trading at 1.0737, up 0.26%. Earlier, the euro dropped as low as 1.0672, its lowest level since March 20.
Spanish CPI lower than expected
Spain, the fourth-largest economy in the eurozone, saw inflation fall to 3.2% in May. This follows a 4.1% gain in April and was below the consensus estimate of 3.5%. The sharp drop was mostly due to lower fuel prices. On a monthly basis, CPI fell by 0.1%, after a gain of 0.6% and below the consensus estimate of 0.1%.
Will we see a similar downturn in German inflation on Wednesday? The markets are projecting that CPI for May will ease to 6.8%, down from 7.6% in April. A deceleration in inflation would be positive news, but the ECB’s target of 2% remains very far away and will likely take years to achieve that goal. That means that more rate hikes are likely. The ECB meets next on June 15th and another hike is likely, as inflation remains public enemy number one and the central bank is intent on preventing inflation from becoming entrenched. ECB President Lagarde will deliver public remarks on Wednesday and investors will be hoping for some insights with regard to rate policy.
Debt ceiling deal on its way to Congress
After weeks of difficult negotiations, President Biden and Republican Speaker McCarthy have reached an agreement in principle on the debt ceiling. The deal is expected to receive approval from both houses of Congress, although some Republicans are expected to vote against the agreement. US yields have moved higher in recent weeks, buoyed by the uncertainty which has pushed investors towards safe-haven assets. The US dollar has also benefitted from the crisis, and the question remains whether a deal will see a spike in risk sentiment that will cool the hot US dollar.
EUR/USD Technical
- There is resistance at 1.0753 and 1.0839
- 1.0675 and 1.0624 are providing support
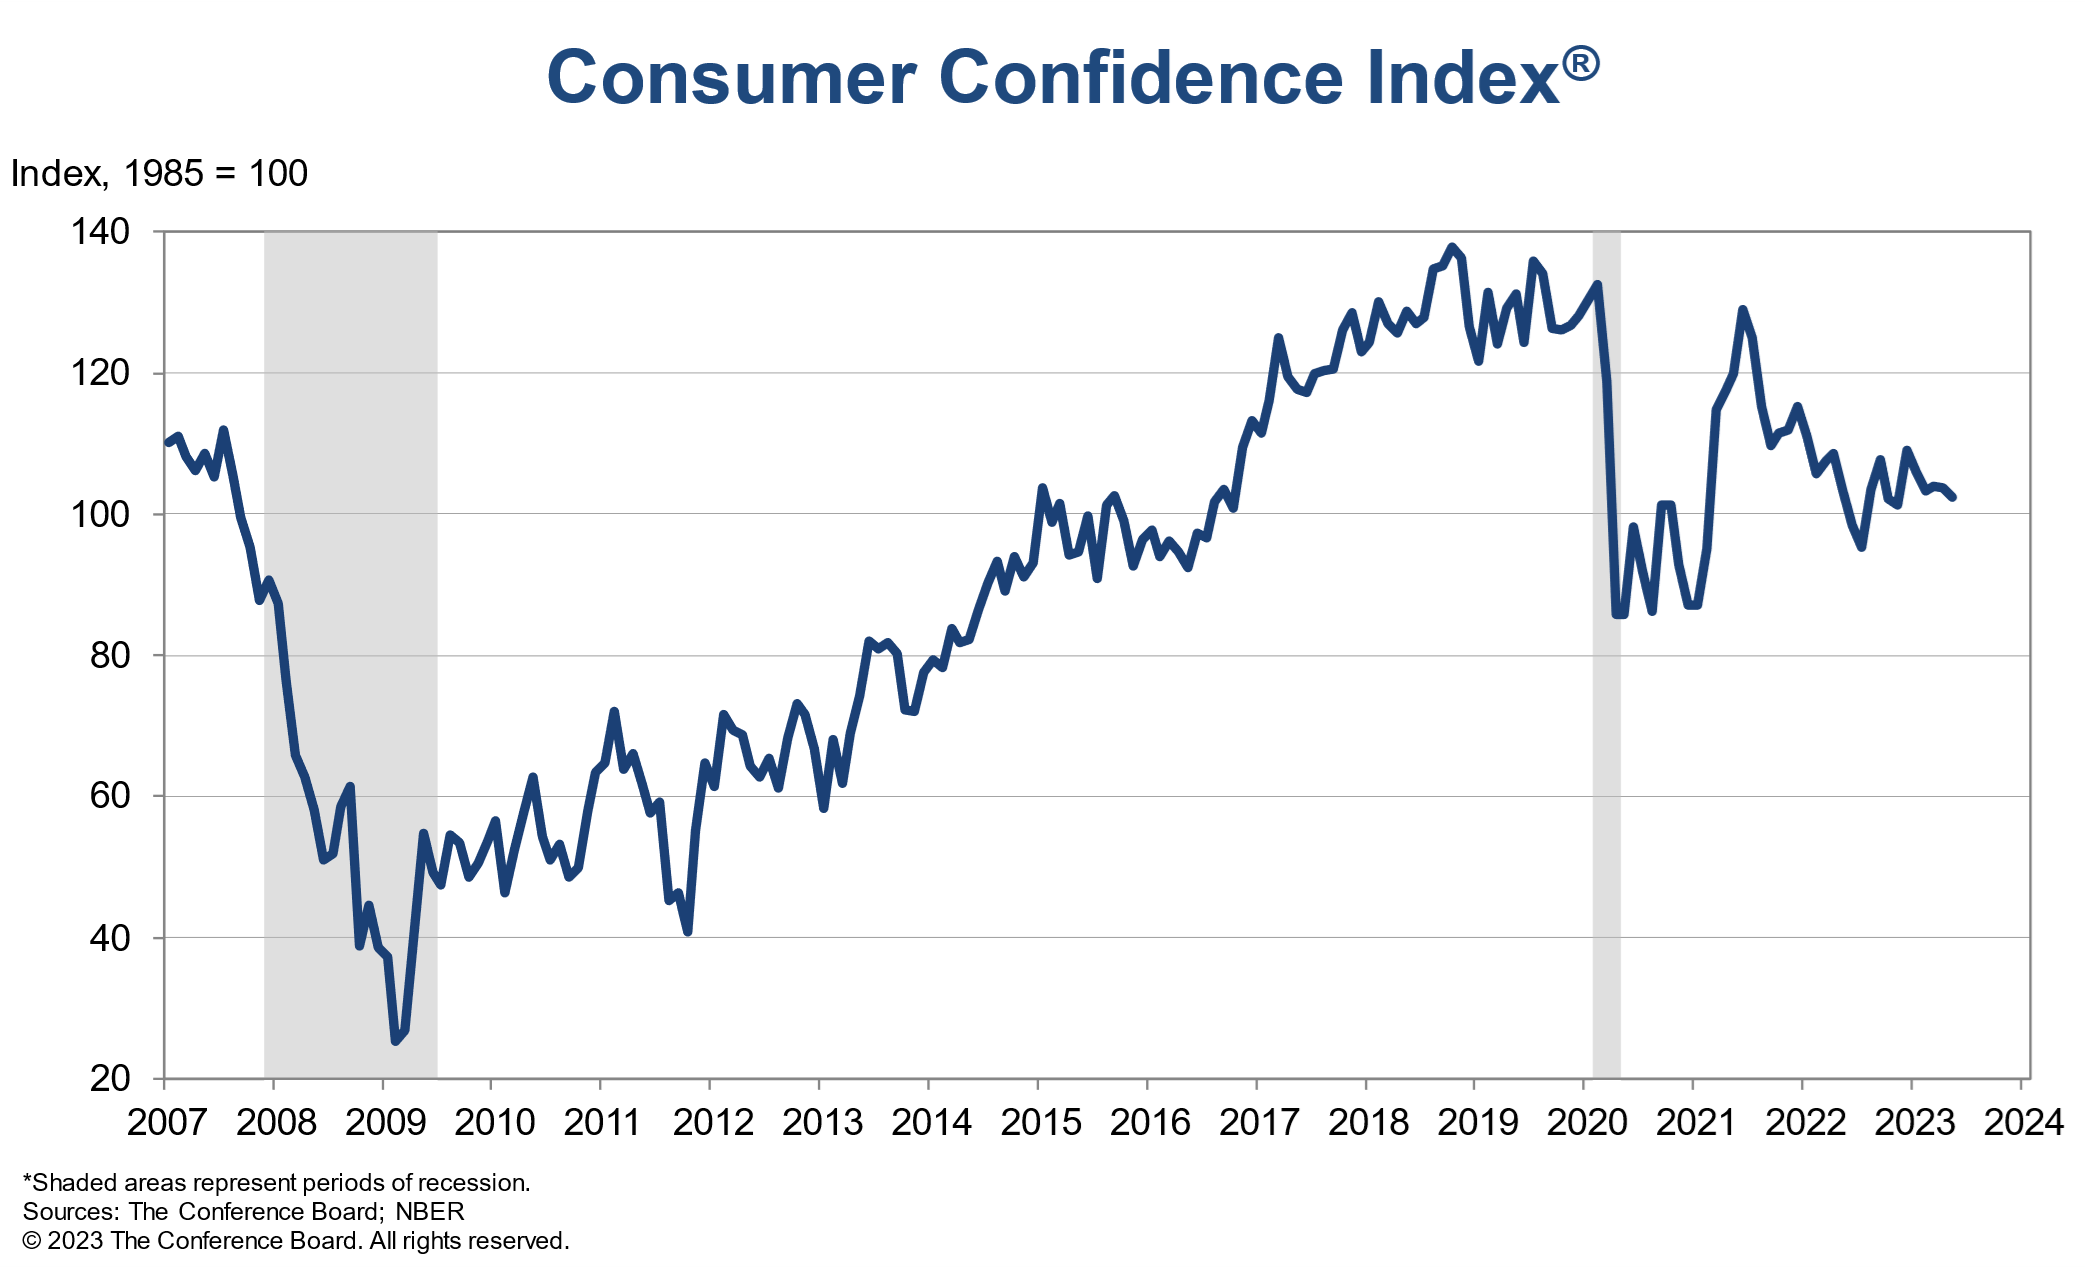
US consumer confidence fell to 102.3, employment saw most significant deterioration
US Conference Board Consumer Confidence dropped from 103.7 to 102.3 in May, but beat expectation of 99.1. Present Situation Index fell from 151.8 to 148.6. Expectations Index dropped slightly from 71.7 to 71.5.
Ataman Ozyildirim, Senior Director, Economics at The Conference Board:
"Consumer confidence declined in May as consumers' view of current conditions became somewhat less upbeat while their expectations remained gloomy."
"Their assessment of current employment conditions saw the most significant deterioration, with the proportion of consumers reporting jobs are 'plentiful' falling 4 ppts from 47.5 percent in April to 43.5 percent in May.
"Consumers also became more downbeat about future business conditions, weighing on the expectations index. However, expectations for jobs and incomes over the next six months held relatively steady. "
"Consumers' inflation expectations remain elevated, but stable. Consumers in May expected inflation to average 6.1 percent over the next 12 months—essentially unchanged from 6.2 percent in April, though down substantially from the peak of 7.9 percent reached last year."
Sunset Market Commentary
Markets
We got the first national inflation releases today in the run-up to the European figure on Thursday. Belgian (non-harmonized) inflation decelerated from 5.6% in April to 5.2% in May (see below). The Spanish number came in below consensus with HICP easing from 3.8% to 2.9% vs the 3.3% expected. Monthly prices unexpectedly dropped 0.2% amid a fall in fuel prices and a smaller food price gain. Core CPI (national reading) slowed from 6.6% to 6.1% vs 6.4% consensus. Germany, France and Italy are all due tomorrow and make up some 65% of the HICP basket. The Spanish number nevertheless set the tone for core bonds today. It also preceded the ECB’s monthly monetary development publication, showing the annual M3 money growth further decelerated from 2.5% in March to 1.9% in April. This suggests ECB tightening is continuing to filter through. The combination pushes European yields further south. German yields extend yesterday’s 10 bps decline with another 2.4-6 bps move across the curve. The 2-y yield (2.82%) backs away from the 3% barrier. ECB’s Simkus was the latest one to back at least two more 25 bps hikes this year. September is an open question and there is still a lot of economic data to be published as well with two more forecasting rounds to be held. US Treasuries give up 1.2-5 bps. Losses were double that before US investors started joining though. The 2-y reference still holds above 4.50% though. UK gilt yields gapped lower at the open but recovered most of the losses as trading evolved. Such underperformance, once again, this time around did not go unnoticed on FX markets. Sterling was pouncing on the YtD highs against the euro for some time now. EUR/GBP 0.865 support (resistance for the pound) eventually broke. The pair is now trading at its weakest level (0.863) since mid-December. EUR/USD (1.073) briefly dipped sub 1.07 to 1.068 before a technical bounce-back brought it back north of that big figure. The trade-weighted dollar eases a few ticks to the recently conquered 104.089 resistance-now-support. USD/JPY initially extended a streak of gains to 140.93 before reports of an unscheduled meeting between officials from the BoJ, Ministry of Finance and the Financial Services Agency aired. Investors took it as a sign that officials are on alert regarding the weakening JPY. Losses turned into gains with USD/JPY changing hands around 139.81. Stocks fluctuate in Europe and open with gains on WS (+1% for the Nasdaq).
News & Views
Swedish GDP rose by 0.6% Q/Q in the first quarter of this year (0.8% Y/Y), beating the 0.2% Q/Q consensus estimate. The upturn is mainly explained by an increase in inventories (+0.6 ppt contribution) and by a strong growth in the export of goods (+1.2% Q/Q vs +0.7% Q/Q for imports; +0.3 ppt contribution). General government consumption and gross fixed capital formation both grew by 0.5% Q/Q. Household consumption was the only drag on growth, falling by 1.2% Q/Q. The total number of employed persons increased by 0.7% with the number of hours worked rising by 1.8%. Monthly confidence data (May) released today also beat consensus. Today’s figures don’t stop the rot in the Swedish krone which weakens to a new multiyear low at EUR/SEK 11.63. Pressure builds for the Riksbank who recently started talking up earlier guidance that a final 25 bps rate hike from the current 3.5% would suffice. Deputy governor Jansson today said that sooner or later, the weak currency will become an important factor for inflation and that it would cause a problem for monetary policy. Governor Breman last week floated divesting more bonds as a policy option in addition to higher rates. Currency interventions should be seen as a last resort according to Jansson.
Belgian inflation rose by 0.38% M/M in May. The most significant price increases in May were registered for the maintenance and repair of cars (+4.3% M/M), plane tickets (+18.3%), private rents (+0.9%), holiday villages (+10.1%), French-fries stands, fast-food restaurants and snack bars (+4.1%), hotel rooms (+7%) and alcoholic beverages (+2.5%). Motor fuels (-4%), electricity (-4.4%), bread and cereals (-1.4%) and domestic heating oil (-2.7%) had a decreasing effect on the index. In Y/Y terms, Belgian inflation slowed from 5.6% to 5.2% because of sharply falling energy prices (-21.98% Y/Y). Underlying core inflation, stripping out energy and unprocessed food prices, rose from 8.28% Y/Y to 8.9% Y/Y. Services inflation showed a strong acceleration from 6.8% Y/Y to 8.16% Y/Y with inflation from rents stable at 6.23% Y/Y.
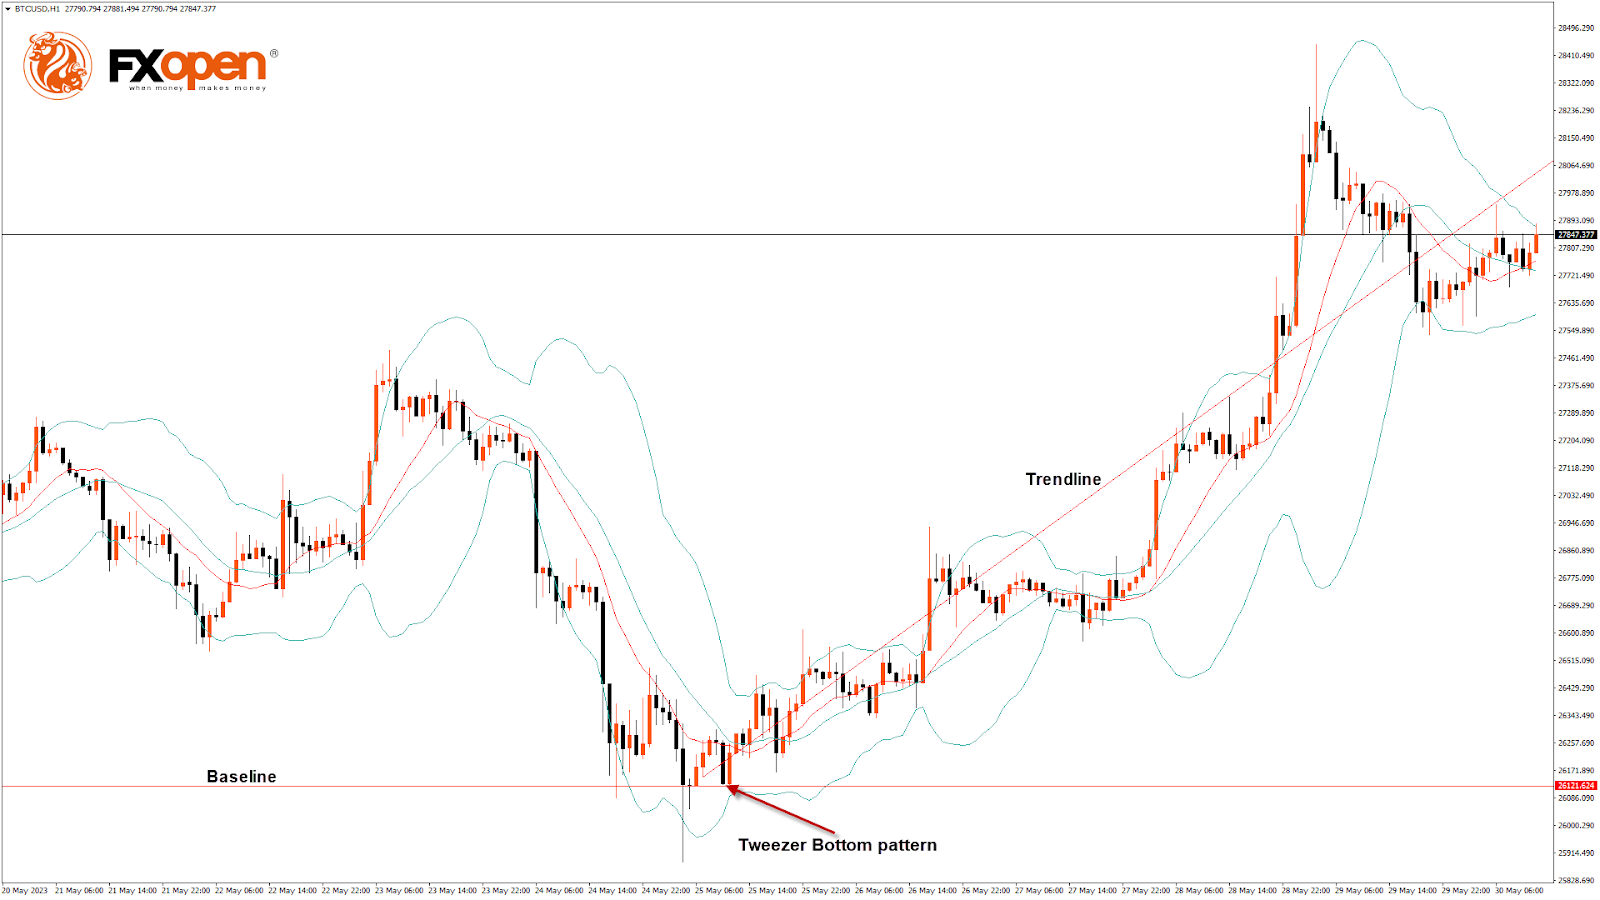
BTCUSD Analysis: Tweezer Bottom Pattern above $26,121
Bitcoin price continues its bullish momentum from last week after touching a low of $26,121 on May 25, with strong upsides located in the range of $28,500 and $29,000.
On the hourly chart:
- We can clearly see a tweezer bottom pattern above the $26,121 handle, which indicates a bullish trend.
- Both the STOCH and STOCHRSI indicate overbought market conditions, which means that in the immediate short term, a decline in the price may occur.
- The MACD crosses UP its moving average.
- The relative strength index is at 56.95, indicating a strong demand for Bitcoin and the continuation of the buying pressure in the market.
- Most of the major technical indicators give a bullish signal, which means that in the immediate short term, the expected targets are $28,000 and $28,500.
- Bitcoin price is now moving above its 100-hour simple moving average and 100-hour exponential moving average.
- The average true range indicates low market volatility with mild bullish momentum.
Bitcoin Bullish Continuation Seen above $26,121
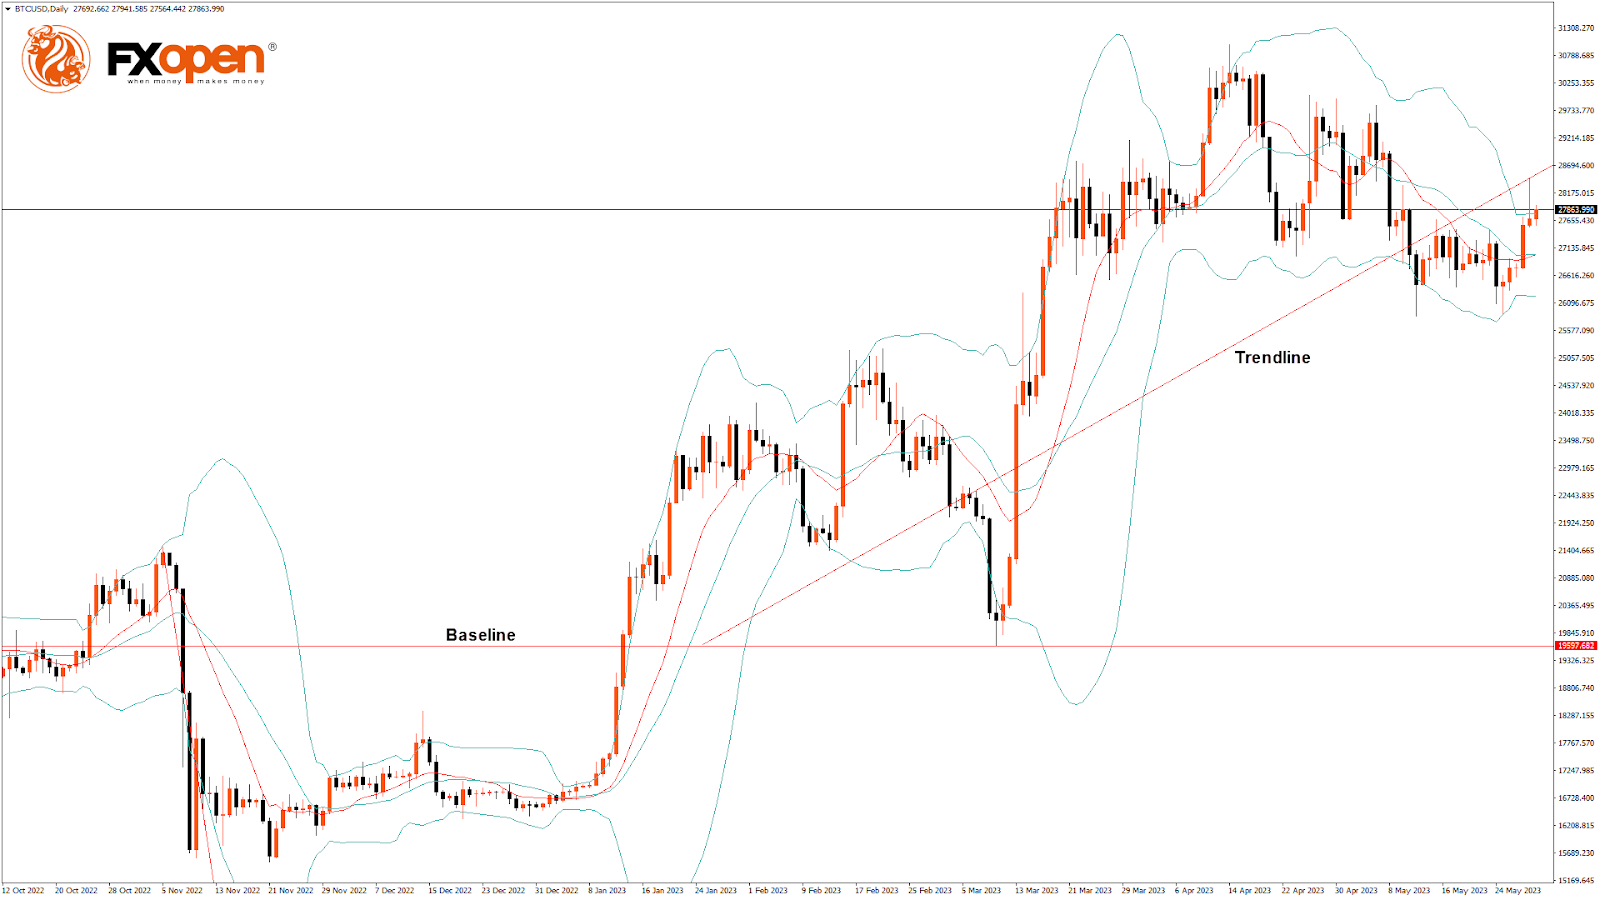
The Bitcoin to USD exchange rate entered into a consolidation zone above the $27,500 handle, after which we can see the start of the bullish move.
On the daily chart:
- A bullish harami pattern is visible.
- The RSI remains above 50, indicating a bullish market.
- The Bitcoin price is now trading above its pivot level of $27,802.
- The short-term range is mildly bullish.
- The horizontal resistance is broken.
- Bullish price crossover is seen with the AMA50 and the AMA100.
A support zone is located at $26,391, which is a 14-3-day raw stochastic at 20, and at $26,624, which is a 38.2% retracement from a 13-week high.
BTCUSD is now facing its classic resistance level of $27,854 and Fibonacci resistance level of $27,894, breaking which the price will be able to move to $28,500.
The Week Ahead
The start of this week has been excellent for Bitcoin as its price remained above the $26,000 handle, touching a high of $28,374 on 29th May.
Bitcoin price is bullish above the $28,000 handle on the daily chart with the formation of an ascending channel, with the current support at $26,729, which is a pivot point's first support level.
The immediate expected target is $28,500, after which we may see some consolidation in the $29,000 zone.
At the moment, the price is correcting lower and trading near $27,915, which is a 50% retracement from the 4-week high/low.
We can see the formation of a bullish trend line from $26,121 to $28,056.
The BTCUSD is now facing resistance at $28,098, which is a 3-10 day MACD oscillator, and at $28,538, which is the first resistance point of the pivot point indicator.
The weekly outlook for Bitcoin price is $29,500, with a consolidation zone of $29,000.
The short-term outlook for Bitcoin is mildly bullish, the medium-term outlook has turned bullish, and the long-term outlook remains neutral under present market conditions.
WTI Oil: Oil Price Tumbles on Fading Risk Sentiment
Oil fell sharply on Tuesday, losing almost 4% until early US session, as risk sentiment soured on fresh concerns about the US debt ceiling deal, while supply outlook is unclear due to mixed messages from world major oil producers, just days ahead of OPEC+ meeting.
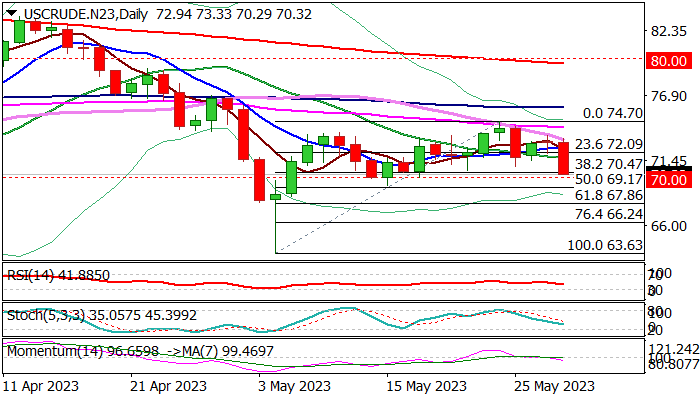
Fresh acceleration lower dented pivotal Fibo support at $70.47 (38.2% retracement of $63.63/$74.70 advance) with daily close below here to generate new signal and expose next pivotal supports at $70 and $69.17 (psychological / 50% retracement of $63.63/$74.70 ($69.17).
Falling 14-d momentum broke into negative territory, RSI & Stochastic are heading south and daily moving averages turned to full bearish configuration, contributing to bearish near-term outlook.
Initial resistance lays at $71.80 (20DMA), followed by broken Fibo 23.6% ($72.09) and 10DMA ($72.44).
Res: 70.98; 71.80; 72.09; 72.44.
Sup: 70.00; 69.17; 68.46; 67.86.