

Sample Category Title
AUD/USD Daily Report
Daily Pivots: (S1) 0.6494; (P) 0.6526; (R1) 0.6550; More...
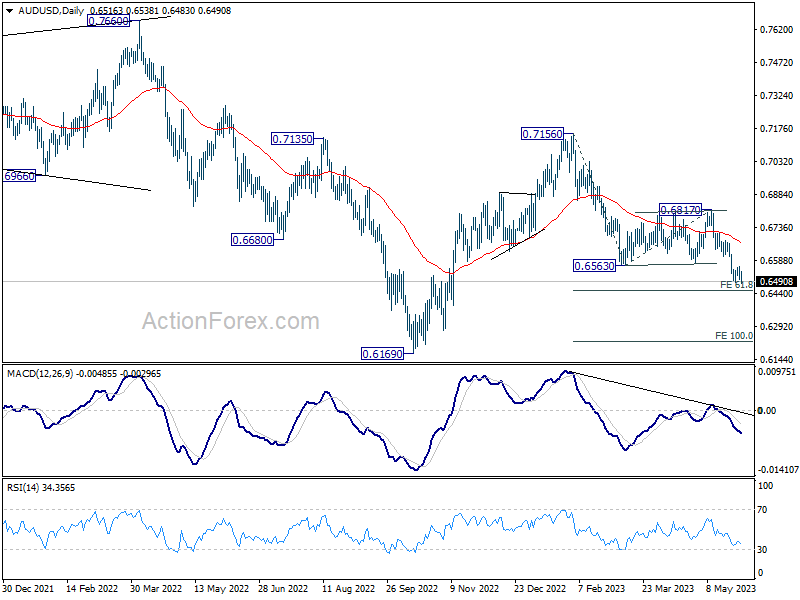
Intraday bias in AUD/USD is back on the downside with breach of 0.6489 temporary low. Current down trend from 0.7156 should target 61.8% projection of 0.7156 to 0.6563 from 0.6817 at 0.6451. Firm break there will target 100% projection at 0.6224. On the upside, however, break of 0.6558 resistance will now indicate short term bottoming, and turn bias back to the upside for stronger rebound.
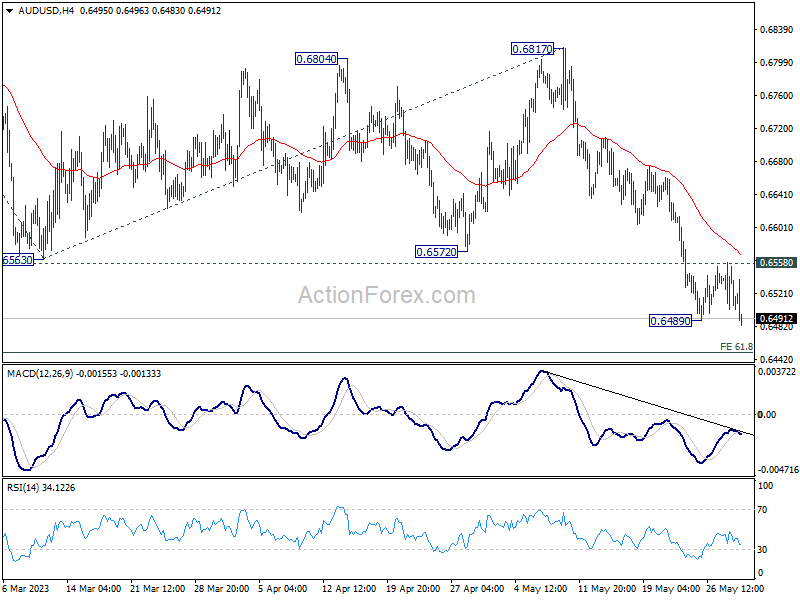
In the bigger picture, rejection by 55 W EMA (now at 0.6822) keeps medium term outlook bearish. Current development suggests that down trend from 0.8006 (2021 high) is possibly still in progress. Retest of 0.6169 (2022 low) should be seen next. Firm break there will confirm down trend resumption. For now, this will remain the favored case as long as 0.6817 resistance holds.
Poor China Data Knocks Down Asian Markets, Aussie and Kiwi Tumble
Asian stocks took a beating today as disappointing economic data from China put a damper on the region's markets. The bearish mood led to widespread selling of commodity currencies. Despite higher-than-expected CPI figures, Australian Dollar found little support, while an uptick in New Zealand business confidence did little to boost Kiwi.
As investors sought safe haven assets, Japanese Yen led the pack in a strong rebound, while Dollar also saw broad gains riding on the current risk-off sentiment. European majors displayed mixed performance with Sterling outperforming, extending its weekly rally against Euro and Swiss Franc.
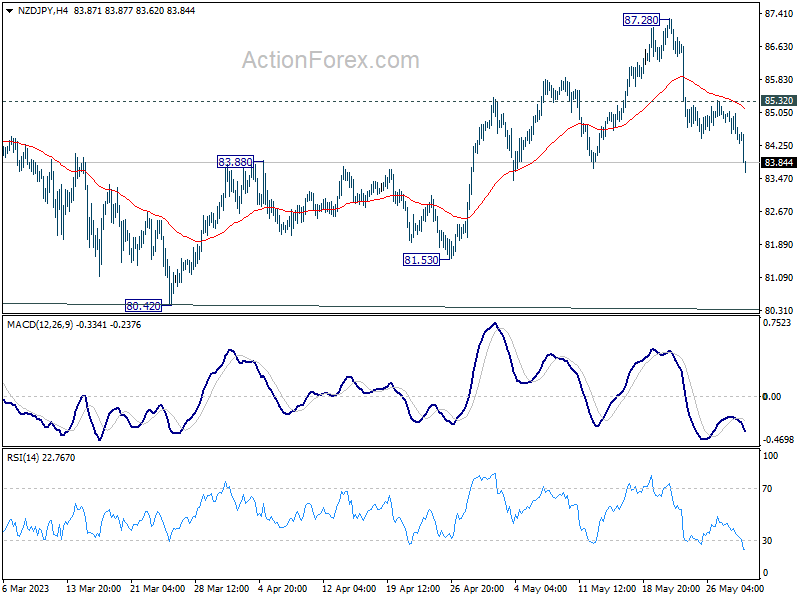
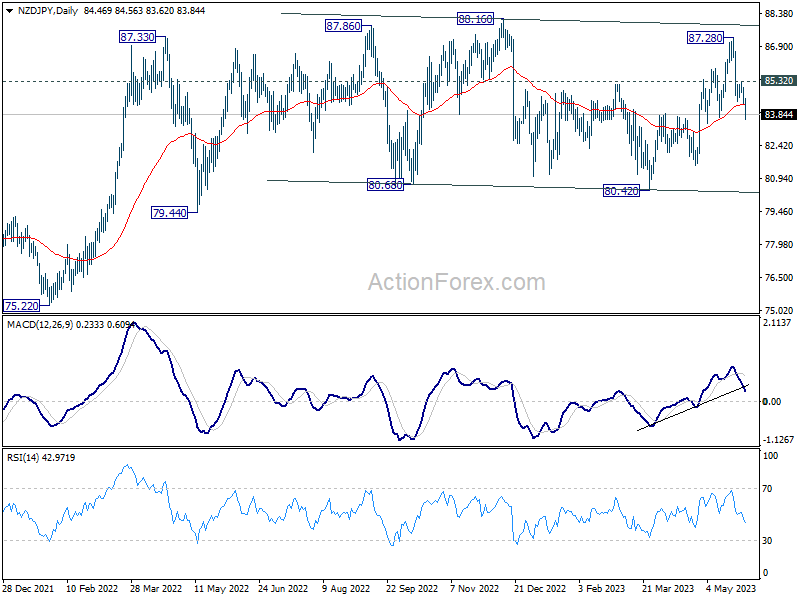
From a technical perspective, NZD/JPY's drop from 87.28 continued today, with sign of downside re-acceleration. This decline is viewed as a falling leg within the medium-term range pattern. Deeper fall is expected as long as 85.32 minor resistance level holds, aiming towards 81.53 support level and possibly further, to extend range trading.
In Asia, Nikkei closed down -1.41%. Hong Kong HSI is down -2.76%. China Shanghai SSE is down -0.86%. Singapore Strait Times is down -0.81%. Japan 10-year JGB yield is down -0.0031 at 0.433. Overnight, DOW dropped -0.15%. S&P 500 rose 0.00%. NASDAQ rose 0.32%. 10-year yield dropped -0.110 to 3.700.
China's manufacturing PMI slides to five-month low as economic recovery stumbles
China NBS PMI Manufacturing dropped from 49.2 to 48.8 in May, below expectation of 49.4. That's the lowest level in five months. New orders sub-index followed suit, slipping from 48.8 in April to 48.3 in May, while the new export orders sub-index descended from 47.6 to 47.2.
PMI Non-Manufacturing dropped from 56.4 to 54.5, below expectation of 54.9, lowest growth in four months. The official composite PMI, encapsulating both manufacturing and services activity, fell from 54.4 in April to 52.9 in May.
"China's economic-prosperity level has receded, and the foundation for recovery and development still needs to be consolidated," said NBS senior statistician Zhao Qinghe.
Japan industrial production down -0.4% mom in Apr, retail sales disappoint
Japan's industrial production experienced a contraction of -0.4% mom in April, a significantly worse result than expectation of 1.4% mom growth.
According to survey by the Ministry of Economy, Trade and Industry, manufacturers are forecasting an output increase of 1.9% in May and 1.2% in June. This rise is expected to be driven by an easing in parts shortages, which should lift production in transportation and production machinery.
Despite these projections, a METI official struck a more cautious note, stating, "The current production sentiment is still bearish due to ongoing concerns about the downturn in overseas economies."
Meanwhile, the country's retail sales also delivered disappointing results. They rose 5.0% yoy, falling short of the anticipated 7.1% yoy increase. On a month-on-month basis, retail sales contracted by -1.2% in April, reversing the 0.3% gain recorded in March.
Australia CPI jumped back to 6.8% yoy in Apr, ex-volatile items down to 6.5% yoy
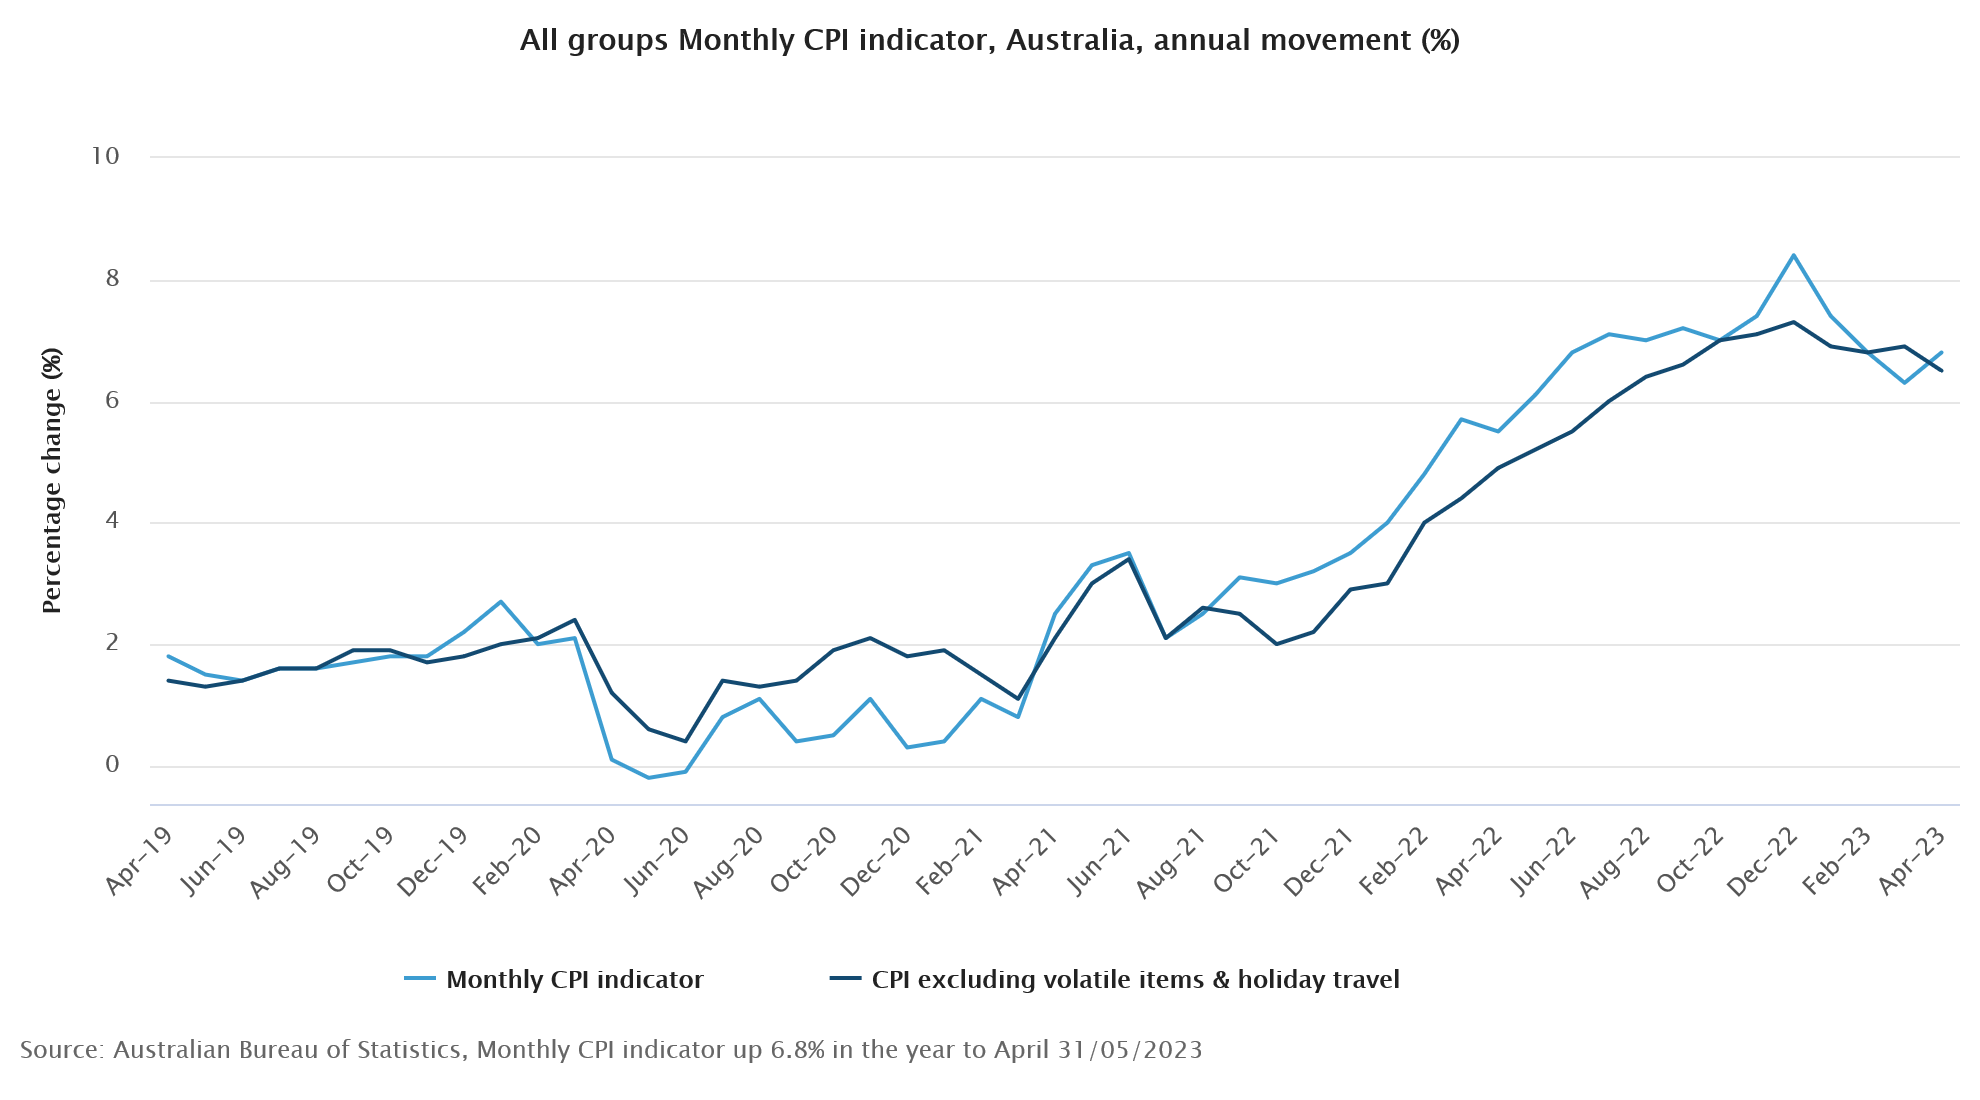
Australia monthly CPI jumped from 6.3% yoy to 6.8% yoy in April, well above expectation of 6.4% yoy. Excluding volatile items of automotive fuel, fruit and vegetables and holiday travel, CPI slowed from 6.9% yoy to 6.5% yoy.
Michelle Marquardt, ABS head of prices statistics, said: "It's important to note that a significant contributor to the increase in the annual movement in April was automotive fuel. The halving of the fuel excise tax in April 2022, which was fully unwound in October 2022, is impacting the annual movement for April 2023."
New Zealand ANZ business confidence rose to -31.1, RBNZ back at hike by year-end
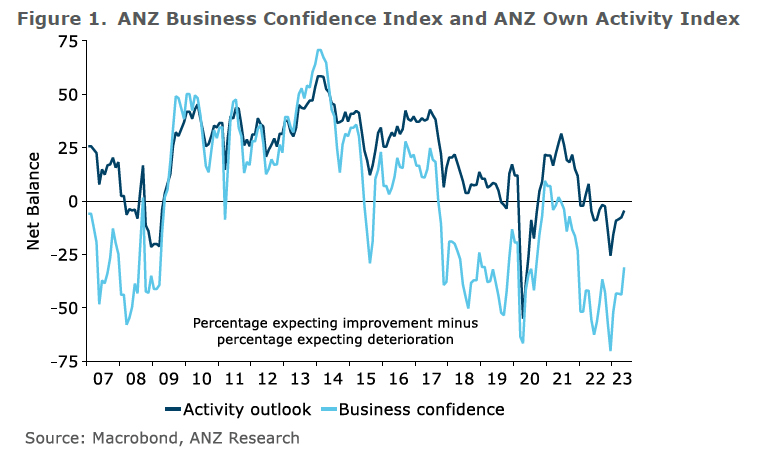
New Zealand's ANZ Business Confidence Index climbed from -43.8 to -31.1 in May, offering some positive news for the economy. Own Activity outlook also edged higher, moving from -7.6 to -4.5.
A more granular look at the data reveals that export intentions went up from -1.5 to 2.0, while investment intentions remained steady at -6.8. However, employment intentions slid from -2.4 to -5.7.
Pricing intentions dipped slightly from 53.7 to 52.4, while cost expectations barely shifted, coming down from 84.2 to 84.1. Profit expectations saw a significant uplift, rising from -37.7 to -27.4. Inflation expectations also moderated, falling from 5.70% to 5.47%.
ANZ commented on the findings, noting that while RBNZ may view the economy as broadly sluggish, the picture isn't entirely clear. In their words, "Things are patchy, certainly, but most activity indicators are well off their lows and rising, while cost and price indicators are inching lower, rather than plunging."
In light of these developments, ANZ continues to predict that RBNZ will resume rate hikes by the end of the year, potentially countering the additional stimulus from robust net migration and higher fiscal spending than anticipated. "We continue to expect that the RBNZ will be back at the hiking table by the end of the year."
Looking ahead
Swiss retail sales, France GDP, Germany unemployment and CPI flash will be featured in European session. Later in the data, Canada GDP will take center stage. Fed will publish Beige Book economic report.
AUD/USD Daily Report
Daily Pivots: (S1) 0.6494; (P) 0.6526; (R1) 0.6550; More...
Intraday bias in AUD/USD is back on the downside with breach of 0.6489 temporary low. Current down trend from 0.7156 should target 61.8% projection of 0.7156 to 0.6563 from 0.6817 at 0.6451. Firm break there will target 100% projection at 0.6224. On the upside, however, break of 0.6558 resistance will now indicate short term bottoming, and turn bias back to the upside for stronger rebound.
In the bigger picture, rejection by 55 W EMA (now at 0.6822) keeps medium term outlook bearish. Current development suggests that down trend from 0.8006 (2021 high) is possibly still in progress. Retest of 0.6169 (2022 low) should be seen next. Firm break there will confirm down trend resumption. For now, this will remain the favored case as long as 0.6817 resistance holds.
Economic Indicators Update
| GMT | Ccy | Events | Actual | Forecast | Previous | Revised |
|---|---|---|---|---|---|---|
| 23:50 | JPY | Industrial Production M/M Apr P | -0.40% | 1.40% | 1.10% | |
| 23:50 | JPY | Retail Trade Y/Y Apr | 5.00% | 7.10% | 7.20% | 6.90% |
| 01:00 | NZD | ANZ Business Confidence May | -31.1 | -43.8 | ||
| 01:30 | AUD | Monthly CPI Y/Y Apr | 6.80% | 6.40% | 6.30% | |
| 01:30 | AUD | Private Sector Credit M/M Apr | 0.60% | 0.30% | 0.30% | 0.20% |
| 01:30 | AUD | Construction Work Done Q1 | 1.80% | 0.60% | -0.40% | 1.00% |
| 01:30 | CNY | NBS Manufacturing PMI May | 48.8 | 49.4 | 49.2 | |
| 01:30 | CNY | Non-Manufacturing PMI May | 54.5 | 54.9 | 56.4 | |
| 05:00 | JPY | Housing Starts Y/Y Apr | -11.90% | -0.90% | -3.20% | |
| 05:00 | JPY | Consumer Confidence Index May | 36 | 36.1 | 35.4 | |
| 06:00 | EUR | Germany Import Price Index M/M Apr | -1.70% | -0.60% | -1.10% | |
| 06:30 | CHF | Real Retail Sales Y/Y Apr | -1.40% | -1.90% | ||
| 06:45 | EUR | France Consumer Spending M/M Apr | 0.30% | -1.30% | ||
| 06:45 | EUR | France GDP Q/Q Q1 | 0.20% | 0.20% | ||
| 07:55 | EUR | Germany Unemployment Change Apr | 15K | 24K | ||
| 07:55 | EUR | Germany Unemployment Rate Apr | 5.60% | 5.60% | ||
| 08:00 | CHF | Credit Suisse Economic Expectations May | -33.3 | |||
| 12:00 | EUR | Germany CPI M/M May P | 0.30% | 0.40% | ||
| 12:00 | EUR | Germany CPI Y/Y May P | 6.50% | 7.20% | ||
| 12:30 | CAD | GDP M/M Mar | -0.10% | 0.10% | ||
| 13:45 | USD | Chicago PMI May | 47.1 | 48.6 | ||
| 18:00 | USD | Fed's Beige Book |
China’s manufacturing PMI slides to five-month low as economic recovery stumbles
China NBS PMI Manufacturing dropped from 49.2 to 48.8 in May, below expectation of 49.4. That's the lowest level in five months. New orders sub-index followed suit, slipping from 48.8 in April to 48.3 in May, while the new export orders sub-index descended from 47.6 to 47.2.
PMI Non-Manufacturing dropped from 56.4 to 54.5, below expectation of 54.9, lowest growth in four months. The official composite PMI, encapsulating both manufacturing and services activity, fell from 54.4 in April to 52.9 in May.
"China's economic-prosperity level has receded, and the foundation for recovery and development still needs to be consolidated," said NBS senior statistician Zhao Qinghe.
Japan industrial production down -0.4% mom in Apr, retail sales disappoint
Japan's industrial production experienced a contraction of -0.4% mom in April, a significantly worse result than expectation of 1.4% mom growth.
According to survey by the Ministry of Economy, Trade and Industry, manufacturers are forecasting an output increase of 1.9% in May and 1.2% in June. This rise is expected to be driven by an easing in parts shortages, which should lift production in transportation and production machinery.
Despite these projections, a METI official struck a more cautious note, stating, "The current production sentiment is still bearish due to ongoing concerns about the downturn in overseas economies."
Meanwhile, the country's retail sales also delivered disappointing results. They rose 5.0% yoy, falling short of the anticipated 7.1% yoy increase. On a month-on-month basis, retail sales contracted by -1.2% in April, reversing the 0.3% gain recorded in March.
Australia CPI jumped back to 6.8% yoy in Apr, ex-volatile items down to 6.5% yoy
Australia monthly CPI jumped from 6.3% yoy to 6.8% yoy in April, well above expectation of 6.4% yoy. Excluding volatile items of automotive fuel, fruit and vegetables and holiday travel, CPI slowed from 6.9% yoy to 6.5% yoy.
Michelle Marquardt, ABS head of prices statistics, said: "It's important to note that a significant contributor to the increase in the annual movement in April was automotive fuel. The halving of the fuel excise tax in April 2022, which was fully unwound in October 2022, is impacting the annual movement for April 2023."
New Zealand ANZ business confidence rose to -31.1, RBNZ back at hike by year-end
New Zealand's ANZ Business Confidence Index climbed from -43.8 to -31.1 in May, offering some positive news for the economy. Own Activity outlook also edged higher, moving from -7.6 to -4.5.
A more granular look at the data reveals that export intentions went up from -1.5 to 2.0, while investment intentions remained steady at -6.8. However, employment intentions slid from -2.4 to -5.7.
Pricing intentions dipped slightly from 53.7 to 52.4, while cost expectations barely shifted, coming down from 84.2 to 84.1. Profit expectations saw a significant uplift, rising from -37.7 to -27.4. Inflation expectations also moderated, falling from 5.70% to 5.47%.
ANZ commented on the findings, noting that while RBNZ may view the economy as broadly sluggish, the picture isn't entirely clear. In their words, "Things are patchy, certainly, but most activity indicators are well off their lows and rising, while cost and price indicators are inching lower, rather than plunging."
In light of these developments, ANZ continues to predict that RBNZ will resume rate hikes by the end of the year, potentially countering the additional stimulus from robust net migration and higher fiscal spending than anticipated. "We continue to expect that the RBNZ will be back at the hiking table by the end of the year."
Nasdaq 100 Technical: Exhaustion at key resistance
Nasdaq 100 Technical: Exhaustion at key resistance
- The outperformer Nasdaq 100 seems to have hit a roadblock/resistance at around 14,380.
- Price actions formed a daily bearish “Gravestone Doji” candlestick right at the upper boundary of the “Ascending Wedge” configuration.
- 14,380 key graphical resistance confluences with the 61.8% Fibonacci retracement of the prior major downtrend from 22 November 2021 all-time high to 13 October 2022 low.
Fig 1: US Nas 100 daily trend as of 31 May 2023 (Source: TradingView, click to enlarge chart)
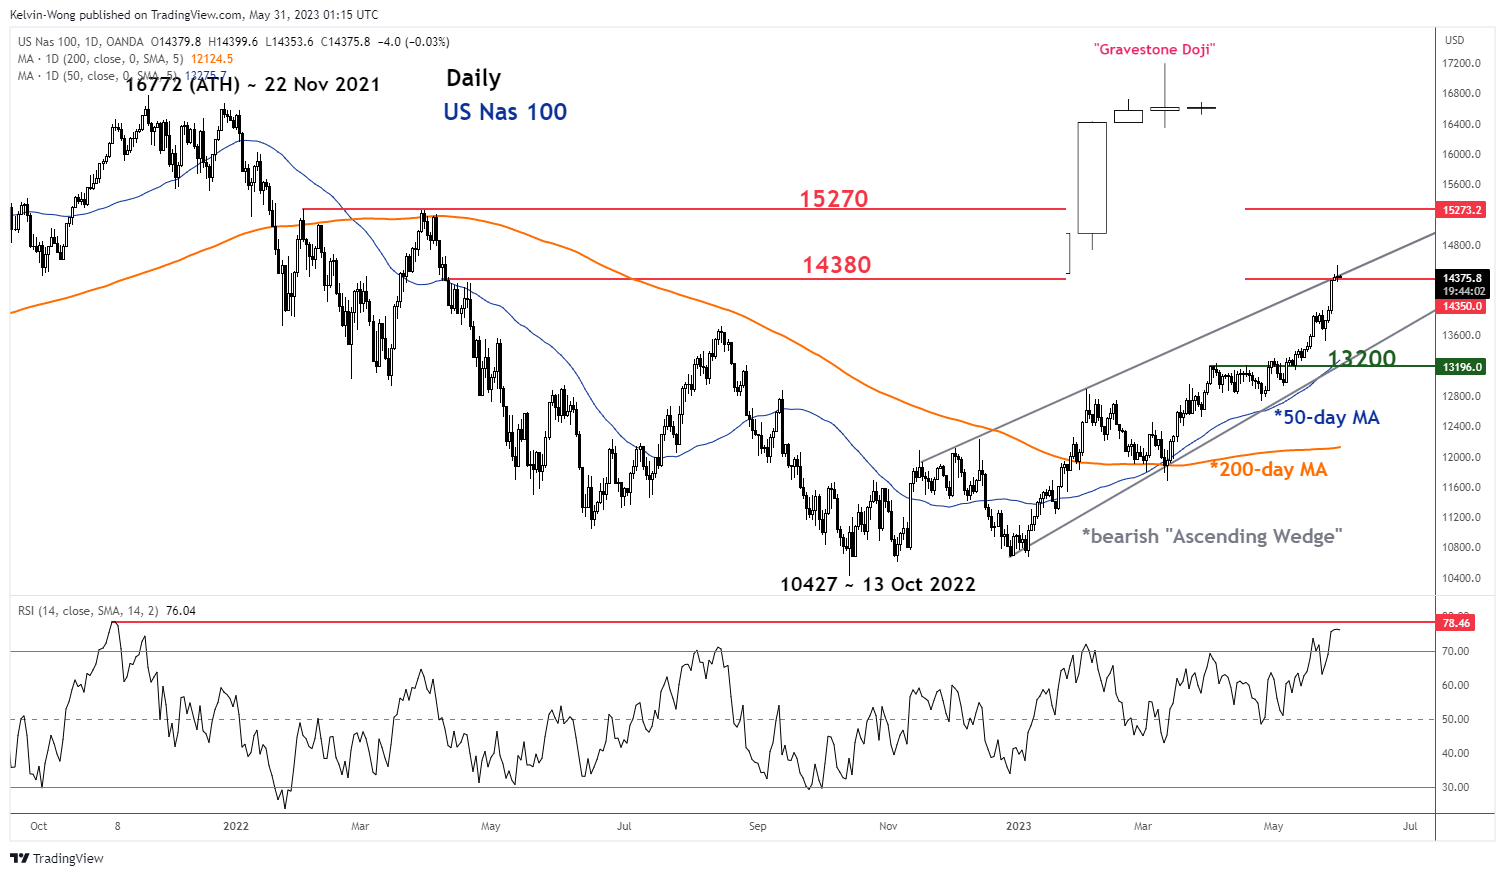
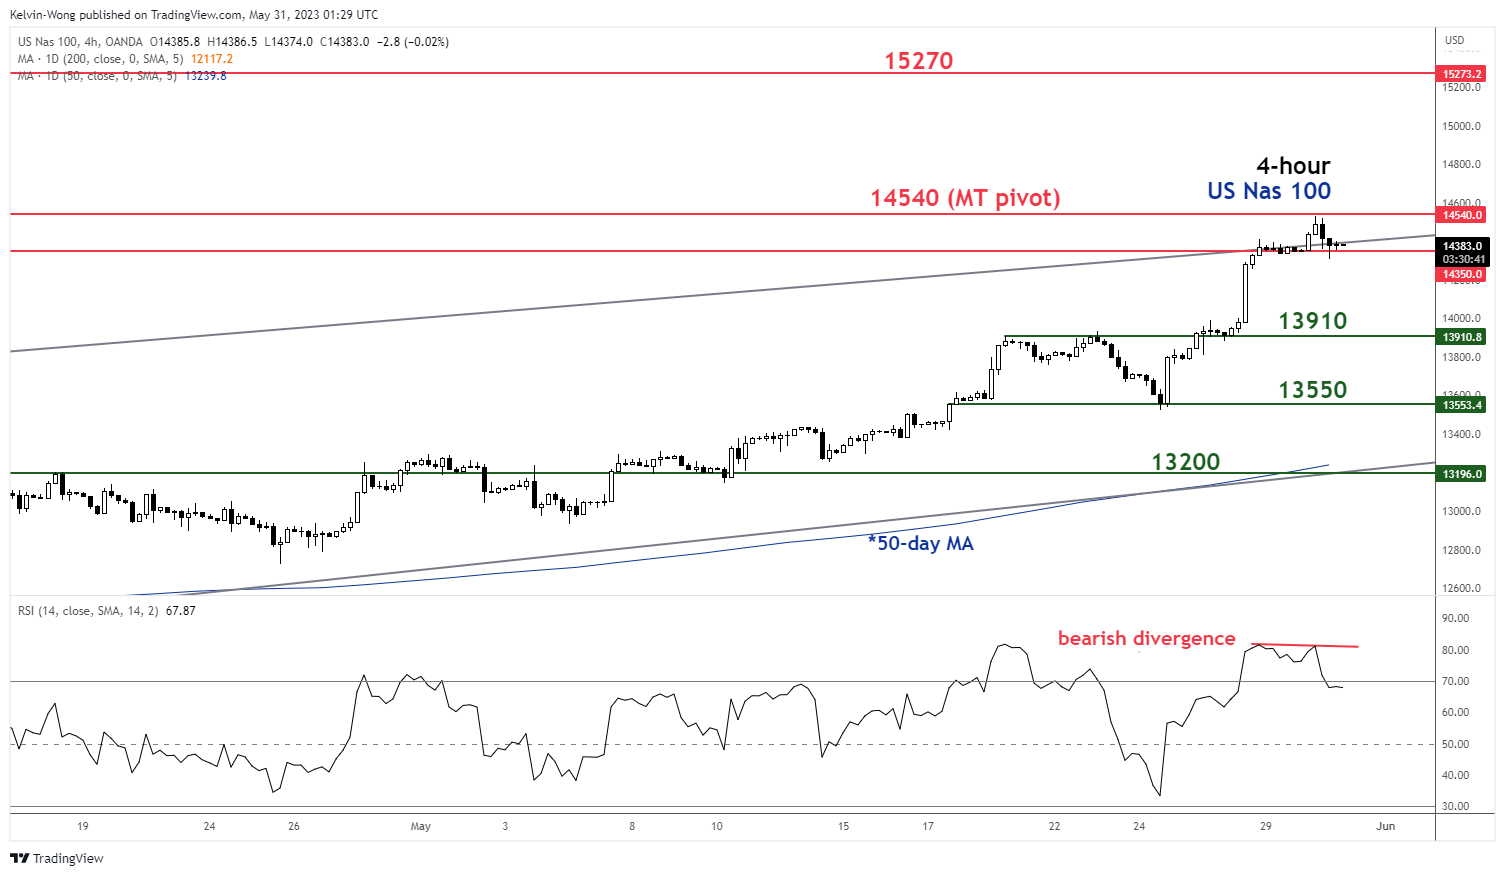
Fig 2: US Nas 100 4-hour trend as of 31 May 2023 (Source: TradingView, click to enlarge chart)
The US Nas 100 Index (a proxy for the Nasdaq 100 futures) has staged a stellar up move seen in the past four weeks where it rallied by +24.50% from its 13 March 2023 minor swing low of 11,676 to yesterday, 30 May high of 14,533; outperformed the other major US benchmark stock indices (S&P 500, Dow Jones Industrial Average & Russell 2000) by a wide margin.
Bearish elements have been sighted at around a key resistance level
Interestingly, this steep up move has reached a key resistance level at around 14,380 which is defined by a confluence of elements; the upper boundary of the medium-term bearish “Ascending Wedge” configuration in place since 28 December 2022 low and the 61.8% Fibonacci retracement of the prior major down move from 22 November 2022 all-time high to 13 October 2022 low.
In addition, several exhaustion elements have emerged as well as the price actions of the Index hit the 14,380 key resistance level. Yesterday, it formed a daily bearish “Gravestone Doji” candlestick pattern coupled with an overbought bearish divergence signal seen on its lower time frame, 4-hour RSI oscillator.
At the risk of a potential mean reversion decline
These observations suggest that the up move from the 13 March 2023 low has started to lose bullish momentum where the odds have increased for a potential mean reversion decline in the first step.
Key medium-term pivotal resistance will be at 14,540 (an excess above 14,380) with near-term supports coming in at 13,910 followed by 13,550.
On the flip side, a clearance above 14,540 sees the next resistance at 15,270 (76.4% Fibonacci retracement of the prior major down move from the 22 November 2022 all-time high to the 13 October 2022 low & swing highs of 2 February/30 March 2022).
Technical Outlook and Review
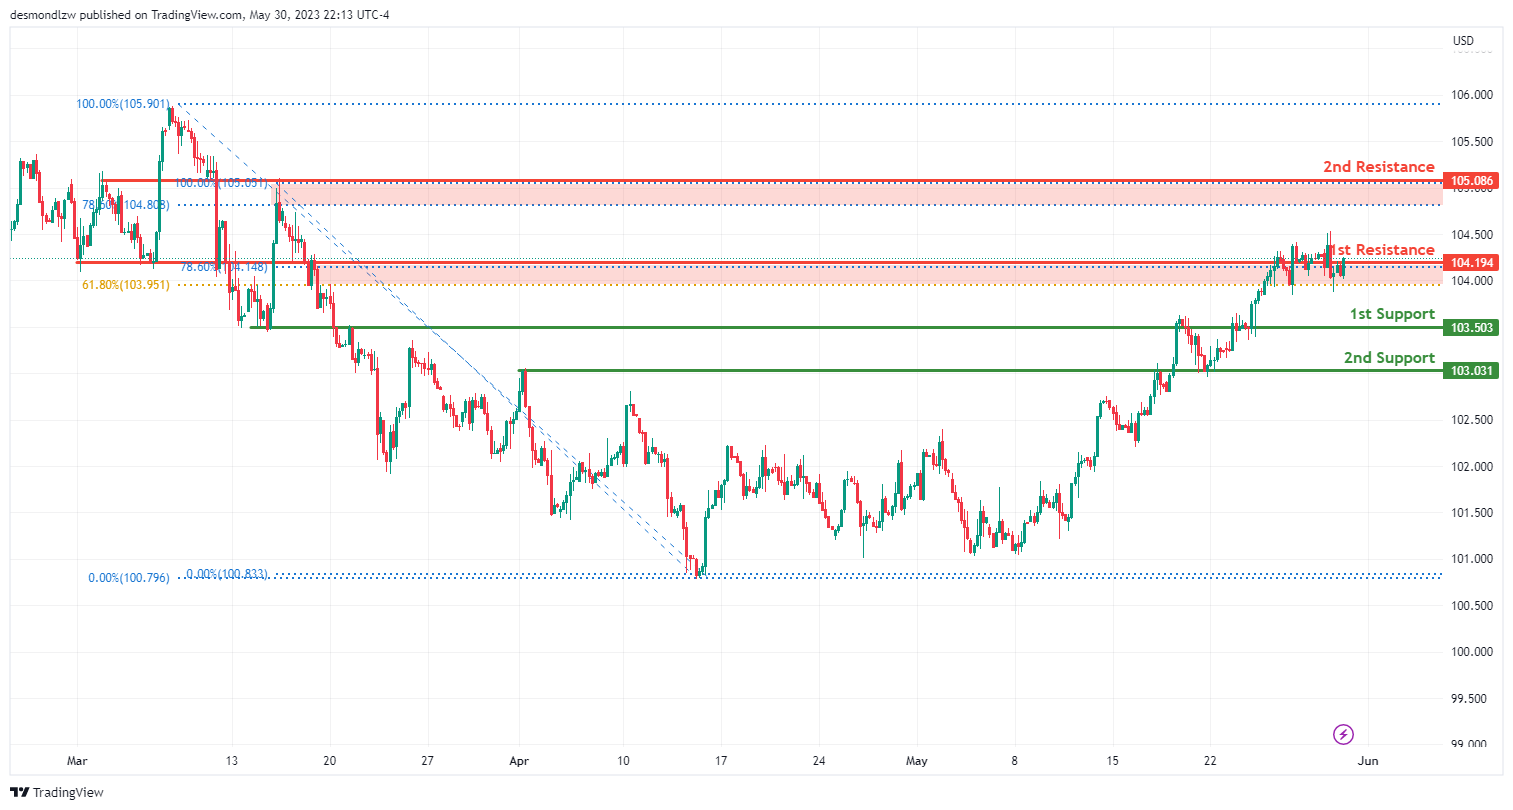
DXY:
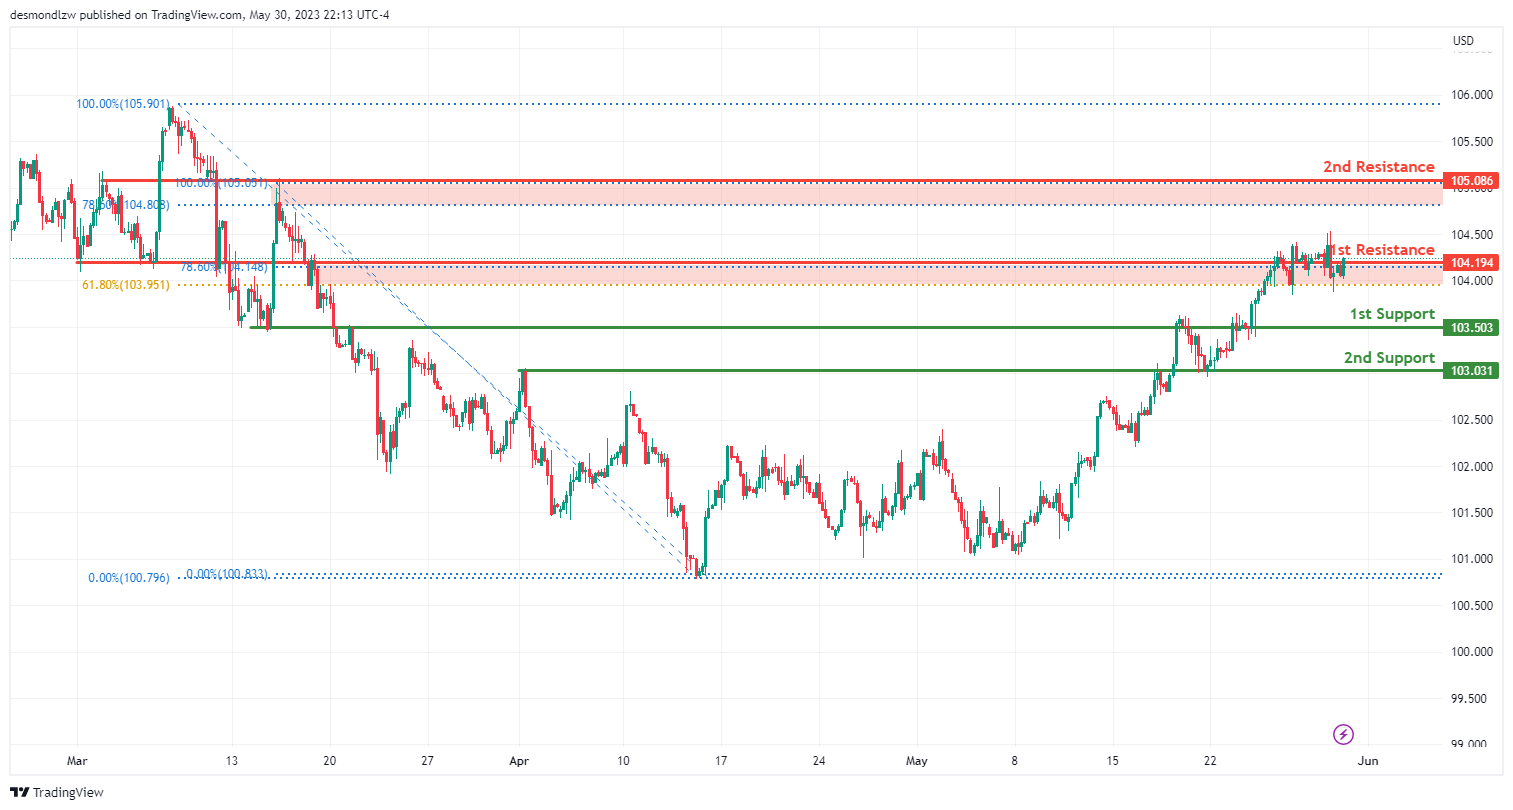
The Dollar Index (DXY) currently shows bullish momentum with potential for a bullish breakthrough of the first resistance, possibly rising to the second resistance. The first support level is at 103.50, serving as an overlap support. A second support level stands at 103.03, also recognized as an overlap support. On the resistance side, the first resistance level is at 104.19. This pullback resistance level aligns with both 61.80% and 78.60% Fibonacci retracements, a scenario known as Fibonacci confluence. Further, the second resistance level is at 105.08, serving as an overlap resistance and the 78.60% Fibonacci retracement level.
EUR/USD:
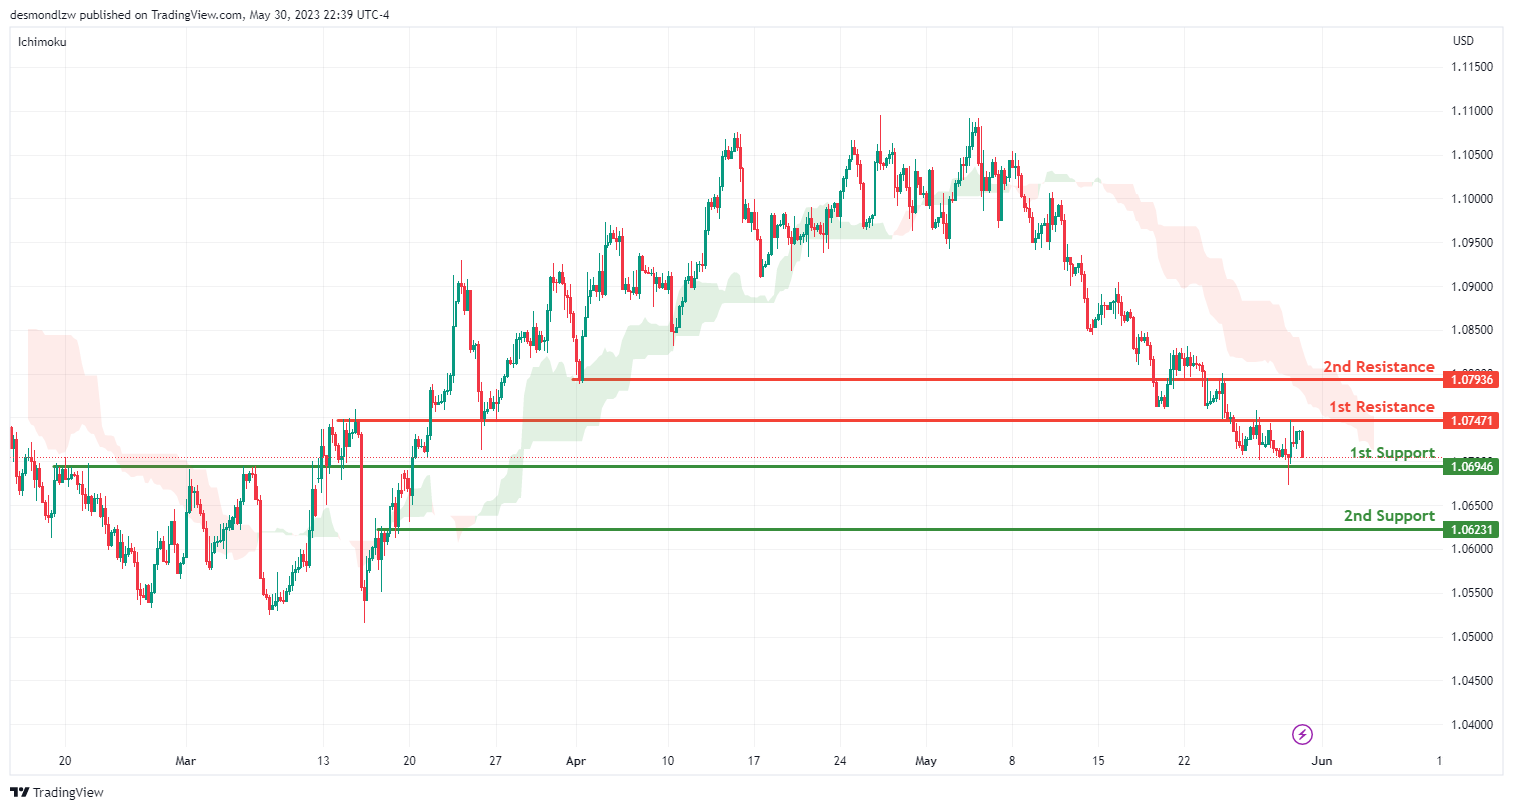
The EUR/USD pair is currently showing bearish momentum, with the price being below the bearish Ichimoku cloud contributing to this momentum. The price could potentially make a bearish break off the first support and drop towards the second support.
The first support is at 1.0694 and is deemed favorable due to it being an overlap support. The second support is at 1.0623 and is also an overlap support, making it a significant level to monitor.
On the flip side, the first resistance level is at 1.0747, acting as an overlap resistance. This might pose challenges to any potential upward price movement. Similarly, the second resistance is at 1.0793, which is another overlap resistance that could potentially prevent the price from rising further.
GBP/USD:
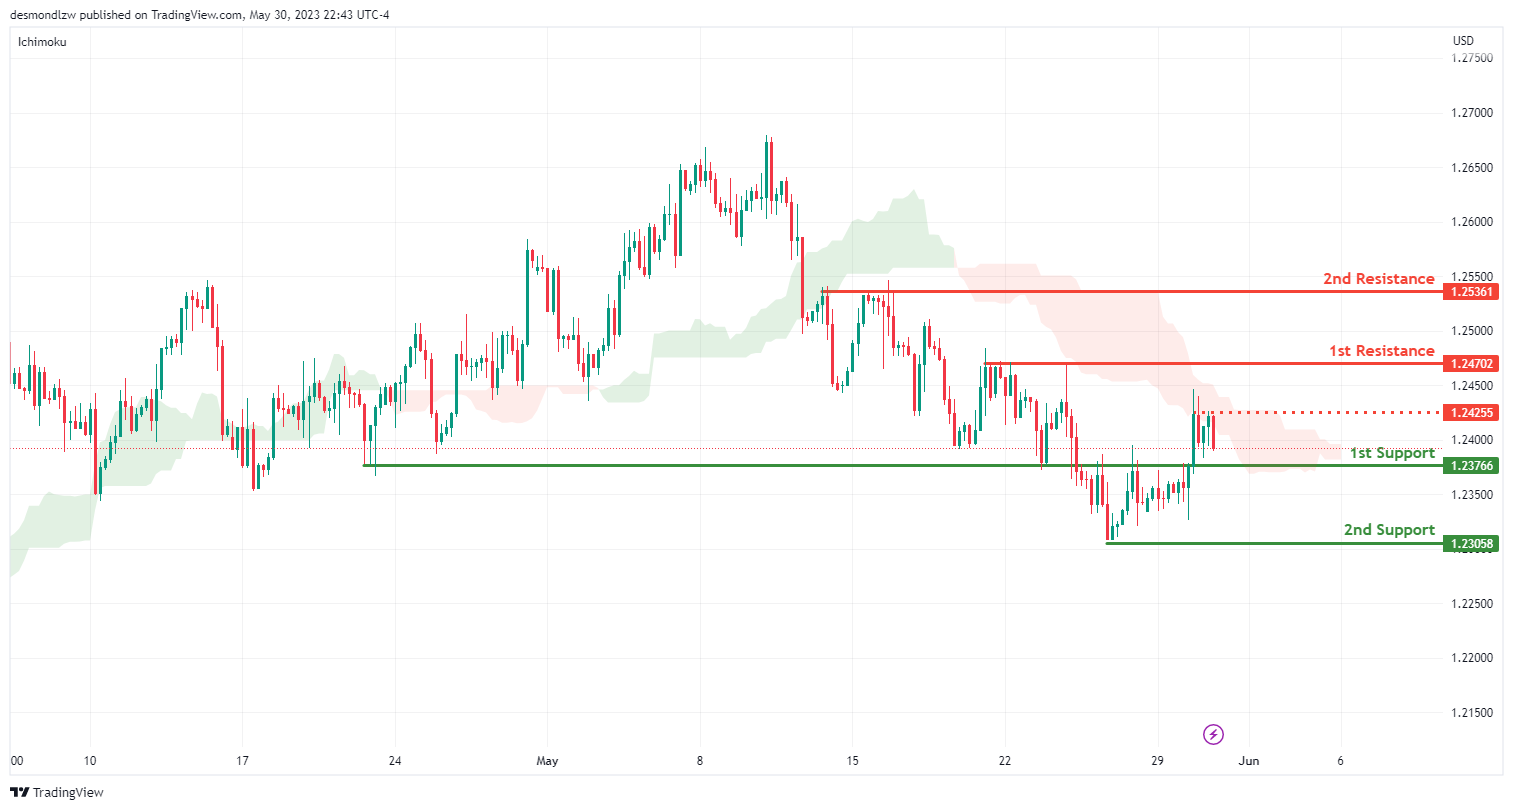
The GBP/USD pair is currently showing bearish momentum, with the price being below the bearish Ichimoku cloud contributing to this downward momentum. The price might potentially follow a bearish continuation towards the first support.
The first support is at 1.2376, which is an overlap support, a level significant in the market structure. The second support is at 1.2305 and acts as a swing low support, which could potentially attract buyers in the market.
In contrast, the first resistance level is at 1.2470. This level serves as a multi-swing high resistance and could potentially pose challenges to any potential upward price movement. Similarly, the second resistance is at 1.2536, which also serves as a multi-swing high resistance and might prevent the price from rising further.
Moreover, there’s an intermediate resistance level at 1.2425, representing another multi-swing high resistance, suggesting that it could act as a significant barrier to price increases.
USD/CHF:
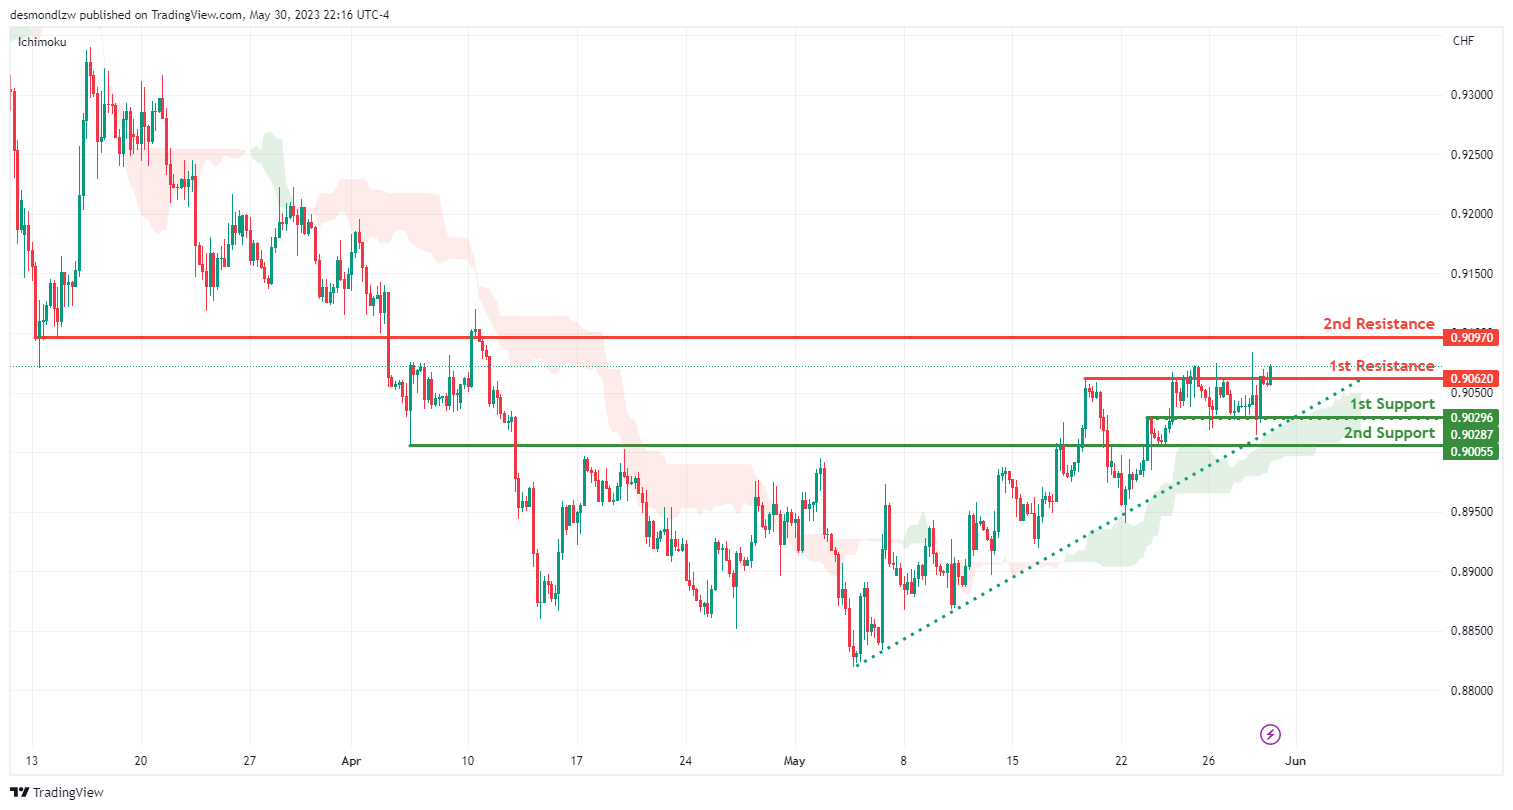
The USD/CHF pair is currently demonstrating strong bullish momentum with high confidence. The price being above the bullish Ichimoku cloud and a significant ascending trendline suggests further bullish momentum could be anticipated.
The first level of support is at 0.9029. This point serves as an overlap support, which could potentially attract buyers into the market, preventing the price from falling further.
If the price breaks below this level, the second line of support is at 0.9005. This level is an overlap support and could serve as a strong buy zone to prevent the price from declining further.
On the upside, the first resistance level is at 0.9062, acting as a multi-swing high resistance. If the bullish momentum continues, and the price manages to break above this resistance, further upward movement could be expected.
The second resistance is located at 0.9097, serving as an overlap resistance. This resistance might be significant, as sellers previously found this level attractive enough to cause a price reversal.
USD/JPY:
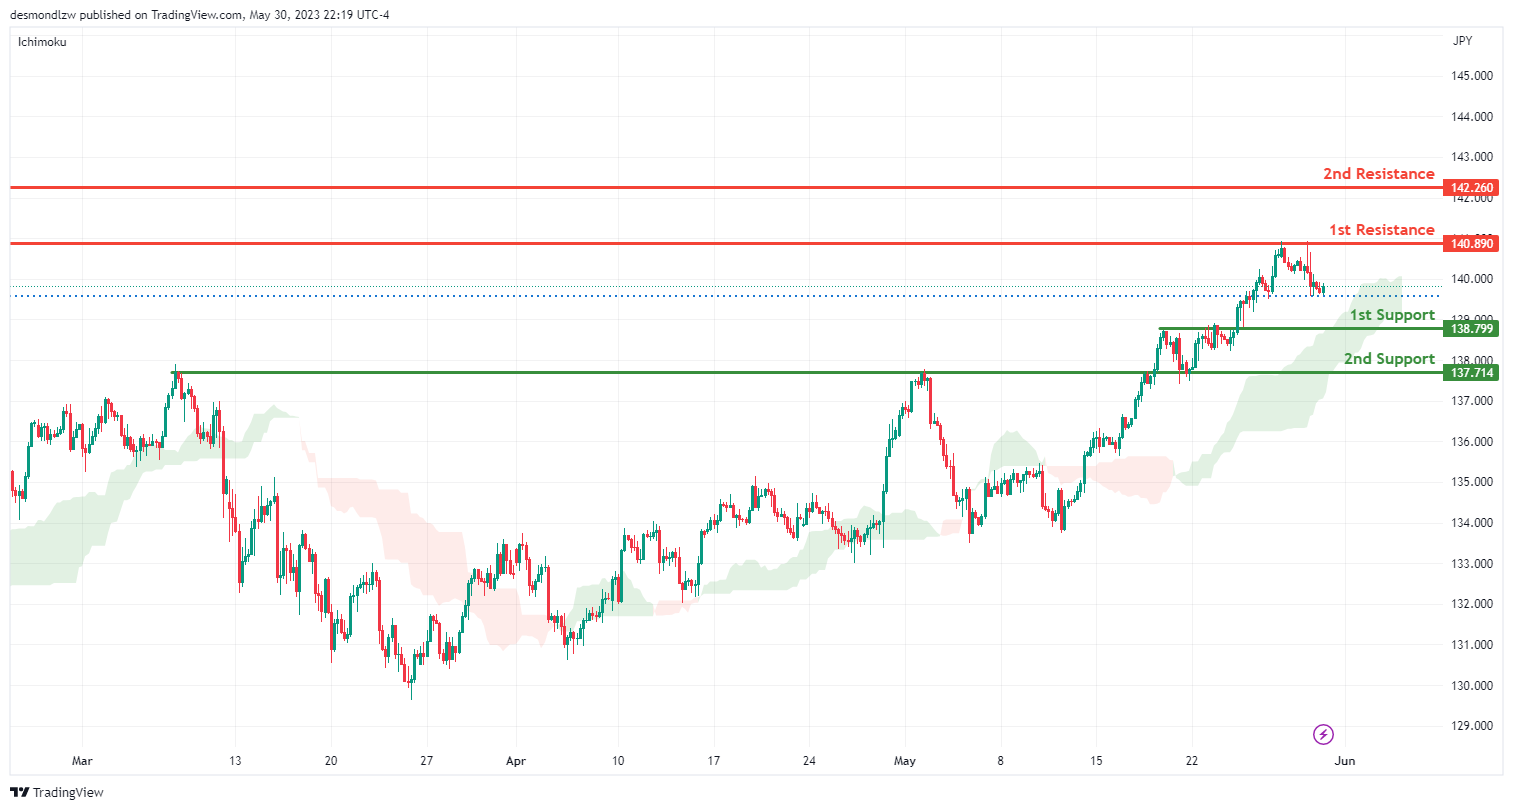
The USD/JPY pair is currently demonstrating bullish momentum, with the price being above the bullish Ichimoku cloud indicating further bullish momentum could be anticipated.
In the short term, the price might drop further towards the first support level at 138.79. This point, serving as an overlap support, could attract buyers into the market, preventing the price from falling further and potentially instigating a bullish bounce.
If the price breaks below this level, the second line of support is at 137.71. This level is also an overlap support, and could serve as a strong buy zone to prevent the price from declining further.
On the upside, the first resistance level is at 140.89, acting as a pullback resistance. If the bullish momentum continues and the price manages to bounce off the support and break above this resistance, further upward movement could be expected.
The second resistance is located at 142.26, serving as a swing high resistance. This resistance might be significant, as sellers previously found this level attractive enough to cause a price reversal.
USD/CAD:
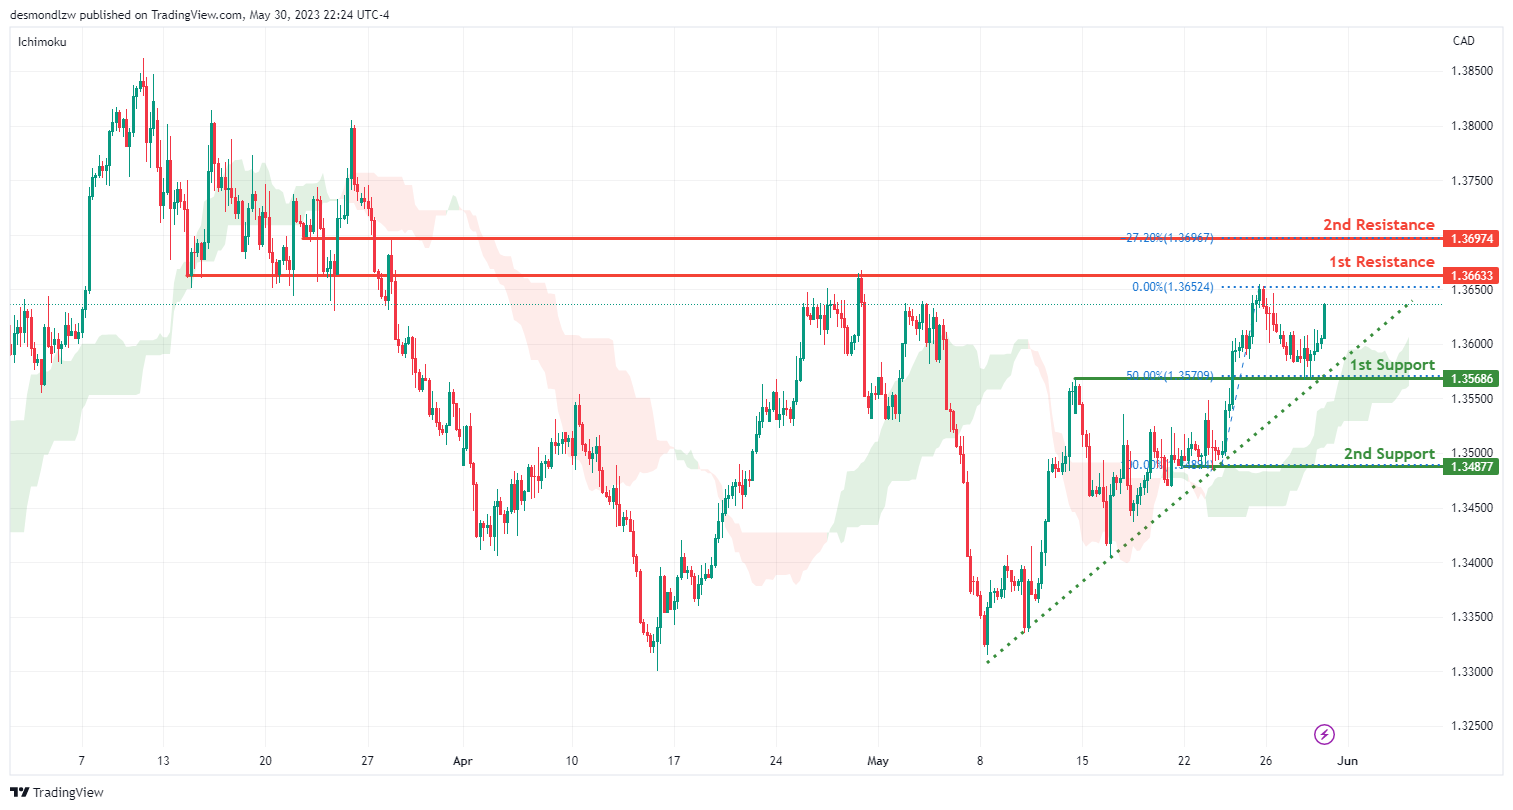
The USD/CAD chart currently shows a bullish trend, supported by the price being above the bullish Ichimoku cloud and a major ascending trendline, indicating potential for further bullish momentum.
The first support level is at 1.3568, characterized as an overlap support and aligns with the 50% Fibonacci retracement level, indicating its significance. The second support level is at 1.3487, which is identified as a multi-swing low support, bolstering its potential to uphold price movements.
There’s a likelihood for a bullish continuation towards the first resistance level at 1.3663, which serves as an overlap resistance. The second resistance level at 1.3697 is also characterized as an overlap resistance and corresponds to the -27% Fibonacci expansion, further reinforcing its potential as a resistance area.
AUD/USD:
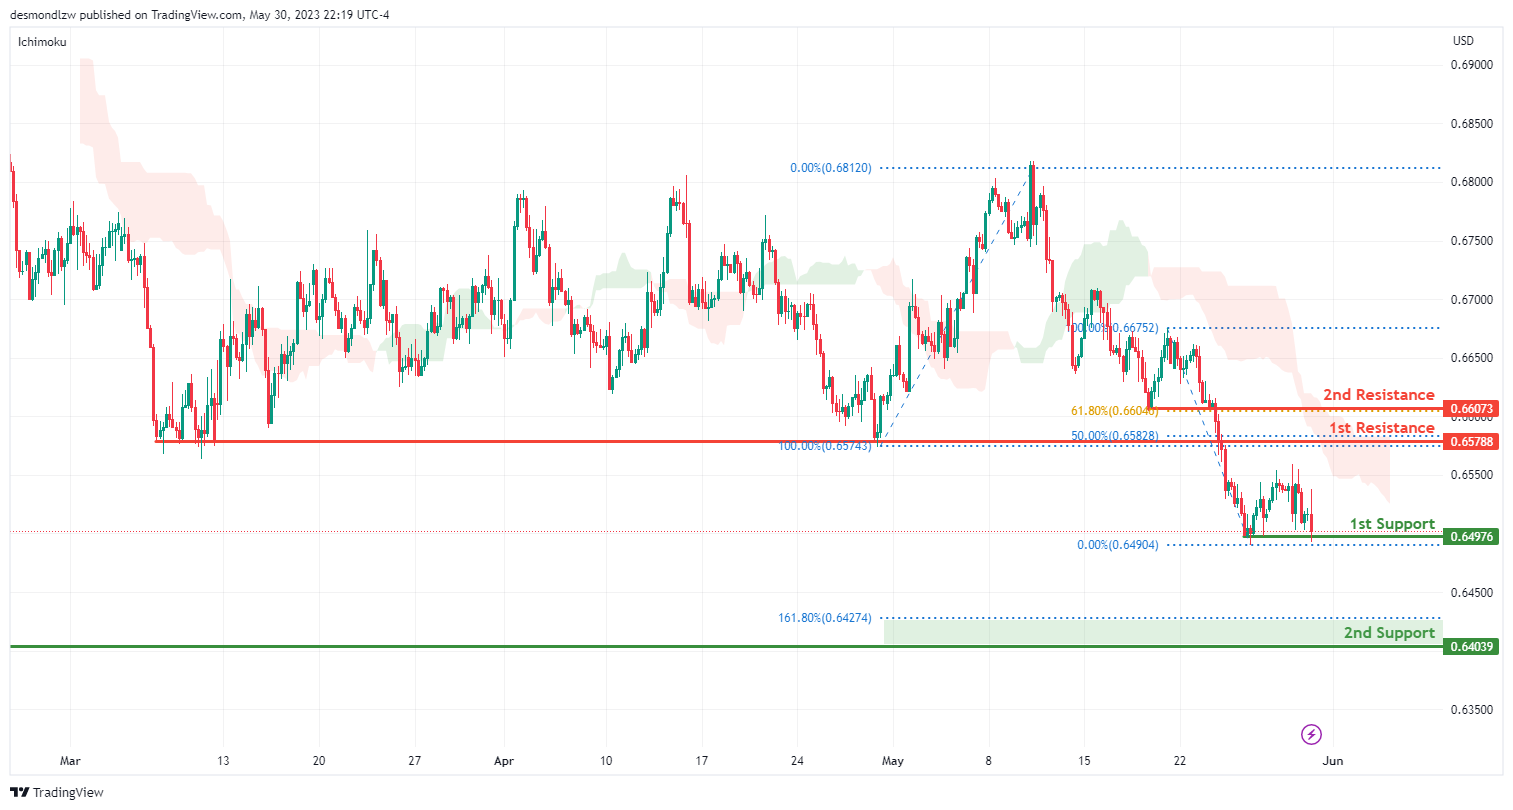
The AUD/USD chart currently displays a bearish trend, indicated by the price being below a major descending trend line and the bearish Ichimoku cloud, suggesting possible continuation of the bearish momentum.
The first support level is at 0.6497, identified as a multi-swing low support, suggesting it could act as a floor for price movements. The second support level at 0.6403, defined as a swing low support, is also of note due to its alignment with the 161.80% Fibonacci extension, further reinforcing its potential as a support area.
There’s a potential for a bearish break off the first support and a drop towards the second support. If a reversal happens, the first resistance level to consider is at 0.6578, which serves as a pullback resistance and aligns with the 50% Fibonacci retracement. The second resistance at 0.6607, defined as an overlap resistance, aligns with the 61.80% Fibonacci retracement, reinforcing its potential to limit upward movements.
NZD/USD
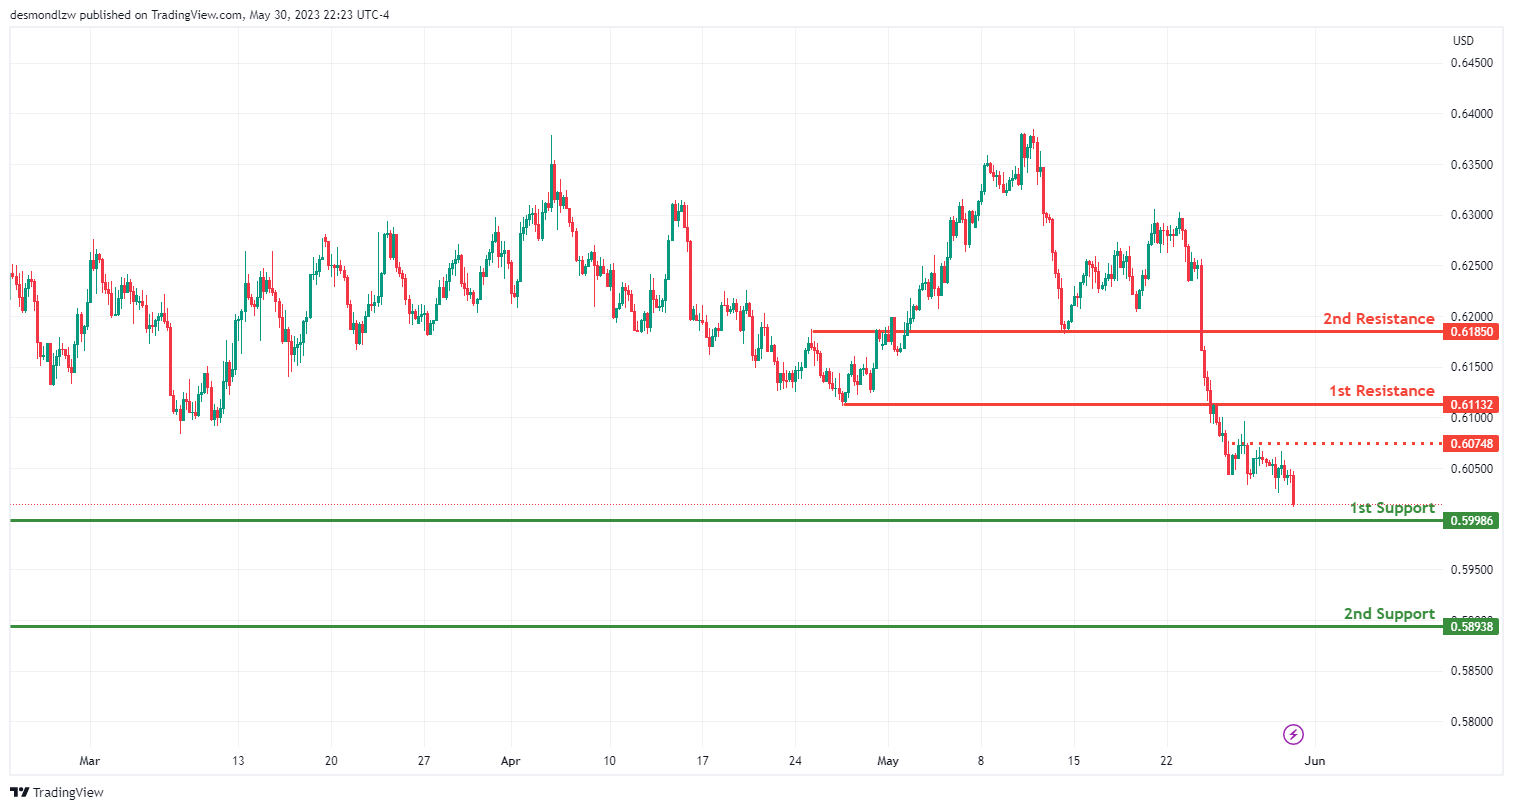
The NZD/USD chart currently exhibits a bearish momentum, suggesting a potential continuation of the downward trend.
The first support level is at 0.5998, identified as a pullback support, which could act as a floor for price movements. The second support level is at 0.5893, also recognized as a pullback support, further reinforcing its potential as a support area.
In the scenario of a bearish continuation, the price might move towards the first support. However, if a reversal occurs, the first resistance level to consider is at 0.6113, which serves as a pullback resistance. There’s also an intermediate resistance level at 0.6078, identified as a pullback resistance, which could potentially act as a barrier for price movements. The second resistance level is at 0.6185, also recognized as a pullback resistance, further adding strength to its potential as a price ceiling.
DJ30:
The DJ30 chart is currently exhibiting a bearish momentum, suggesting a potential continuation of the downward trend.
The first support level is at 32945.92, identified as a pullback support, which aligns with the 50% Fibonacci retracement level. This implies that the level may serve as a significant area where buyers could enter the market.
The second support level is at 32711.64, identified as a multi-swing low support, which aligns with the 78.60% Fibonacci retracement level, further supporting its potential as a strong floor for price movements.
In the scenario of a bearish continuation, the price might break off the first support and drop towards the second support.
On the flip side, if a reversal occurs, the first resistance level to watch is 33227.44, an overlap resistance. The second resistance level is at 33458.57, also recognized as an overlap resistance and aligns with the 78.60% Fibonacci retracement level, providing a significant potential price ceiling.
GER30:
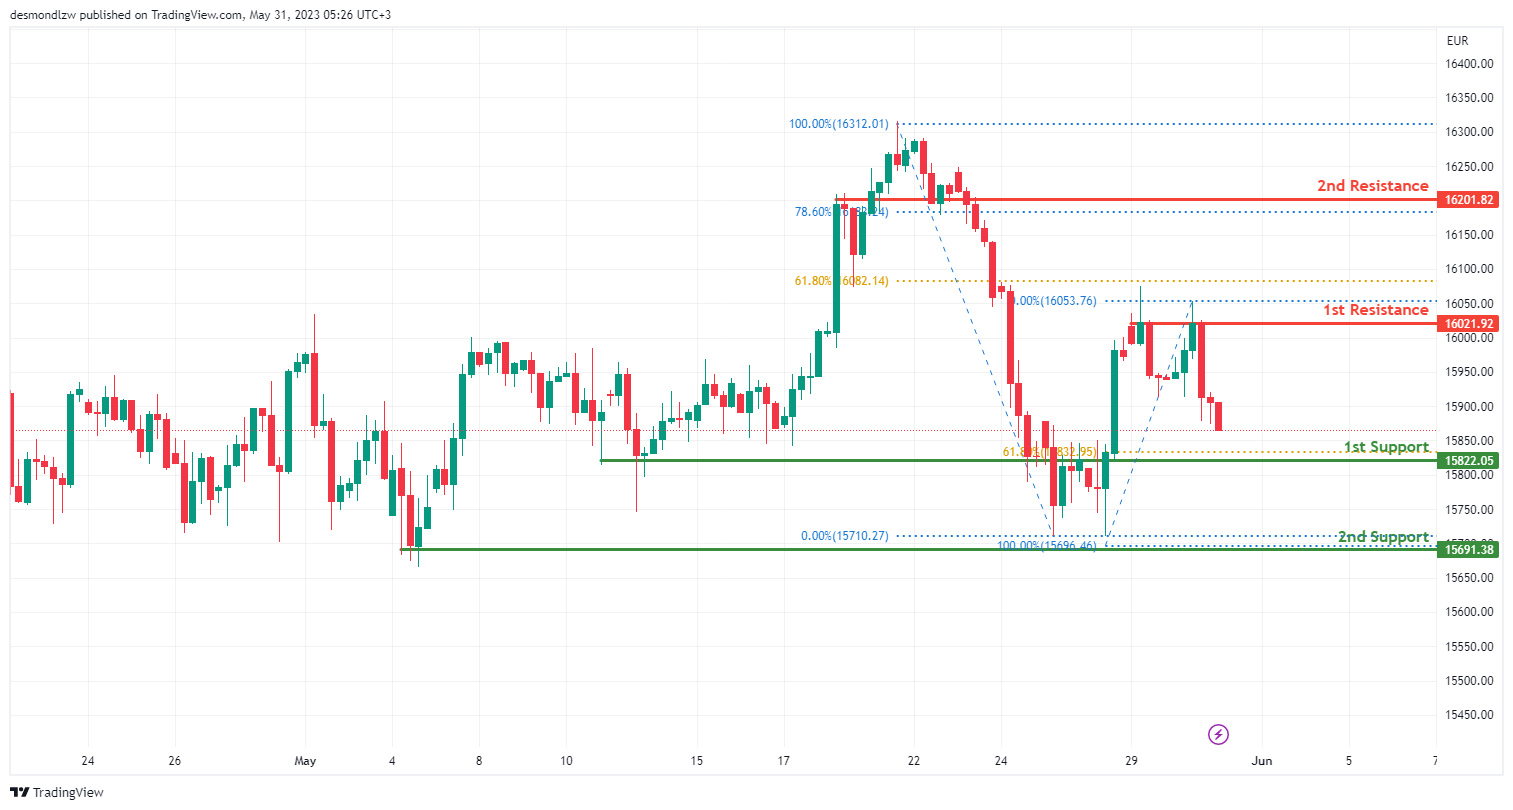
The GER30 chart is currently exhibiting a bearish momentum, indicating a potential continuation of the downward trend.
The first support level at 15822.05 serves as a significant area of pullback support, aligning with the 61.80% Fibonacci retracement level. This level has historical significance, serving as a potential floor for price movements.
The second support level at 15691.38 is identified as a multi-swing low support, further reinforcing its potential as a key support area.
In the event of a bearish continuation, the price might move towards these support levels.
On the resistance side, the first resistance level at 16021.92 is a multi-swing high resistance. This could act as a temporary ceiling to price movements, potentially causing a pause or retracement in the bearish trend.
The second resistance level at 18201.82 is identified as an overlap resistance and aligns with the 78.60% Fibonacci retracement, adding further credibility to its potential as a resistance area.
US500
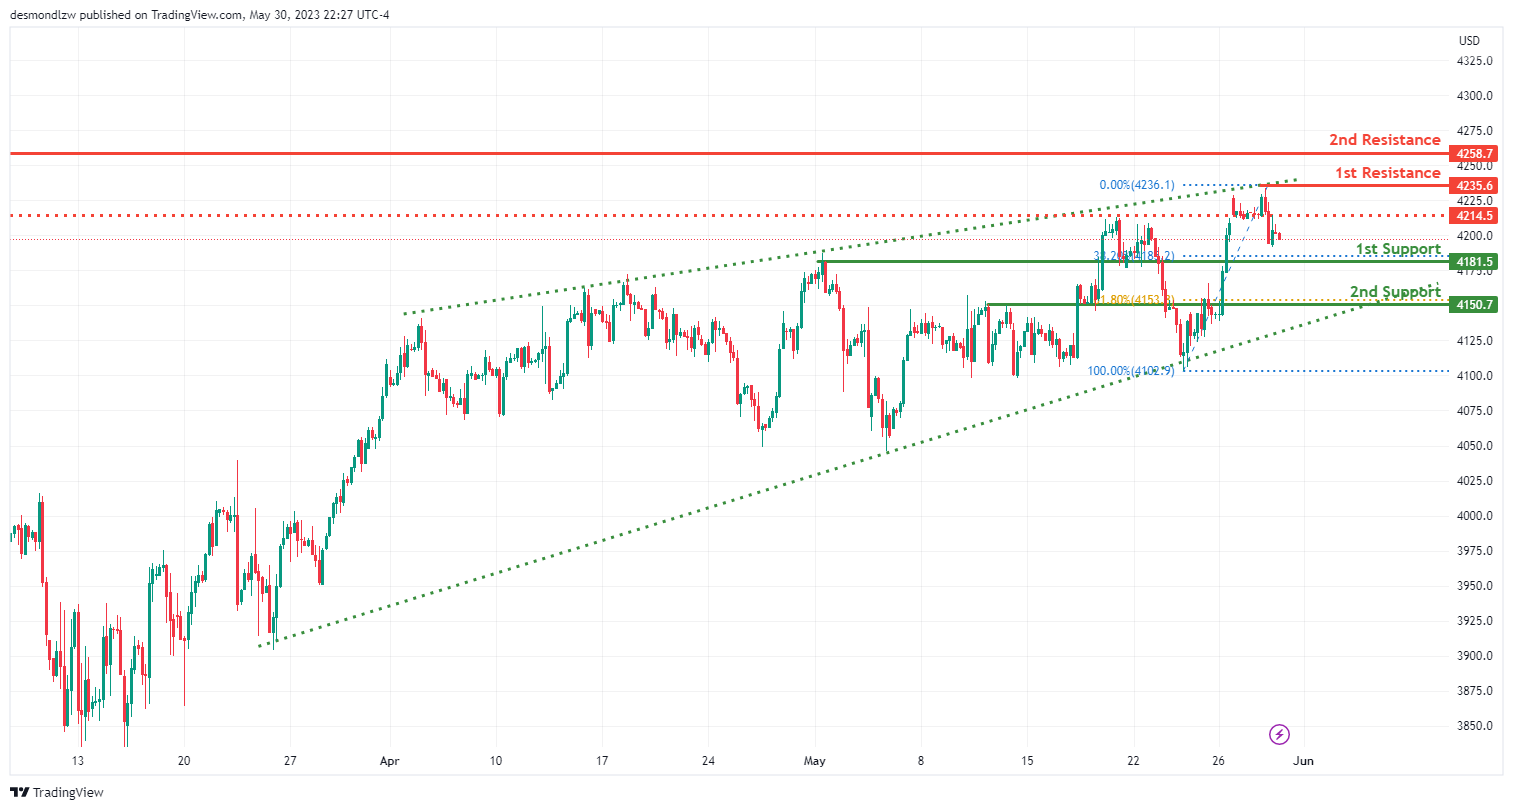
The US500 chart is currently showing a bearish trend, suggesting a possible continuation of the downward movement. A bearish rising wedge pattern further signals potential future declines.
The first support level is at 4181.5, identified as a pullback support and aligns with the 38.20% Fibonacci retracement. This level has historical significance, acting as a potential floor for the price action.
The second support level is at 4150.70. This pullback support aligns with the 61.80% Fibonacci retracement, adding further strength to its potential as a critical support area.
If the bearish trend continues, the price could move towards these support levels.
On the resistance side, the first resistance level is at 4235.60, which has been identified as a swing high resistance. This level could temporarily halt upward price movements, potentially causing a pause or retracement in the bearish trend.
The second resistance is at 4258.70, which is also a swing high resistance. An intermediate resistance is also identified at 4241.50, acting as a pullback resistance.
BTC/USD:
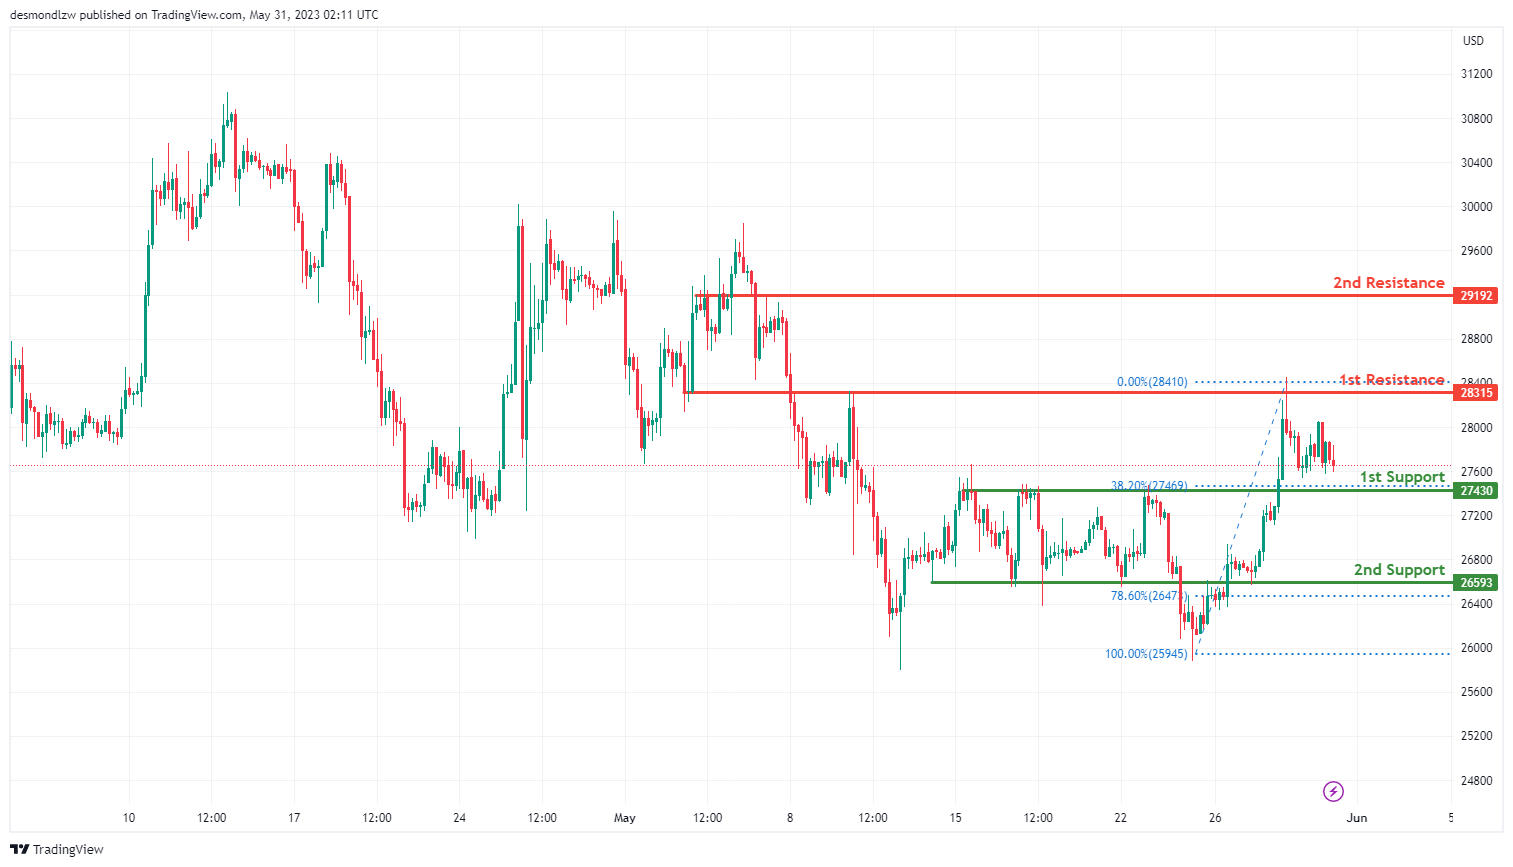
The BTC/USD chart currently exhibits a bearish momentum, suggesting a potential continuation of the downward trend.
The first support level is at 27430, identified as a pullback support. It aligns with the 38.20% Fibonacci retracement, indicating historical significance as a price level where buyers may re-enter the market, potentially reversing or slowing the bearish trend.
The second support level is at 26539, which is recognized as an overlap support. This level is particularly significant as it coincides with the 78.60% Fibonacci retracement, strengthening its potential as a pivotal support area.
In terms of resistance, the first level is at 28315, marked as an overlap resistance. This level could act as a temporary barrier to upward price movements, potentially causing a pause or retracement in the bearish trend.
The second resistance level is at 29192, which is also characterized as an overlap resistance. This level could further resist upward price movements if the bearish trend is to reverse.
The overall trend suggests that price may continue to drop towards the identified support levels.
ETH/USD:
The ETH/USD chart is currently showing bearish momentum, indicating a potential continuation of the downward trend.
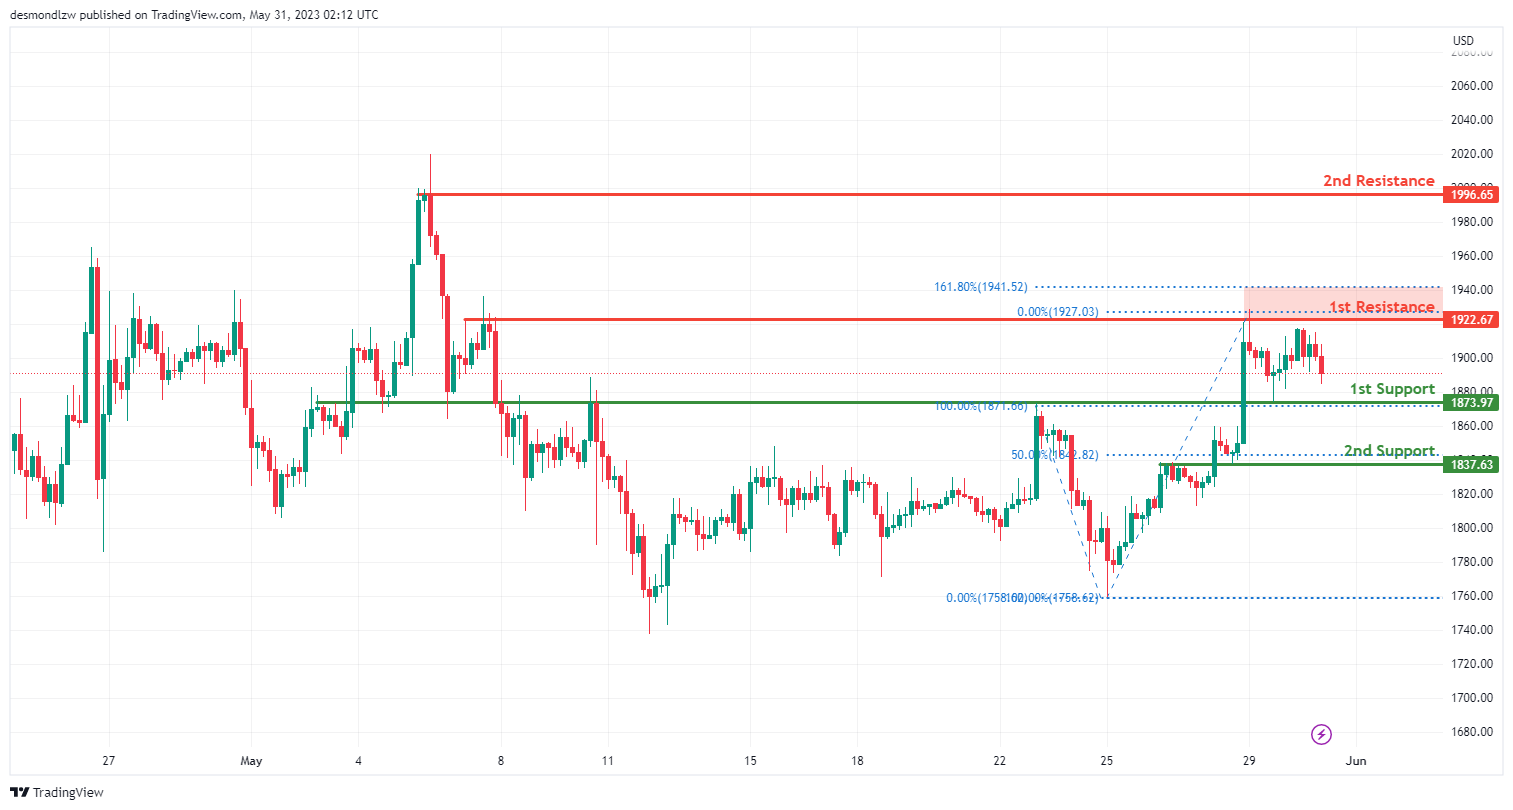
The first support level is at 1873.97, identified as an overlap support. This level serves as a significant area where buyers have previously entered the market, potentially slowing or reversing the bearish trend.
The second support level is at 1837.63, also identified as an overlap support. This level carries additional significance as it aligns with the 50% Fibonacci retracement, further strengthening its role as a pivotal support area.
On the resistance side, the first resistance level is at 1922.67, recognized as a multi-swing high resistance. This level may act as a temporary hurdle to any upward price movements, potentially causing a pause or retracement in the bearish trend.
The second resistance level is at 1996.65, known as a swing high resistance. This level may present additional resistance to upward price movements if the bearish trend reverses.
The overall trend suggests a potential continuation of the bearish trend towards the identified support levels.
WTI/USD:
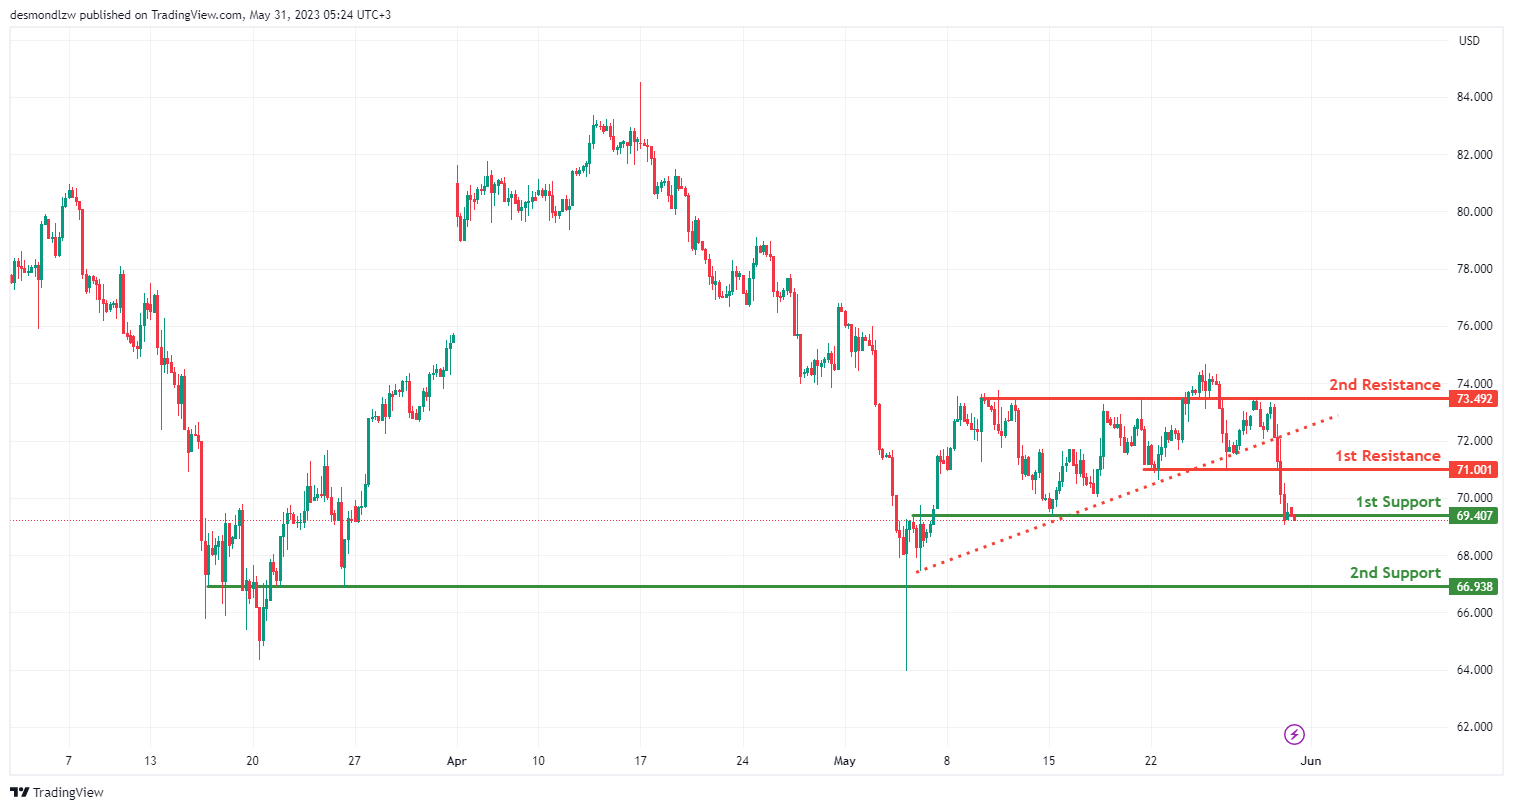
The WTI chart is currently showing bearish momentum, indicated by the recent break below an ascending support line that could trigger a potential bearish move.
The first support level is at 69.40, identified as an overlap support. This level serves as a significant area where buyers have previously entered the market, potentially slowing or reversing the bearish trend.
The second support level is at 66.93, also identified as an overlap support. This level carries additional significance as a price level where buying activity has previously occurred, further reinforcing its role as a potential support area.
On the resistance side, the first resistance level is at 71.00, recognized as a pullback resistance. This level may act as a temporary hurdle to any upward price movements, potentially causing a pause or retracement in the bearish trend.
The second resistance level is at 73.49, identified as an overlap resistance. This level has previously shown its significance as a price level where selling pressure has emerged.
The overall trend suggests a potential continuation of the bearish trend towards the identified support levels.
XAU/USD (GOLD):
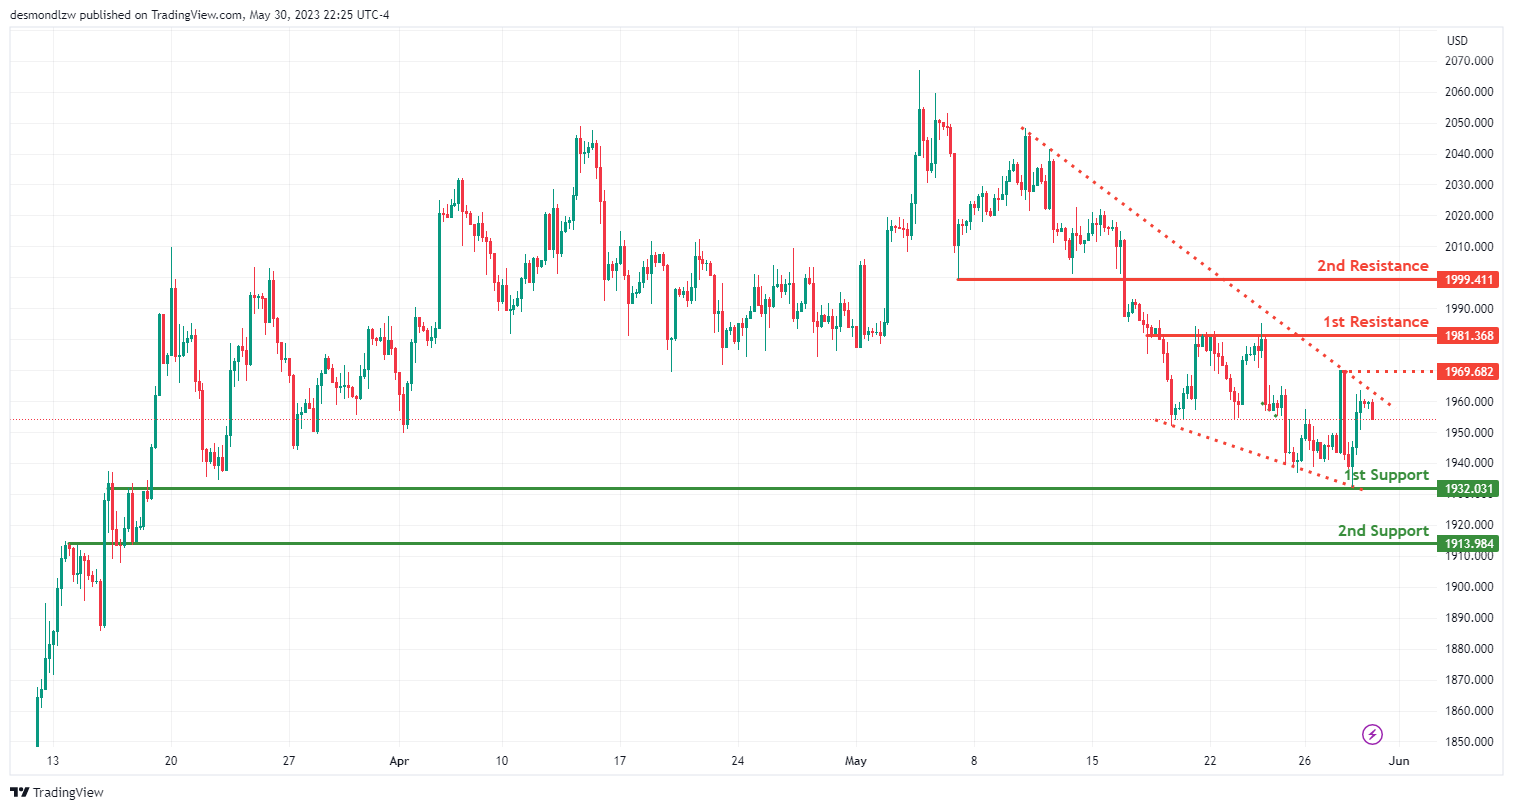
The XAU/USD chart is currently showing bearish momentum.
The first support level is at 1932.03, identified as an overlap support. This level represents a significant area where buyers have previously entered the market, potentially slowing or reversing the bearish trend.
The second support level is at 1913.98, also identified as an overlap support. This level has additionally demonstrated its significance as a price level where buying activity has previously occurred, reinforcing its role as a potential area of support.
On the resistance side, the first resistance level is at 1981.36, recognized as a multi-swing high resistance. This level may act as a temporary obstacle to any upward price movements, potentially causing a pause or retracement in the bearish trend.
The second resistance level is at 1999.41, identified as an overlap resistance. This level has previously shown its significance as a price level where selling pressure has emerged.
There is also an intermediate resistance level at 1969.68, identified as a swing high resistance. This level could act as an intermediate barrier to any price increase.
Gold Price Recovery Could Face Hurdles Near $1,960
Key Highlights
- Gold price found support near the $1,930 zone.
- A major bearish trend line is forming with resistance near $1,960 on the 4-hour chart.
- EUR/USD spiked below 1.0700 before the bulls took a stand.
- GBP/USD started a recovery wave above 1.2380.
Gold Price Technical Analysis
Gold price started a major decline from the $2,080 zone against the US Dollar. The price traded below the $2,000 support to move into a short-term bearish zone.
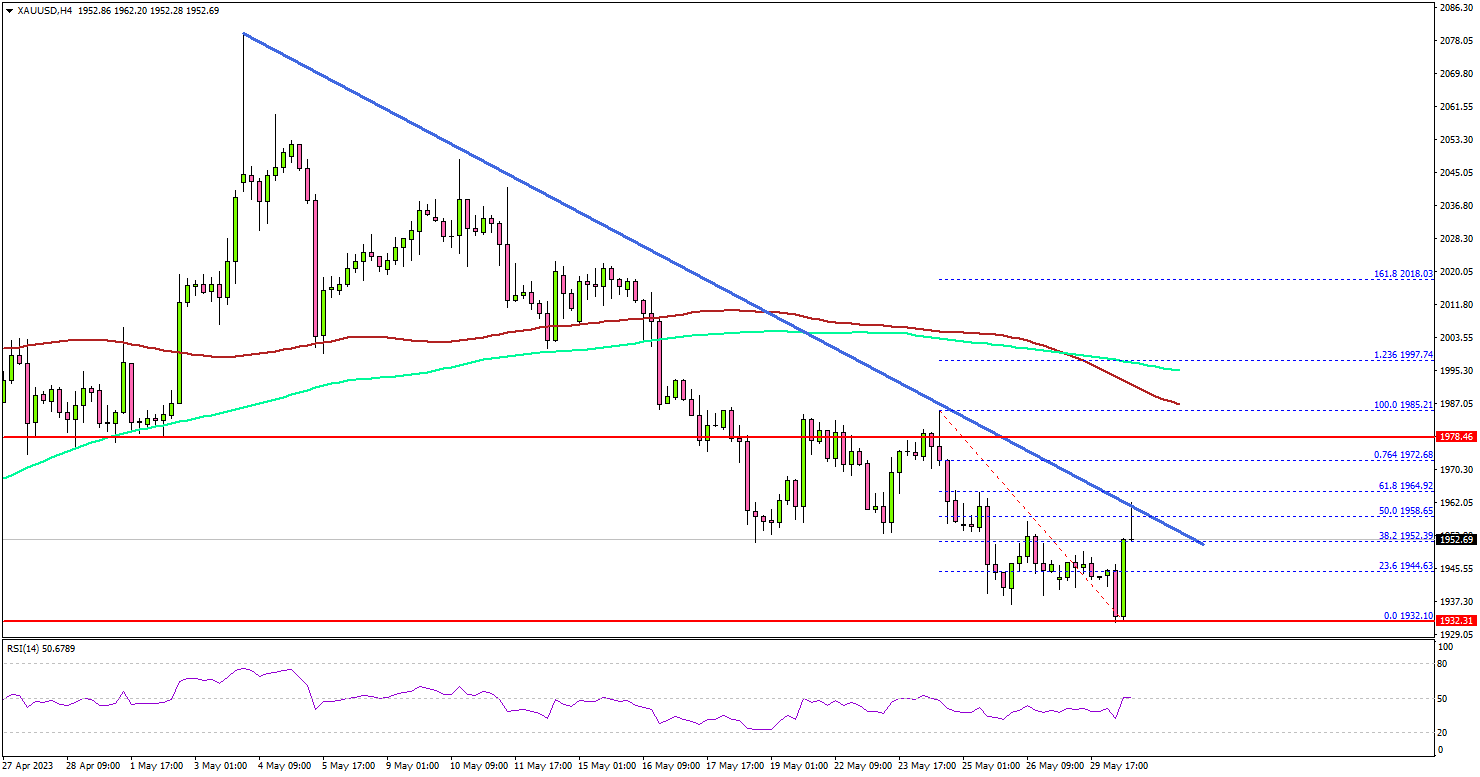
The 4-hour chart of XAU/USD indicates that the price traded below the $1,980 support, the 200 Simple Moving Average (green, 4 hours), and the 100 Simple Moving Average (red, 4 hours).
Finally, the price traded below $1,950 and tested $1,932. Recently, there was a recovery wave and a strong bullish candle was formed from the $1,932 low. However, the price is facing many hurdles near $1,958 and $1,960.
There is also a major bearish trend line forming with resistance near $1,960 on the same chart. A daily close above the trend line could initiate a decent increase.
The next major resistance is near the $1,990 level and the 200 Simple Moving Average (green, 4 hours). Any more gains might send the price toward the $2,020 resistance level.
Initial support is near the $1,932 level. The next major support is near $1,920. If the bulls fail to protect the $1,920 support, there is a risk of a major decline. In the stated case, the price could decline toward the $1,900 level.
Looking at EUR/USD, the pair declined sharply below the 1.0700 support before a short-term upside correction was initiated.
Economic Releases to Watch Today
- German Consumer Price Index for May 2023 (YoY) (Prelim) – Forecast +6.5%, versus +7.2% previous.
- German Consumer Price Index for May 2023 (MoM) (Prelim) – Forecast +0.2%, versus +0.4% previous.
- Canadian Gross Domestic Product for Q1 2023 (Annualized) – Forecast +2.5%, versus 0% previous.
Elliott Wave Forecasts Nasdaq (NQ) to Continue Higher
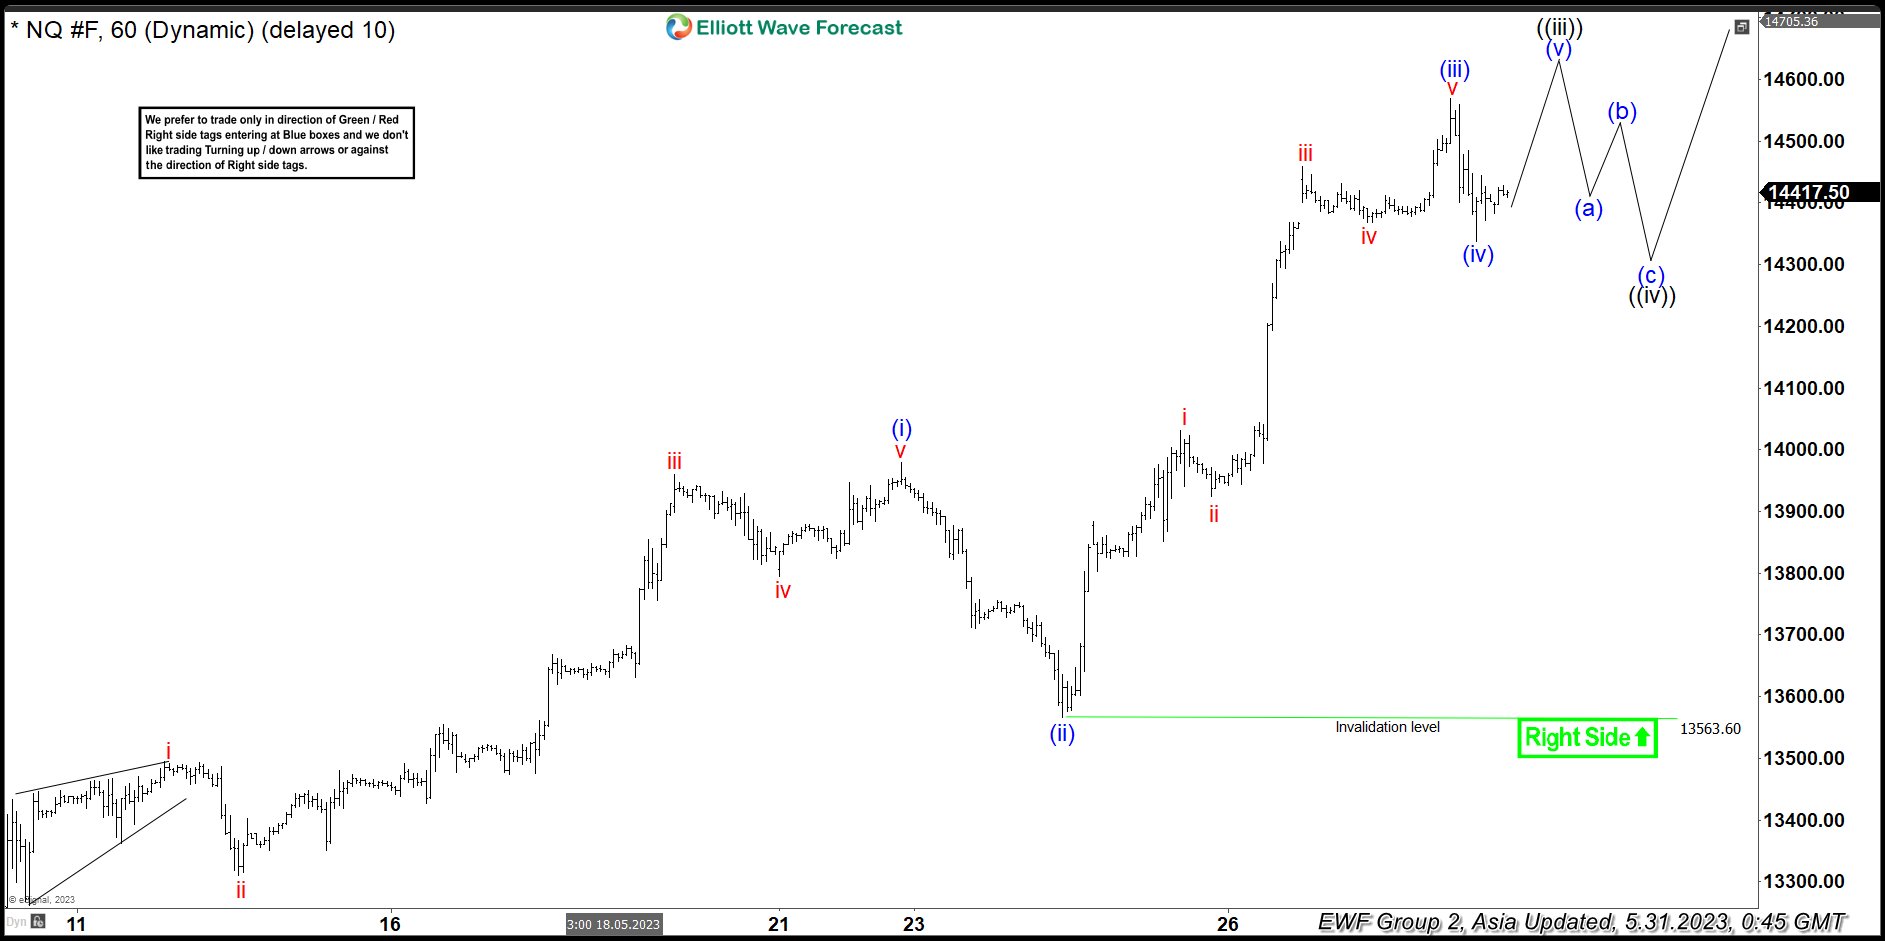
Short term Elliott Wave View in Nasdaq (NQ) suggests the rally from 4.26.2023 low is in progress as a 5 waves impulse with extension (nest). Up from 4.26.2023 low, wave ((i)) ended at 13370.25 and pullback in wave ((ii)) ended at 13001.75. Wave ((iii)) is currently in progress with internal subdivision as another 5 waves in lesser degree. The 1 hour chart below shows the rally within wave ((iii)). Up from wave ((ii)), wave i ended at 13494.25 and dips in wave ii ended at 13310.50. Wave iii ended at 13960.25, wave iv ended at 13794.25, and final wave v ended at 13979.25 which completed wave (i). Index then pullback in wave (ii) which ended at 13563.60.
The Index extended higher again in wave (iii) towards 14570 and pullback in wave (iv) ended at 14336.75. Expect Index to extend higher in wave (v) to complete wave ((iii)). Afterwards, it should pullback in wave ((iv)) to correct cycle from 5.4.2023 low before the Index resumes higher again. Wave ((iv)) typically ends at 23.6 – 38.2% Fibonacci retracement of wave ((iii)). The target can be measured after wave ((iii)) is confirmed complete. Near term, as far as pivot at 13563.6 low stays intact, expect pullback to find support in 3, 7, or 11 swing for further upside.
NQ 60 Minutes Elliott Wave Chart
Nasdaq (NQ) Elliott Wave Video
https://www.youtube.com/watch?v=qjp5mRjAGQI