Sample Category Title
Canadian Dollar Edges Lower ahead of Canadian GDP
- Canada to release GDP
- US debt ceiling deal off to Congress
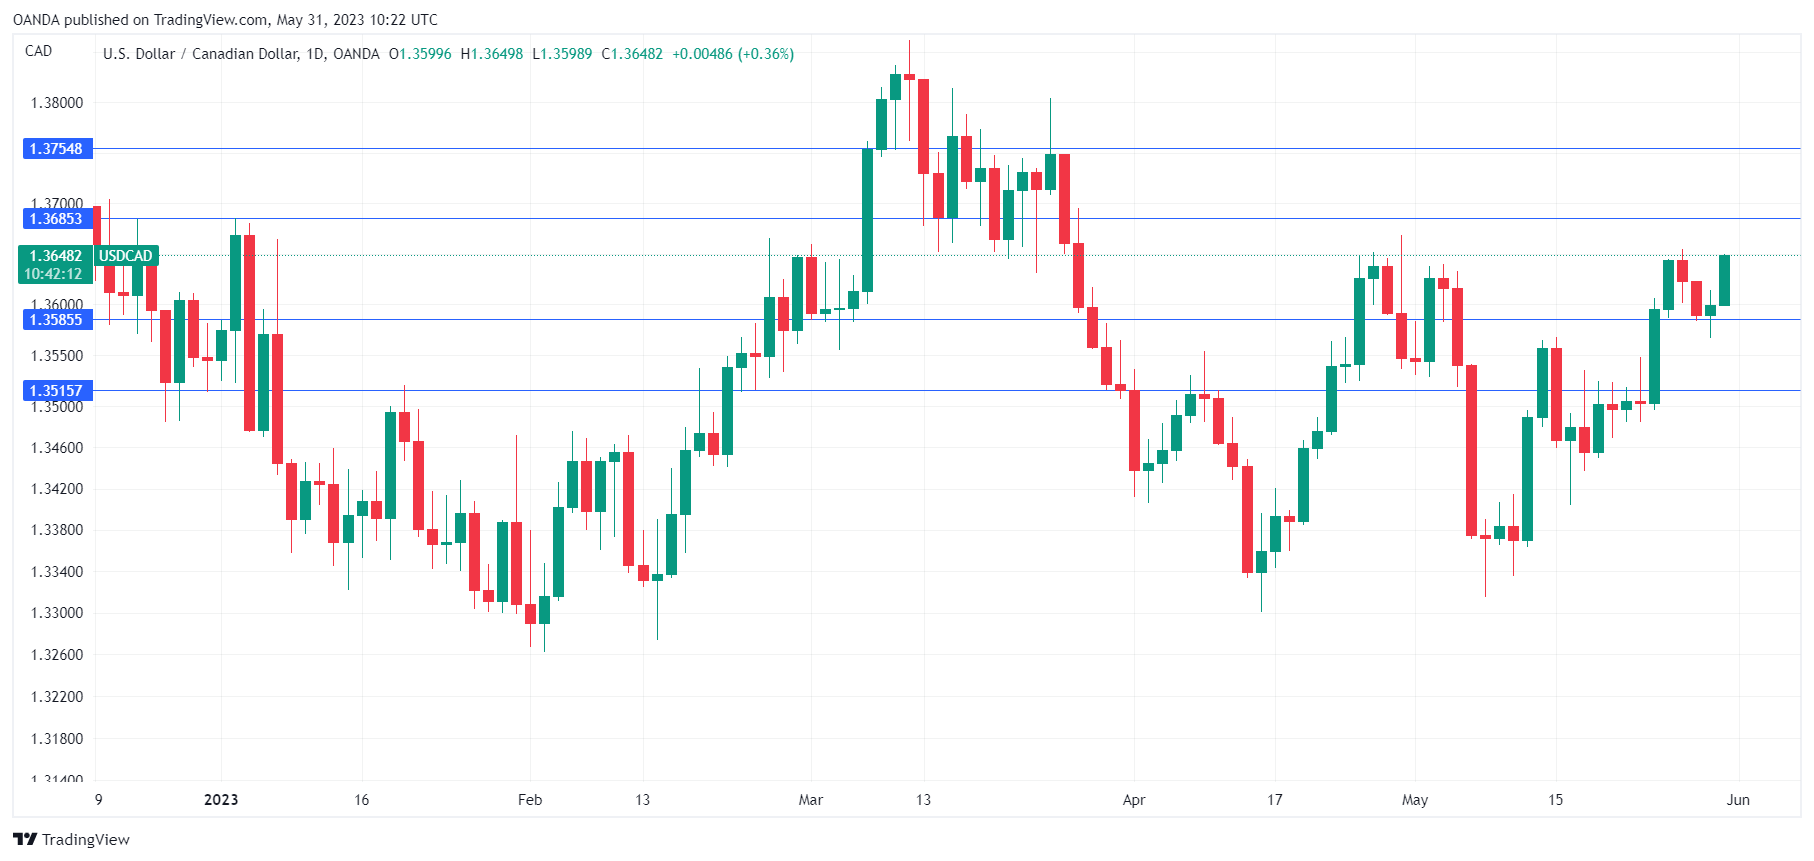
The Canadian dollar is trading close to a two-month low, as the currency remains under pressure. USD/CAD is trading at 1.3646 in the European session, up 0.34%.
Canada’s GDP expected to improve in Q1
Canada releases GDP later today, and the markets are projecting a modest 0.4% q/q for the first quarter, after flatlining in Q4 2022. On an annualized basis, GDP is expected to jump by 2.5%, after stalling at 0% in Q4.
The GDP report takes on even more significance as it is the last tier-1 release ahead of the Bank of Canada rate meeting on June 7th. A strong GDP release would support the Bank raising rates, while soft growth would give the Bank room to continue pausing rates at 4.25%. The key to the BoC’s decision could well depend on the GDP release.
The BoC has a tough decision to make at next week’s meeting. The BoC would like to extend its pause of rate hikes but inflation hasn’t cooperated, as it ticked upwards to 4.4% in April, up from 4.3% in March. Inflation has been coming down, but remains well above the Bank’s target of 2%.
In the US, the debt ceiling deal between President Biden and House Speaker McCarthy now has to be approved by both houses of Congress. Some Republicans are against the agreement, but the deal is expected to go through. The markets are optimistic, as 10-year Treasury yields dropped sharply on Tuesday in response to the agreement, which was reached on the weekend (US markets were closed on Monday). The 10-year yields are currently at 3.65%, after rising to 3.85% on Friday, their highest level since March.
USD/CAD Technical
- 1.3585 and 1.3515 are providing support
- 1.3685 and 1.3755 are the next resistance lines
USDCNH Heads for 7.3 per Dollar to Support the Economy
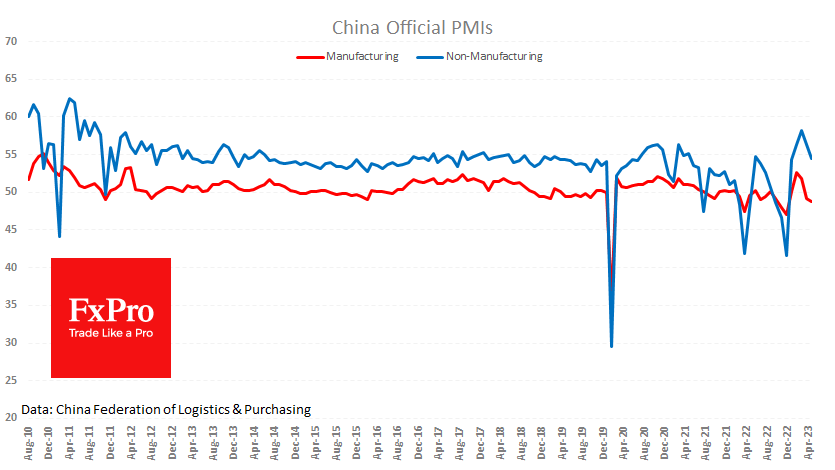
The official services and manufacturing PMIs were much weaker than expected, adding to the move into defensive assets on concerns over China’s economy.
The Manufacturing PMI fell from 49.2 to 48.8 instead of the expected 49.5. Readings below 50 indicate a contraction in activity during the month. Excluding periods of contraction due to lockdowns, this is the lowest level for the index in at least 13 years. Prices were the main driver of the decline, but falling order books and inadequate market demand were equally worrying.
The Services PMI fell from 56.4 to 54.5, below the expected 55.1. While these levels are below expectations, they align with the historical norm we saw before the coronavirus.
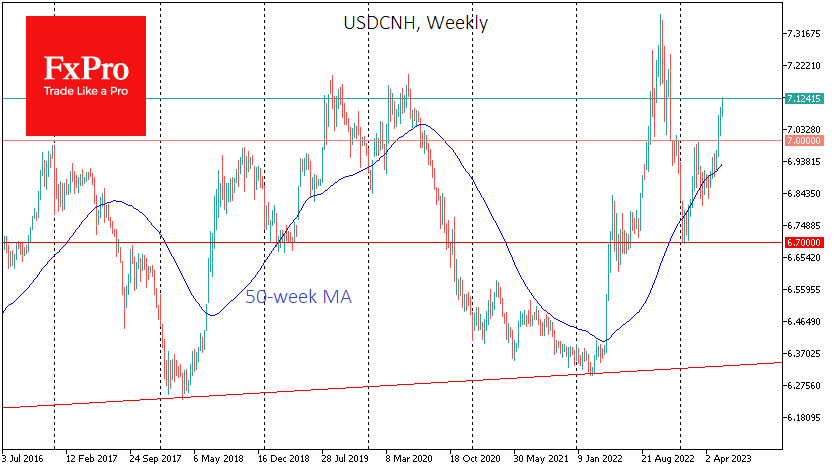
The weak data triggered a fresh sell-off in the renminbi. The USDCNH pair was above 7.12 at the start of European trading, its highest level since November last year. Over the past three weeks, the pair has hit new highs almost daily. Unlike in March and December, the central bank has not prevented the renminbi from weakening around the 7.0 level.
A weaker local currency benefits exporters as it increases their global competitiveness. The main side effect is higher inflation. But this is fine for China, where the CPI fell to 0.1% y/y in April, and the PPI lost 3.6% y/y. Perhaps all these effects are what the People’s Bank is trying to achieve.
The weak economy, low inflation and the central bank’s apparent resistance to the Renminbi weakness suggest that the USDCNH pair will continue looking for a top. The closest landmark is the 2019 and 2020 highs at 7.19, which the pair can reach relatively orderly within a few weeks and maintain the current momentum. However, one should be prepared that the recent move will be exhausted before the renminbi weakens to 7.3 per dollar, approaching last October’s highs.
Crypto Erases Positive Start to the Week
Market picture
Cryptocurrency market capitalisation fell 1.8% over the last 24 hours to $1.136 trillion. After failing to build on the weekend’s gains, the cryptocurrency market came under pressure during the Asian session on Wednesday morning as sellers moved into defensive assets.
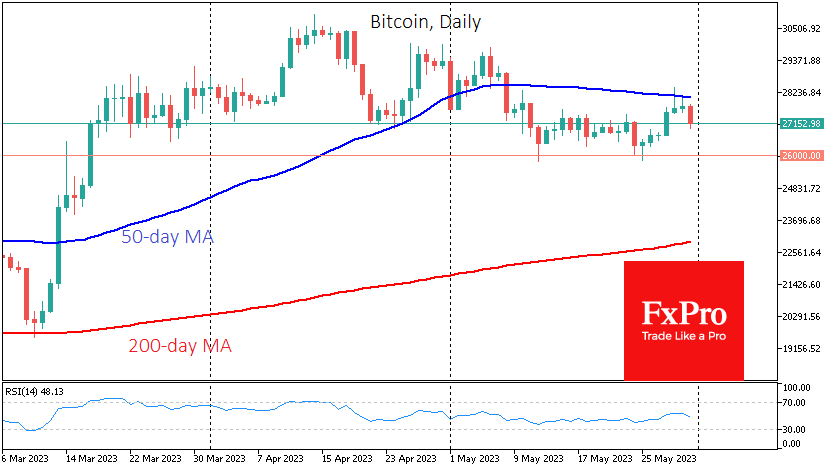
Bitcoin plunged to $27K, losing more than 2.7% since the start of the day and erasing all of Sunday’s gains. Technically, the selling intensified after the pair failed to break above the 50-day moving average, which turned from support to resistance in May. Market participants should now brace for another test of local support around $26K.
According to CoinShares, investments in crypto funds fell by $39 million last week, the sixth consecutive week of outflows. Bitcoin investments were down $12 million, and Ethereum investments were down $6 million.
Weekly trading volumes remain low, at 58% of this year’s average, which also mirrors the broader crypto market, with trading volumes at just 38% of this year’s average, CoinShares noted.
New background
According to Dune Analytics, the number of Bitcoin Ordinals-based tokens issued on the network has surpassed 10 million. Approximately 200,000 tokens are being issued daily, including NFTs.
US presidential candidate Robert Kennedy Jr. reiterated his support for Bitcoin and said that the SEC should not have people who oppose cryptocurrencies.
Crypto exchange BKEX said it had suspended customer withdrawals while a police investigation into possible money laundering by several users is underway.
Major stablecoin issuer Tether announced plans to invest in mining capacity in Uruguay, South America.
Renowned cryptocurrency analyst Michaël van de Poppe believes that Litecoin is gearing up for a “pre-halving rally” that will begin in early August.
USDJPY Looks Overbought But Still Supported
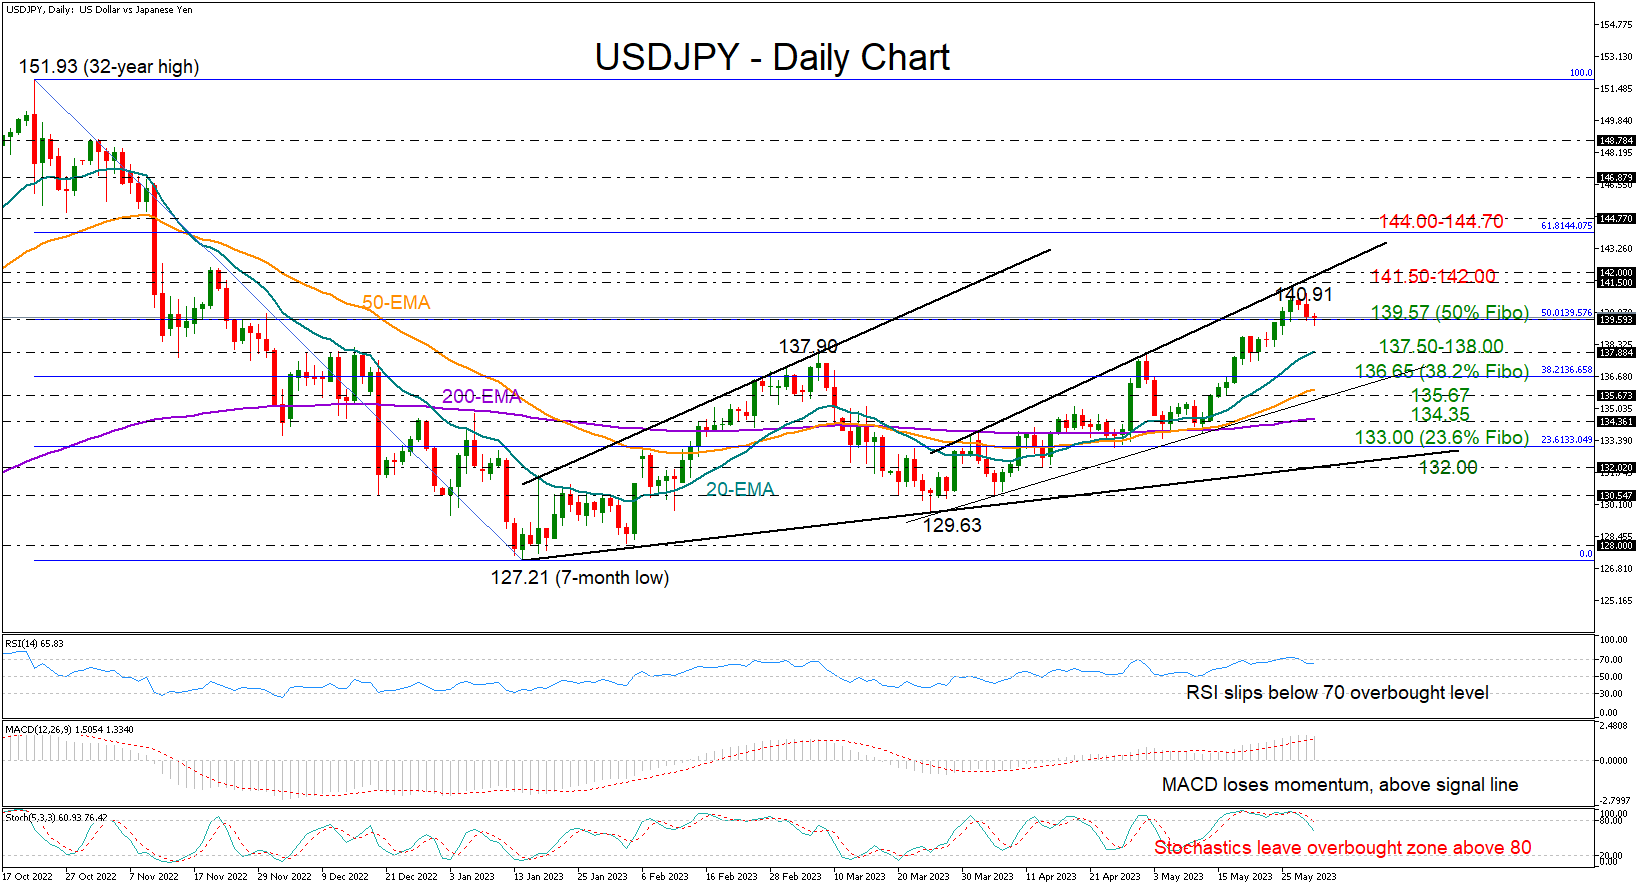
USDJPY came under weak selling pressure after peaking at a six-month high of 140.91 on Monday, with the pair set to close in negative territory for the first time in three weeks.
The RSI and the stochastic oscillator are warning that the bulls are running out of fuel as the indicators are changing direction below their overbought levels.
That said, traders may not engage in additional selling activities, unless the current support area around the 50% Fibonacci retracement level of the 151.93-127.21 downtrend proves fragile at 139.57. If this area is breached, the price could head for the 20-day exponential moving average (EMA) at 137.90. A steeper downfall could shift the spotlight on the 136.65-135.67 zone, formed by the 38.2% Fibonacci mark and the ascending trendline from March. Should the bears break the protection around the 200-day EMA too, the next pivot point could develop somewhere between the 23.6% Fibonacci of 133.00 and the 2023 ascending trendline at 132.00.
In the positive scenario, where the pair bounces on the 139.57 level, the bulls may attempt to print a new higher high near the 141.50 barrier and the tentative resistance line at 142.00. A successful penetration higher could prompt an advance towards the 61.8% Fibonacci of 144.00 and the 144.70 barrier.
Summing up, USDJPY is expected to trim some gains in the short term as the technical picture reflects overbought conditions. A close below 139.57 could confirm another bearish extension.
GBP/USD: Bearish Correction (B) is Half Completed
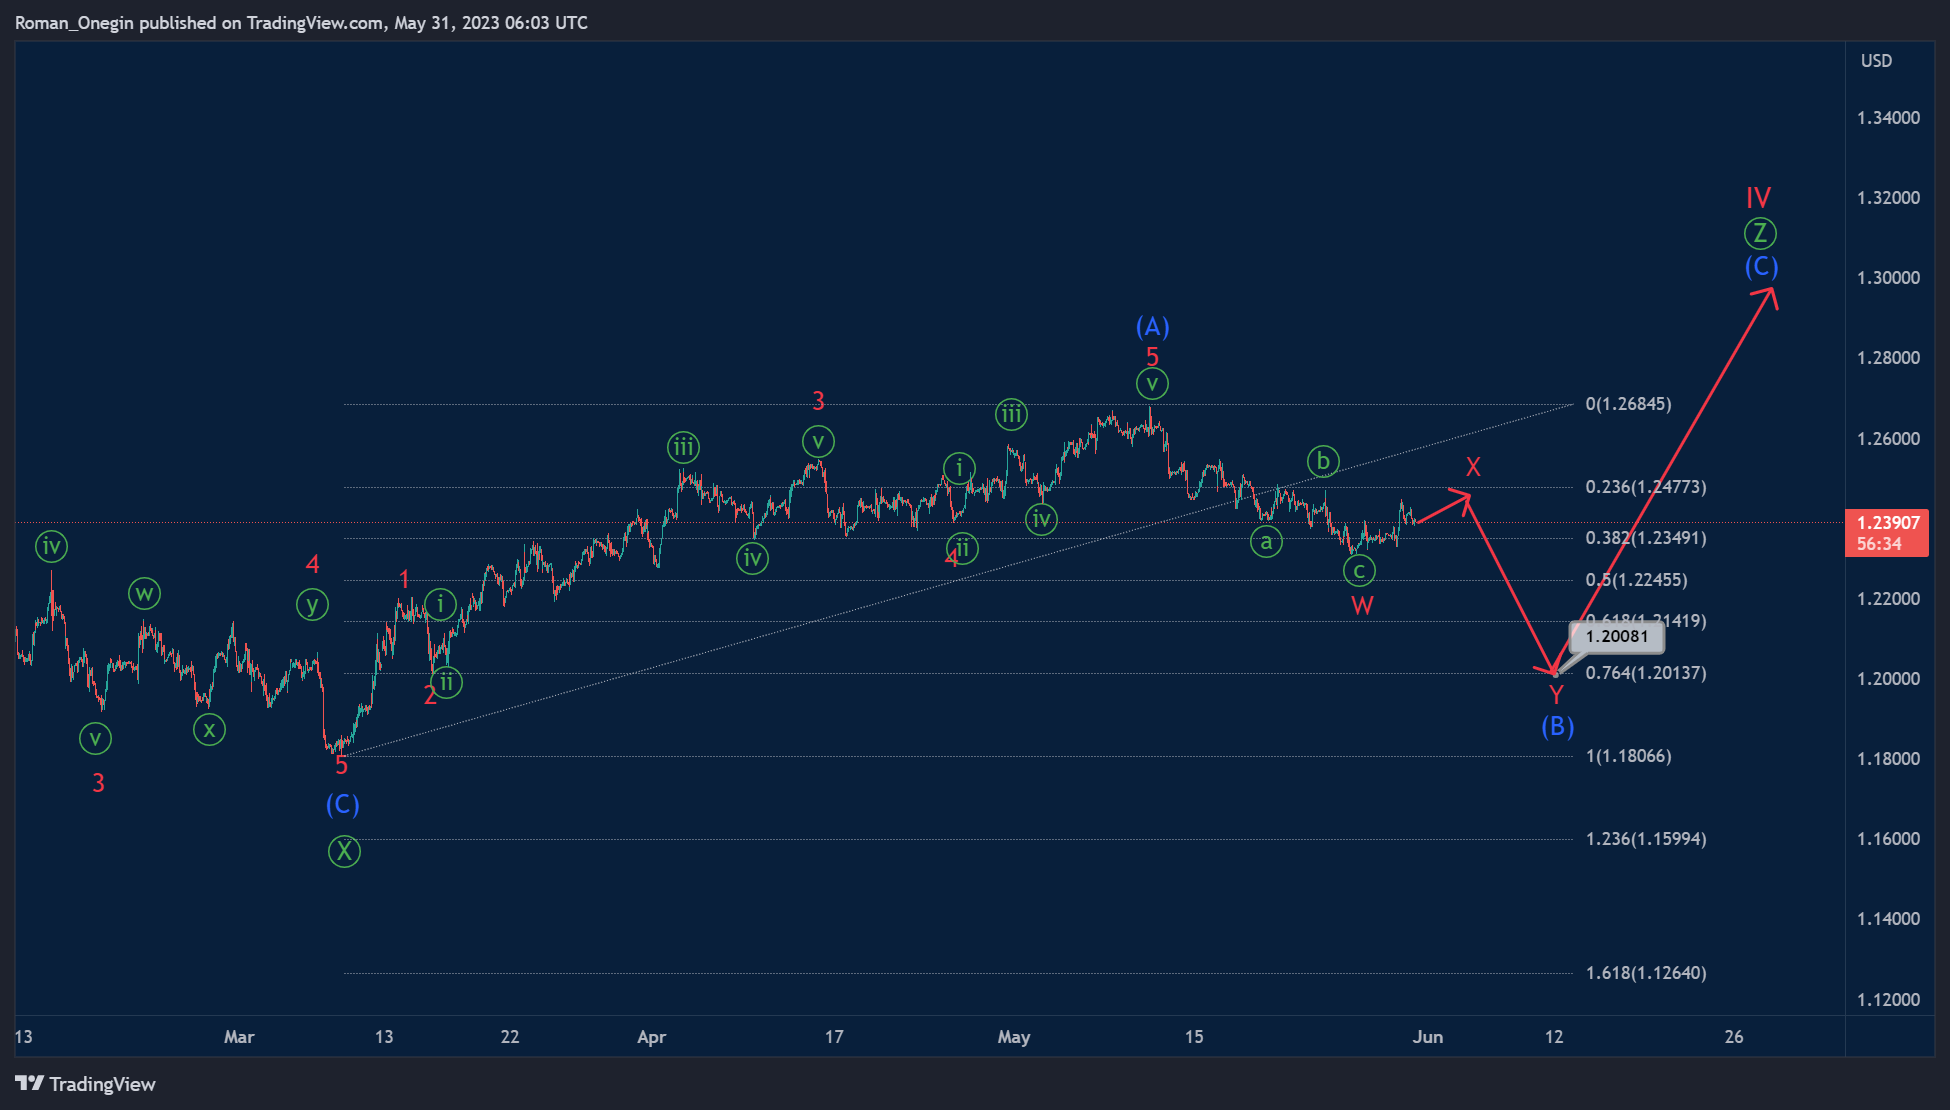
It is assumed that the GBPUSD pair can build a corrective cycle wave IV.
Perhaps this correction takes the form of a triple zigzag of the primary degree Ⓦ-Ⓧ-Ⓨ-Ⓧ-Ⓩ. At the time of writing, the final primary wave Ⓩ is under development.
There is a high probability that the actionary wave Ⓩ will have the form of a standard zigzag (A)-(B)-(C), as shown in the chart.
We see that the first wave (A) has already been built. After it, the market went down in correction (B). Wave (B) may take the form of a double zigzag and end near 1.200. At that level, it will be at 76.4% Fibonacci of impulse (A).
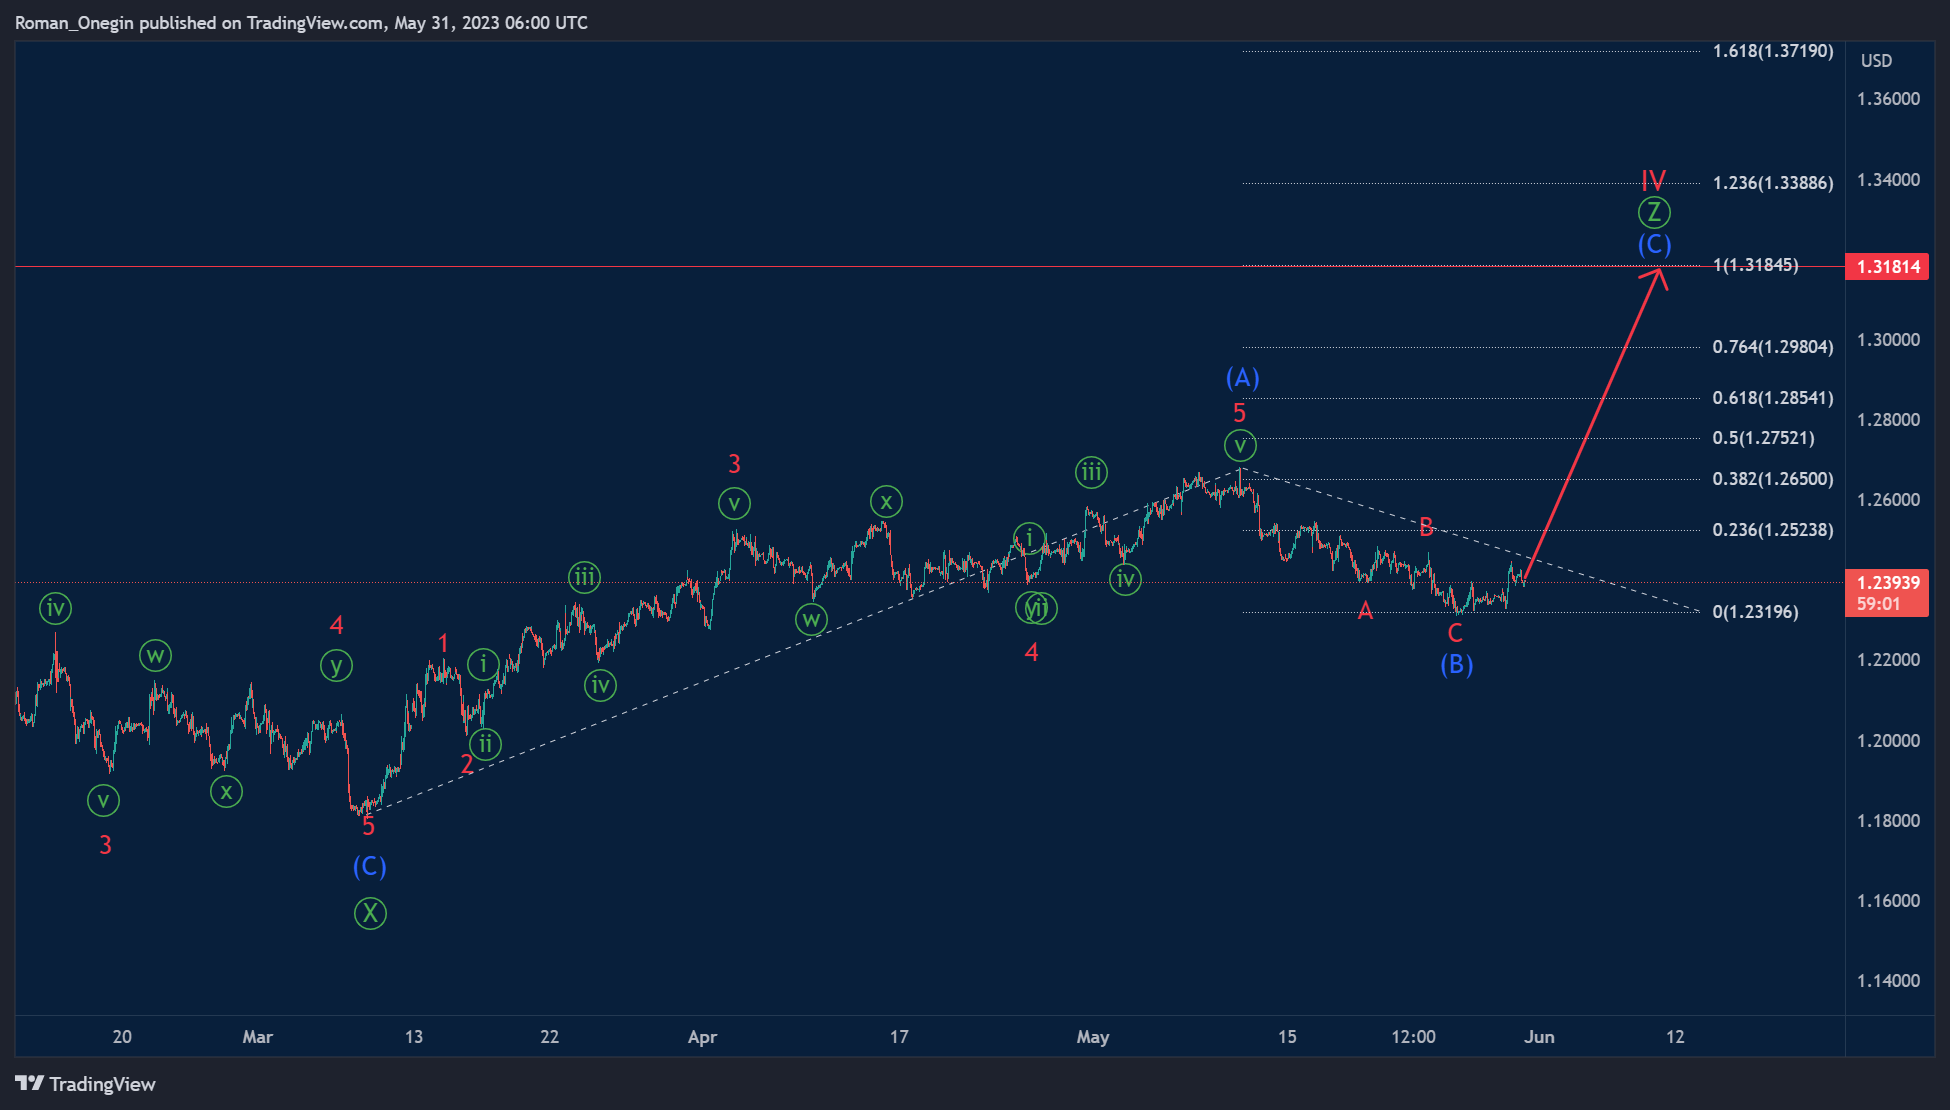
However, it is necessary to consider an alternative scenario in which the intermediate correction (B) is already fully completed. Thus, the market can move in an upward direction within the final intermediate wave (C).
The end of wave (C) is expected near 1.318. At the specified level, impulse waves (A) and (C) will be equal to each other.
We will continue to monitor the currency pair in the future.
Dollar Index: Dollar Index Rises on Fresh Hawkish Signals from Fed; US NFP in Focus
The dollar index hit new highest in two and a half months following fresh acceleration higher on Wednesday, sparked by renewed hawkishness from Fed.
Comments that there are no significant reasons for the central bank to pause its rate hiking cycle and growing signals that the Fed may keep high borrowing cost longer, provided boost to the greenback.
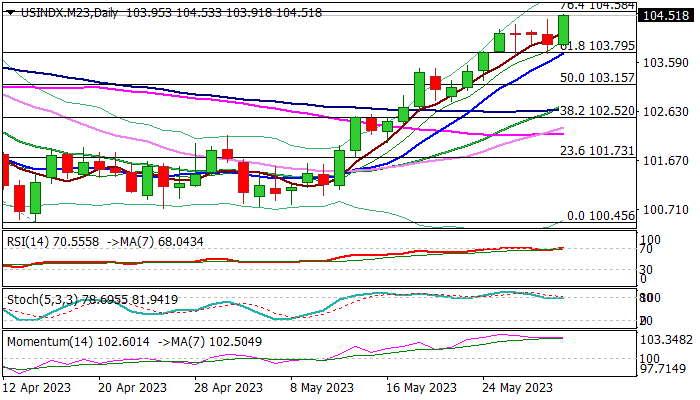
Fresh gains generate initial signal of bullish continuation after the action was paused for consolidation in past three days and pressuring targets at 104.58/70 (Fibo 76.4% of 105.85/100.45 / Mar 15 lower top), break of which would unmask key barriers at 105.49/85 (200DMA / Mar 8 top).
Overbought daily studies warn of possible extended consolidation, with larger bulls expected to remain intact while holding above 103.75 zone (higher base / broken Fibo 61.8% / rising 10 DMA).
Near-term action may also move at a lower pace as markets await release of US labor report for May on Friday, which is expected to generate stronger signals and also give more evidence about
Fed’s decision in mid-Jube policy meeting.
Stronger than expected NFP numbers (180K f/c) would further boost the greenback and also raise probability of another rate hike in June.
Res: 104.58; 104.70; 105.49; 105.85.
Sup: 103.91; 103.75; 103.15; 102.83.
AUD/USD: Aussie Dollar Under Increased Pressure from Weak China’s Manufacturing Data
Australian dollar fell to new multi-month low in early Wednesday, after coming under increased pressure from risk aversion and slowdown in Chinese factory activity.
China’s manufacturing PMI fell to 48.8 in May vs 49.2 contraction in April and well below 51.4 forecast, with deeper drop below 50 level which divides growth from contraction, adding to worries about the pace of country’s post-pandemic recovery.
Australia’s inflation report, which was released simultaneously, showed that inflation unexpectedly rose to 6.8% in April vs 6.4% consensus, though slightly below 7.0% in March and add pressure to the central bank, raising prospects for further rate hikes, though positive impact on Aussie dollar from the report was minor and short-lived.
On the other hand, fresh hawkish comments from Fed policymakers, favoring continuation of policy tightening cycle and keeping high interest rates for some time, inflate US dollar.
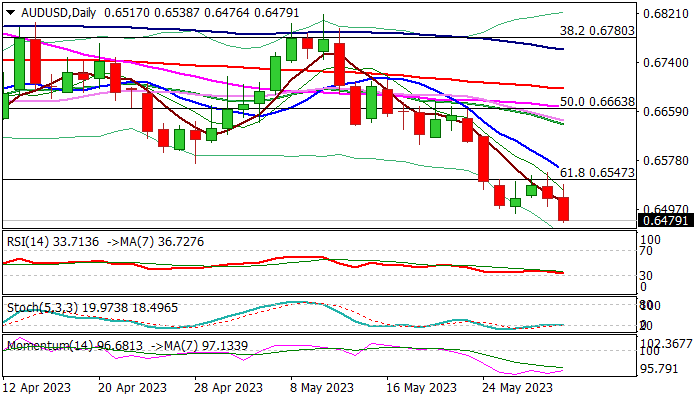
The pair is on track for the fourth consecutive monthly loss that adds to negative outlook, as technical studies are firmly bearish on daily and weekly chart.
However, the price action may face increased headwinds in coming sessions as daily studies are oversold, with upticks likely to be limited as overall picture is bearish.
Broken Fibo 61.8% (0.6547), falling 10 DMA (0.6562) and weekly cloud base (0.6581) mark significant barriers which should cap upticks and keep larger bears in play for extension towards targets at 0.6403/0.6272 (Fibo 76.4% of 0.6170/0.7157 / Nov 11 trough).
Res: 0.6547; 0.6562; 0.6581; 0.6637.
Sup: 0.6451; 0.6403; 0.6386; 0.6272.
AUD/USD Slips on Soft Chinese PMIs, Aussie Inflation Jumps
- RBA’s Lowe says inflation fight not over
- Australian inflation rises to 6.8%
- US Treasury yields fall on debt ceiling deal
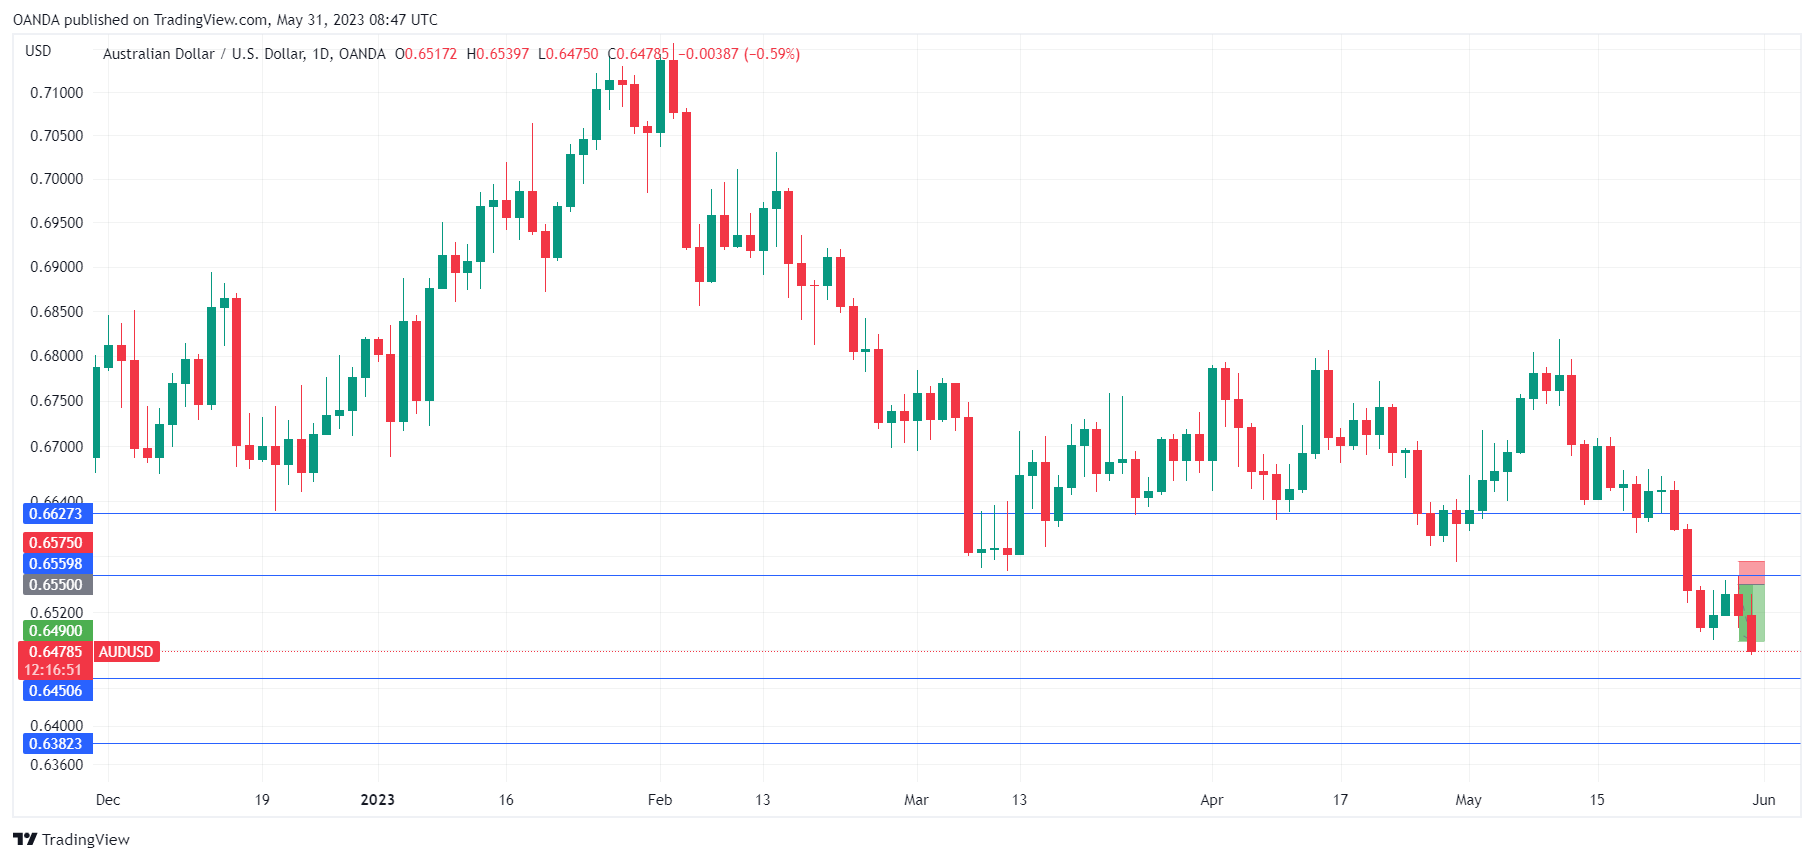
Australian inflation rose in the first quarter, but the Australian dollar is considerably lower today due to soft China PMI reports. AUD/USD is trading at 0.6481, down 0.54%. Earlier, AUD/USD dropped as low as 0.6480, its lowest level since November 7th.
Australia’s inflation rises
Reserve Bank of Australia Governor Lowe was on the hot seat earlier today, as he testified before a Senate committee. Lowe defended the Bank’s aggressive tightening, saying he was aware of the financial pain to families but insisted that high rates were necessary. Lowe said it was too early to declare victory over inflation. It’s a good thing he didn’t because his testimony came around the same time as Australian CPI for the first quarter, which surprised to the upside. CPI rose to 6.8%, up from an upwardly revised 6.3% and above the estimate of 6.4%.
With the RBA meeting next week, today’s inflation report could have ramifications on the Bank’s rate decision. The markets have trimmed the odds of a pause to 78%, down from 90% just a day ago, according to ASX RBA Rate Tracker. This means there is an outside chance of a 25-basis point hike, and the RBA could feel compelled to hike again, with inflation remaining stubbornly high.
China PMIs ease lower
China’s services and manufacturing PMIs fell in May, pointing to a rocky recovery from Covid. Services dipped to 54.5, down from 56.4, but beat the estimate of 50.7. Manufacturing dropped from 49.2 to 48.8 and missed the estimate of 49.4. A reading below 50.0 points to contraction. The weak data has weighed on the Australian dollar, which is sensitive to Chinese releases, as China is Australia’s number one trading partner.
In the US, the debt ceiling deal between President Biden and House Speaker McCarthy is expected to pass through Congress. There could be some hurdles, as some Republicans are against the agreement. The markets are optimistic, as 10-year Treasury yields dropped 2.6% on Tuesday in response to the agreement, which was reached on the weekend (US markets were closed on Monday). The 10-year yields are currently at 3.65%, after rising to 3.85% on Friday, their highest level since March.
AUD/USD Technical
- There is resistance at 0.6559 and 0.6627
- 0.6450 and 0.6382 are providing support
EUR/JPY Daily Outlook
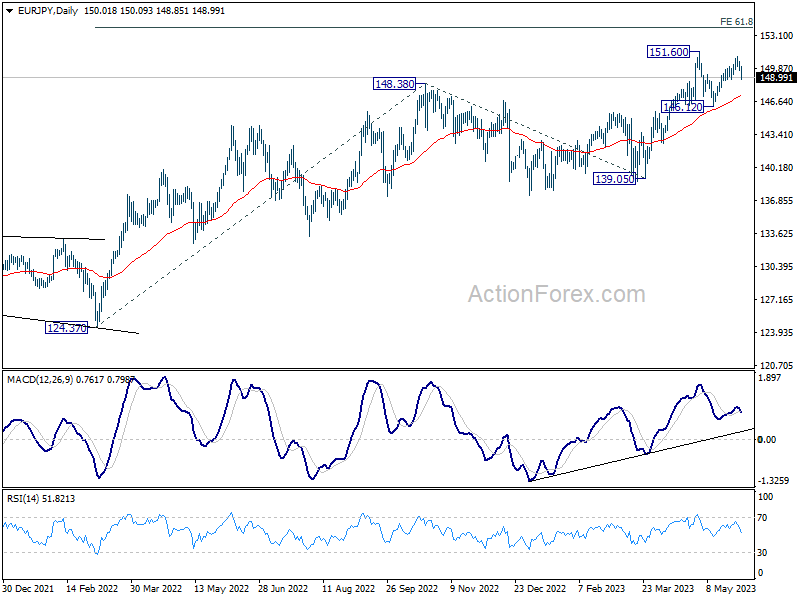
Daily Pivots: (S1) 149.66; (P) 150.14; (R1) 150.55; More....
Intraday bias in EUR/JPY remains neutral at this point. On the downside, break of 148.83 support will extend the corrective pattern from 151.60 with another falling leg. Intraday bias will be back on the downside for 146.12 support. On the upside, above 151.05 will target 151.60 high. Firm break there will resume larger up trend to 153.64 projection level.
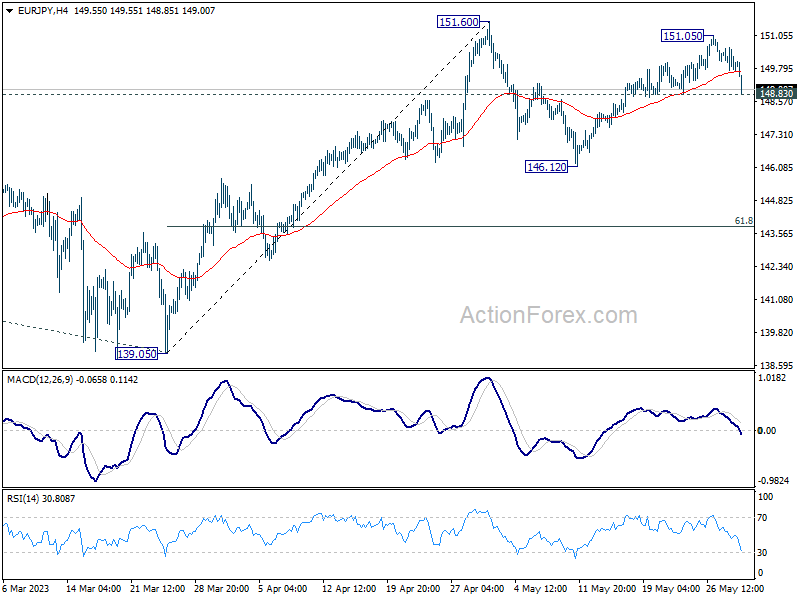
In the bigger picture, rise from 114.42 (2020 low) is in progress. Next target is 61.8% projection of 124.37 to 148.38 from 138.81 at 153.64. Sustained break there will pave the way to 100% projection at 162.82. For now, medium term outlook will remain bullish as long as 139.05 support holds, even in case of deep pull back.
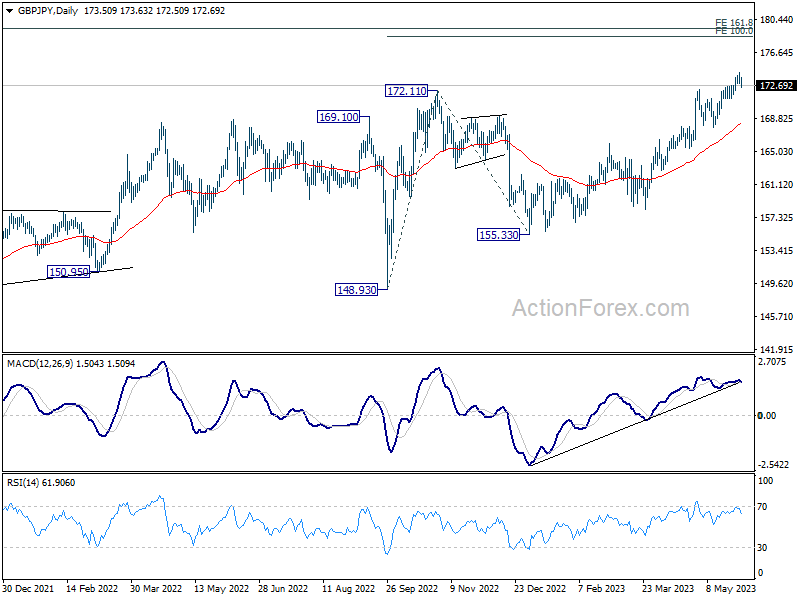
GBP/JPY Daily Outlook
Daily Pivots: (S1) 172.91; (P) 173.60; (R1) 174.19; More...
Intraday bias in GBP/JPY is turned neutral again with current retreat. Some consolidations could be seen but further rally is expected as long as 171.26 support holds. Break of 174.25 will resume larger up trend to 100% projection of 148.93 to 172.11 from 155.33 at 178.51. Nevertheless, break of 171.26 minor support will delay the bullish case, and turn bias to the downside for deeper retreat.
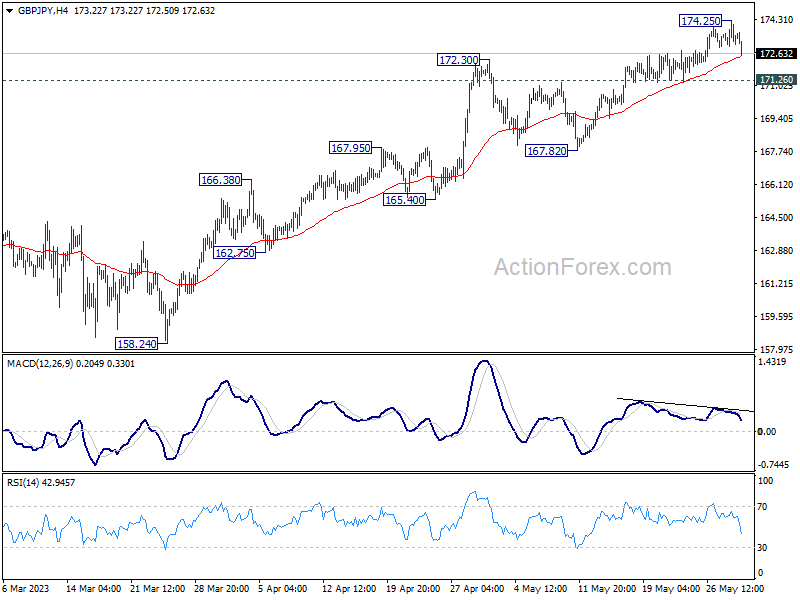
In the bigger picture, up trend from 123.94 (2020 low) is extending. Next target will be 161.8% projection of 122.75 (2016 low) to 156.59 (2018 high) from 123.94 at 178.69. For now, medium term outlook will remain bullish as long as 155.33 support holds, even in case of deep pull back.