Sample Category Title
EUR/USD Revisits Support, Can Bulls Save The Day?
Key Highlights
- EUR/USD declined below the 1.0950 and 1.0920 support levels.
- A key bearish trend line is forming with resistance near 1.0925 on the 4-hour chart.
- GBP/USD also reacted to the downside toward the 1.2450 support.
- USD/JPY is moving higher and might climb toward the 137.50 resistance.
EUR/USD Technical Analysis
The Euro faced a strong rejection near the 1.1090 level against the US Dollar. The EUR/USD pair started a fresh decline and traded below the 1.1000 support.
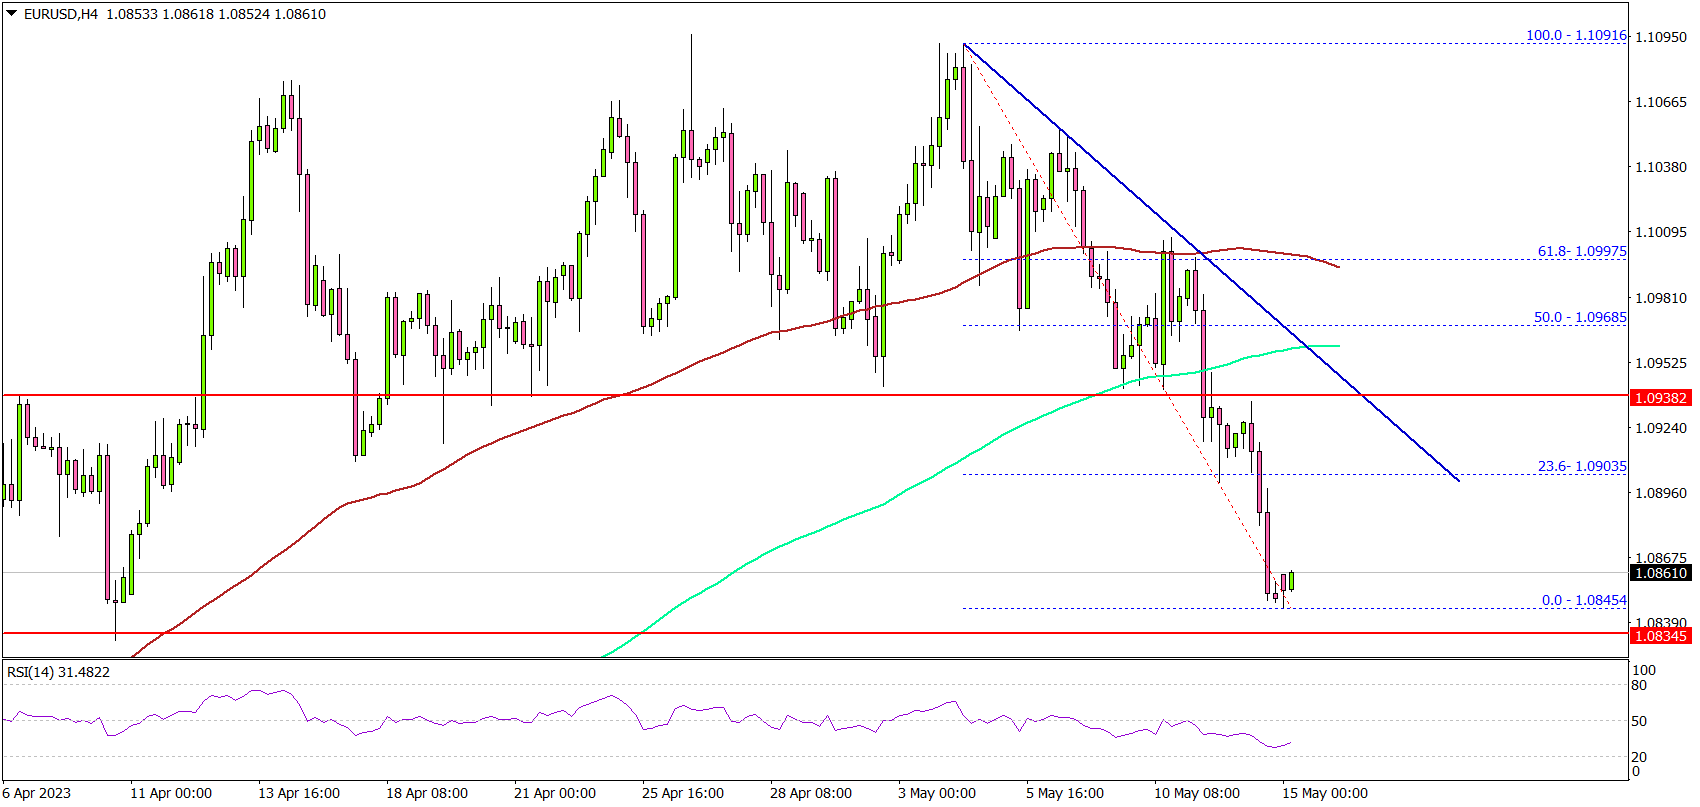
Looking at the 4-hour chart, the pair settled below the 1.0950 level, the 100 simple moving average (red, 4 hours), and the 200 simple moving average (green, 4 hours).
The bears even pushed the pair below the 1.0920 level. It tested the 1.0840 support zone and is currently consolidating losses. Immediate resistance on the upside is near the 1.0900 level.
There is also a key bearish trend line forming with resistance near 1.0925 on the same chart. The next major resistance is near the 1.0950 level or the 200 simple moving average (green, 4 hours), above which the pair could test the 100 simple moving average (red, 4 hours).
On the downside, the pair might find bids near 1.0840. The next major support is near the 1.0820 level. If there is a downside break below the 1.0820 level, the pair could test the 1.0750 level.
Looking at GBP/USD, the pair failed to climb above the 1.2680 resistance and started a downside correction toward the 1.2450 support.
Economic Releases
- Euro Zone Industrial Production for March 2023 (MoM) - Forecast -1.8%, versus +1.5% previous.
EURNZD Buying The Dips At The Blue Box Area
Hello fellow traders. In this technical article we’re going to take a quick look at the Elliott Wave charts of EURNZD published in members area of the website. As our members know, the pair is showing bullish sequences in the cycle from the April 2022 low. Our team recommended members to avoid selling , while keep favoring the long side. Recently we got correction that reached our buying zone. The pair found buyers and made reaction from the blue box as expected. In the further text we are going to explain the Elliott Wave Forecast and trading strategy.
EURNZD Elliott Wave 1 Hour Chart 05.04.2023
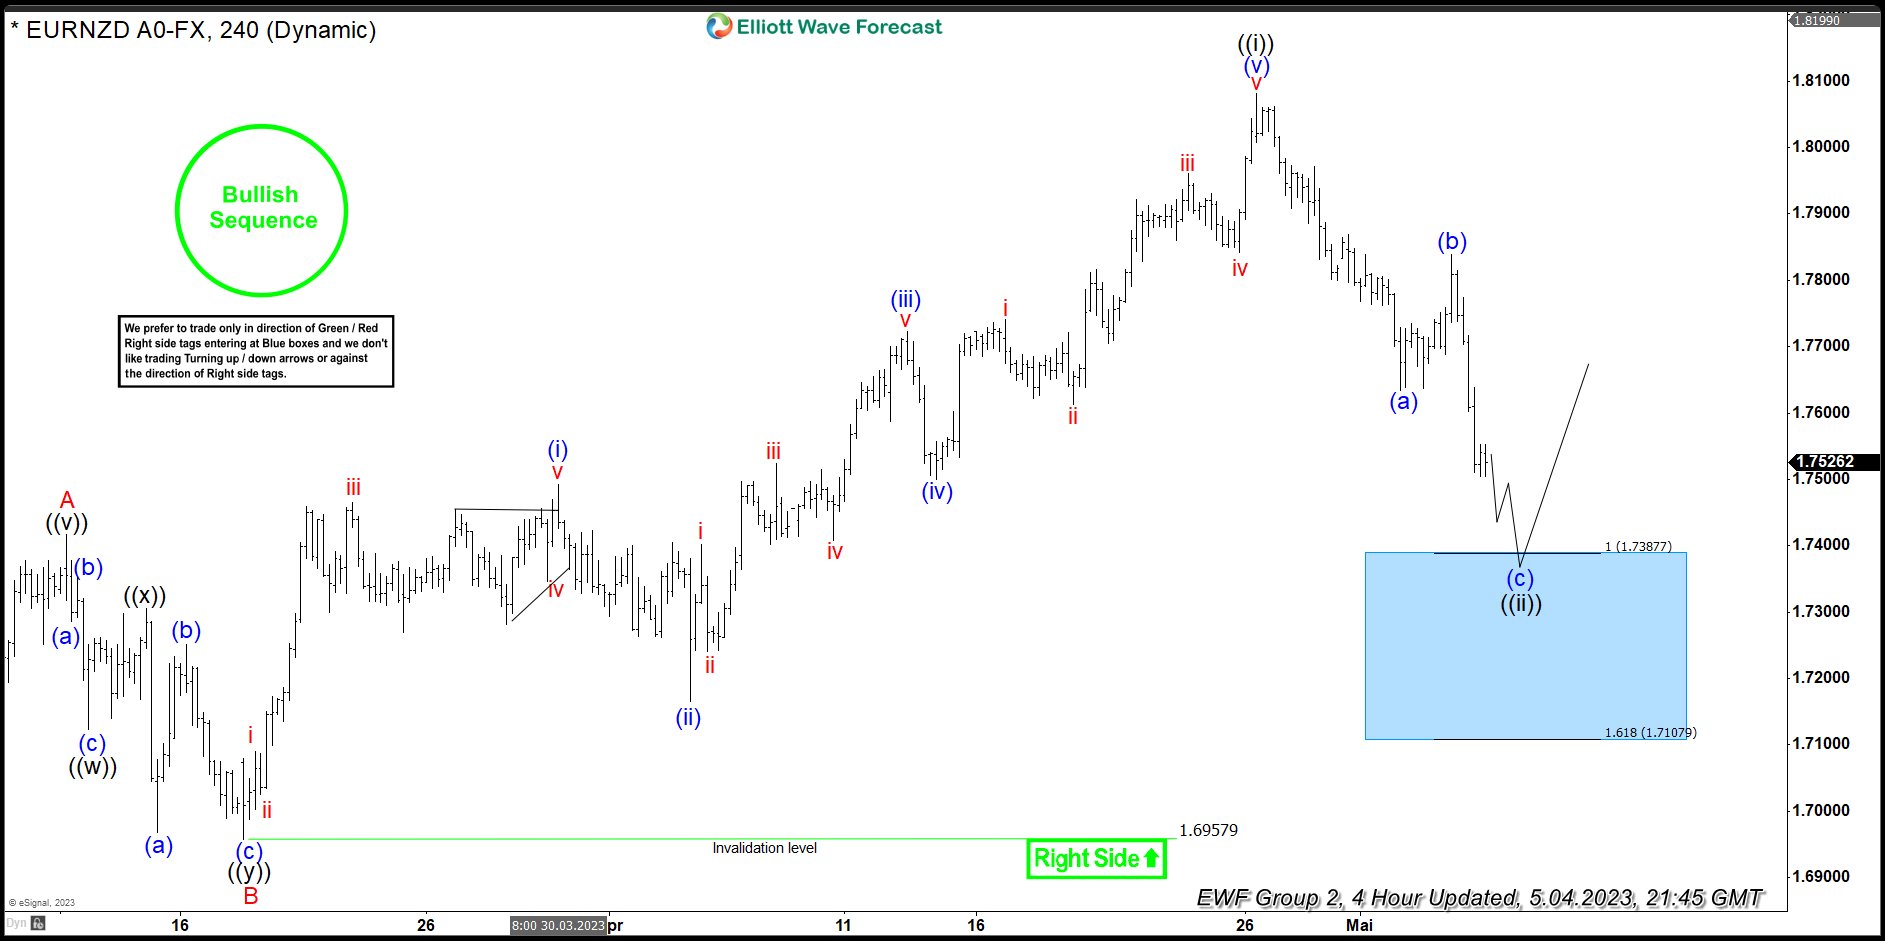
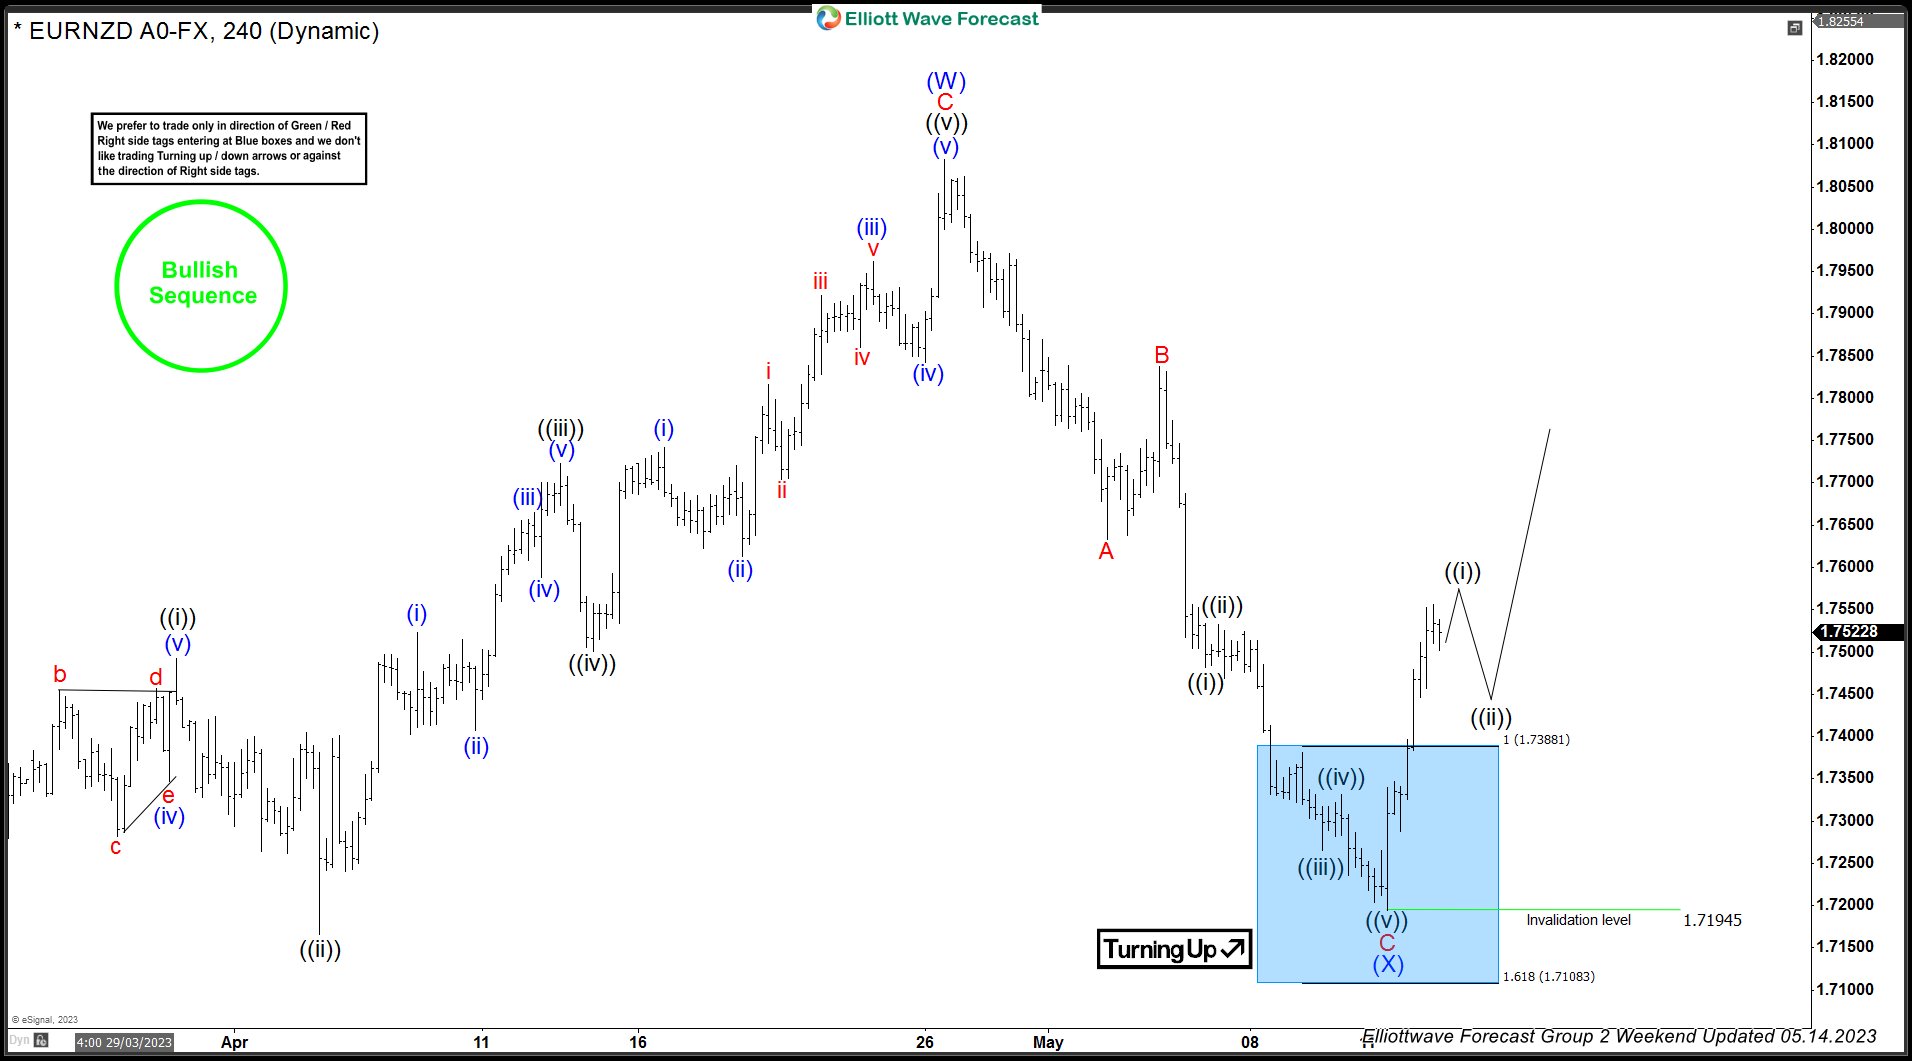
The pair is giving us wave (ii)) pull back that is unfolding as Zig Zag pattern. Structure of the pull back looks incomplete at the moment. We expect to see more toward 1.7387-1.7107 area which will be our buying zone. We don’t recommend selling the pair against the main bullish trend. Strategy is waiting for the price to reach blue box- equal legs zone, before entering the long trades again. Once bounce reaches 50 Fibs against the (b) blue high , we will make long position risk free ( put SL at BE) and take partial profits. Invalidation for the long trades is break of 1.618 fib ext : 1.7107
Quick reminder:
Our charts are easy to trade and understand:
Red bearish stamp+ blue box = Selling Setup
Green bullish stamp+ blue box = Buying Setup
Charts with Black stamps are not tradable. 🚫
EURNZD Elliott Wave 1 Hour Chart 05.14.2023
The pair made decline in C leg and reached buying zone at 1.7388-1.7108 area ( blue box) . Pull back completed at the 1.71945 low and we are getting good reaction from the buying zone. Bounce reached and exceeded 50 fibs against the connector’s high. So members who took the long trade are enjoying profits now in a risk free positions.
Forex and Cryptocurrencies Forecast
EUR/USD: Why the Dollar Rose
We named the previous review "Market at a Crossroads." We can now say that it finally made a decision and chose the dollar last week. Starting from 1.1018 on Monday, May 8, EUR/USD reached a local low of 1.0848 on Friday, May 12. Interestingly, this growth occurred despite the cooling of the U.S. economy. Not even the prospects of a U.S. debt default or the possibility of a reduction in federal fund rates could stop the strengthening of the dollar.
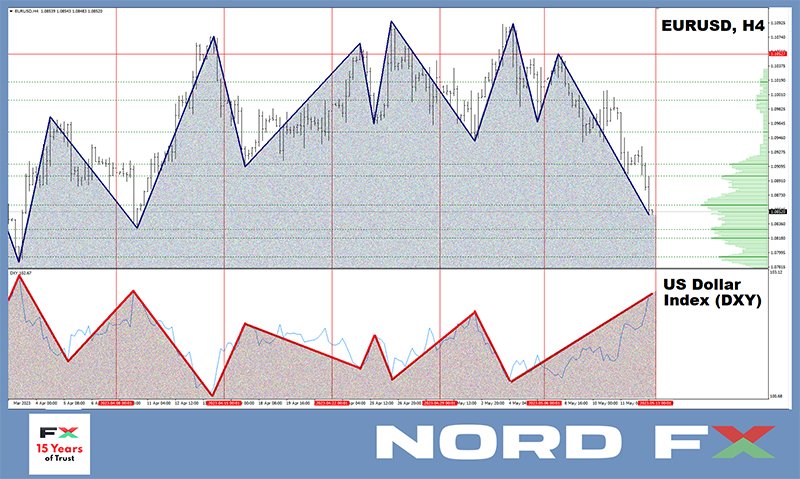
The slowdown in the American economy is further evidenced by a decline in producer prices (PPI) to the lowest level since January 2021, at 2.3%, and an increase in the number of unemployment benefit claims to the highest level since October 2021, reaching 264K (compared to a forecast of 245K and a previous value of 242K). Inflation in the United States, measured by the Consumer Price Index (CPI), decreased to 4.9% on an annual basis in April from 5.0% in March (forecasted at 5.0%), while the monthly core inflation remained unchanged at 0.4%.
It may have seemed that this situation would finally prompt the Federal Reserve (Fed) to start easing its monetary policy. However, based on recent statements by officials, the regulator does not intend to do so. For instance, Neel Kashkari, President of the Federal Reserve Bank of Minneapolis, stated that although inflation has softened slightly, it still significantly exceeds the target level of 2.0%. Kashkari agreed that a banking crisis could be a source of economic slowdown. However, he believed that the labour market remains sufficiently strong.
Following the head of the Minneapolis Fed, Federal Reserve representative Michelle Bowman also confirmed the regulator's reluctance to change course towards a more dovish stance. According to Bowman, "inflation is still too high" and "the interest rate will need to remain sufficiently restrictive for some time." Moreover, Bowman added that there is no certainty that the current policy is "sufficiently restrictive to bring down inflation," and if inflation remains high and the labor market remains tight, additional rate hikes are likely to be appropriate.
Similar conclusions have been reached by many analysts. For example, according to experts from Commerzbank, "given the slow decline in inflation, which remains well above the target level, the Fed is unlikely to consider the possibility of lowering the key rate this autumn.".
The market reacted to the prospects of maintaining (and possibly further increasing) the interest rate with a rise in the dollar. The strengthening of the American currency could have been even more significant if not for the banking crisis and the issue of the US debt ceiling.
A hawkish stance from the European Central Bank (ECB) could have aided the euro and reversed EUR/USD to the upside. However, after the May meeting of the European regulator, it appears that the end of monetary restraint is near. It is quite possible that the rate hike in June will be the last. "At this point, the ECB can only surprise with a dovish tone. [...] Euro bulls should be prepared for this," warn economists from Commerzbank.
The final note of the past week for EUR/USD was set at 1.0849. As for the near-term prospects, at the time of writing this review on the evening of May 12, the majority of analysts (65%) believe that the dollar has become too overbought, and it's time for the pair to correct to the upside. Only 15% expect further strengthening of the dollar, while the remaining 20% hold a neutral position. In terms of technical analysis, among the oscillators on the daily chart (D1), 90% are coloured red (although one-third of them are signalling the pair's oversold condition), with only 10% in green. Among the trend indicators, there are more green ones, 35%, while red ones account for 65%. The nearest support for the pair is located around 1.0800-1.0835, followed by 1.0740-1.0760, 1.0675-1.0710, 1.0620, and 1.0490-1.0530. Bulls will encounter resistance around 1.0865, followed by 1.0895–1.0925, 1.0985, 1.1090-1.1110, 1.1230, 1.1280, and 1.1355-1.1390.
The upcoming week will be quite eventful with important economic events. On Tuesday, May 16, we will see retail sales data from the United States and the ZEW Economic Sentiment indicator from Germany. Additionally, preliminary GDP data for the Eurozone for Q1 will be published on the same day. On Wednesday, May 17, inflation data (CPI) for the Eurozone will be released. Thursday, May 18th, will bring a series of US statistics, including unemployment data, manufacturing activity, and the US housing market. Furthermore, speeches by ECB President Christine Lagarde are expected on May 16 and May 19. The week will conclude with a speech by Federal Reserve Chair Jerome Powell on the last working day.
GBP/USD: BoE and GDP Upset Investors
The bulls managed to push GBP/USD higher until Thursday. Although the forecast suggested that the Bank of England (BoE) would raise the interest rate by 25 basis points at its meeting on May 11, investors were hopeful for a miracle: what if it's not 25, but 50? However, the miracle did not happen, and after reaching a high of 1.2679, the pair reversed and started to decline.
The decline continued the next day. The strengthening dollar played a role, and mixed preliminary GDP data for the UK added to the negative sentiment. The country's economy grew by 0.1% in Q1 2023, which fully matched the forecast and the growth in Q4 2022. On an annual basis, GDP increased by 0.2%, which, although in line with the forecast, was significantly lower than the previous value of 0.6%. However, in monthly terms, the GDP showed an unexpected contraction of -0.3% in March, against expectations of 0.1% growth and a previous value of 0.0%. Despite the optimistic statement by UK Chancellor of the Exchequer Jeremy Hunt that this was "good news" as the economy is growing, it did not help the pound. It was evident that the growth occurred only in January, stalled in February, and began to contract in March.
Economists at Commerzbank note that the indecisiveness of the Bank of England (BoE) in combating inflation is a negative factor for the pound. "Future data will be crucial for the BoE's next rate decision," Commerzbank states. "If a swift decline in inflation becomes evident, as expected by the BoE, they are likely to refrain from further rate hikes, which will put pressure on the sterling."
Strategists at Internationale Nederlanden Groep (ING) also believe that the rate hike on May 11 may be the last. However, they add that "the Bank of England has maintained flexibility and left the door open for further rate hikes if inflation proves to be persistent."
The plunge on May 11 and 12 resulted in GBP/USD failing to hold above the strong support level of 1.2500, and the week ended at 1.2447. However, according to 70% of experts, the bulls will still attempt to reclaim this support level. 15% believe that 1.2500 will now turn into resistance, pushing the pair further downward. The remaining 15% preferred to refrain from making forecasts. Among the oscillators on the daily chart (D1), 60% recommend selling (with 15% indicating oversold conditions), 20% are inclined towards buying, and 20% are neutral. Among the trend indicators, the balance between red and green is evenly split at 50%.
The support levels and zones for the pair are at 1.2390-1.2420, 1.2330, 1.2275, 1.2200, 1.2145, 1.2075-1.2085, 1.2000-1.2025, 1.1960, 1.1900-1.1920, and 1.1800-1.1840. In the event of an upward movement, the pair will encounter resistance at levels of 1.2500, 1.2540, 1.2570, 1.2610-1.2635, 1.2675-1.2700, 1.2820, and 1.2940.
There are several notable events on the calendar in the upcoming week. The Inflation Report hearing will take place on Monday, May 15. Data on the UK labor market will be released on Tuesday, May 16. And the Governor of the Bank of England, Andrew Bailey, is scheduled to speak on Wednesday, May 17.
USD/JPY: Yen as a Shelter from Financial Storms
The yen was the worst-performing currency in the DXY basket in April. USD/JPY soared to a height of 137.77 on the ultra-dovish statements of the new Governor of the Bank of Japan (BoJ), Kadsuo Ueda. However, after that, the yen, acting as a safe haven, was aided by the banking crisis in the United States, causing the pair to reverse downwards.
As for Japanese banks, Ueda stated on Tuesday, May 9 that "the impact of recent bankruptcies of American and European banks on Japan's financial system is likely to be limited" and that "financial institutions in Japan have sufficient capital reserves." Assurances of the stability of the country's financial system were also expressed by the Minister of Finance, Shunichi Suzuki.
Currency strategists at HSBC, the largest British bank, continue to believe that the Japanese yen will strengthen further, aided by its status as a "safe haven" amidst the banking crisis and US debt issues. According to their analysis, the yen may also strengthen because the current review by the Bank of Japan does not exclude changes in its yield curve control (YCC) policy, even if it happens slightly later than previously expected. The shift in the BoJ's course could be influenced by the fact that core inflation in Japan remained stable in March, and excluding energy prices, it accelerated to a 41-year high of 3.8%. However, when comparing this level with similar indicators in the US, EU, or the UK, it is difficult to consider it a significant problem.
Meanwhile, analysts at Societe Generale, a French bank, believe that considering yield dynamics, geopolitical uncertainty, and economic trends, USD/JPY may "get stuck in narrow ranges for some time." However, they also mention that the sense that the dollar is overvalued, and the anticipation of the Bank of Japan's actions will not be easy to dismiss. The perception that the yen's recovery is only a matter of waiting for actions by the Bank of Japan lingers.
The next meeting of the Bank of Japan (BoJ) is scheduled for June 16. Only then will it become clear whether or not there will be any changes in the monetary policy of the Japanese central bank. Until that day, the USD/JPY exchange rate will likely depend largely on events in the United States.
The pair concluded the past week at 130.72. Regarding its immediate prospects, analysts' opinions are divided as follows. At present, 75% of analysts have vote for the strengthening of the Japanese currency. 15% of experts expect an upward movement, while the same percentage remains neutral. Among the oscillators on the daily chart (D1), the balance leans toward the dollar, with 65% indicating an upward trend, 20% remaining neutral, and the remaining 15% showing a downward direction. Among the trend indicators, the balance of power is 90% in favour of the green zone. The nearest support level is located in the range of 134.85-135.15, followed by levels and zones at 134.40, 133.60, 132.80-133.00, 132.00, 131.25, 130.50-130.60, 129.65, 128.00-128.15, and 127.20. The resistance levels and zones are at 135.95-136.25, 137.50-137.75, 139.05, and 140.60.
As for economic data releases, the preliminary GDP data for Japan's Q1 2023 will be announced on Wednesday, May 17. However, there are no other significant economic information expected to be released concerning the Japanese economy in the upcoming week.
CRYPTOCURRENCIES: Bitcoin Hopes for a Banking Crisis
Bitcoin has been under selling pressure for the eighth consecutive week but continues to attempt to hold within the strong support/resistance zone of $26,500. The past week once again did not bring joy to investors. As noted by WhaleWire, transaction fees within the bitcoin ecosystem reached global highs for the third time in history (similar to what was observed in 2017 and 2021). The average network speed does not exceed 7 transactions per second. As a result, those wishing to make transfers increase the amount of the transaction fee to expedite its execution. This caused the average fee on May 8 to soar to $31 per transaction. This was very frustrating for users but welcomed by miners, as for the first time since 2017, fees surpassed block rewards.
Some operators, including Binance, were unprepared for this and did not adjust the fees in time for users. Hundreds of thousands of transactions got stuck in the mempool. In order to speed up their "clearing," the largest cryptocurrency exchange suspended withdrawals twice and increased the transfer fee. The situation was exacerbated by an investigation launched by US authorities against Binance. According to Bloomberg reports, the exchange is suspected of violating sanctions related to Russia due to its invasion of Ukraine.
Panic sentiment was further heightened by the news that the cryptocurrency exchange Bittrex filed for bankruptcy on the same day, May 8 (although this procedure is expected to only affect its US subsidiary). The problems faced by Binance and Bittrex reminded investors of the FTX crash. All of this has instilled fear, uncertainty, and doubt (FUD) among participants in the crypto market, leading to a decrease in the number of active addresses to yearly lows. Bitcoin experienced a sharp decline against this backdrop.
BTC is forming a "head and shoulders" pattern on the daily chart. A trader and analyst known as Altcoin Sherpa suggested that the price of the leading cryptocurrency may soon drop to $25,000. According to his analysis, this price level coincides with the 200-day EMA, the 0.382 Fibonacci level, and has previously been tested as support/resistance. The possibility of a deeper correction, down to the $24,000 level, cannot be ruled out. However, experts at CoinGape point out that the supply of bitcoins on centralized platforms is at its lowest level since 2017. They believe this indicates that the upcoming correction may have a local character.
The strengthening of the US dollar last week also played against bitcoin. However, hopes that the banking crisis in the US will continue to support the digital market are still in the air. For many cryptocurrency enthusiasts, bitcoin is considered a safe haven and a store of value similar to physical gold, protecting against loss of funds.
The tightening of monetary policy by the Federal Reserve has reduced the value of certain assets on banks' balance sheets and decreased demand for banking services. Therefore, the likelihood of new disruptions in the traditional financial sector remains quite high. Four US banks (First Republic Bank, Silicon Valley Bank, Signature Bank, and Silvergate Bank) have filed for bankruptcy, and a dozen more are facing difficulties. According to surveys by the Gallup polling agency, half of US citizens are concerned about the safety of their funds in bank accounts.
Robert Kiyosaki, the author of the bestseller Rich Dad Poor Dad, often emphasizes that challenging times lie ahead for the US and global economy. This time, he addressed his 2.4 million Twitter followers, stating that the sharp increase in the yield of one-month US Treasury bills indicates that a recession may be approaching. He questioned whether this implies that the global banking system is collapsing and advised people to focus on gold, silver, and bitcoins. It is worth noting that Kiyosaki has previously predicted that the price of bitcoin will soon rise to $100,000.
Michael Van de Poppe, an analyst, trader, and founder of the consulting platform EightGlobal, conducted a detailed analysis of the relationship between the banking sector and the crypto market. The stocks of American banks reacted with a decline to an attempt by Jerome Powell, the head of the US Federal Reserve, to calm the financial markets. Within a few hours after the official's speech on May 3, shares of PacWest Bancorp fell by almost 58%, and Western Alliance by more than 28%. Other credit institutions such as Comerica (-10.06%), Zion Bancorp (-9.71%), and KeyCorp (-6.93%) experienced a decline as well.
Using a 30-minute chart, Van de Poppe demonstrated that while banks were falling in price, bitcoin and gold were rising. According to the founder of EightGlobal, there is growing uncertainty and distrust among bankers towards the statements made by government officials. Such sentiments may lead to further problems in traditional markets and contribute to the continued growth of digital and physical gold.
Warren Buffett, the billionaire investor, remains steadfastly sceptical of the flagship cryptocurrency, bitcoin. At the annual Berkshire Hathaway shareholders' meeting, Buffett stated that while people may lose faith in the dollar, it does not mean that bitcoin can become the world's reserve currency. In response to this, James Ryan, the founder of Six Sigma Black Belt, pointed out that Buffett does not believe in gold either, as he believes the precious metal does not produce anything and does not generate cash flow.
By the way, Warren Buffett may be right about gold. According to research by DocumentingBTC, an investor who invested exactly $100 in physical gold ten years ago would now have only $134 in their account. But if they had invested in digital gold, they would have $25,600! That's why bitcoin is considered the best investment of the decade.
Second are NVIDIA stocks, which would have grown to $8,599. The honourable third spot goes to Tesla with an investment growth from $100 to $4,475. Apple investors could have gained $1,208, Microsoft - $1,111, Netflix - $1,040, Amazon - $830, Facebook - $818, and investing in Google stocks would have yielded $504 in the present.
To further justify the hopes of bitcoin enthusiasts, technically bitcoin needs to rise above $28,900, test $30,400, and firmly fix above the $31,000 level. However, at the time of writing this review on Friday evening, May 12, BTC/USD is trading at $26,415. The total market capitalization of the crypto market stands at $1.108 trillion ($1.219 trillion a week ago). The Crypto Fear & Greed Index has decreased from 61 to 49 points over the past seven days, moving from the Greed zone to the Neutral zone.
Dollar, Yen, and Swiss Franc Lead Currency Markets, Suggestive of Risk Aversion
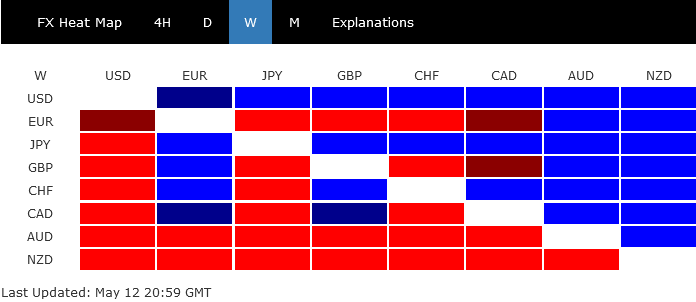
In the currency markets last week, Dollar, Yen, and Swiss franc Emerged as the standout performers. Conversely, New Zealand and Australian dollars lagged, painting a picture suggestive of risk aversion within the markets. However, this sentiment has not yet manifested itself in the stock markets, at least not with major American and European indices. It's yet to be determined whether these developments in the currency markets are a precursor to trends in other sectors.
Euro and sterling also found themselves on the weaker side of the spectrum. Despite persistently hawkish comments from ECB officials, the common currency was relatively unmoved. The Pound maintained a cautious stance throughout most of the week until comments from BoE Governor concerning the possibility of a pause, following the anticipated 25-basis point rate hike, sent it into a tumble. Despite these fluctuations, the Canadian Dollar held its own, ending the week on a mixed note.
Dollar jumped sharply higher with multidimensional push
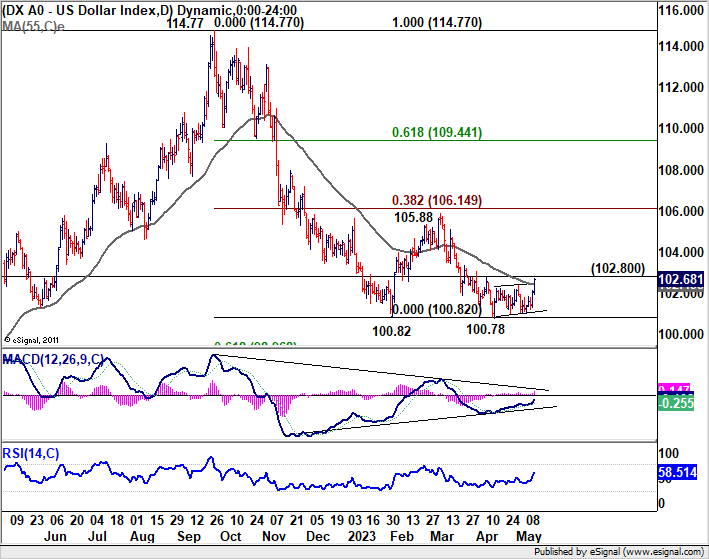
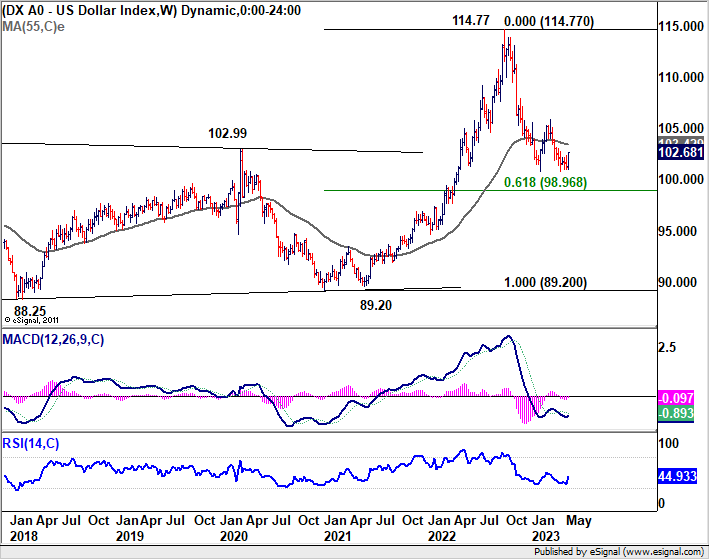
Dollar demonstrated a commanding rally as the week drew to a close, with Dollar Index finishing on a high note at 102.68. Some near-term bullish developments are notable in the greenback's performance, including breaking of near-term resistance against Euro. This suggests the potential for further upside in Dollar, although this remains contingent on developments across multiple fronts.
The factors behind Dollar's rally were seen as multi-dimensional by some analysts. Concerns about stagflation took center stage after last week's data releases. At the same time, the market is also grappling with risk-off sentiment related to ongoing regional banking issues and debt ceiling. Moreover, there is growing apprehension regarding a weakening Chinese economy, with the risk of an increasing decoupling from the US and EU economies.
Domestically, on the one hand, initial jobless claims rose notably to 264k in the week ending May 6, a level not seen since October 2021. Additionally, University of Michigan consumer sentiment index fell sharply from 63.5 to 57.7 in May, hitting its lowest level since last November, falling far short of expectations.
On the other hand, University of Michigan five-year inflation expectations rose from 3.0% to 3.2%, marking a 12-year high since 2011. One-year inflation expectations just slightly decreased from 4.6% to 4.5%. Meanwhile, import prices increased by 0.4% mom in April, marking the first rise since December 2022.
These data suggest that while impact of prior tightening is beginning to be felt in the economy, Fed is far from being in a position to cut interest rates in the near future. There might even be a need for another rate hike.
From a technical standpoint, break of 55 D in Dollar Index is a near term bullish signal. Immediate focus is now on 102.80 resistance in the coming days. Decisive break there should confirm completion of the entire decline from 105.88 at 100.78, just ahead of 100.82 low. Further rise should then be seen back towards 105.88 resistance during the rest of the quarter.
However, even if this bullish scenario materializes, it's too early to call for trend reversal in DXY. Current rise from 100.78 is more likely to be just the third leg of the pattern from 100.82. Strong resistance is expected from 38.2% retracement of 114.77 to 100.82 at 106.14, which should limit upside, at least on the first attempt.
Risk aversion lurks on the horizon, NASDAQ and 10-year yield look vulnerable
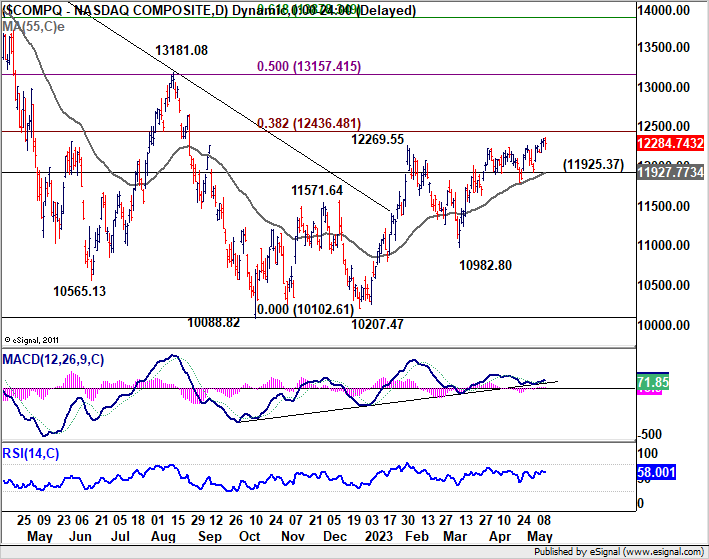
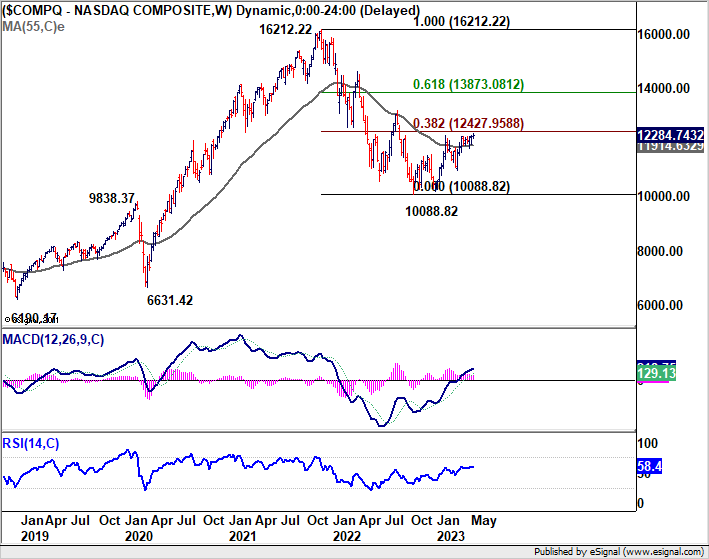
While risk aversion isn't currently overt in US markets, the sharp rebound in the Dollar could be a potential precursor to an overall sentiment shift. Market movements in the coming days are thus expected to draw significant attention.
NASDAQ made slight gains last week, closing at 12284.74, but its momentum has been rather tepid. The pattern from 10088.82 appears more corrective than impulsive, suggesting that upside could be capped by 38.2% retracement of 16212.22 to 10088.82 at 12427.95. This level could mark the completion of the overall corrective rebound, or at the very least, trigger a pullback. A break below 11925.37 support level would confirm initial rejection by 12427.95 level and trigger a more significant downturn towards 10982.80 support.
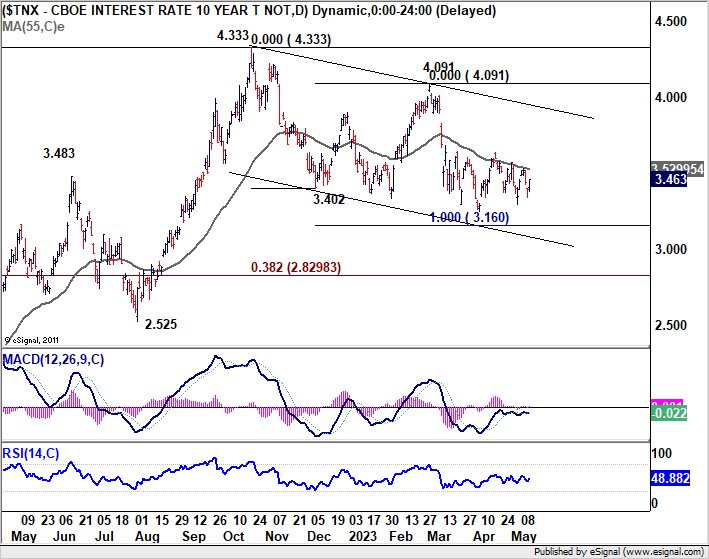
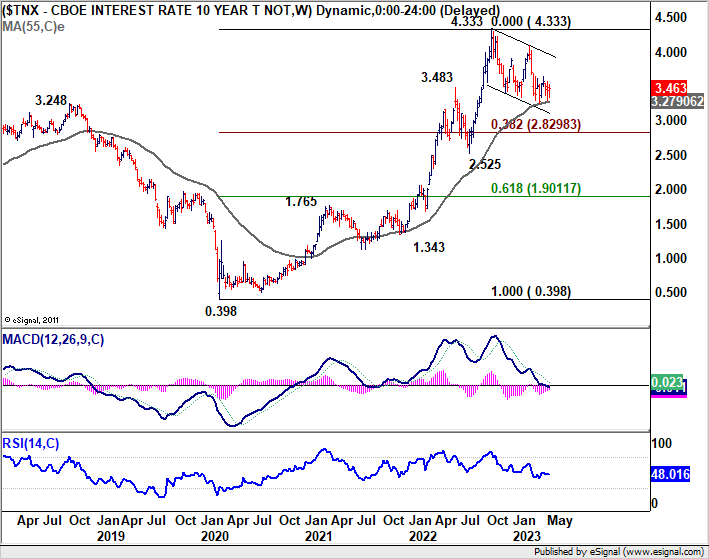
Meanwhile, 10-year yield experienced a dip to 3.345, before promptly recovering to close at 3.463. The multiple rejections by 55 D EMA (now at 3.529) is a clear near term bearish sign. This suggests the fall from 4.333 is yet to reach its nadir. Deeper decline is in favor to 100% projection of 4.333 to 3.402 from 4.091 at 3.160. Judging from recent intermarket actions, mild decline in TNX might not be too much a drag on Dollar, but rather a lift to Yen.
However, in an unexpected case of a firm break of 3.160, and sustained trading below 55 W EMA (now at 3.279), TNX could accelerate to the downside through 3% handle. Such a scenario could signal significant turbulence in risk markets, warranting heightened caution.
China's post-lockdown rebound stalled, SSE and CNH vulnerable
Recent data from China suggested that the post-lockdown rebound had been modest at best. April data showed unexpected sharp contraction of -7.9% yoy in imports. That could be a signal of lackluster domestic demand, which is reflected in the mere 0.1% yoy rise in CPI in the month. But placed alongside the latest contractionary reading in PMI manufacturing, that could be seen even worse as a result of global supply chain reshuffling.
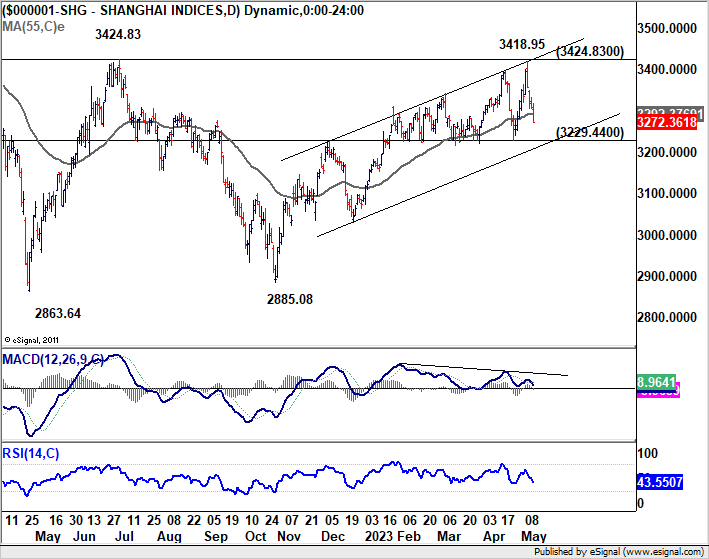
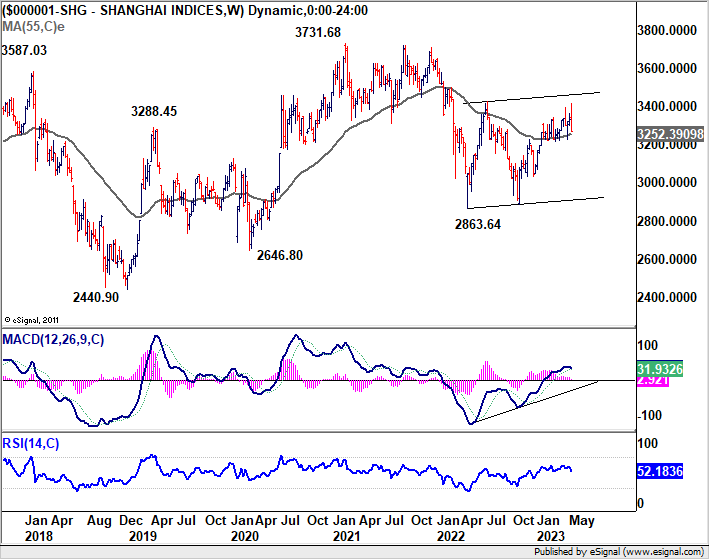
China Shanghai SSE reversed after initial rally to 3418.95. Friday's steep fall might be exaggerated by the cautious sentiment ahead of G7 finance minister meeting in Japan. But there is risk of developing into a more persistent near-term decline.
Immediate focus will be on 3229.4 support in SSE in the coming days. Decisive break there would suggest topping at 3418.95, ahead of 3424.83 resistance, on bearish divergence condition in D MACD. If materializes, that could also be mean firm break of 55 W EMA (now at 3252.39). Adding to that, the whole corrective pattern might have completed with three waves to 3418.95. Even in a less bearish scenario, deeper fall would then be likely back towards 2863.64 low.
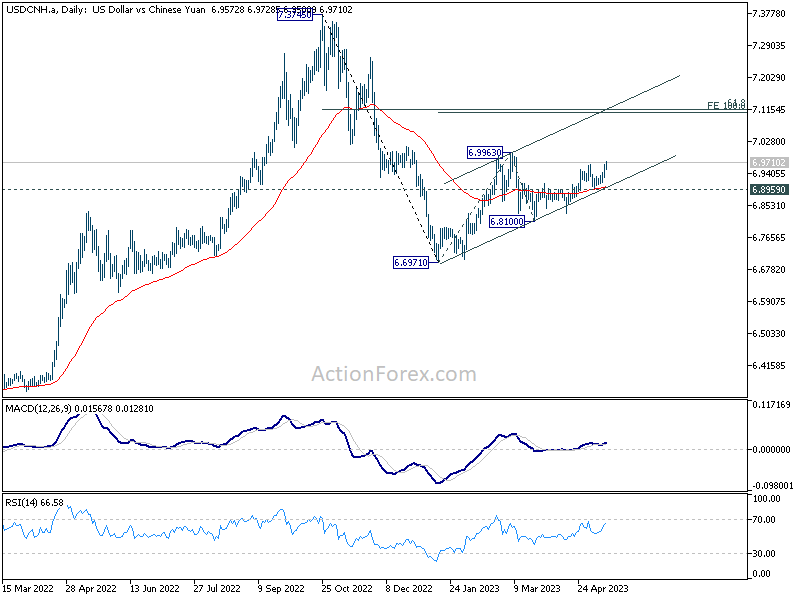
USD/CNH resumed the rally from 0.6810 last week, partly on strength in Dollar and partly on weakness of Yuan. Prior support from 55 D EMA is a near term bullish sign. Further rise is expected as long as 0.6859 support holds, back to 6.9963.
It should be noted 6.9963 might be a big hurdle to overcome given the risk of intervention by China at 7.0000 psychological. But a firm break there would be a nod by the authority to let Yuan depreciation further. USD/CNH could then target cluster resistance at around 7.1 (100% projection of 6.6971 to 6.9963 from 6.8100 at 7.1092, 61.8% retracement of 7.3745 to 6.6971 at 7.1157).
AUD/USD and NZD/USD ready for down trend resumption?
Both Australian and New Zealand Dollars emerged as the week's biggest losers, each impacted to varying degrees by the increasingly pessimistic view on economy of China. Australian dollar was notably affected by plummeting copper price, which touched its lowest level for the year. Meanwhile, New Zealand dollar was burdened by declining consumer inflation expectations.
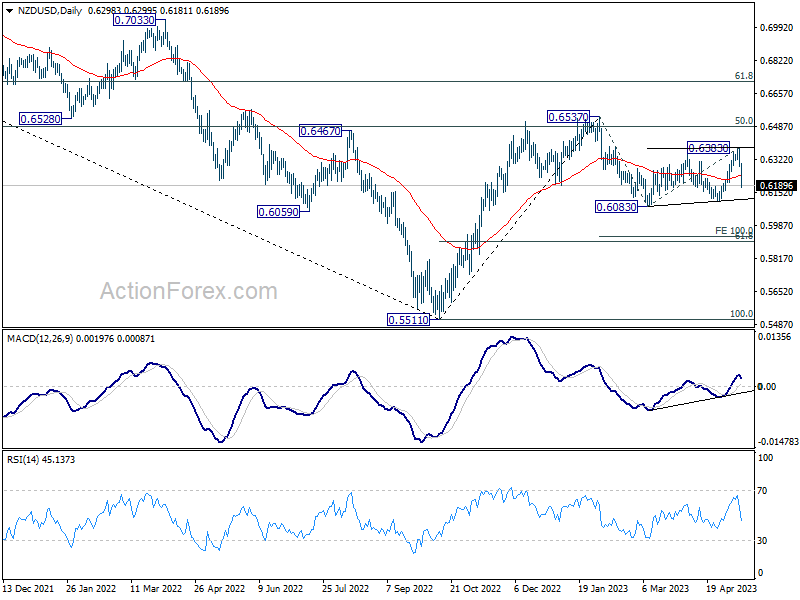
Notably, technical developments in AUD/USD and NZD/USD pairs showed some similarities. The steep decline in NZD/USD suggests that consolidation pattern from 0.6083 might have concluded with three waves to 0.6383. The near-term focus is now set on 0.6083 low. Decisive break from this level would confirm resumption of the whole downtrend from 0.6537. Next target will be 100% projection of 0.6537 to 0.6083 from 0.6383 at 0.5929, which is close to 61.8% retracement of 0.5511 to 0.6537 at 0.5903.
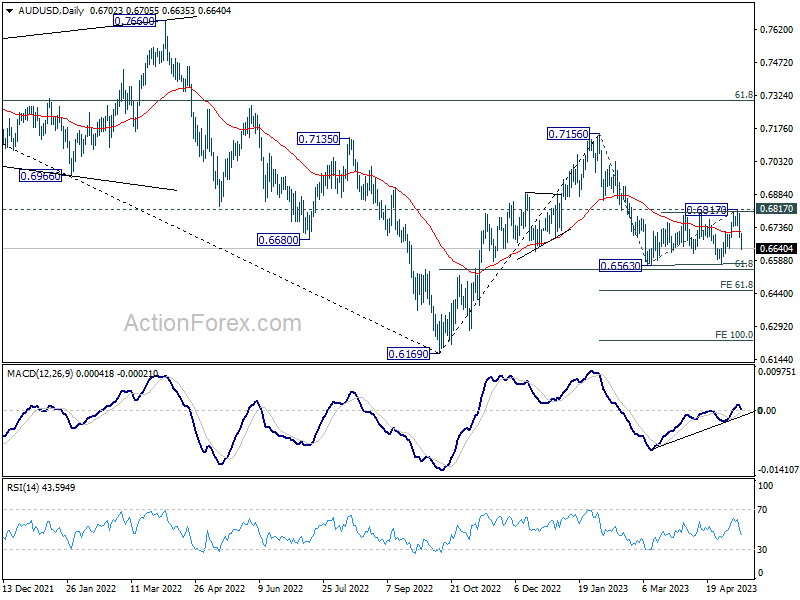
AUD/USD outlook is somewhat similar but carries a more negative tone. Consolidation from 0.6563 may have ended with three waves to 0.6817. Retest of 0.6563 support could be imminent. Decisive break of this level should drive AUD/USD to 61.8% projection of 0.7156 to 0.6563 from 0.6817 at 0.6451 at least.
EUR/USD Weekly Outlook
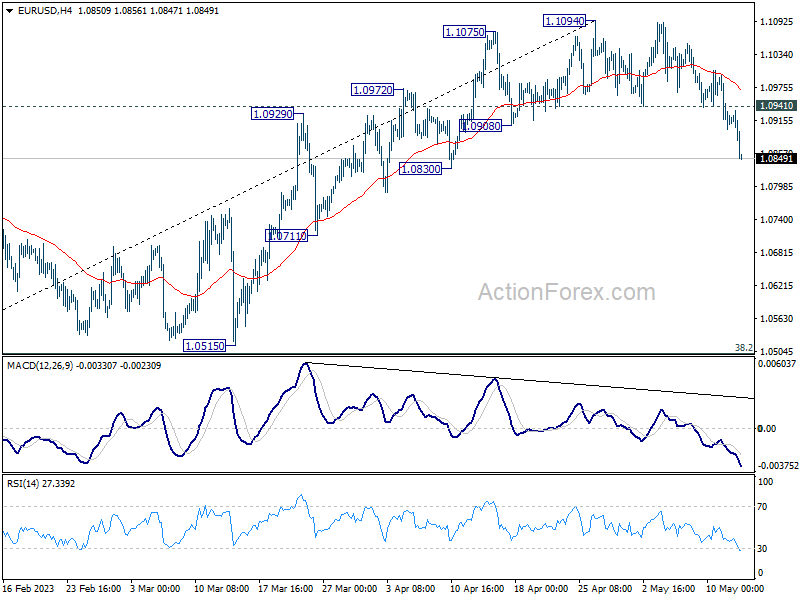
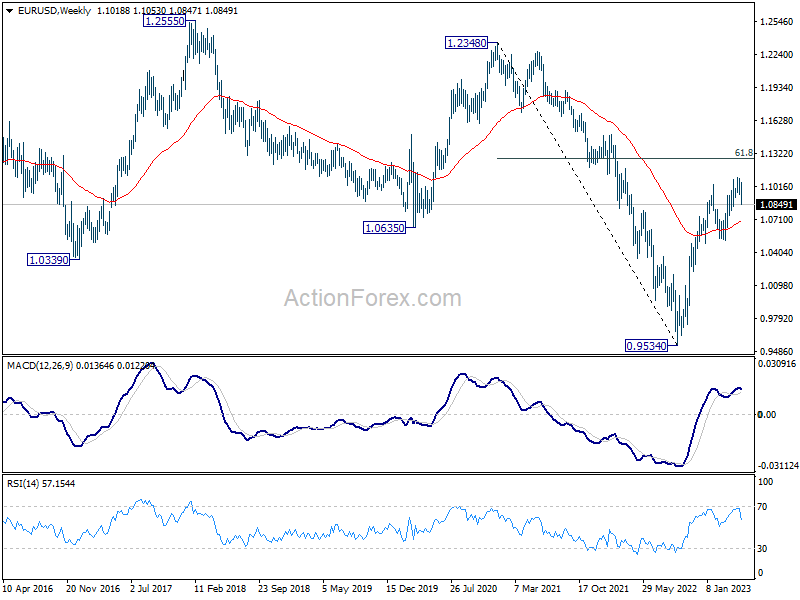
EUR/USD reversed after failing to break through 1.1094 resistance last week, and break of 1.0908 support confirmed short term topping. More importantly, considering bearish divergence condition in D MACD and break of 55 D EMA (now at 1.0880), it's possibly in correction to whole up trend from 0.9534 already. Initial bias stays on the downside this week for 1.0515 cluster support, 38.2% retracement of 0.9534 to 1.1094 at 1.0498. On the upside, though, above 1.0941 resistance will turn bias back to the upside for retesting 1.1094 high.
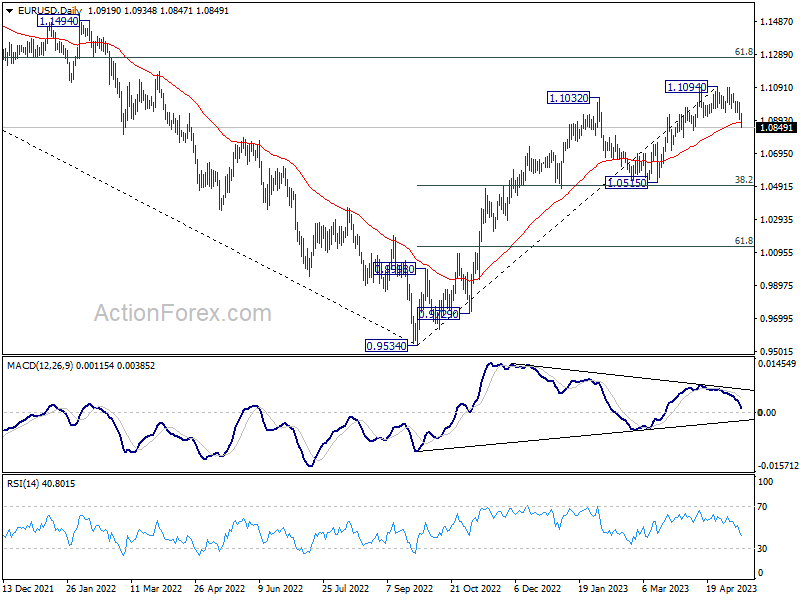
In the bigger picture, as long as 1.0515 support holds, rise from 0.9534 (2022 low) would still extend higher. Sustained break of 61.8% retracement of 1.2348 (2021 high) to 0.9534 at 1.1273 will solidify the case of bullish trend reversal and target 1.2348 resistance next (2021 high).
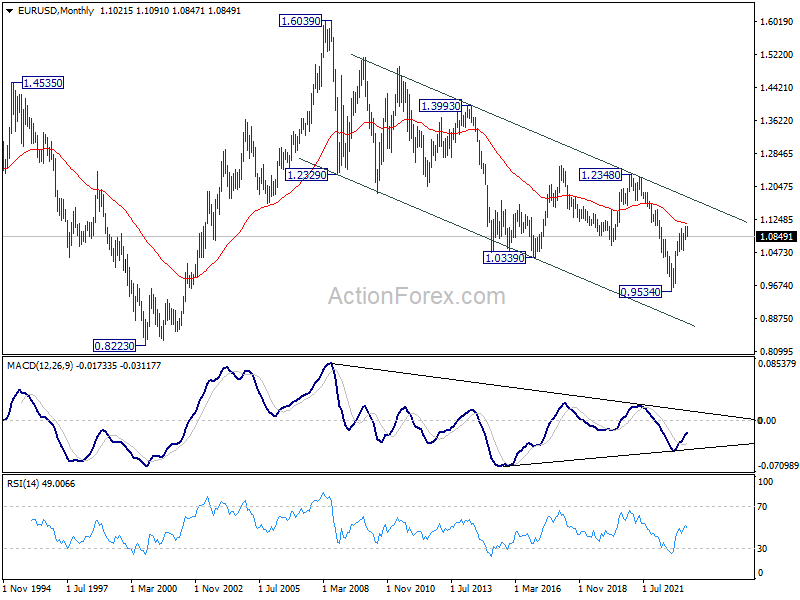
In the long term picture, while it's still early to call for long term trend reversal at this point, the strong break of 1.0635 support turned resistance (2020 low) should at least turn outlook neutral. Focus is now on 55 M EMA (now at 1.1156). Rejection by this EMA will revive long term bearishness. However, sustained break above here will be an indication underlying bullishness and target 1.2348 resistance next.
EUR/USD Weekly Outlook
EUR/USD reversed after failing to break through 1.1094 resistance last week, and break of 1.0908 support confirmed short term topping. More importantly, considering bearish divergence condition in D MACD and break of 55 D EMA (now at 1.0880), it's possibly in correction to whole up trend from 0.9534 already. Initial bias stays on the downside this week for 1.0515 cluster support, 38.2% retracement of 0.9534 to 1.1094 at 1.0498. On the upside, though, above 1.0941 resistance will turn bias back to the upside for retesting 1.1094 high.
In the bigger picture, as long as 1.0515 support holds, rise from 0.9534 (2022 low) would still extend higher. Sustained break of 61.8% retracement of 1.2348 (2021 high) to 0.9534 at 1.1273 will solidify the case of bullish trend reversal and target 1.2348 resistance next (2021 high).
In the long term picture, while it's still early to call for long term trend reversal at this point, the strong break of 1.0635 support turned resistance (2020 low) should at least turn outlook neutral. Focus is now on 55 M EMA (now at 1.1156). Rejection by this EMA will revive long term bearishness. However, sustained break above here will be an indication underlying bullishness and target 1.2348 resistance next.
USD/JPY Weekly Outlook
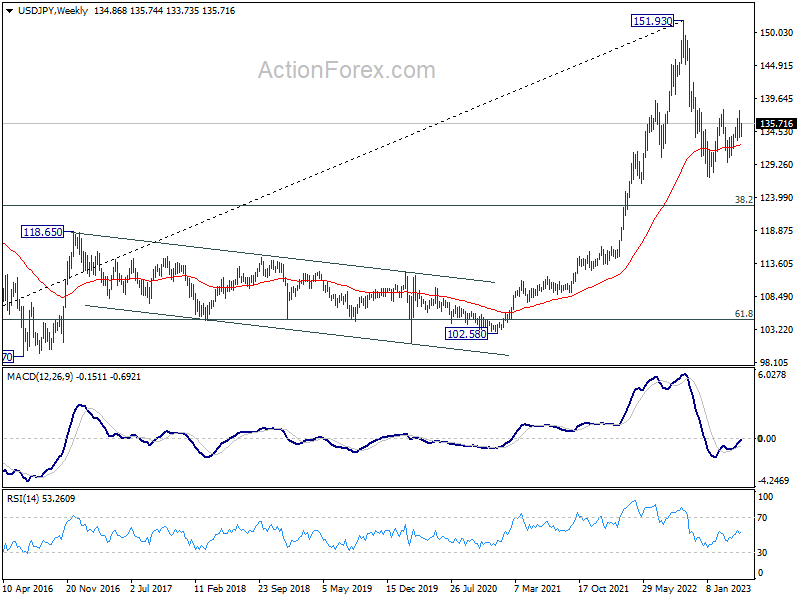
USD/JPY rebounded last week after support from near term rising trend line. The development suggests that pull back from 137.76 has completed. Initial bias is now back on the upside for retesting 137.76/90 resistance zone. Nevertheless, on the downside, break of 137.73 will resume the fall from1 37.76 through 133.00 instead.
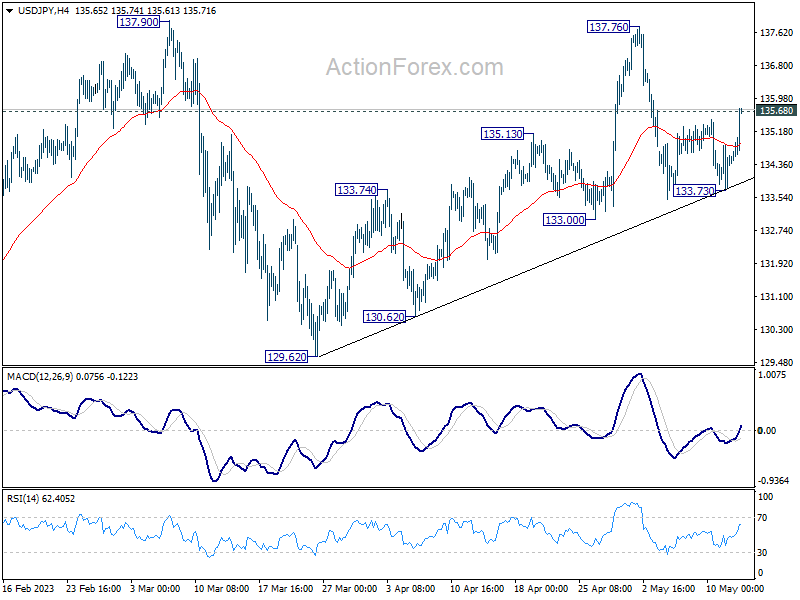
In the bigger picture, price actions from 151.93 high are currently seen as a corrective pattern to the long term up trend. The first leg should have completed at 127.20. Rebound from there is seen as the second leg. Sustained break of 38.2% retracement of 151.93 to 127.20 at 136.34 will bring stronger rise to 61.8% retracement at 142.48. Meanwhile, break of 129.62 will argue that the third leg is starting through 127.20 low.
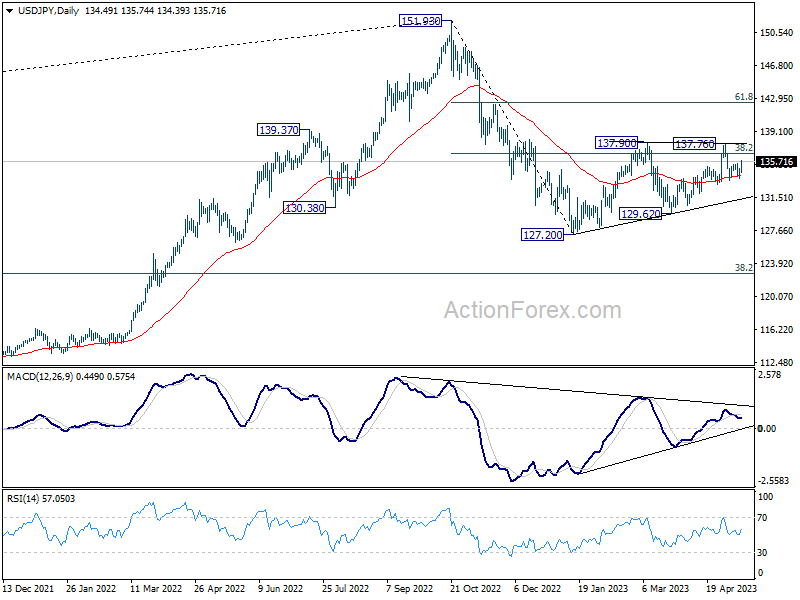
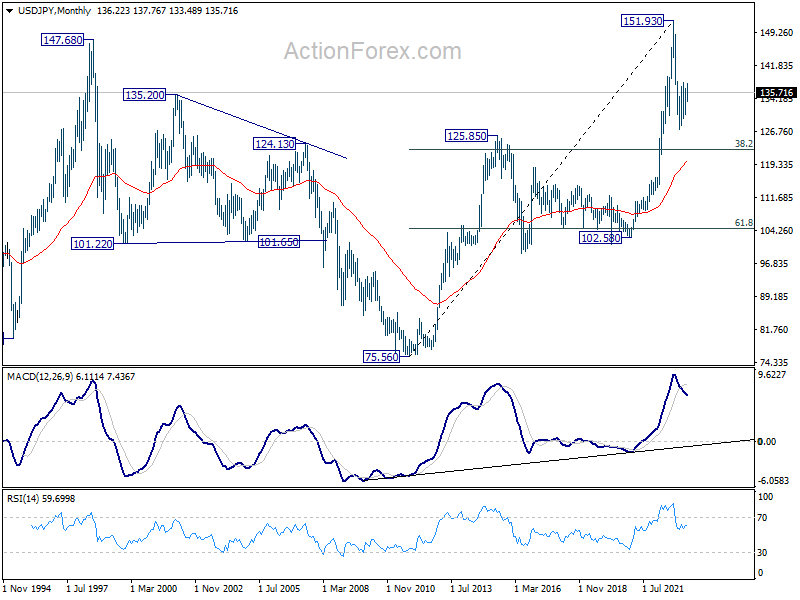
In the long term picture, price action from 151.93 is seen as developing into a corrective pattern to up trend from 75.56 (2011 low). While deeper decline cannot be ruled out, downside should be contained by 38.2% retracement of 75.56 to 151.93 at 122.75.
GBP/USD Weekly Outlook
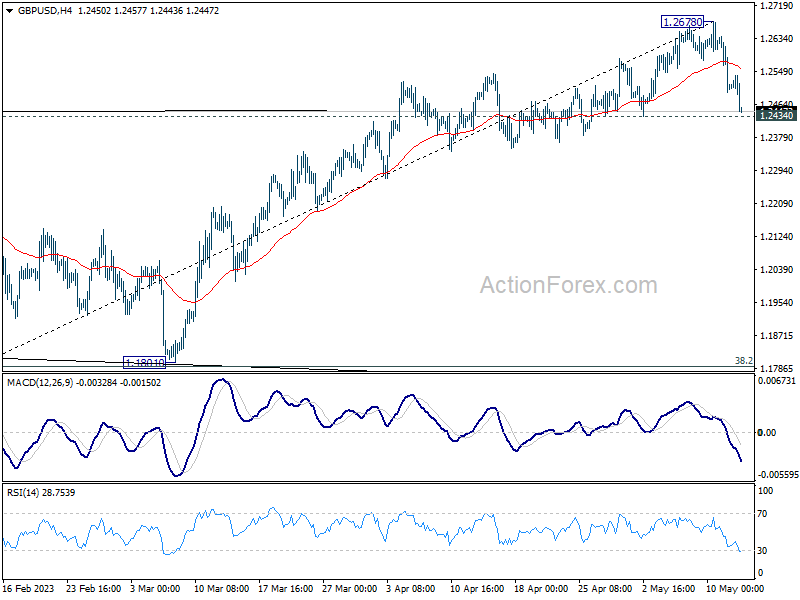
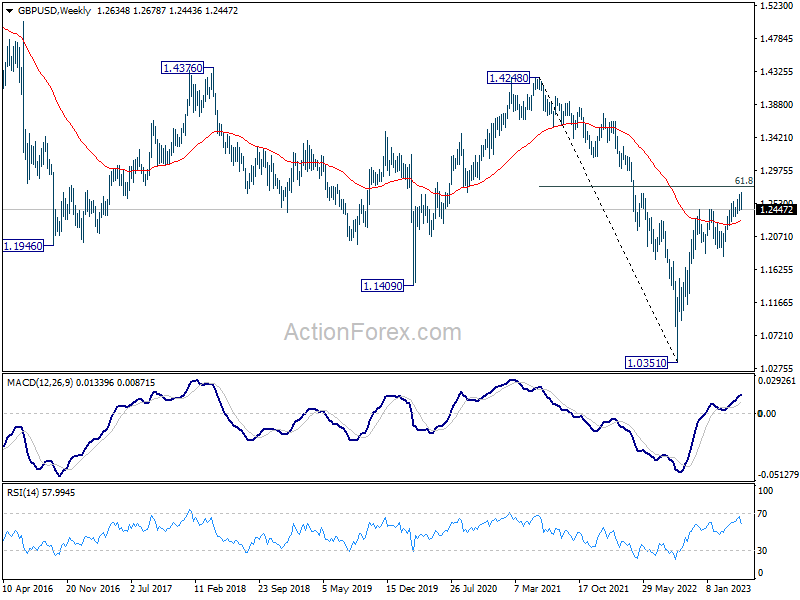
GBP/USD dropped sharply after edging higher to 1.2678 last week, but stays above 1.2434 support so far. Initial bias remains neutral this week first. On the downside, decisive break of 1.2434 will confirm short term topping. Considering bearish divergence condition in D MACD, fall from 1.2678 would then be a correction to whole up trend from 1.0351. Deeper decline should then be seen back towards 1.1801 cluster support (38.2% retracement of 1.0351 to 1.2678 at 1.1789).
In the bigger picture, as long as 1.1801 support holds, rise from 1.0351 medium term bottom (2022 low) is expected to extend further. Sustained break of 61.8% retracement of 1.4248 (2021 high) to 1.0351 at 1.2759 will add to the case of long term bullish trend reversal. However, firm break of 1.1801 will indicate rejection by 1.2759, and bring deeper decline, even as a correction.
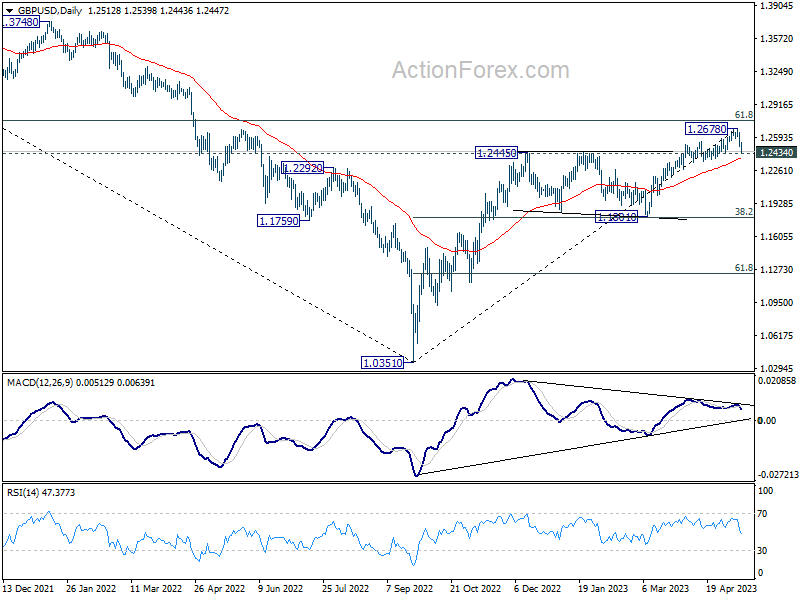
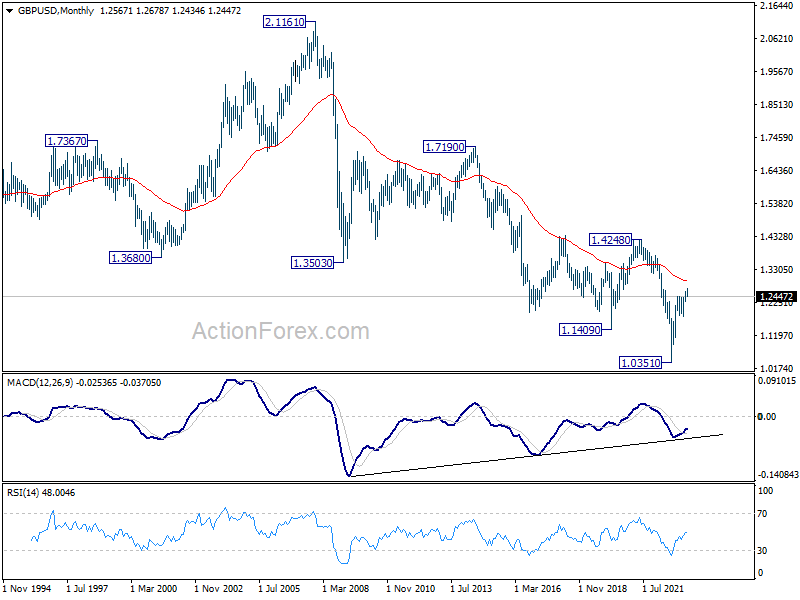
In the long term picture, while the rise from 1.0351 (2022 low) has been strong, there is no clear indicate of long term trend reversal yet. As long as 1.4248 resistance holds (2021 high), long term outlook will remain neutral at best.
USD/CHF Weekly Outlook
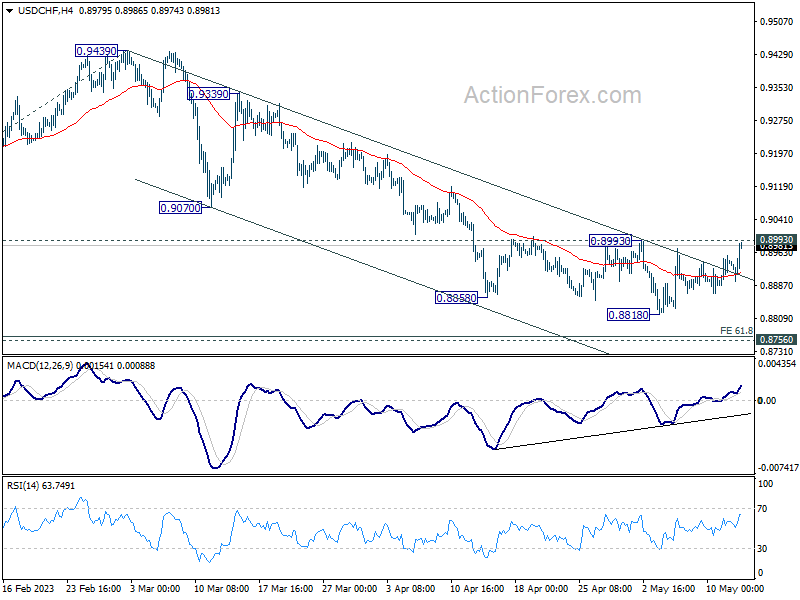
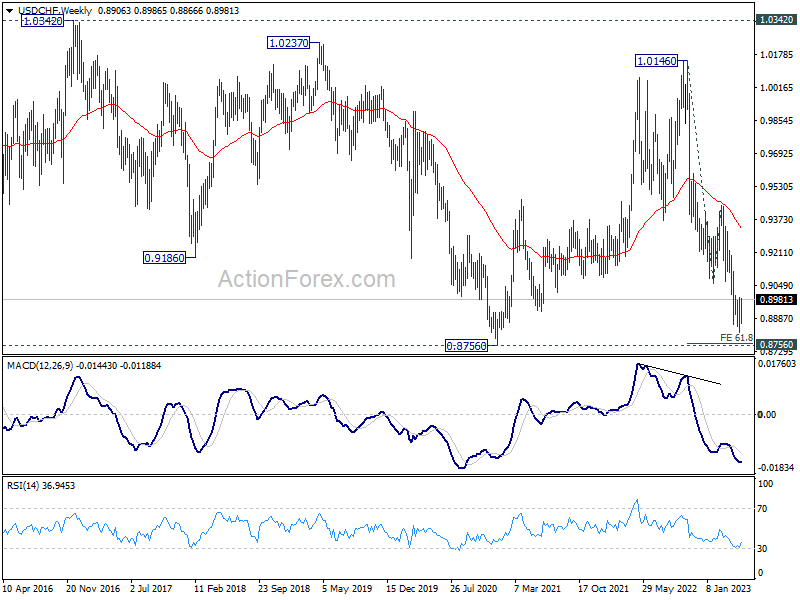
USD/CHF stayed in range above 0.8818 last week and outlook is unchanged. Initial bias stays neutral this week first. on the upside, firm break of 0.8993 resistance will confirm short term bottoming, on bullish convergence condition in 4H MACD. Intraday bias will be turned back to the upside for 55 D EMA (now at 0.9052) and possibly above. In case of another fall, strong support should be seen from 61.8% projection of 1.0146 to 0.9058 from 0.9439 at 0.8767, which is close to 0.8756 long term support, to bring rebound.
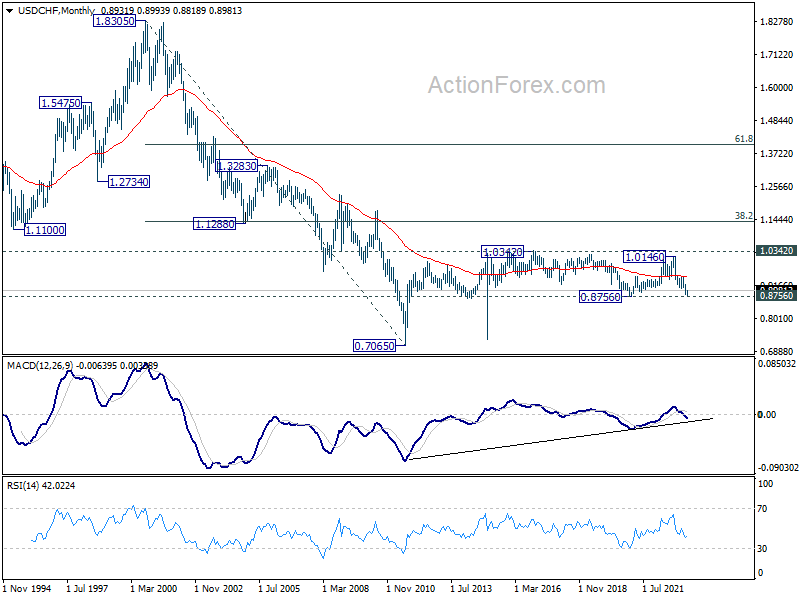
In the bigger picture, fall from 1.1046 (2022 high) is seen as a leg in the long term range pattern from 1.0342 (2016 high). So, downside should be contained by 0.8756 to bring reversal. Sustained break of 0.9058 support turned resistance will be the first sign of medium term bottoming. However, decisive break of 0.8756 will carry larger bearish implications.
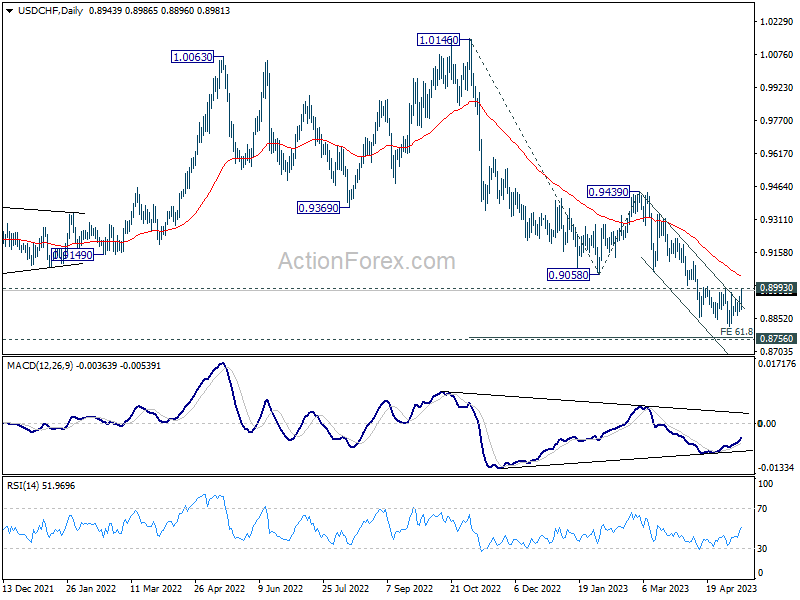
In the long term picture, long term sideway pattern from 1.0342 (2016 high) is expected to continue between 0.8756/1.0342. However, sustained break of 0.8756 will open up deeper fall back towards 0.7065 (2011 low).
AUD/USD Weekly Report
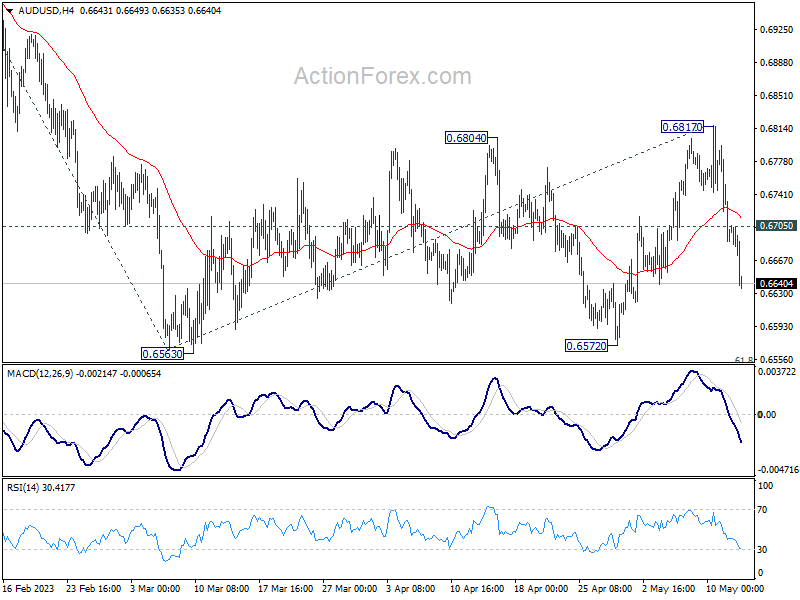
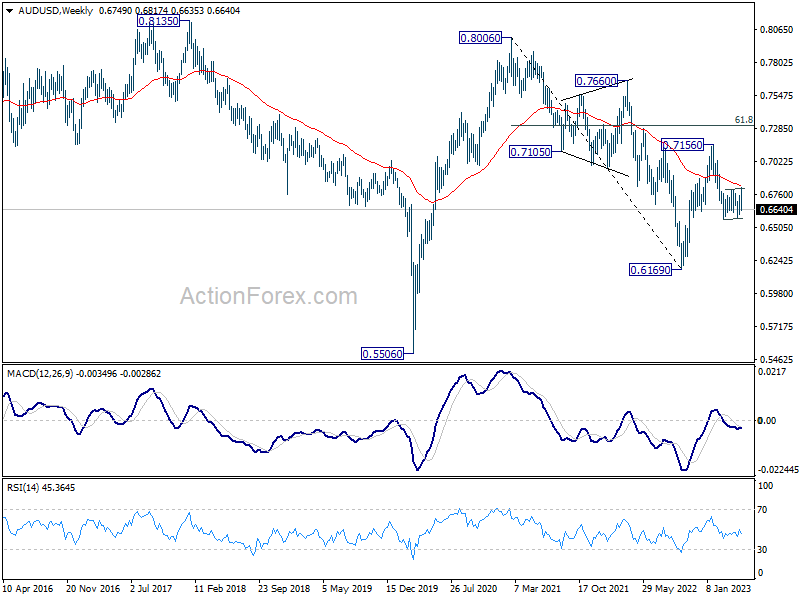
AUD/USD reversed after breaching 0.6804 to 0.6817 last week, and fell sharply to close at 0.6640. The development suggests that consolidation pattern from 0.6563 has completed with three waves to 0.6817. Initial bias remains on the downside this week for retesting 0.6563. Decisive break there will resume larger decline from 0.7156 to 61.8% projection of 0.7156 to 0.6563 from 0.6817 at 0.6451. On the upside, above 0.6705 minor resistance will delay the bearish case and turn intraday bias neutral first.
In the bigger picture, the failure to break through 55 W EMA (now at 0.6853) keeps medium term outlook bearish. Firm break of 61.8% retracement of 0.6169 to 0.7156 at 0.6546 will raise the chance of long term down trend resumption through 0.6169 low. This will now be the favored case as long as 0.6817 resistance holds.
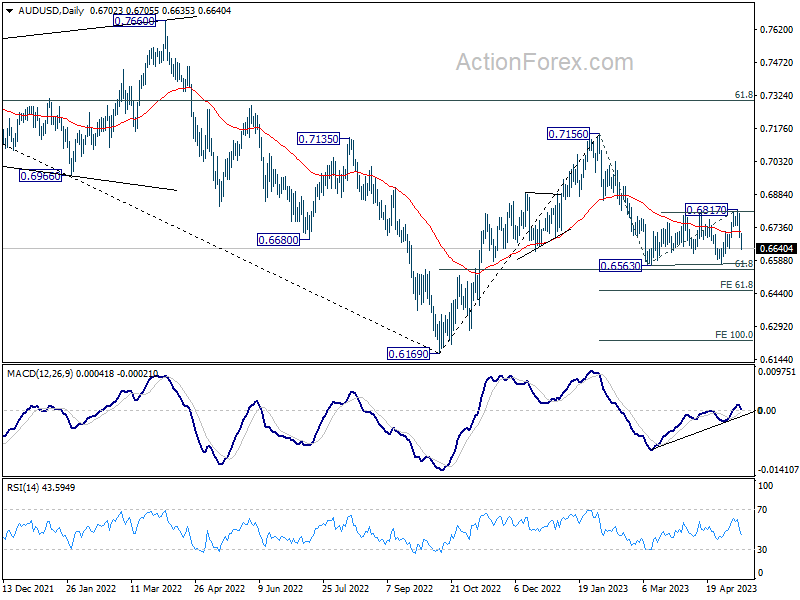
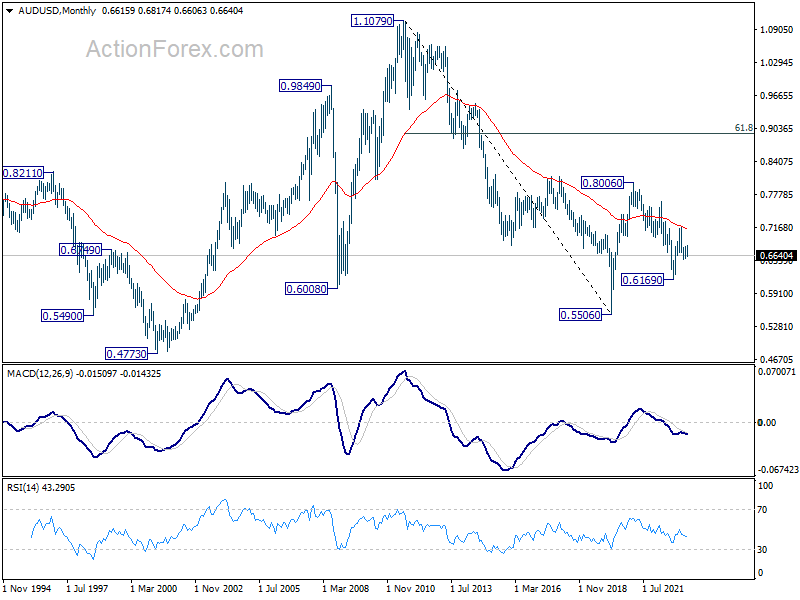
In the long term picture, initial rejection by 55 M EMA (now at 0.7128) retains long term bearishness. That is, down trend from 1.1079 (2011 high) could still resume through 0.5506 (2020 low) on resumption.
USD/CAD Weekly Outlook
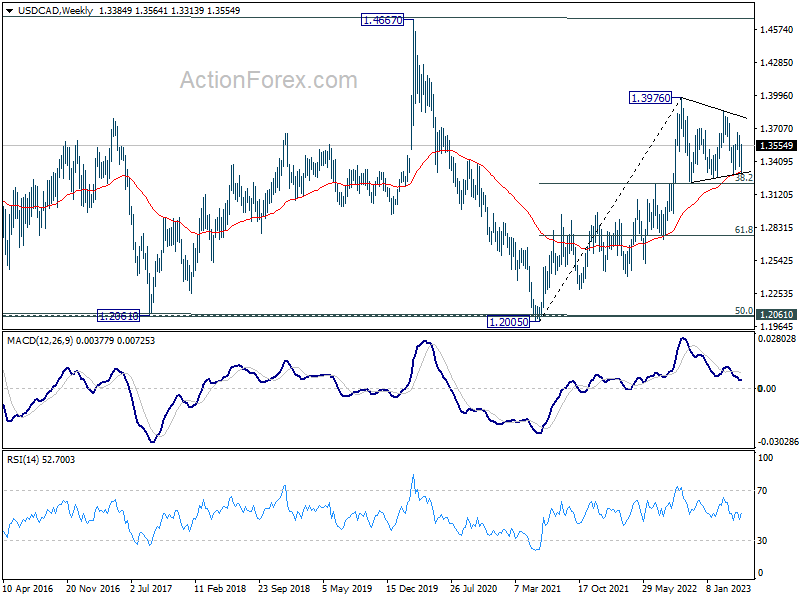
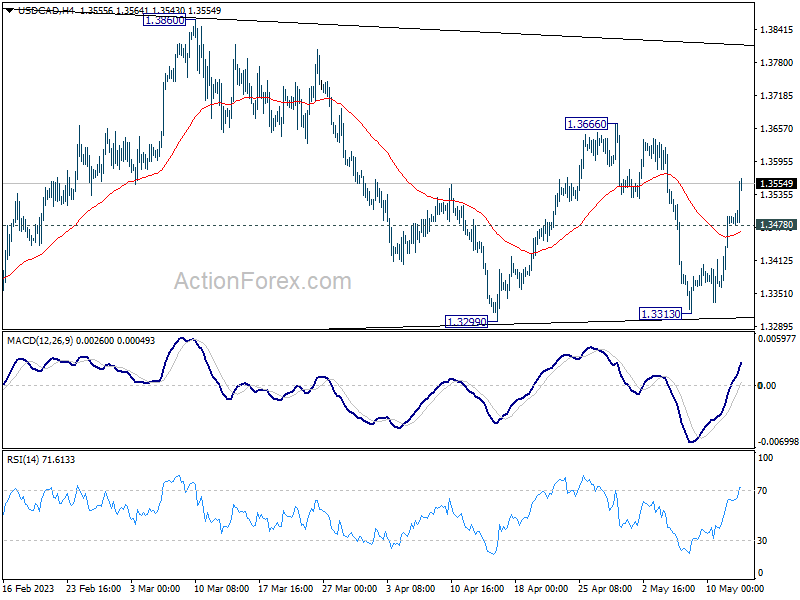
USD/CAD rebounded strongly ahead of 1.3299 support, after hitting 55 W EMA. The development suggests that it's possibly in another leg inside the triangle pattern from 1.3976. Initial bias is now mildly on the upside for 1.3666 resistance. Break there will target 1.3860 resistance next. On the downside, though, below 1.3478 minor support will turn intraday bias neutral instead.
In the bigger picture, as long as 55 W EMA (now at 1.3321) holds, up trend from 1.2005 (2021 low) is still in favor to resume through 1.3976 at a later stage. However, sustained trading below the EMA and 38.2% retracement of 1.2005 to 1.3976 at 1.3233 will raise the chance of bearish reversal. Deeper should then be seen to 61.8% retracement at 1.2758 next.
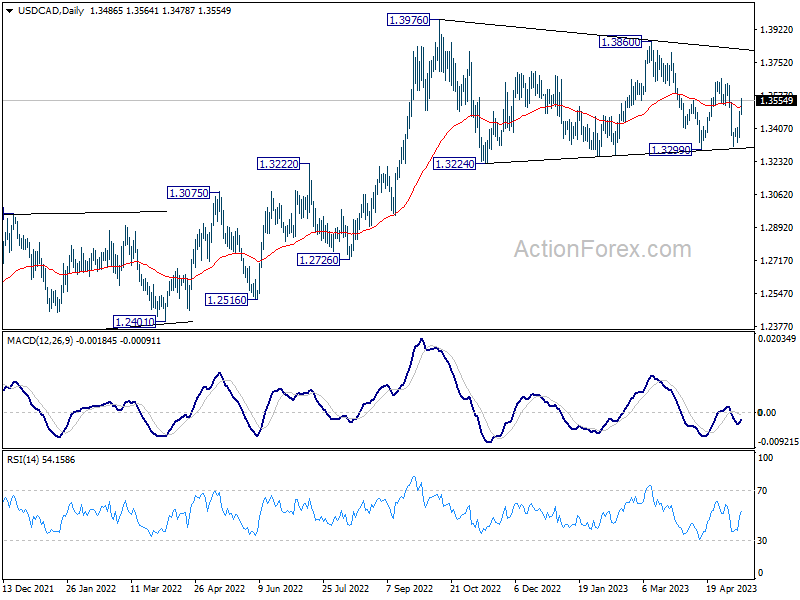
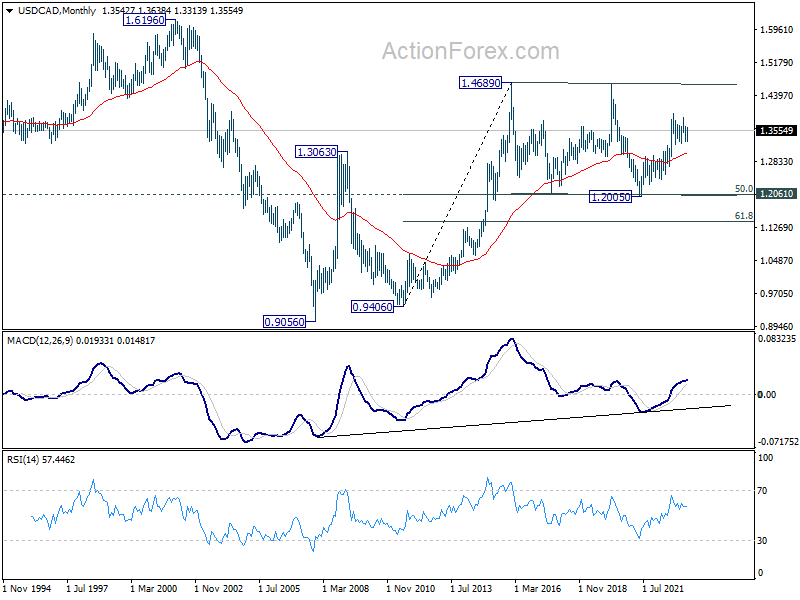
In the longer term picture, price actions from 1.4689 (2016 high) are seen as a consolidation pattern only, which might have completed at 1.2005. That is, up trend from 0.9506 (2007 low) is expected to resume at a later stage. This will remain the favored case as 55 M EMA (now at 1.3031) holds.