

Sample Category Title
AUD/USD Daily Report
Daily Pivots: (S1) 0.6617; (P) 0.6661; (R1) 0.6687; More...
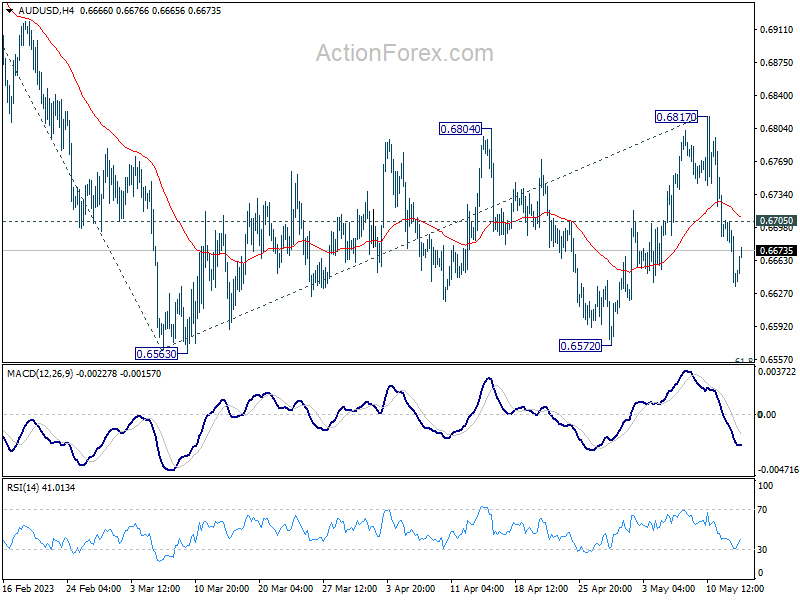
Intraday bias in AUD/USD stays on the downside for now despite today's recovery. Consolidation pattern from 0.6563 could have completed with three waves to 0.6817. Deeper fall should be seen to retest 0.6563 low. Decisive break there will resume larger decline from 0.7156 to 61.8% projection of 0.7156 to 0.6563 from 0.6817 at 0.6451. On the upside, above 0.6705 minor resistance will delay the bearish case and turn intraday bias neutral first.
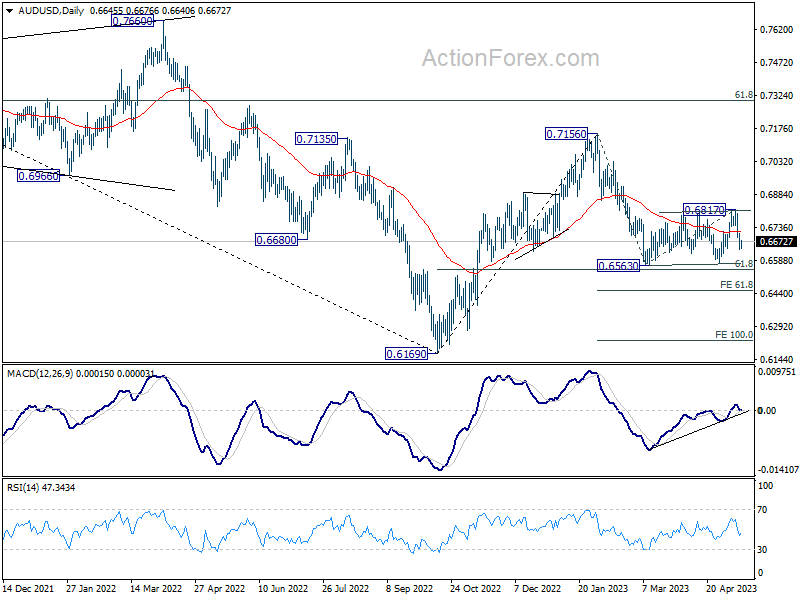
In the bigger picture, the failure to break through 55 W EMA (now at 0.6822) keeps medium term outlook bearish. Firm break of 61.8% retracement of 0.6169 to 0.7156 at 0.6546 will raise the chance of long term down trend resumption through 0.6169 low. This will now be the favored case as long as 0.6817 resistance holds.
EUR/USD Daily Outlook
Daily Pivots: (S1) 1.0820; (P) 1.0878; (R1) 1.0907; More...
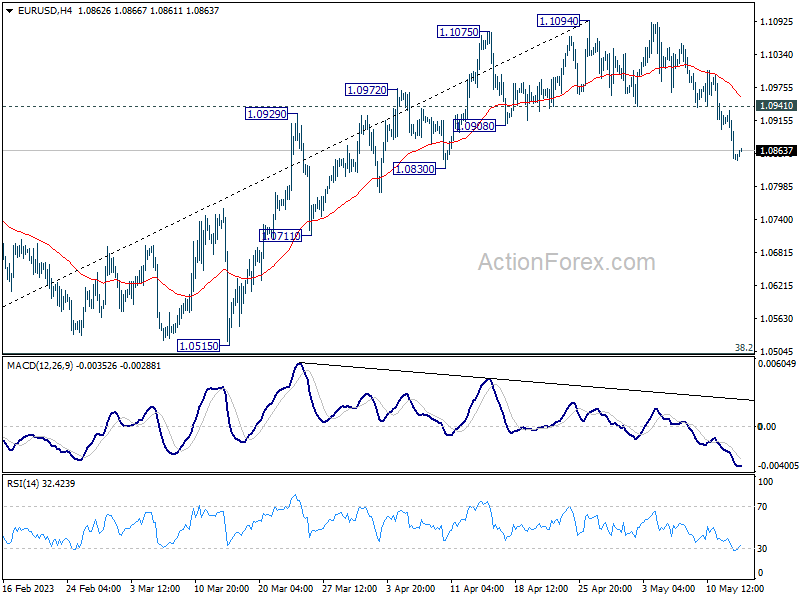
Intraday bias in EUR/USD stays on the downside for the moment. Fall from 1.1094 short term top is seen as correcting whole up trend from 0.9534. Deeper decline would be seen to 1.0515 cluster support, 38.2% retracement of 0.9534 to 1.1094 at 1.0498. On the upside, though, above 1.0941 resistance will turn bias back to the upside for retesting 1.1094 high.
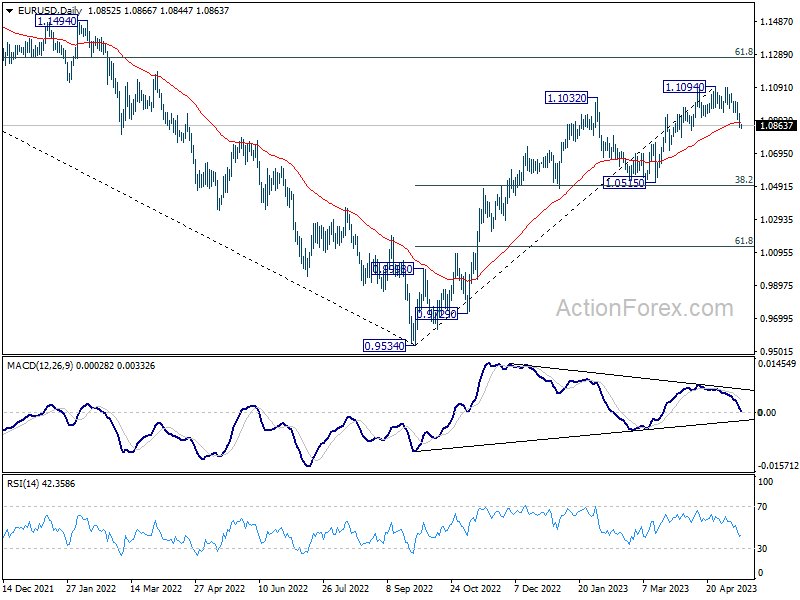
In the bigger picture, as long as 1.0515 support holds, rise from 0.9534 (2022 low) would still extend higher. Sustained break of 61.8% retracement of 1.2348 (2021 high) to 0.9534 at 1.1273 will solidify the case of bullish trend reversal and target 1.2348 resistance next (2021 high).
GBP/USD Daily Outlook
Daily Pivots: (S1) 1.2415; (P) 1.2478; (R1) 1.2511; More...
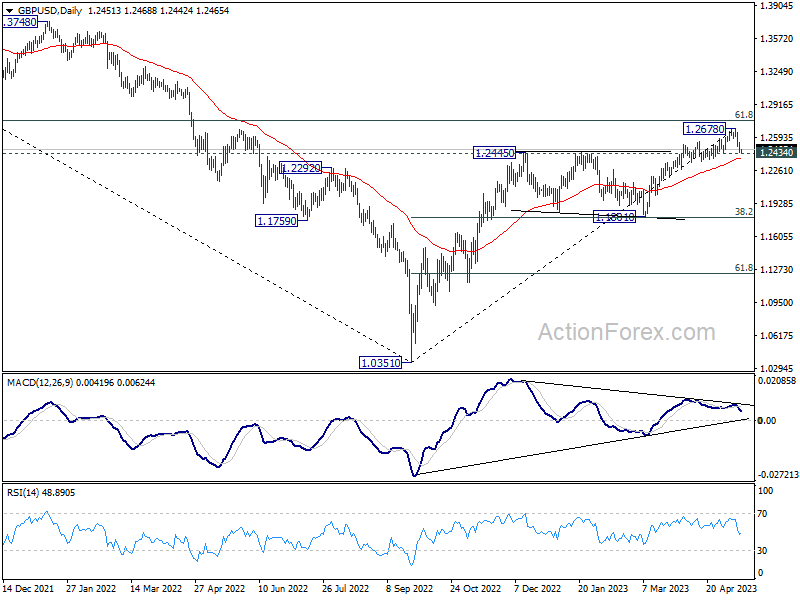
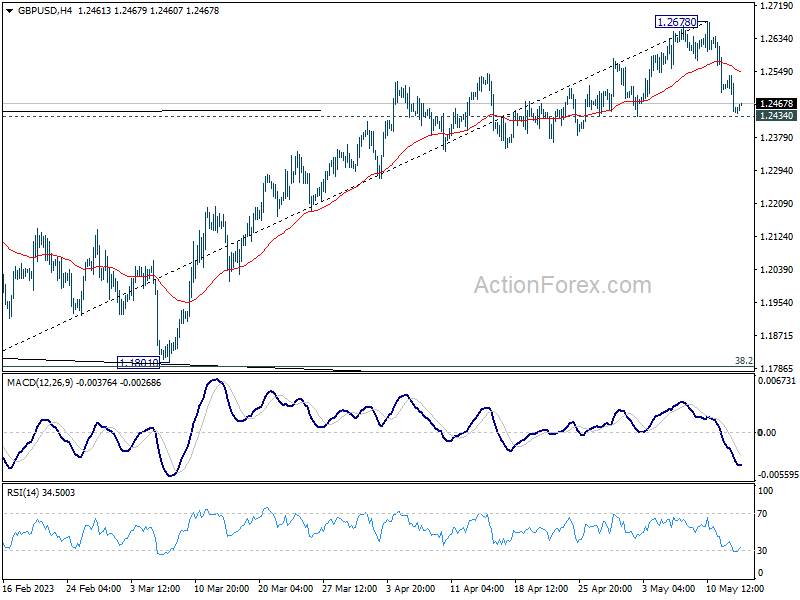
Intraday bias in GBP/USD remains neutral with focus on 1.2434 support. Firm break there will confirm short term topping at 1.2678, on bearish divergence condition in 4H MACD. Intraday bias will be back on the downside for 1.1801 cluster support (38.2% retracement of 1.0351 to 1.2678 at 1.1789), as correction to whole up trend from 1.0351. On the upside, however, break of 1.2678 will resume larger up trend from 1.0351 instead.
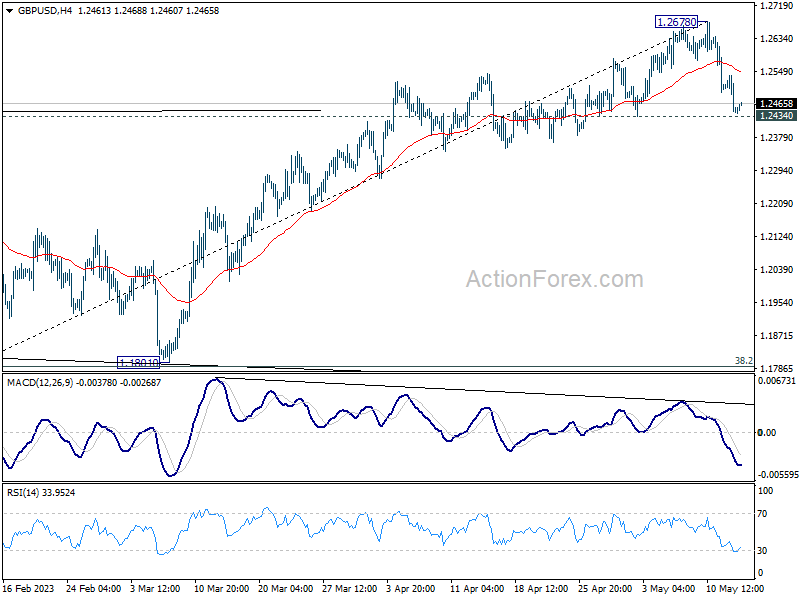
In the bigger picture, as long as 1.1801 support holds, rise from 1.0351 medium term bottom (2022 low) is expected to extend further. Sustained break of 61.8% retracement of 1.4248 (2021 high) to 1.0351 at 1.2759 will add to the case of long term bullish trend reversal. However, firm break of 1.1801 will indicate rejection by 1.2759, and bring deeper decline, even as a correction.
USD/JPY Daily Outlook
Daily Pivots: (S1) 134.85; (P) 135.30; (R1) 136.20; More...
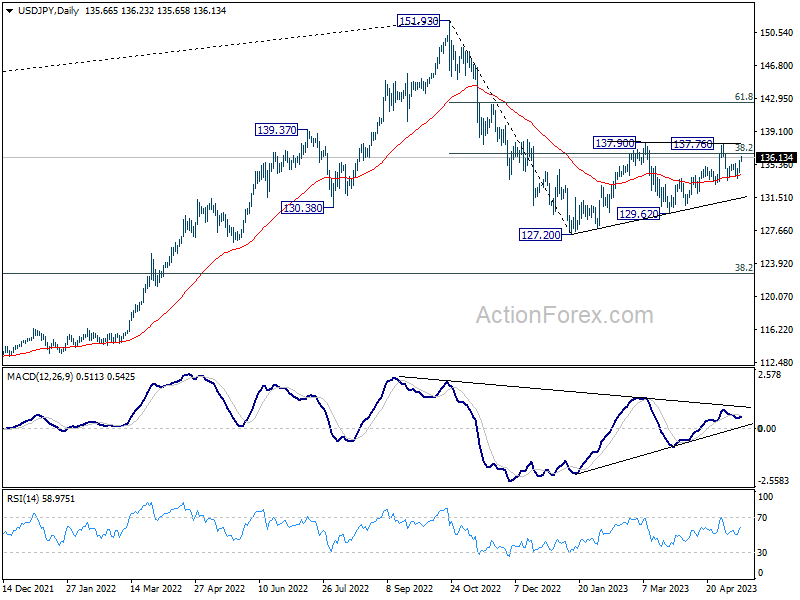
Intraday bias in USD/JPY remains on the upside at this point. Pull back from 137.76 should have completed at 133.73. Further rise would be seen for retesting 137.76/90 resistance zone. Decisive break there will resume whole rebound from 127.20. On the downside, break of 133.73 will resume the fall from 137.76 through 133.00 instead.
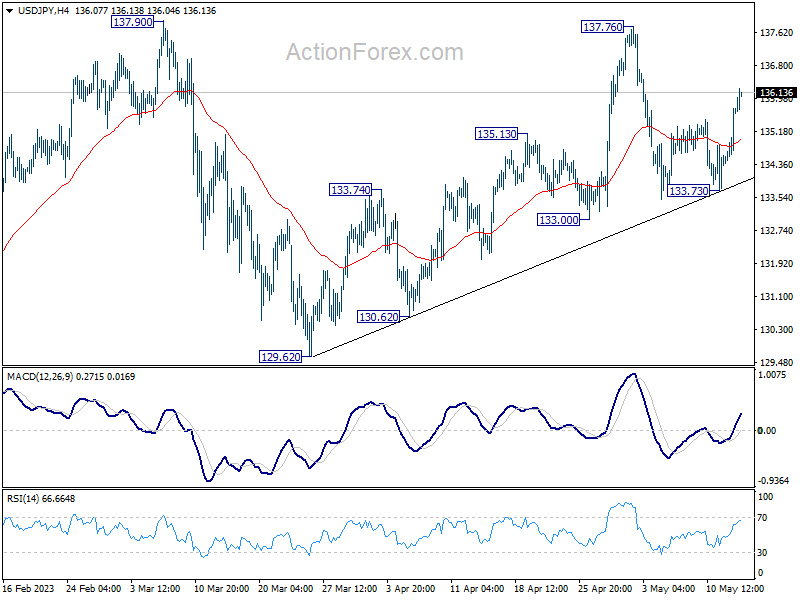
In the bigger picture, price actions from 151.93 high are currently seen as a corrective pattern to the long term up trend. The first leg should have completed at 127.20. Rebound from there is seen as the second leg. Sustained break of 38.2% retracement of 151.93 to 127.20 at 136.34 will bring stronger rise to 61.8% retracement at 142.48. Meanwhile, break of 129.62 will argue that the third leg is starting through 127.20 low.
Yen Weakens Amid Nikkei Rally; Dollar Softens as Safe Havens Digest Recent Gains
Yen declines broadly in Asian session, appears to be more of a reaction to rally in Nikkei, which broke through 29500 level for the first time since November 2021, and now seems poised to challenge 30000 psychological level. Dollar, along with its safe-haven counterpart, Swiss Franc, also trended lower as these currencies recalibrate following last week's gains. In the meantime, Australian and New Zealand Dollars are experiencing modest recoveries, while Euro, British Pound, and Canadian Dollar are mixed.
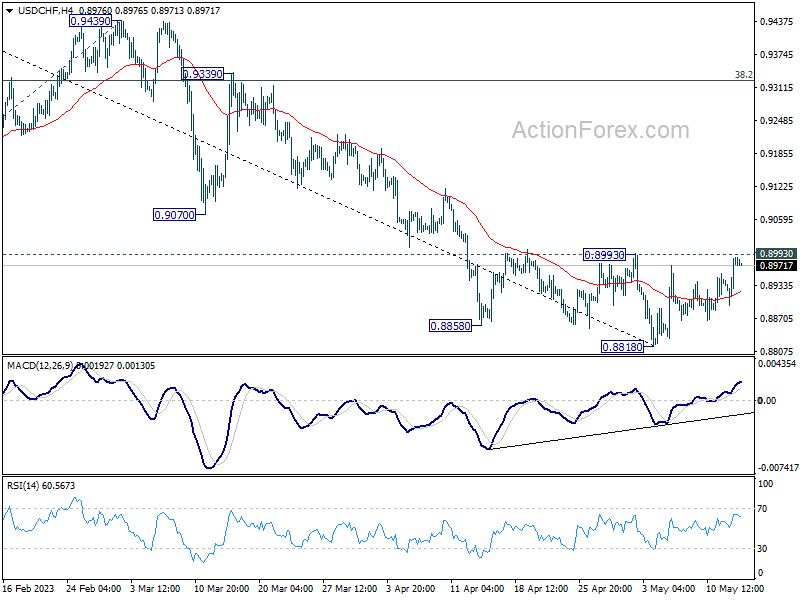
From a technical standpoint, there are two key points to watch: 1.2434 support level for GBP/USD and 0.8993 resistance level for USD/CHF. Decisive break of these levels would align the outlook with EUR/USD, suggesting that Dollar has formed short-term bottom against European majors. If this scenario unfolds, we may see further gains for the greenback, potentially extending its rally throughout the remainder of the month.
In Asia, at the time of writing, Nikkei is up 0.62%. Hong Kong HSI is up 0.21%. China Shanghai SSE is down -0.76%. Singapore Strait Times is down -0.10%.
ECB de Guindos indicates final phase of monetary policy tightening
In an interview with Il Sole 24 Ore, ECB Vice President Luis de Guindos highlighted the central bank's shift towards a more conventional monetary policy approach, stating, "We have now entered the home stretch of our monetary policy tightening path," adding, "And that's why we are returning to normality, to 25 basis-point steps."
He reiterated ECB's position that future policy decisions will be determined on a meeting-by-meeting basis, reliant on incoming data. The decisions will hinge on "the evidence of how the tightening of financing conditions has worked — and on the path of inflation, headline and core," Guindos explained. He voiced concern over service prices, which constitute a significant portion of core inflation.
Guindos also pointed to the impact of quantitative tightening, noting it "has led to an increase of 60-70 basis points in ten-year government bond yields."
Japan cabinet office stresses importance of avoiding relapse into deflation
Japan's Cabinet Office emphasized, at a meeting of the government's economic council, the need for stability and sustainability in these positive signs to ensure that Japan does not fall back into a deflationary spiral. They stated, "While there have been some positive signs in recent data, we must ensure they are stable and sustainable so that Japan won't revert to deflation."
In a separate discussion involving academics and private-sector experts, some participants called for BoJ to end quantitative easing once inflation stabilizes around its 2% target. Meanwhile, some participants suggested BoJ should mull over altering its extraordinary stimulus measures if inflation and wages continue their upward trajectory.
Prime Minister Fumio Kishida emphasized the need for a coordinated approach between the government and the BoJ amidst the growing uncertainty surrounding the economic outlook. He said, "We're aiming to pull Japan out of deflation and achieve sustained, private demand-driven economic growth" by influencing public perceptions that growth and inflation will continue to rise.
A week of key economic events across the globe
There is no definitive main event in the week as each country or region have something important to offer.
In the US, retail sales figures will shed light on the impact of deteriorating consumer sentiment on spending. Additionally, the usual weekly jobless claims will become increasingly important in indicating whether the job market continues to loosen. North of the border, Canada's CPI and retail sales figures will be closely monitored, but it remains uncertain whether extended string of strong data would be enough to push BoC out of its pause.
Turning to Europe, Germany's ZEW economic sentiment index will be a highlight, while Eurozone CPI final and GDP revisions are unlikely to trigger significant reactions. European Union will publish new economic forecasts, and ECB will release its monthly economic bulletin. In the UK, focus will be on employment data and consumer confidence.
Over in Asia Pacifica batch of Chinese data, including industrial production and retail sales, is expected to be the most market-moving. Japan will release its GDP and CPI figures, but these are unlikely to change BoJ's ultra-loose policy stance in the short term. In Australia, the upcoming week will see release of employment data, consumer sentiment, wage price index, and RBA minutes, while New Zealand will publish PPI and trade balance figures.
Here are some highlights for the week:
- Monday: New Zealand BusinessNZ services index; Japan PPI; Swiss PPI; Eurozone industrial production; Canada housing starts, wholesale sales; US Empire state manufacturing index.
- Tuesday: Australia Westpac consumer sentiment, RBA minutes; China industrial production, retail sales, fixed asset investment; UK employment, Germany ZEW economic sentiment, GDP revision, trade balance; Canada CPI, manufacturing sales; US retail sales, industrial production, business inventories, NAHB housing index.
- Wednesday: Japan GDP, Australia wage price index; Swiss trade balance; Eurozone CPI final; US housing starts and building permits.
- Thursday: New Zealand PPI; Australia employment; Japan trade balance; Canada new housing price index; US jobless claims, Philly Fed survey, existing home sales, leading index.
- Friday: New Zealand trade balance; Japan CPI, tertiary industry index; UK Gfk consumer confidence; Germany PPI; ECB monthly bulletin; Canada retail sales.
USD/JPY Daily Outlook
Daily Pivots: (S1) 134.85; (P) 135.30; (R1) 136.20; More...
Intraday bias in USD/JPY remains on the upside at this point. Pull back from 137.76 should have completed at 133.73. Further rise would be seen for retesting 137.76/90 resistance zone. Decisive break there will resume whole rebound from 127.20. On the downside, break of 133.73 will resume the fall from 137.76 through 133.00 instead.
In the bigger picture, price actions from 151.93 high are currently seen as a corrective pattern to the long term up trend. The first leg should have completed at 127.20. Rebound from there is seen as the second leg. Sustained break of 38.2% retracement of 151.93 to 127.20 at 136.34 will bring stronger rise to 61.8% retracement at 142.48. Meanwhile, break of 129.62 will argue that the third leg is starting through 127.20 low.
Economic Indicators Update
| GMT | Ccy | Events | Actual | Forecast | Previous | Revised |
|---|---|---|---|---|---|---|
| 22:30 | NZD | Business NZ PSI Apr | 49.8 | 54.4 | 53.8 | |
| 23:50 | JPY | PPI Y/Y Apr | 5.80% | 5.60% | 7.20% | 7.40% |
| 06:30 | CHF | Producer and Import Prices M/M Apr | -0.10% | 0.20% | ||
| 06:30 | CHF | Producer and Import Prices Y/Y Apr | 1.10% | 2.10% | ||
| 09:00 | EUR | EU Economic Forecasts | ||||
| 09:00 | EUR | Eurozone Industrial Production M/M Mar | -1.20% | 1.50% | ||
| 12:15 | CAD | Housing Starts Y/Y Apr | 221K | 214K | ||
| 12:30 | CAD | Wholesale Sales M/M Mar | 0.20% | -1.70% | ||
| 12:30 | USD | Empire State Manufacturing Index May | -1.9 | 10.8 |
USD/CHF Daily Outlook
Daily Pivots: (S1) 0.8925; (P) 0.8956; (R1) 0.9016; More...
Intraday bias in USD/CHF stays neutral for the moment with focus on 0.8993 resistance. Decisive break there will confirm short term bottoming at 0.8818, on bullish convergence condition in 4H MACD. Intraday bias will be turned back to the upside for 55 D EMA (now at 0.9052) and possibly above. In case of another fall, strong support should be seen from 61.8% projection of 1.0146 to 0.9058 from 0.9439 at 0.8767, which is close to 0.8756 long term support, to bring rebound.
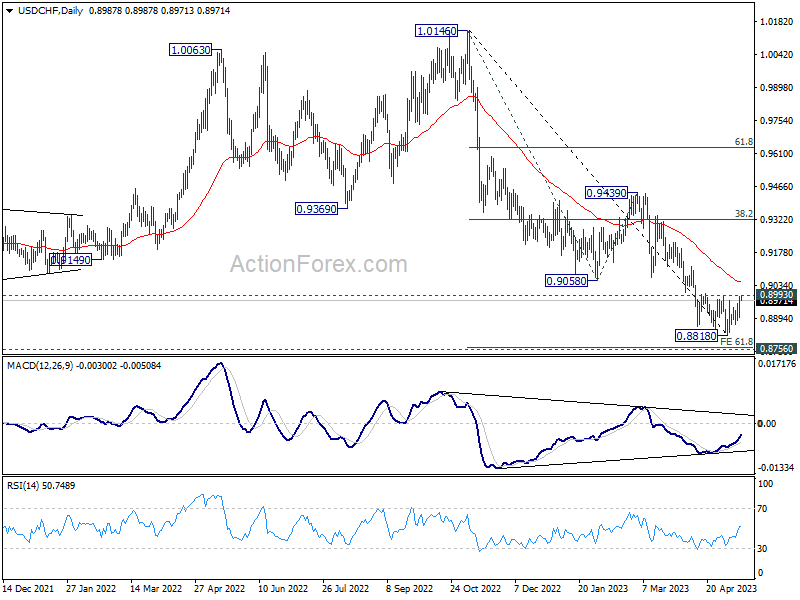
In the bigger picture, fall from 1.1046 (2022 high) is seen as a leg in the long term range pattern from 1.0342 (2016 high). So, downside should be contained by 0.8756 to bring reversal. Sustained break of 0.9058 support turned resistance will be the first sign of medium term bottoming. However, decisive break of 0.8756 will carry larger bearish implications.
Technical Outlook and Review
DXY:
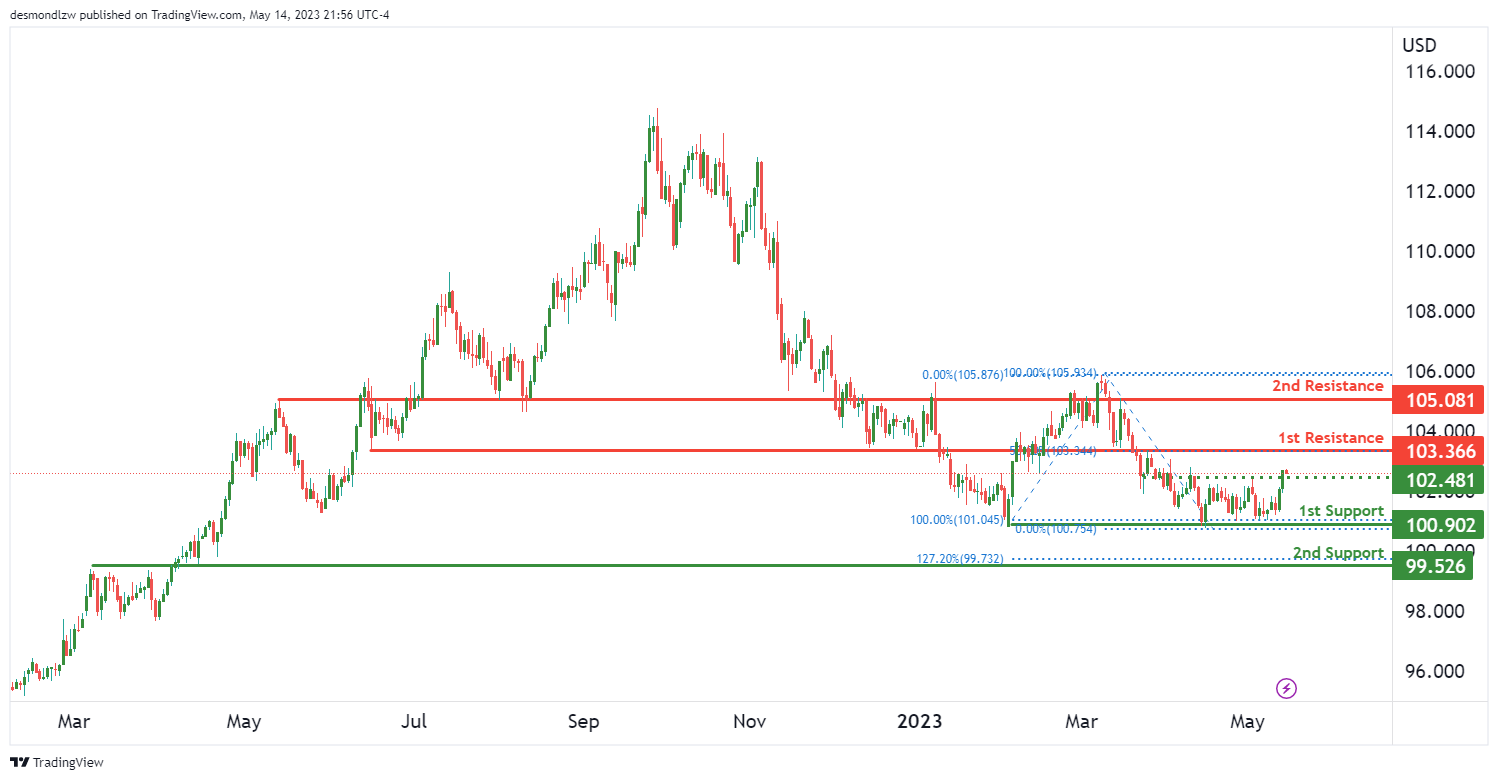
The DXY is currently demonstrating strong bullish momentum, suggesting potential for price continuation towards the first resistance level.
The price is supported at the first support level of 100.90. This level has served as a multi-swing low support, indicating its significance in the price structure of DXY. A bounce from this support could steer the price towards the first resistance level.
The first resistance lies at 103.36. This level is an overlap resistance, which coincides with a 50% Fibonacci retracement level. This combination makes it a strong barrier for the price. If the price successfully negotiates this resistance, it could potentially trigger a stronger bullish momentum.
An intermediate support level has been identified at 102.58. This level, an overlap support, could serve as a stepping stone for the price if it breaks through the first resistance.
However, should the price decline below the first support, it might drop to the second support level at 99.52. This level, which aligns with an overlap support and the 127.20% Fibonacci Extension, has proven to be a reliable base in the past.
On the upside, if the price breaks through the first resistance, it could potentially ascend towards the second resistance level at 105.08, another significant overlap resistance.
EUR/USD:
EUR/USD is currently demonstrating strong bullish momentum, largely supported by its position above a major ascending trend line. This suggests potential for further bullish momentum.
However, in the short term, the price could potentially drop further to the first support level at 1.0789 before bouncing back. This level has proven to be a solid overlap support and aligns with a 50% Fibonacci retracement, enhancing its reliability as a price floor.
Once the price bounces off the first support, it could rise to the first resistance level at 1.1033. This level has functioned as a multi-swing high resistance in the past, suggesting it’s a strong barrier for the price.
In the event of a stronger bearish retracement, the second support level comes in at 1.0516. This level is a significant multi-swing low support and could provide a springboard for the price if it drops below the first support.
On the other hand, should the price break above the first resistance, it could potentially rise towards the second resistance level at 1.1166. This level is an overlap resistance and aligns with the 127.20% Fibonacci Extension, suggesting it could be a major hurdle for bullish continuation.
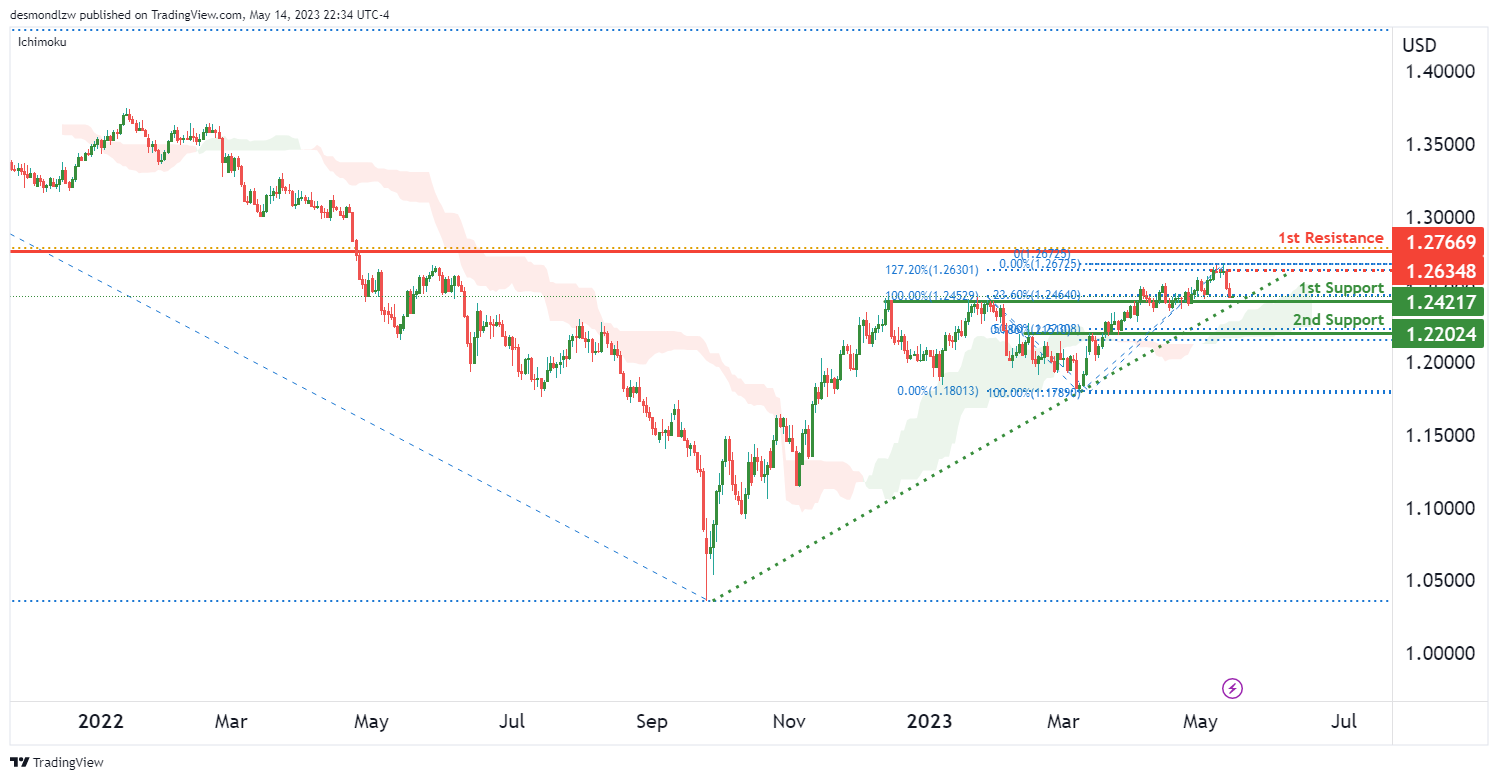
GBP/USD:
The GBP/USD is currently exhibiting strong bullish momentum, primarily driven by its position above a major ascending trend line and its position above the bullish Ichimoku cloud, both of which suggest potential for further bullish momentum.
In the near term, the price could potentially make a bullish bounce off the first support at 1.2421 and rise towards the first resistance. The 1.2421 level is a strong overlap support, reinforced by the 23.6% Fibonacci retracement, making it a reliable price floor.
If the price manages to bounce off the first support, it could rise towards the first resistance at 1.2766. This level has been a significant pullback resistance in the past, indicating it’s a strong price ceiling.
Between the current price and the first resistance, there lies an intermediate resistance at 1.2634. This level, which is a multi-swing high resistance and coincides with the 127.20% Fibonacci Extension, could pose an additional hurdle for the price on its journey towards the first resistance.
However, if the price drops below the first support, it could potentially slide towards the second support level at 1.2202, which also serves as an overlap support.
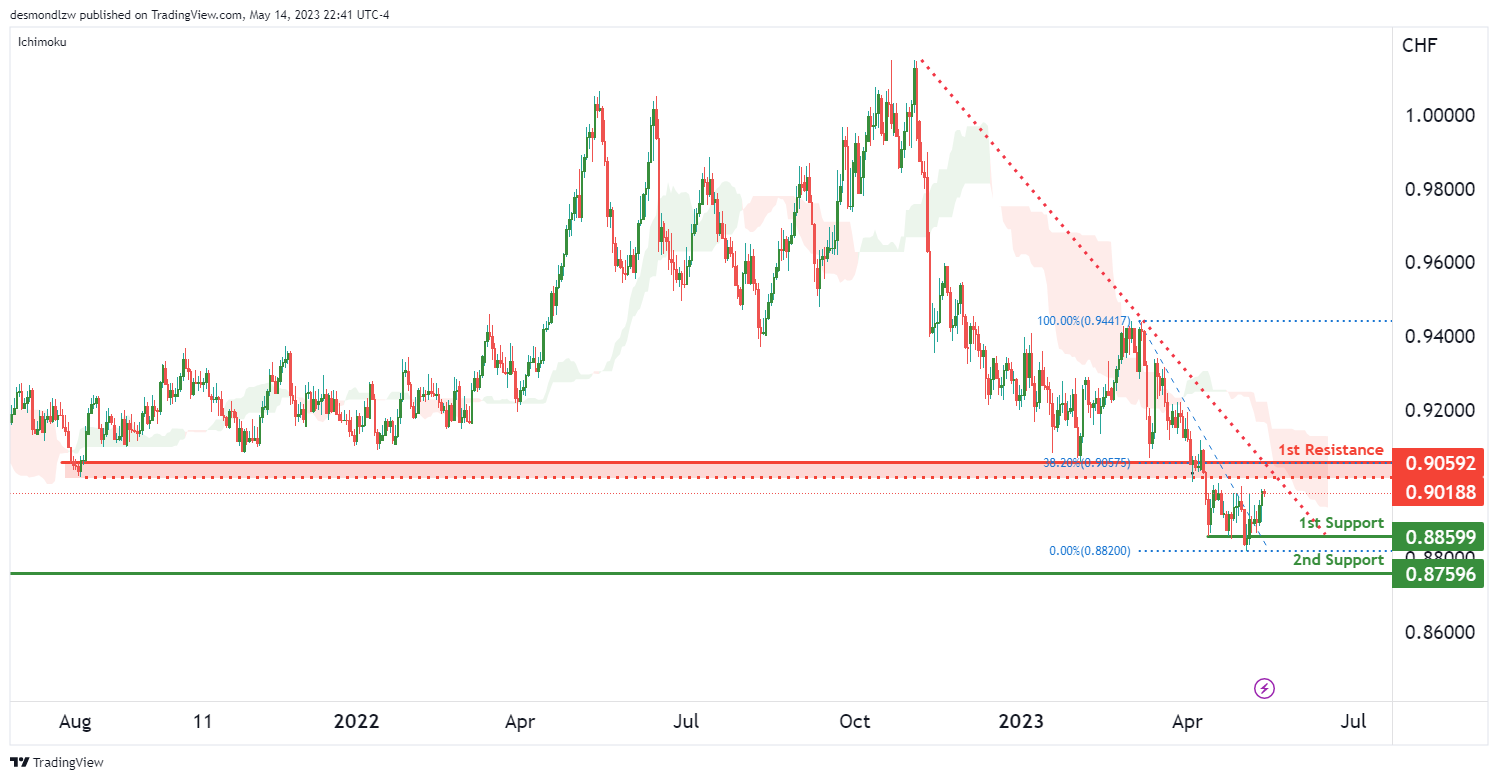
USD/CHF:
The USD/CHF is currently exhibiting significant bearish momentum, as indicated by its position below a major descending trend line and the bearish Ichimoku cloud. These factors suggest the potential for further bearish momentum.
In the near term, the price could potentially react bearishly off the first resistance at 0.9059 and drop to the first support. This resistance level has been a significant pullback resistance in the past and coincides with the 38.2% Fibonacci retracement, indicating it’s a strong price ceiling.
Should the price reject this resistance, it could drop towards the first support at 0.8859. This level has been a multi-swing low support and is reinforced by the 23.6% Fibonacci retracement, making it a reliable price floor.
Between the current price and the first resistance, there is an intermediate resistance at 0.9018. This level, a pullback resistance, could present an additional hurdle for the price on its journey towards the first resistance.
If the price drops below the first support, it could potentially descend towards the second support level at 0.8759, which is a swing low support.
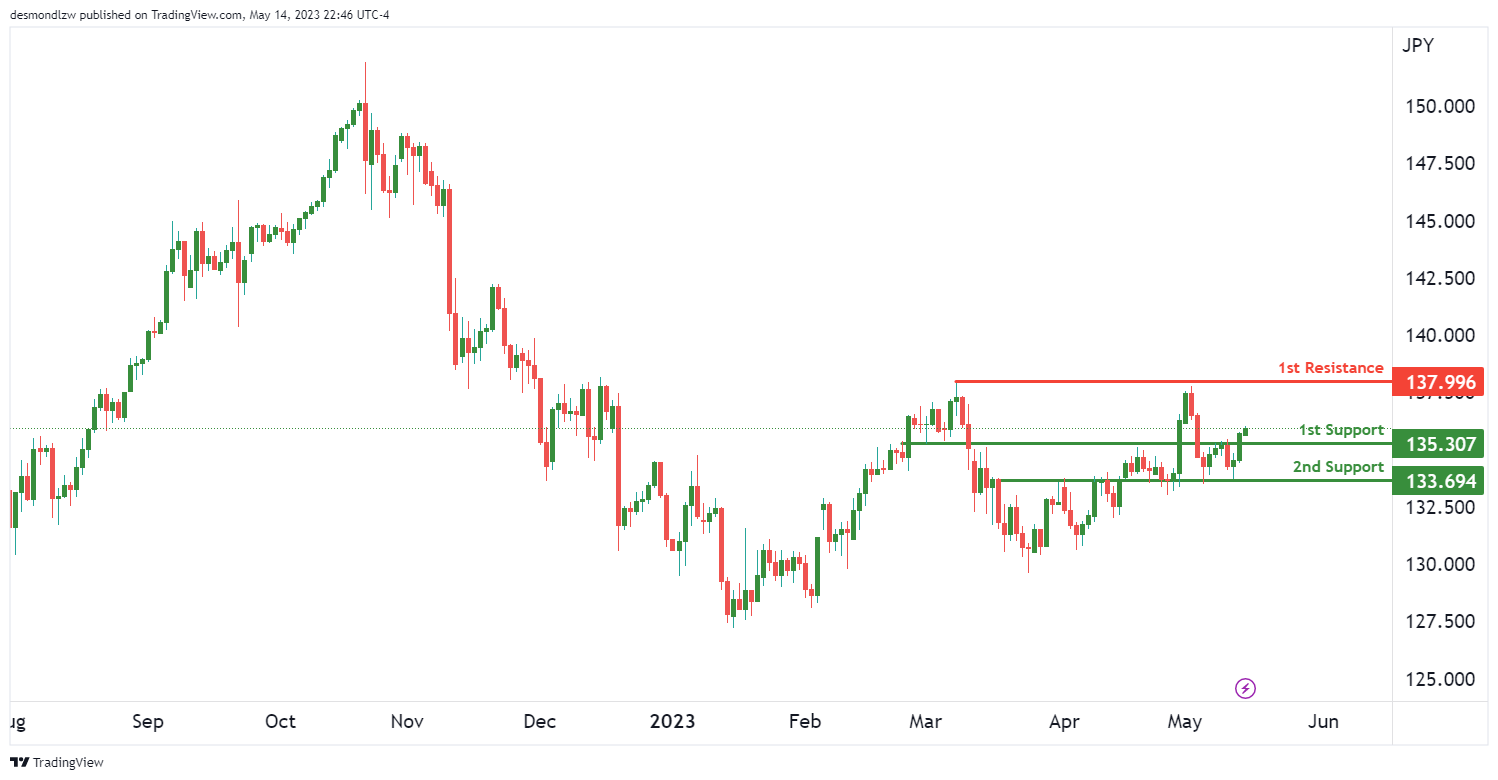
USD/JPY:
The USD/JPY is currently demonstrating a bullish momentum, suggesting potential for further upward movement.
In the near term, we could potentially see a bullish continuation towards the first resistance level at 137.99. This level has served as a swing high resistance in the past, indicating it could pose a significant challenge for the price.
However, before reaching the first resistance, the price might face some downward pressure. If this occurs, the first support level at 135.30 could provide a safety net. This level is an overlap support, suggesting it is a reliable price floor.
If the price drops below the first support, it could potentially move towards the second support level at 133.69, another overlap support, providing a secondary safety net.
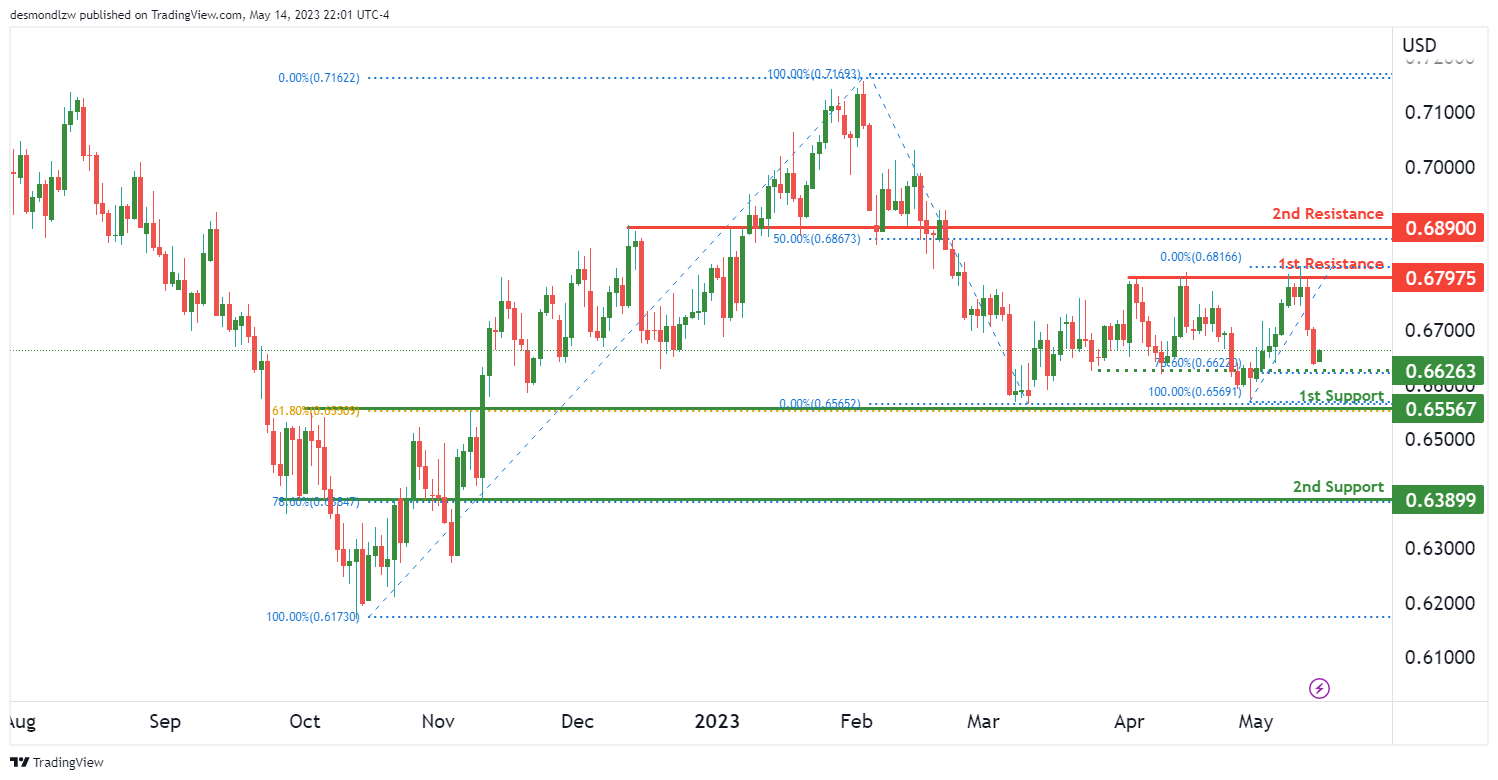
AUD/USD:
The AUD/USD is currently on a bullish trend, suggesting further upward momentum might be on the horizon.
In the near term, we could potentially see a bullish continuation towards the first resistance at 0.6797. This level has served as a multi-swing high resistance in the past, indicating it could pose a significant hurdle for the price.
Before it reaches this resistance, the price might face some downward pressure. If this occurs, the first support level at 0.6556 could provide a safety net. This level is an overlap support and coincides with the 61.8% Fibonacci retracement, suggesting it’s a reliable price floor.
Between the current price and the first resistance, there is an intermediate support at 0.6626. This level, a pullback support, aligns with the 78.6% Fibonacci retracement and could provide a short-term floor for the price.
If the price drops below the first support, it could potentially descend towards the second support level at 0.6389, which is an overlap support and coincides with the 78.6% Fibonacci retracement.
Should the price break through the first resistance, it could potentially rise towards the second resistance level at 0.6890, which has been an overlap resistance in the past.
NZD/USD
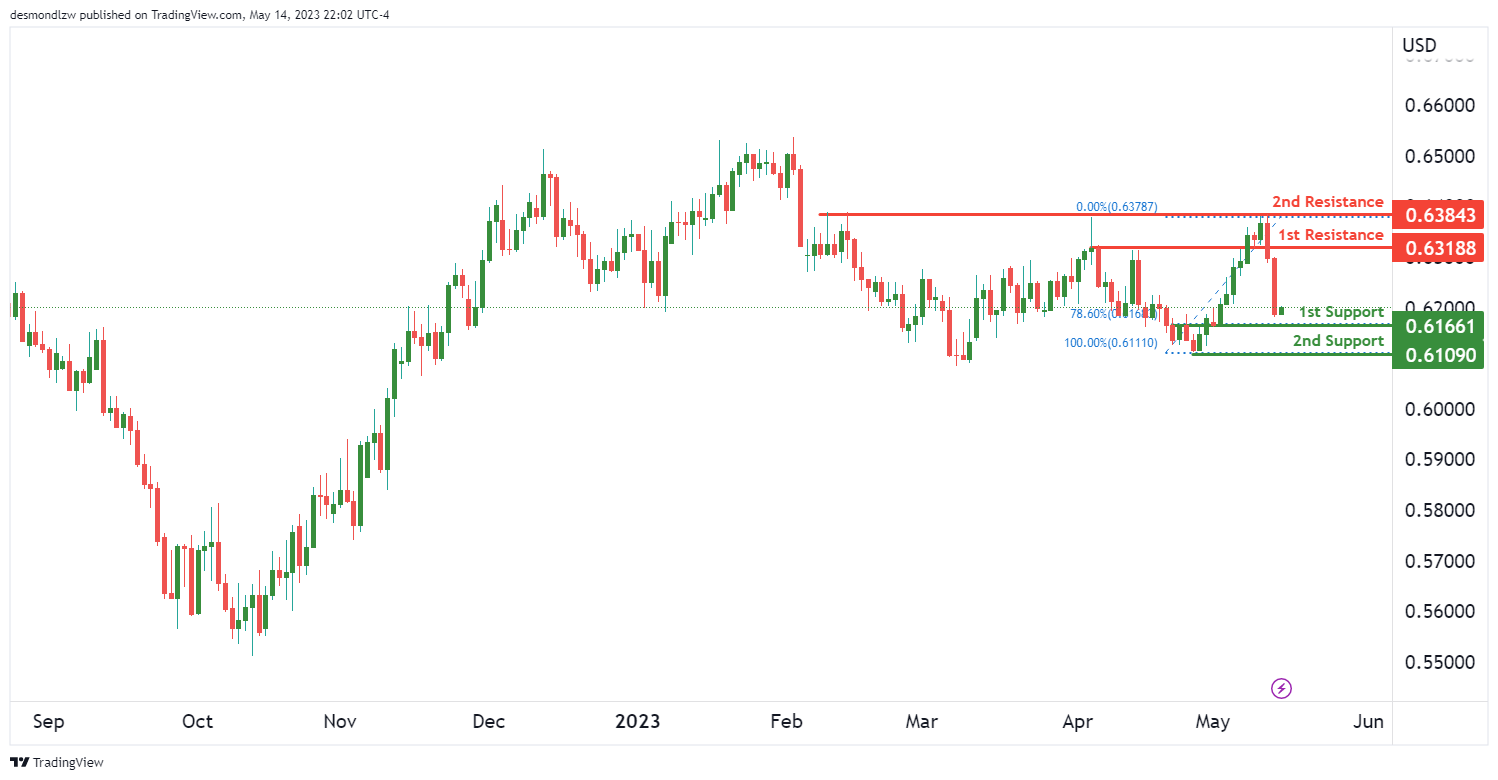
The NZD/USD is currently exhibiting bullish momentum, suggesting potential for further upward movement.
In the near term, we might witness a bullish continuation towards the first resistance level at 0.6318. This level has served as a pullback resistance in the past, indicating it could pose a significant challenge for the price.
However, before reaching this resistance, the price might face some downward pressure. If this occurs, the first support level at 0.6166 could provide a safety net. This level is an overlap support and coincides with the 78.6% Fibonacci retracement, suggesting it’s a reliable price floor.
If the price drops below the first support, it could potentially move towards the second support level at 0.6109, which has been a swing low support in the past, providing an additional safety net.
Should the price breach the first resistance, it could potentially rise towards the second resistance level at 0.6384. This level has been a multi-swing high resistance in the past, indicating it could be a significant price ceiling.
USD/CAD:
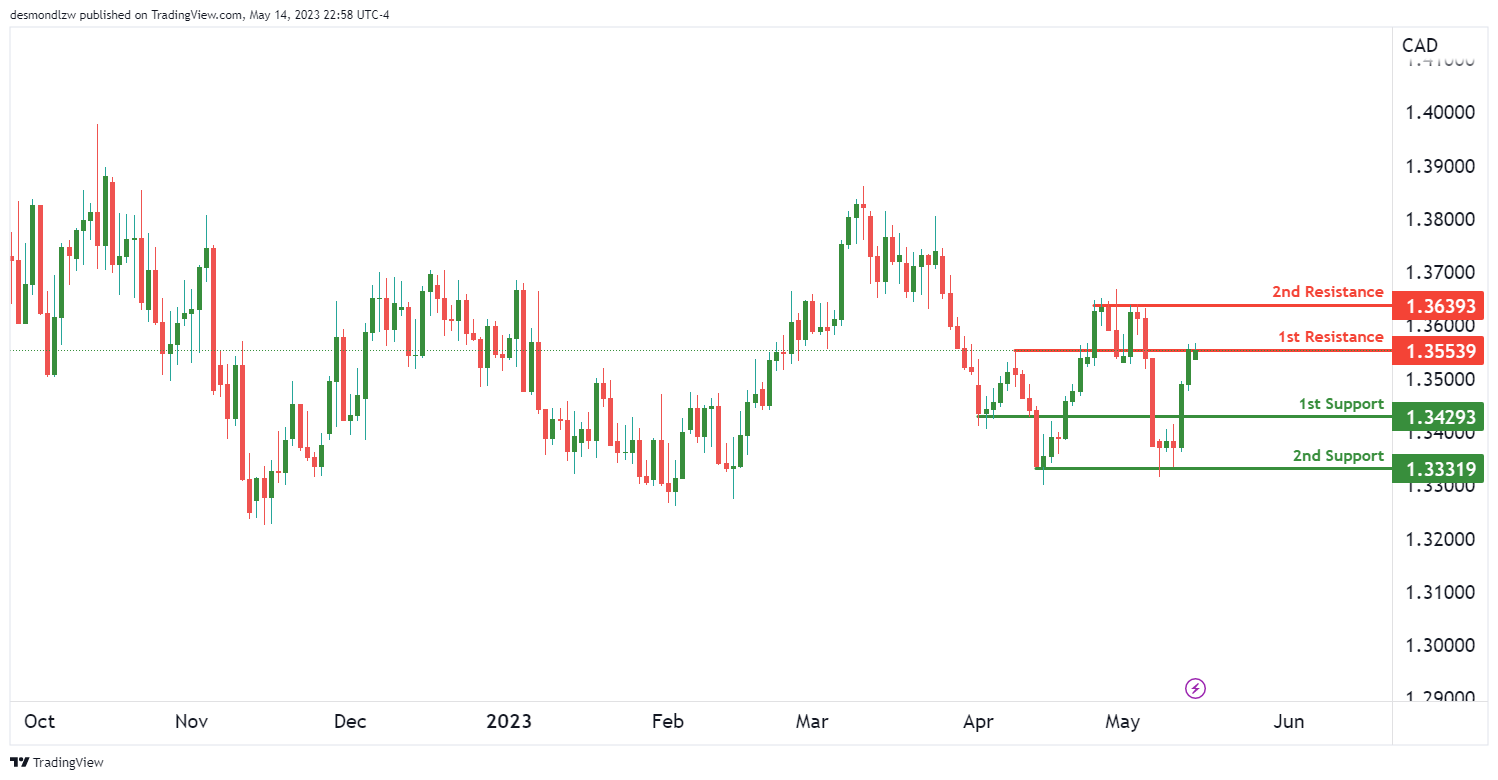
The CAD/USD is currently on a bearish trend, suggesting that further downward momentum might be in the offing.
In the near term, we could potentially witness a bearish reaction off the first resistance level at 1.3553, leading to a drop towards the first support level at 1.3429. The resistance level has served as an overlap resistance in the past, indicating it could pose a significant barrier for the price. Meanwhile, the first support level has acted as a pullback support, suggesting it’s a likely stopping point for any price decline.
If the price were to breach the first support, it could potentially descend towards the second support level at 1.3331. This level has been a multi-swing low support in the past, providing an additional safety net for the price.
Conversely, if the price were to break through the first resistance, it could potentially rise towards the second resistance level at 1.3639. This level has been a multi-swing high resistance in the past, indicating it could be a significant price ceiling.
DJ30:
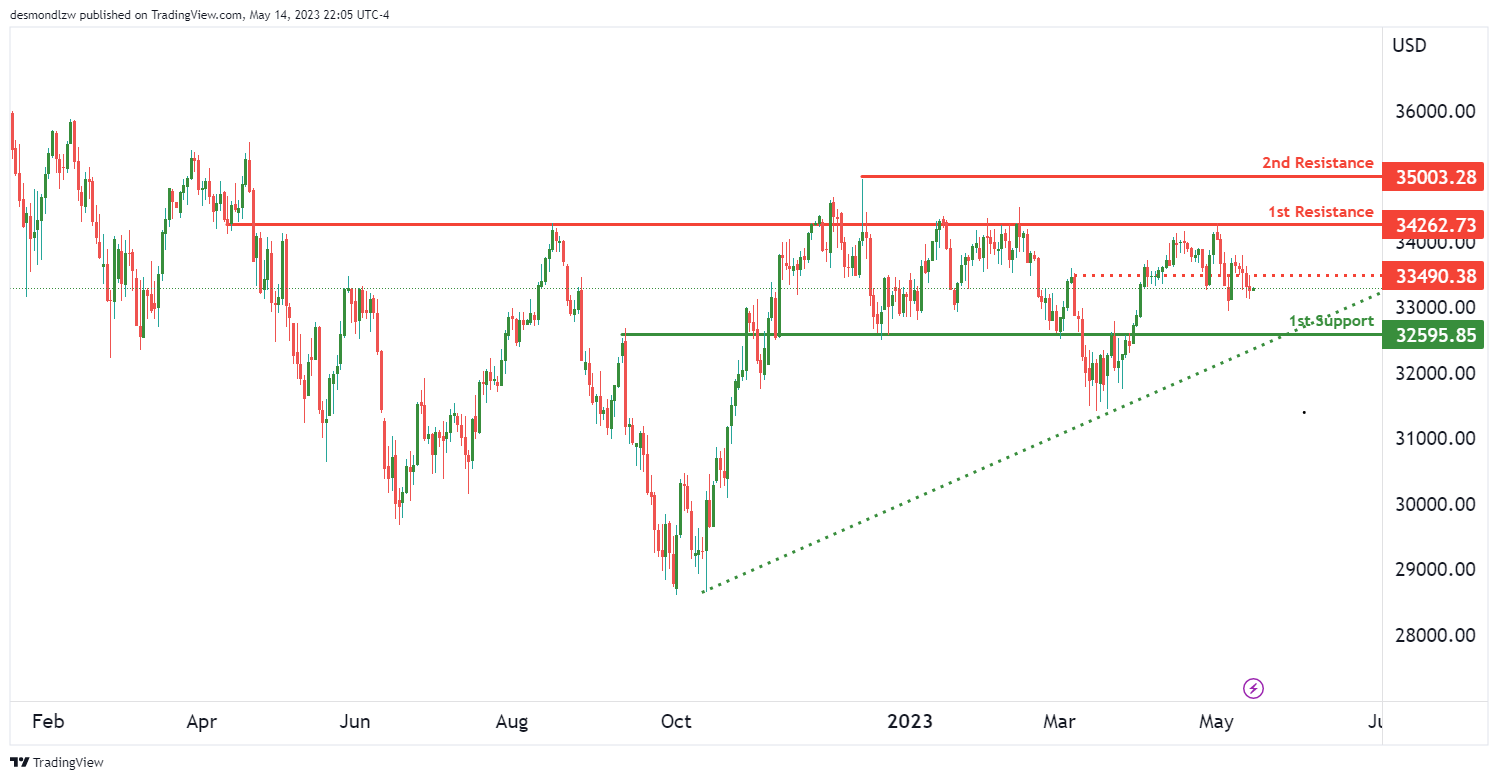
Currently, the DJ30 exhibits a bullish momentum, with the price above a major ascending trend line, suggesting we might see further bullish momentum.
In the short term, the price could potentially drop further to the first support level at 32595.85 before bouncing off this point and rising towards the first resistance level at 34262.73. The first support level has previously acted as a pullback support, which could provide a strong foundation for the price.
The first resistance level at 34262.73 has previously served as an overlap resistance, indicating it could be a significant hurdle for the price. If the price were to break this level, it could trigger a stronger bullish acceleration towards the second resistance level at 35003.28, which has acted as a swing high resistance in the past.
An intermediate resistance at 33490.38 lies between the current price and our first resistance. If the price were to break this intermediate resistance, it could potentially spur a bullish acceleration towards the first resistance.
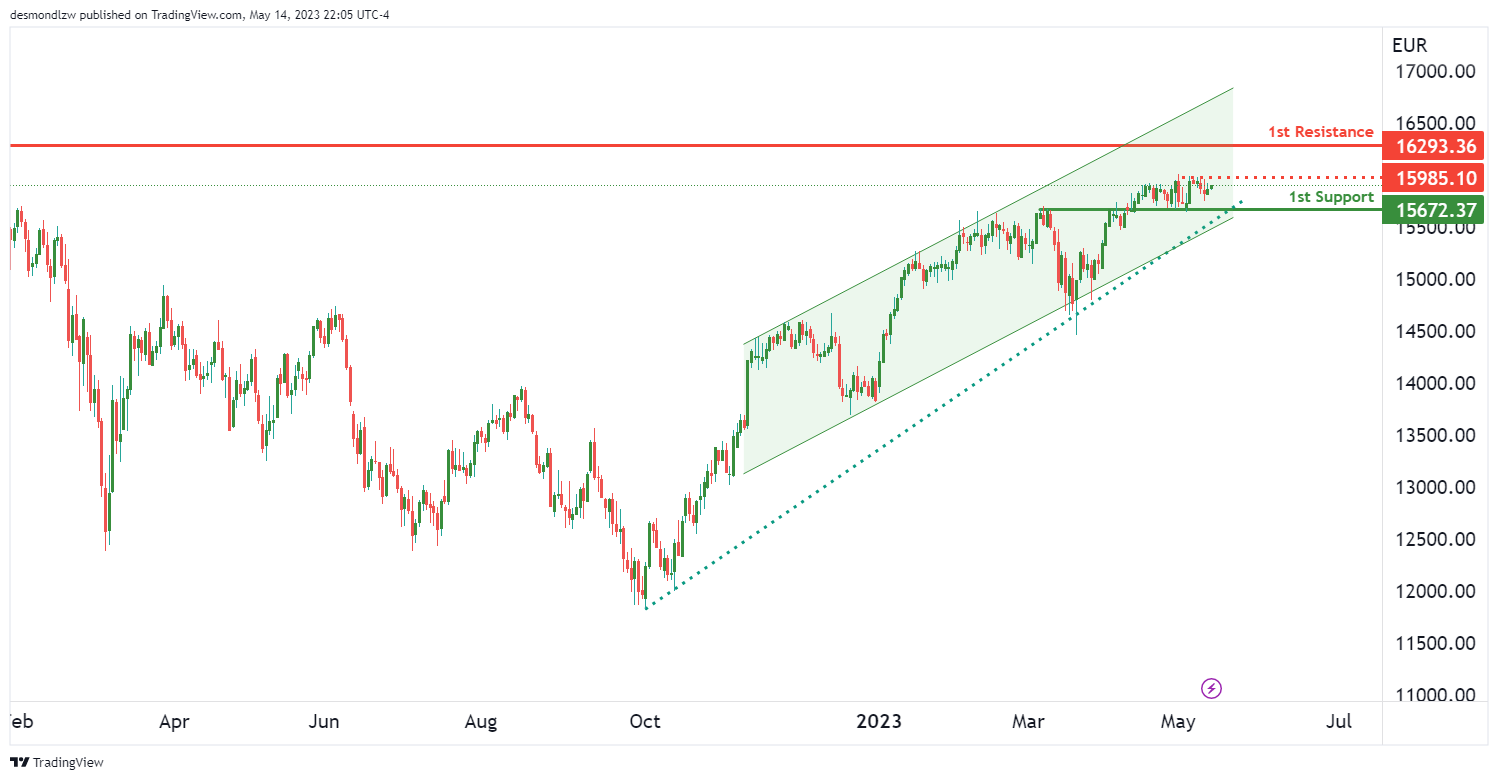
GER30:
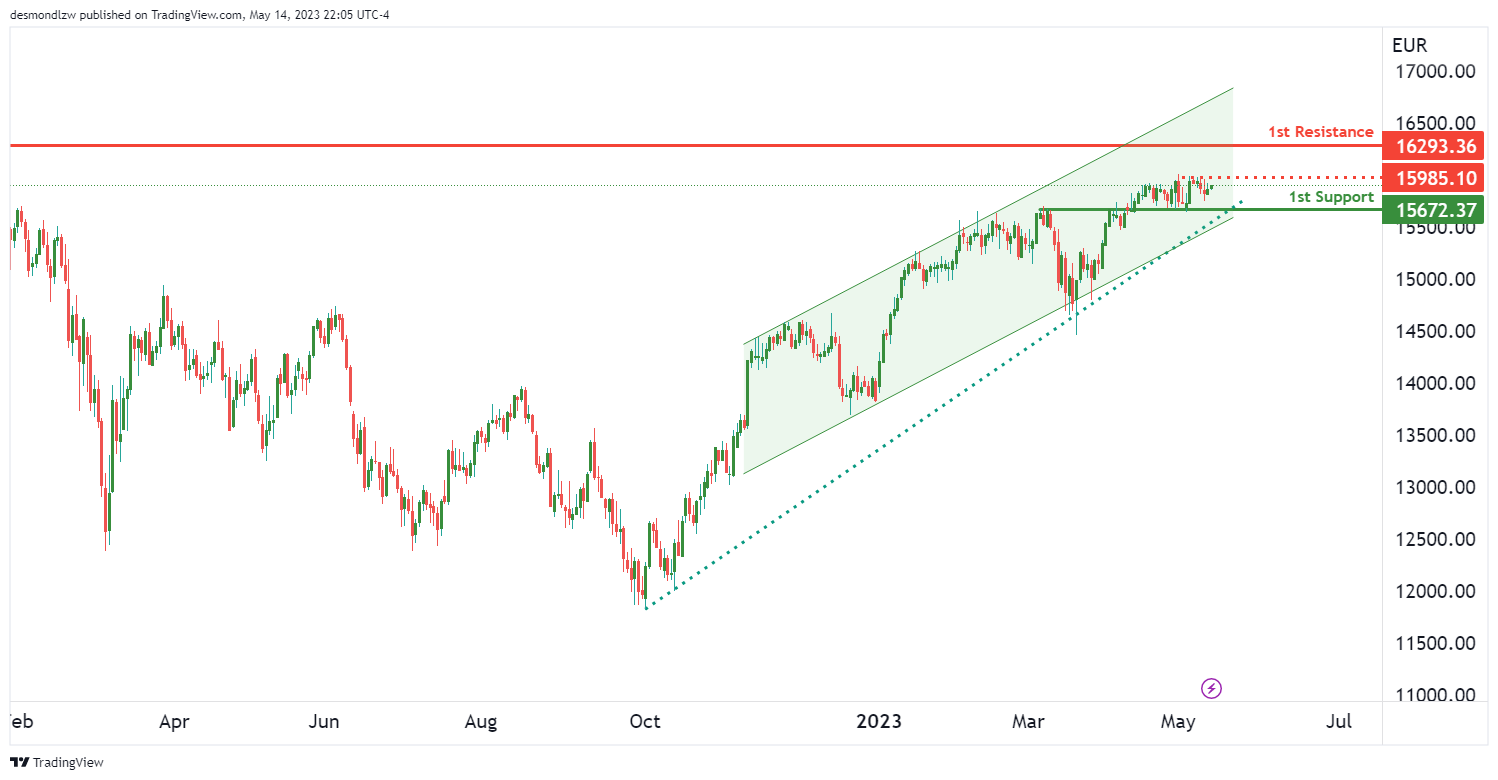
The GER30 currently maintains a bullish momentum, with price situated above a significant ascending trend line, suggesting a further bullish momentum could be on the horizon. Moreover, the price is within a bullish ascending channel, which suggests that the price might continue to rise due to its bullish momentum.
In the short term, we could see the price drop to the first support level at 15672.37 before rebounding from there and rising towards the first resistance level at 16293.36. The first support level is a strong pullback support, which could provide a solid base for the price.
The first resistance level at 16293.36 has previously acted as a swing high resistance, making it a possible challenge for the price. If the price manages to break this level, it could trigger a stronger bullish acceleration.
An intermediate resistance level lies at 15985.10, between the current price and our first resistance. If the price were to surpass this intermediate resistance, it could potentially spur a bullish acceleration towards the first resistance.
BTC/USD:
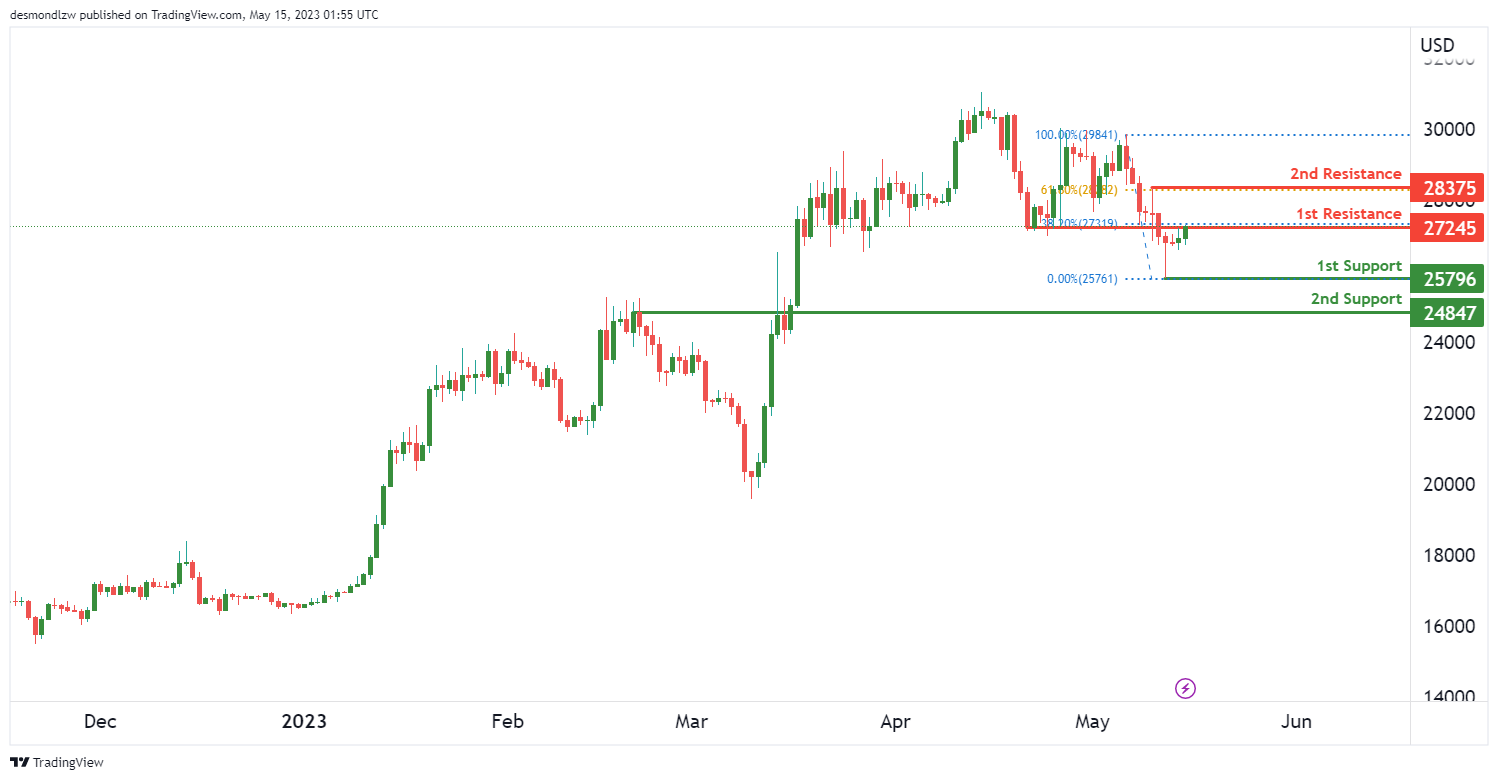
The overall momentum for BTC/USD appears to be bearish, with a potential for a bearish reaction off the first resistance and a subsequent drop to the first support.
The first support level is at 25796.00, which has acted as a swing low support in the past. This could potentially provide a good base for the price if it drops from the current levels. If the price breaks this support level, the next potential support to consider is the second support at 24847.00. This level has acted as a pullback support previously, suggesting that it could serve as a strong base for prices.
The first resistance level is at 27245.00, a level that has acted as an overlap resistance in the past. The price is currently testing this level, which also aligns with the 38.2% Fibonacci retracement level, suggesting that it’s a significant level to watch for potential price reactions. If the price were to reverse at this level, it could lead to a continuation of the bearish trend.
The second resistance level is at 28375.00, which coincides with a swing high resistance and a 61.8% Fibonacci retracement level. If the price were to break the first resistance, this level could be the next target for the bullish scenario.
US500
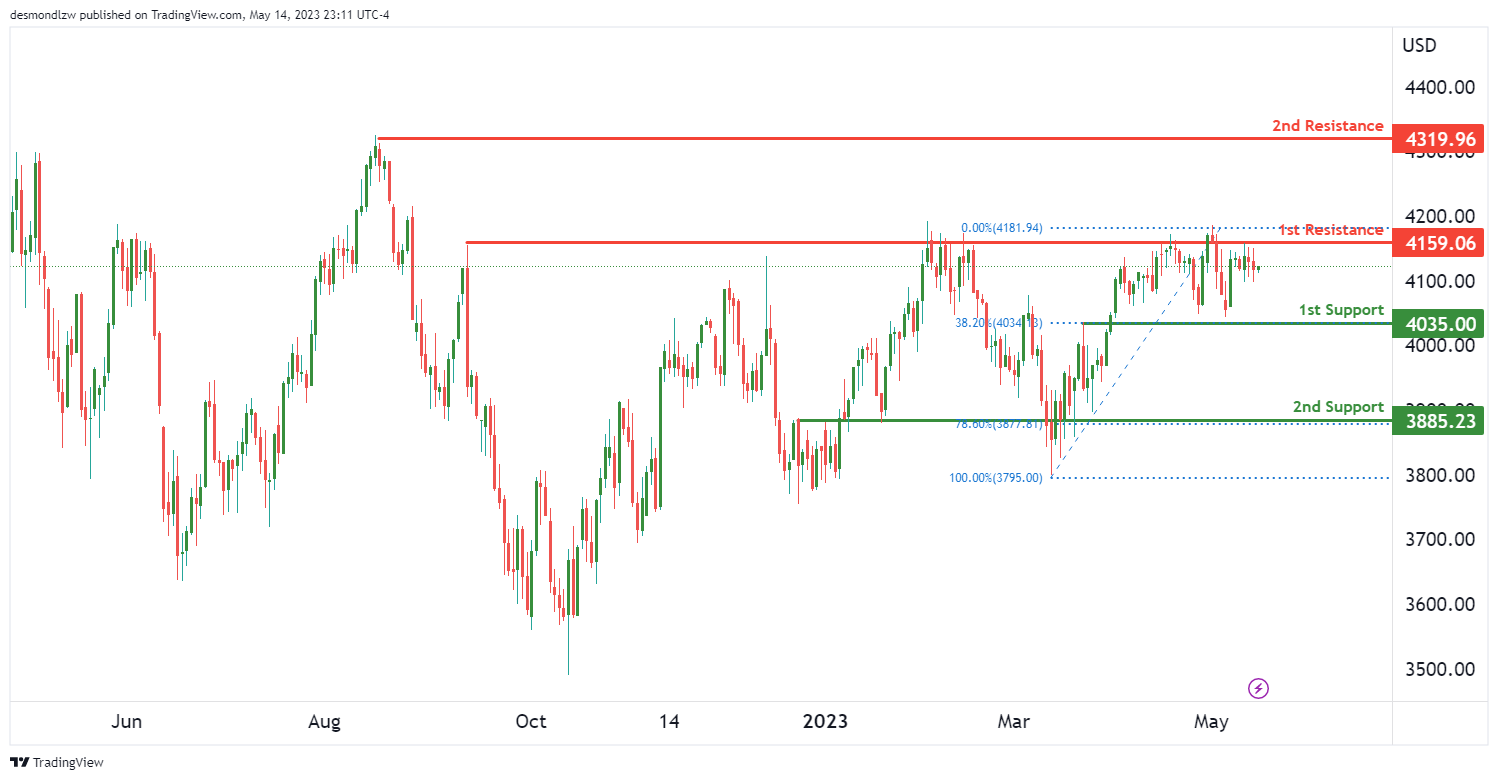
The current momentum for US500 is exhibiting a bearish trend, with the potential for a bearish reaction off the first resistance and a subsequent drop to the first support.
The first support level is located at 4035.00. This is an important level as it coincides with an overlap support and the 38.2% Fibonacci retracement, suggesting a possible area where the price could find some ground if it continues to decline. If the price breaches this support, we could see it descend further to the second support level at 3885.23. This level has also acted as an overlap support and aligns with the 78.6% Fibonacci retracement, potentially offering a robust base for prices.
On the upside, the first resistance level is at 4159.06. This level has previously acted as a multi-swing high resistance, implying that it could serve as a significant hurdle for any bullish price action. If the price can break through this resistance, the next target on the upside could be the second resistance level at 4319.96, which is a previous swing high resistance.
ETH/USD:
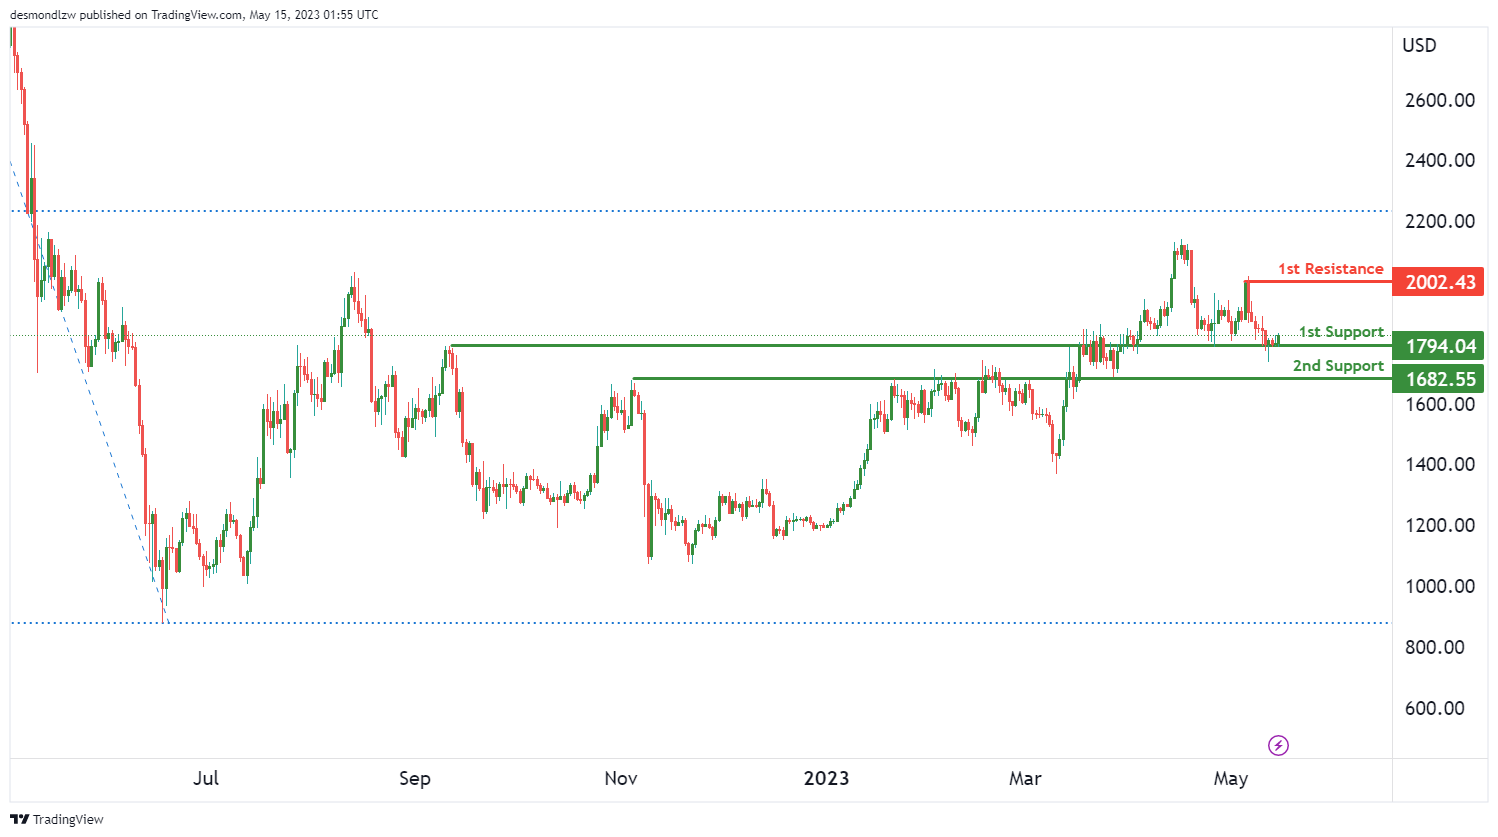
Ethereum’s (ETH/USD) chart shows an overall bullish momentum, suggesting potential for a bullish bounce off the first support, leading towards the first resistance.
The first support is found at $1794.04. This level is identified as an overlap support, indicating it has been tested multiple times and has proven to be a reliable point where the price has previously found buying interest. If the price were to drop, this could be a pivotal zone where buyers might step in again.
Further down, the second support stands at $1682.55. This level, similar to the first, has acted as an overlap support, reinforcing the strength of this price point as a potential floor for Ethereum.
On the upside, the first resistance is at $2022.43. This level has previously served as a multi-swing high resistance, suggesting that it could pose a significant barrier for the price. Overcoming this level could result in further bullish momentum.
WTI/USD:
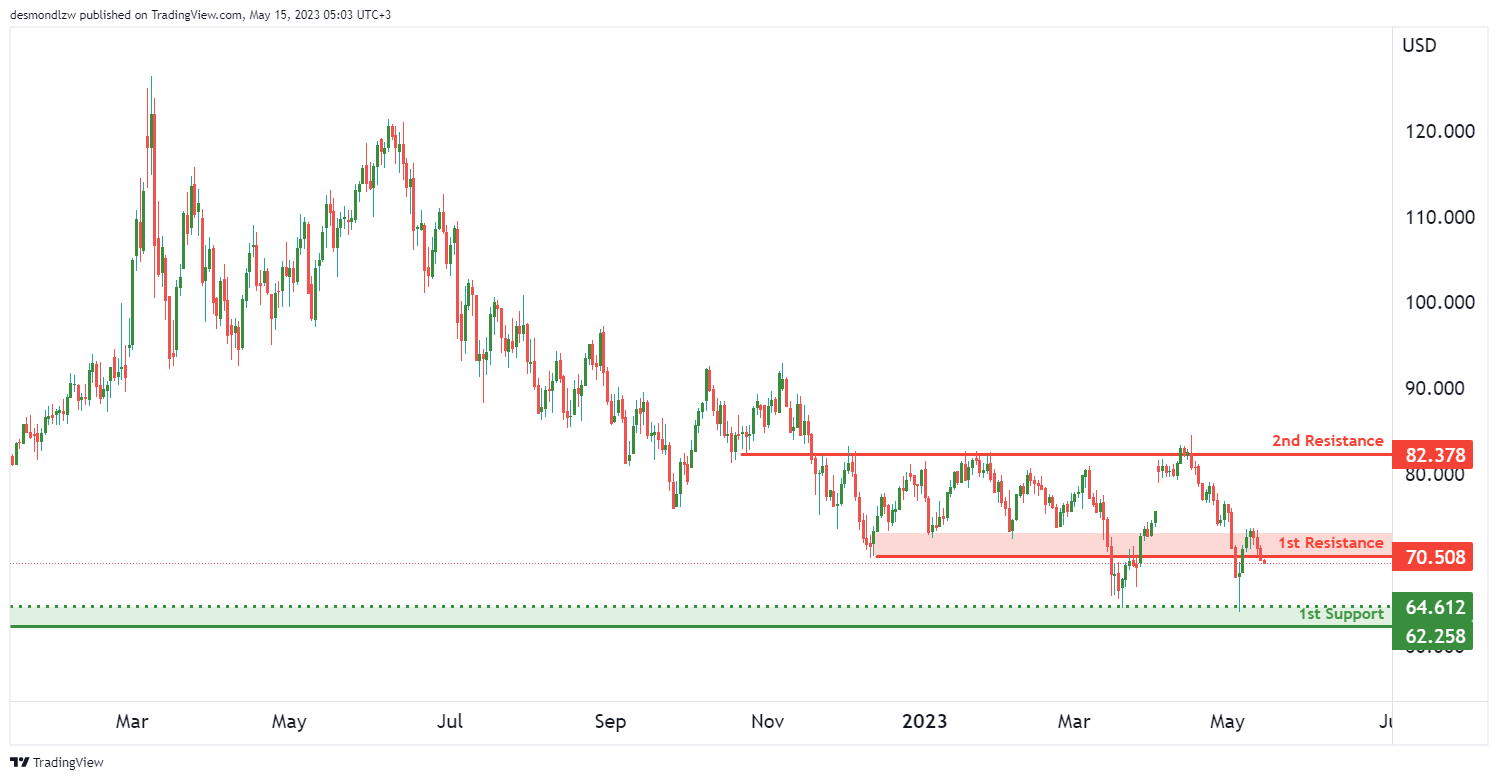
The West Texas Intermediate (WTI) chart currently presents an overall bearish momentum, hinting at a possible continuation towards the first support level.
The first support is identified at $62.25. This level has acted as a swing low support, meaning it’s a low point in the price that interrupts upward price movement. It is often considered a reliable floor, as it has withstood selling pressure in the past.
In addition, there’s an intermediate support at $64.61. This level has served as a multi-swing low support, indicating it has repeatedly held up against selling pressure, reinforcing its strength.
On the flip side, the first resistance is situated at $70.50. This has been a multi-swing high resistance, suggesting it could be a significant barrier for the price. This level has proven to hinder upward movement in the past, and it could pose a challenge for buyers again.
Beyond that, the second resistance is found at $82.37. This level is identified as an overlap resistance, indicating it has been tested multiple times as a ceiling, hence it could be a challenging point for bullish traders.
XAU/USD (GOLD):
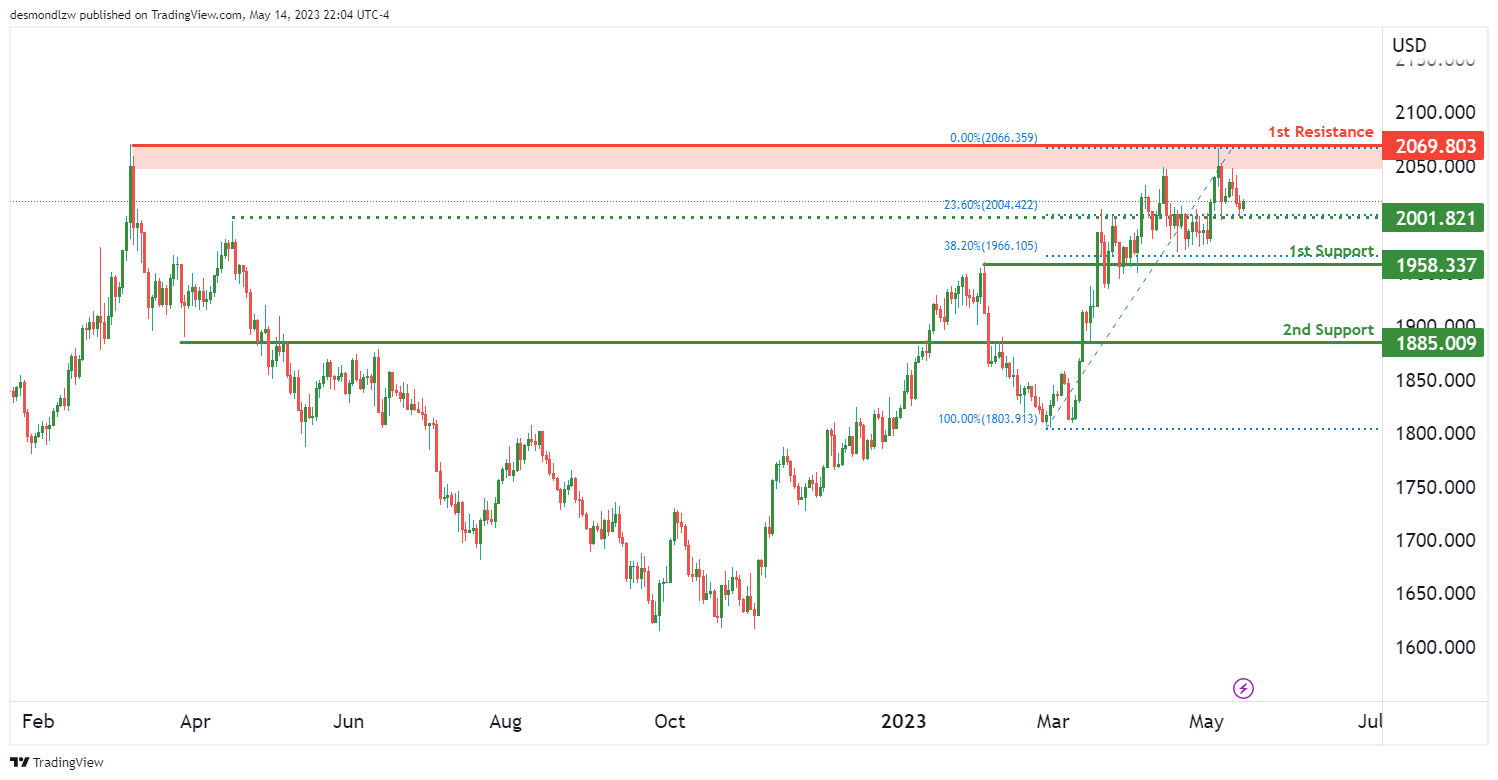
The overall momentum of the XAU/USD (Gold) chart is bullish, suggesting a potential bullish continuation towards the first resistance level.
The first support is seen at $1958.33. This level is acting as an overlap support, suggesting it has acted as both a resistance and a support level in the past. Furthermore, it coincides with the 38.20% Fibonacci retracement, strengthening its significance.
The second support is found at $1885.00. This level is also identified as an overlap support, indicating it has held against selling pressure on multiple occasions before, thus reinforcing its strength.
On the upside, the first resistance is placed at $2069.80. This has been a multi-swing high resistance level, meaning it’s a high point that interrupts downward price movement. Given its historical significance, it may pose a challenge for buyers.
Additionally, an intermediate support is identified at $2001.82. This level serves as an overlap support, and it aligns with the 23.60% Fibonacci retracement, further validating its reliability.
Japan cabinet office stresses importance of avoiding relapse into deflation
Japan cabinet office stresses importance of avoiding relapse into deflation Japan's Cabinet Office emphasized, at a meeting of the government's economic council, the need for stability and sustainability in these positive signs to ensure that Japan does not fall back into a deflationary spiral. They stated, "While there have been some positive signs in recent data, we must ensure they are stable and sustainable so that Japan won't revert to deflation."
In a separate discussion involving academics and private-sector experts, some participants called for BoJ to end quantitative easing once inflation stabilizes around its 2% target. Meanwhile, some participants suggested BoJ should mull over altering its extraordinary stimulus measures if inflation and wages continue their upward trajectory.
Prime Minister Fumio Kishida emphasized the need for a coordinated approach between the government and the BoJ amidst the growing uncertainty surrounding the economic outlook. He said, "We're aiming to pull Japan out of deflation and achieve sustained, private demand-driven economic growth" by influencing public perceptions that growth and inflation will continue to rise.
ECB de Guindos indicates final phase of monetary policy tightening
In an interview with Il Sole 24 Ore, ECB Vice President Luis de Guindos highlighted the central bank's shift towards a more conventional monetary policy approach, stating, "We have now entered the home stretch of our monetary policy tightening path," adding, "And that's why we are returning to normality, to 25 basis-point steps."
He reiterated ECB's position that future policy decisions will be determined on a meeting-by-meeting basis, reliant on incoming data. The decisions will hinge on "the evidence of how the tightening of financing conditions has worked — and on the path of inflation, headline and core," Guindos explained. He voiced concern over service prices, which constitute a significant portion of core inflation.
Guindos also pointed to the impact of quantitative tightening, noting it "has led to an increase of 60-70 basis points in ten-year government bond yields."