Sample Category Title
EU Spring Forecast: Upgraded GDP growth and inflation
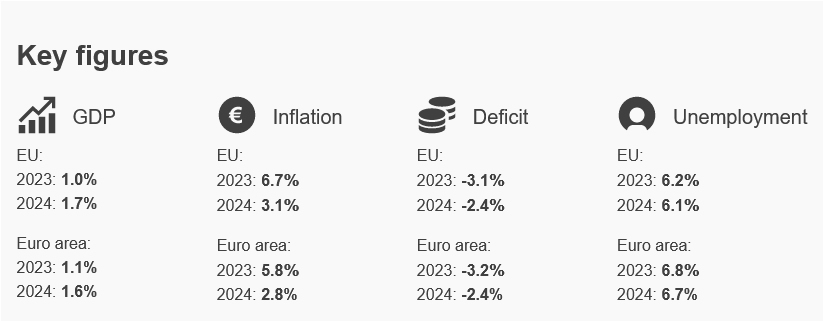
In its Spring 2023 Economic Forecast, European Commission presented a cautiously optimistic outlook for the Eurozone, with GDP growth projections revised upwards to 1.1% and 1.6% for 2023 and 2024 respectively. This positive adjustment, credited to a stronger-than-expected start to the year, exceeds winter forecasts of 0.9% in 2023 and 1.5% in 2024.
However, the report did not shy away from the challenges posed by inflation. Persisting core price pressures have led the Commission to revise its inflation forecasts for Eurozone to 5.8% in 2023 and 2.8% in 2024, up from winter's projected 5.6% and 2.5% respectively. On an annual basis, core inflation is set to average 6.1% in 2023 before falling to 3.2% in 2024, remaining above headline inflation in both forecast years.
While the overall picture painted by the Commission is one of steady recovery, it also acknowledges increase in downside risks to economic outlook. The report warned that persistent core inflation could continue to squeeze household purchasing power and necessitate stronger response from monetary policy, leading to wider macro-financial implications.
Potential threats also include renewed financial stress, which could trigger tightening of lending standards, and exacerbation of inflation by expansionary fiscal policies.
The forecast also flagged the ongoing turmoil in the banking sector and broader geopolitical tensions as possible sources of further economic challenges. On the other hand, the Commission noted that more favorable developments in energy prices could lead to a faster decline in headline inflation, boosting domestic demand.
Eurozone industrial production down -4.1% mom in Mar
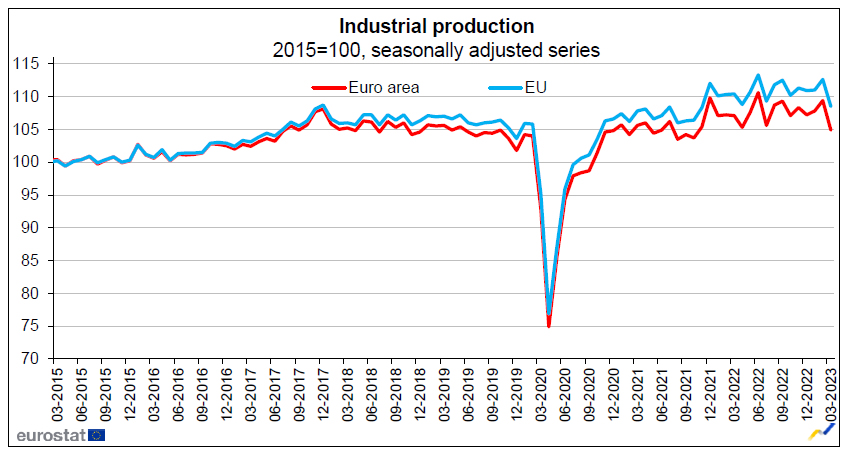
Eurozone industrial production contracted -4.1% mom in March, much worse than expectation of -1.2% mom. Production of capital goods fell by -15.4% mom, intermediate goods by -1.8% mom, energy by -0.9% mom and non-durable consumer goods by -0.8% mom, while production of durable consumer goods rose by 2.8% mom.
EU industrial production declined -3.6% mom. Among Member States for which data are available, the largest monthly decreases were registered in Ireland (-26.3%), Sweden (-3.9%) and Germany (-3.1%). The highest increases were observed in Finland (+3.0%), Slovenia (+2.3%), Czechia and Slovakia (both +1.7%).
Could This Week’s Data Reenergize Bank of Japan Expectations?
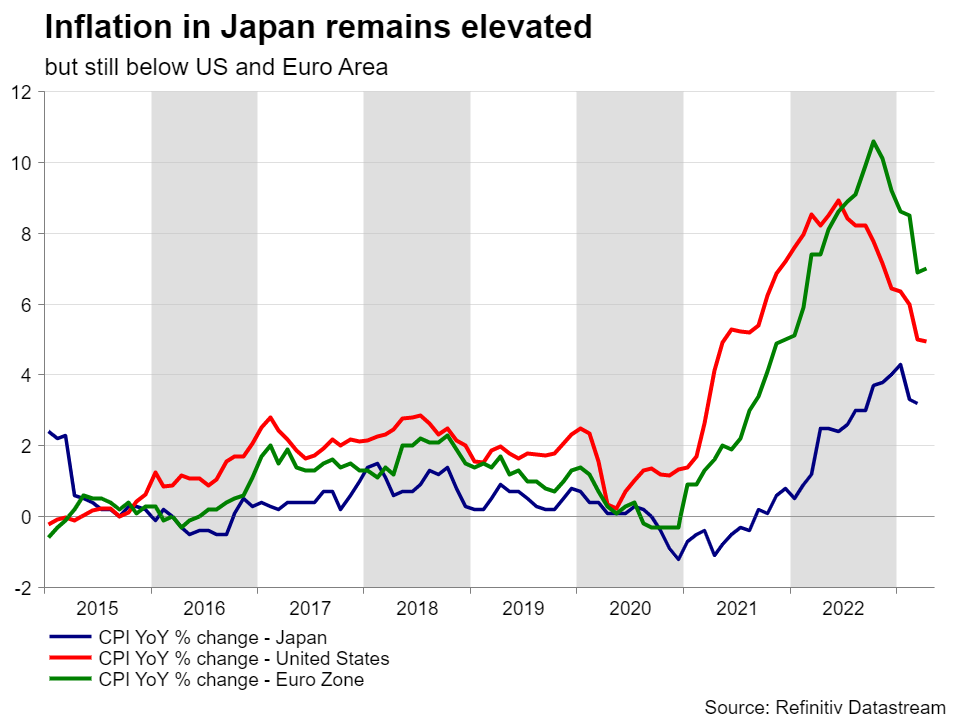
While the largest central banks globally are close to concluding an almost 2-year rate hiking cycle, the BoJ is still formulating its action plan. The new governor has yet to make an impact, but maybe this week’s data could influence his determination going forward. Additionally, the yen bulls might finally start to feel a bit more confident and possibly attempt a more sustainable rally against the euro.
What has been happening in Japan lately?
The April 28-29 BoJ meeting failed to satisfy the growing expectations as Governor Ueda opted for a low-key start of his tenure, making no changes at the monetary policy toolkit. The yen did not enjoy the lack of significant announcement(s) from the BoJ, but it has since been recovering against key currencies.
To be fair, the Japanese economy continues to show signs of life, when examining for example the Jibun PMI services for April and the consumer confidence survey. If we add to this mix the significant upside surprise at the April Tokyo CPI figures, then the country might be finally seeing light at the end of a long tunnel.
However, the BoJ remains extremely careful. The first version of meeting minutes – the full version will be published on June 21 – did not reveal much change from the Kuroda era. Interestingly though, the BoJ is focusing a lot on wages. Japanese employment has traditionally been high, but wage increases remained negligible. This changed dramatically this year with strong, above-inflation increases that should fuel consumer spending going forward. The BoJ is keen on sustainable wage increases, but it cannot intervene in the wage negotiations.
The market is clearly uncertain about BoJ’s next move, and prices in a very small chance of a policy rate change for the foreseeable future. This does not exclude tweaks in the YCC framework of course. And here lies a more medium-term issue for the BoJ. The other central banks are very close to concluding their rate hikes cycles, which means that they have built up some ammunition and are ready to react when the economy eventually slows down or even enters a recession. The BoJ though has very few available tools left to provide accommodation, as it already buys and holds a significant amount of Japanese bonds and Japanese stock ETFs.
First quarter GDP and national CPI – the starting point of Ueda’s tenure
In this environment we get a plethora of data. The national CPI print on Friday should confirm the stickiness of inflation at decent levels, especially when examining the performance of the last three decades. A weak set of data would not go down well for the BoJ and would complicate Ueda’s approach.
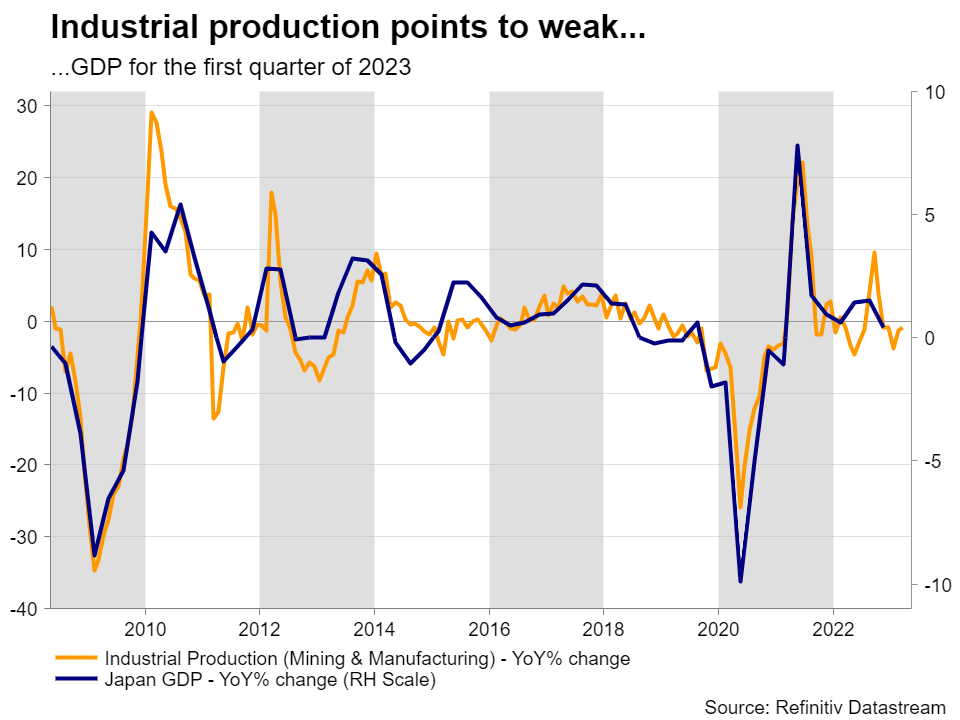
Additionally, on Wednesday we get the preliminary GDP for the first quarter of 2023. With the US and German prints surprising on the downside, there is sizeable risk for a similar outcome. The yen pairs are not expected to react lightly to a combination of weak data releases. To conclude, the annual G7 heads of state meeting will be held in Hiroshima on May 19-21; the Ukrainian developments and China are expected to dominate discussions.
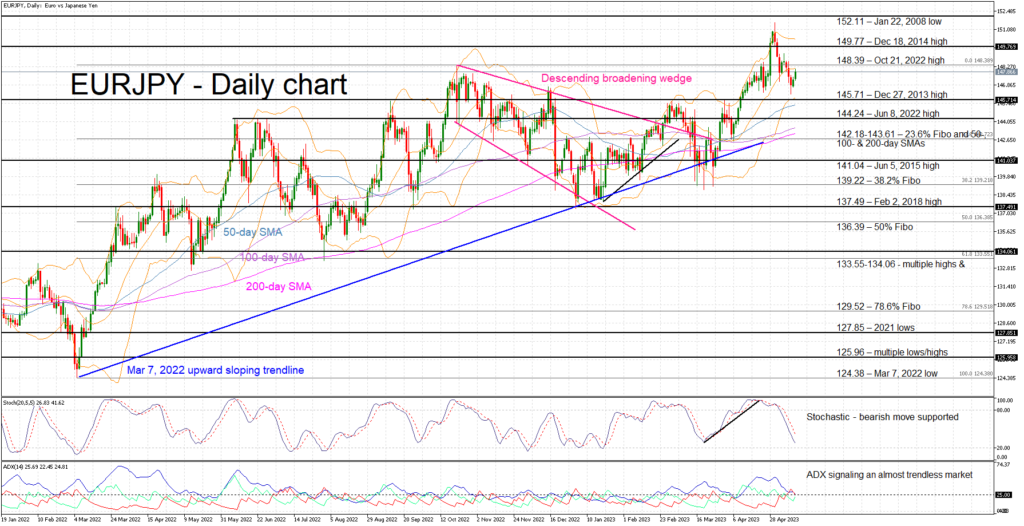
Yen tries to find its footing
Yen bulls are staging a decent pullback as they try to partly limit their losses from the strong rally that has been in place since March 7, 2022, and has resulted in the highest level of 151.61 since October 2008. This 15-year high has many explanations and ties up well with our analysis above.
Looking ahead, the yen bulls would enjoy a move below the 145.71 level in order to erase the latest upleg. The momentum indicators appear to be on their side at the moment, but the euro bulls have not lost their confidence. They acknowledge the need for a local trough and appear to be preparing for the next move higher with the first target being the October 21, 2022 high of 148.39.
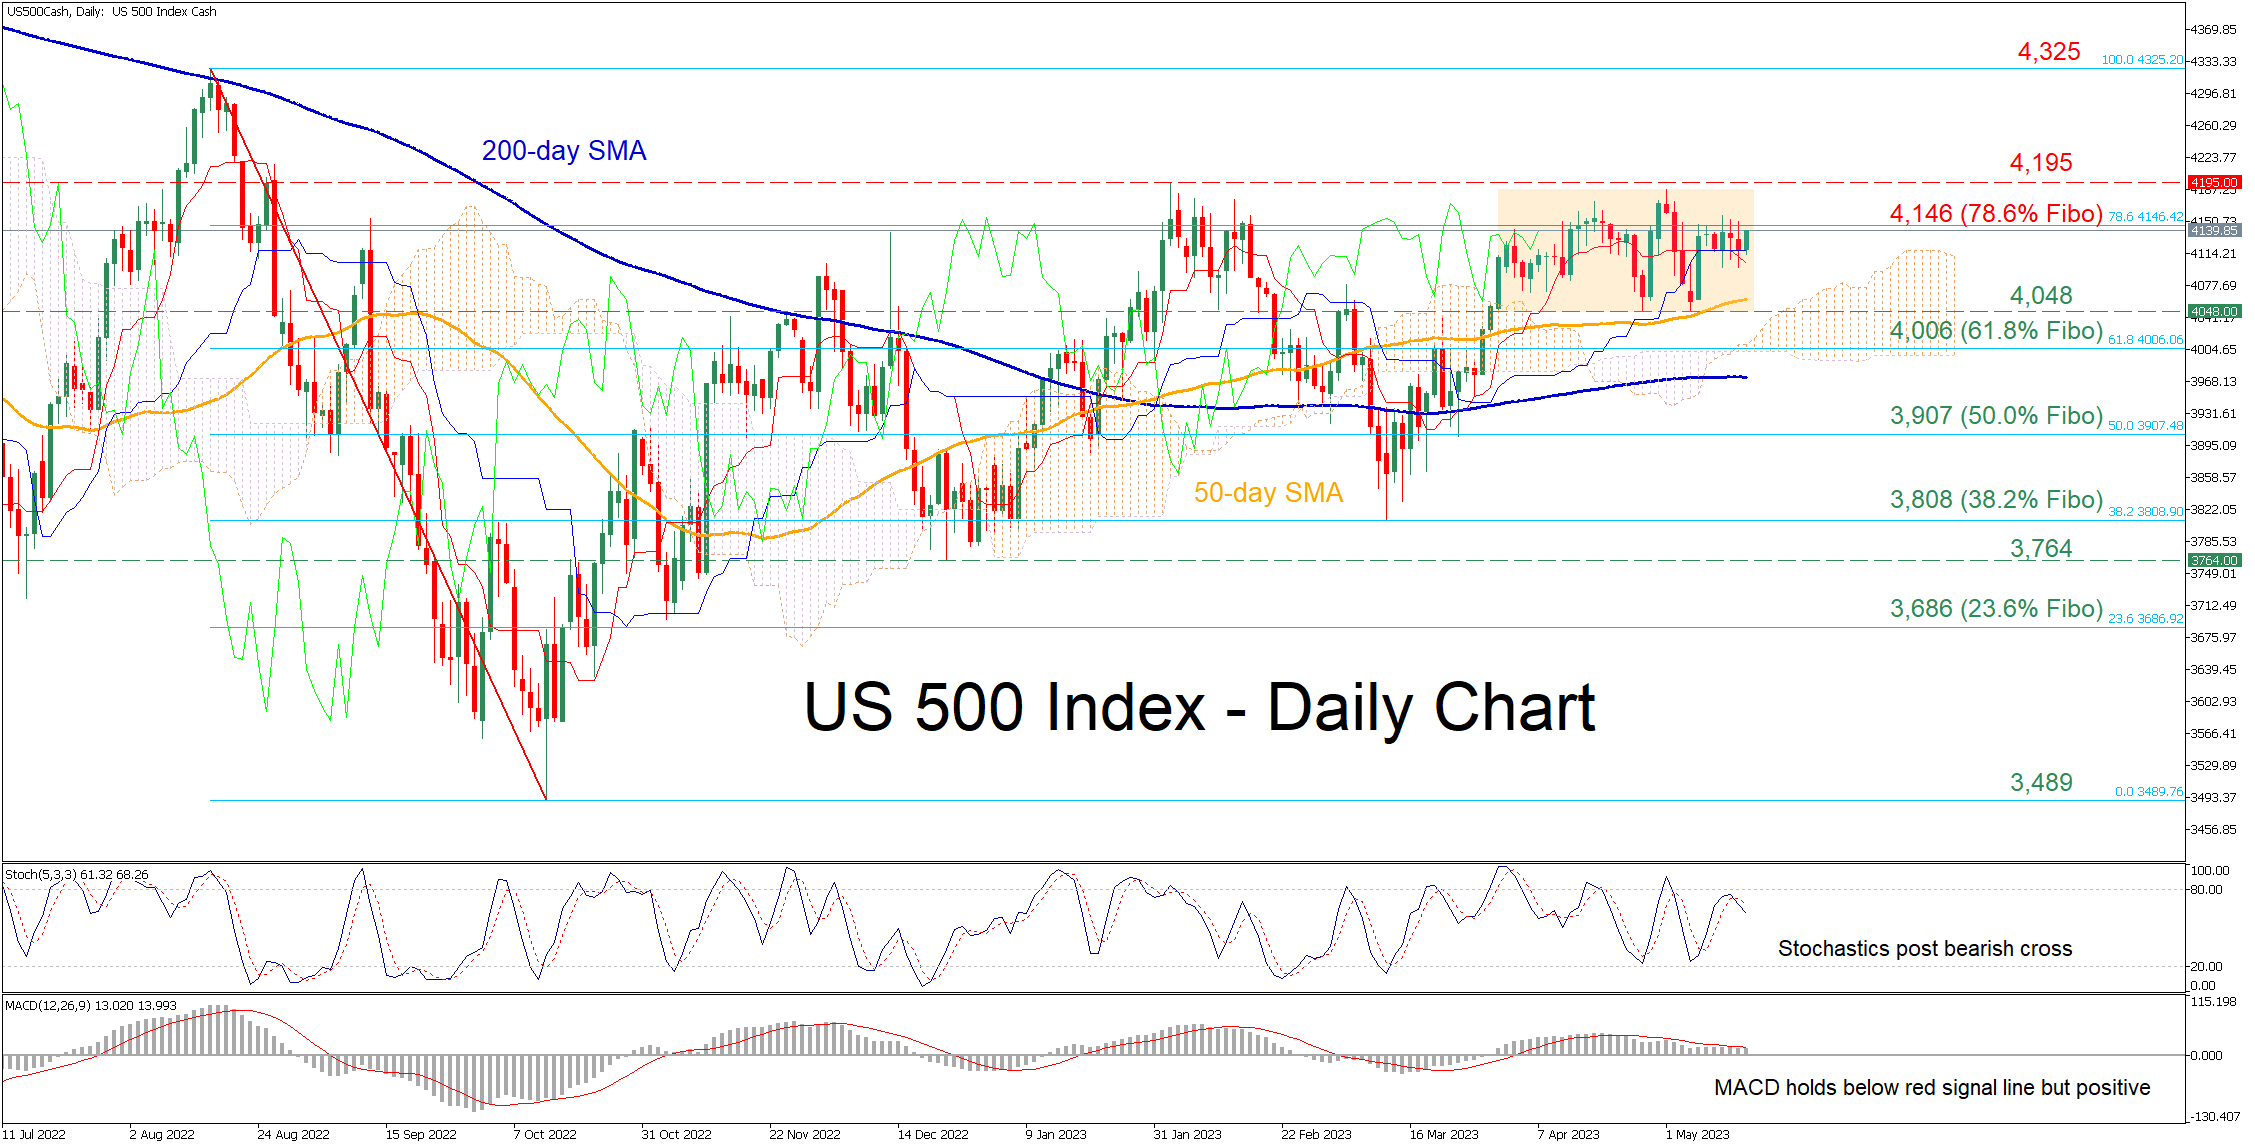
US 500 Index Extends Sideways Move
The US 500 stock index (cash) has been gaining ground since mid-March, slicing through both its 50 and 200-day simple moving averages (SMAs). Nevertheless, this recent advance faltered just shy of the 2023 peak of 4,195, with the price entering a consolidation phase beyond the 4,000 psychological mark.
The momentum indicators are tilting towards the bearish side. Specifically, the MACD dropped below its red signal line but remains in the positive zone, while the stochastic oscillator is ticking down after posting a bearish cross. However, the price is currently way beyond the Ichimoku cloud, hinting that the short-term technical picture has not turned negative yet.
If the selling interest intensifies, the price could descend towards 4,048, which is the lower end of the recent rangebound pattern and held its ground twice in the past month. A violation of that zone could open the door for 4,006, which is the 61.8% Fibonacci retracement of the 4,325-3,489 downtrend. Should that barricade fail, the bears might then target the 50.0% Fibo of 3,907.
On the flipside, bullish actions could face initial resistance at the 78.6% Fibo of 4,146. Clearing this hurdle, the price may extend its advance towards the 2023 peak of 4,195. A jump above that zone would send the price towards levels not seen in the past nine months, where the August 2022 high of 4,325 could curb any upside attempts.
To conclude, the US 500 index has been directionless after its short-term uptrend encountered resistance near the 2023 high. However, the price retains its short-term bullish structure and only a break below the 200-day SMA could shift the outlook to bearish.
GBP/USD and USD/CAD Weekly Chart Outlook
GBP/USD started a steady increase above the key 1.1880 resistance. USD/CAD is consolidating and might rise further toward 1.4000.
Important Takeaways for GBP/USD and USD/CAD Analysis
- The British Pound was able to clear the 1.1880 and 1.2000 resistance levels.
- There was a break above a major bearish trend line with resistance near 1.2250 on the weekly chart of GBP/USD on FXOpen.
- USD/CAD is facing strong resistance near the 1.3750 zone.
- It is trading inside a key contracting triangle with resistance at 1.3750 on the weekly chart at FXOpen.
GBP/USD Technical Analysis
On the weekly chart of GBP/USD at FXOpen, the pair formed a base above the 1.1250 zone and started a steady increase. The British Pound broke the key 1.1880 resistance zone against the US Dollar to enter a positive zone.
There was a move above a major bearish trend line with resistance near 1.2250 and the 50-week simple moving average. The pair settled above the 50% Fib retracement level of the main decline from the 1.4249 swing high to the 1.0327 low.
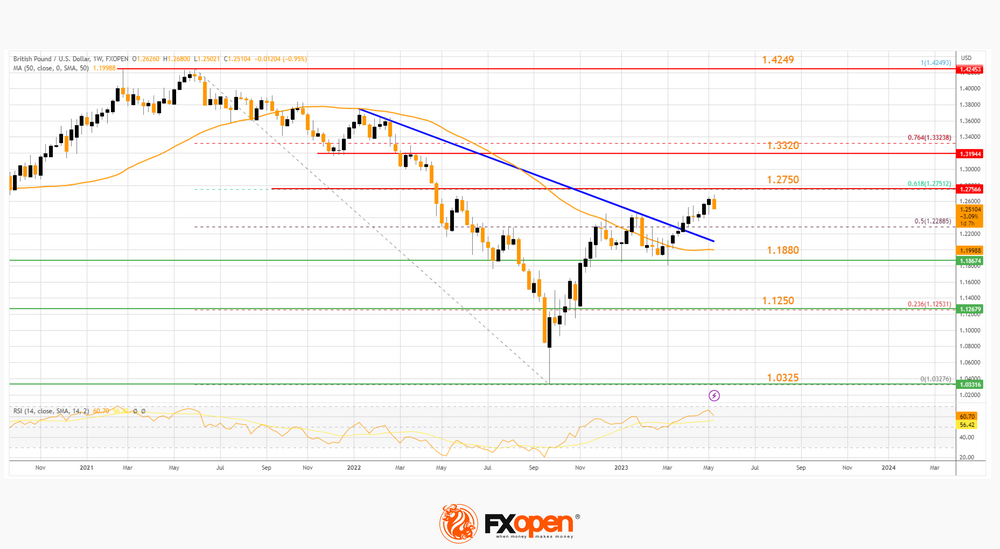
The GBP/USD chart suggests that the pair is now facing resistance near the 61.8% Fib retracement level of the main decline from the 1.4249 swing high to the 1.0327 low at 1.2750.
A clear upside break above the 1.2750 resistance might send the pair toward the 1.3320 resistance. Any more gains might send GBP/USD toward the 1.4250 level.
On the downside, initial support is near the trend line zone and 1.2200. The next major support is near the 1.1880 level. If there is a break below 1.1880, the pair could extend its decline. The next key support is near the 1.1250 level. Any more losses might call for a retest of the 1.0325 support.
USD/CAD Technical Analysis
On the weekly chart of USD/CAD at FXOpen, the pair started a fresh increase from the 1.2400 support. The US Dollar climbed higher above the 1.3000 resistance to move into an uptrend.
The pair even broke the 1.3750 resistance and spiked toward 1.4000. A high was formed near 1.3977 before the pair corrected gains. It is now trading inside a key contracting triangle with resistance at 1.3750.
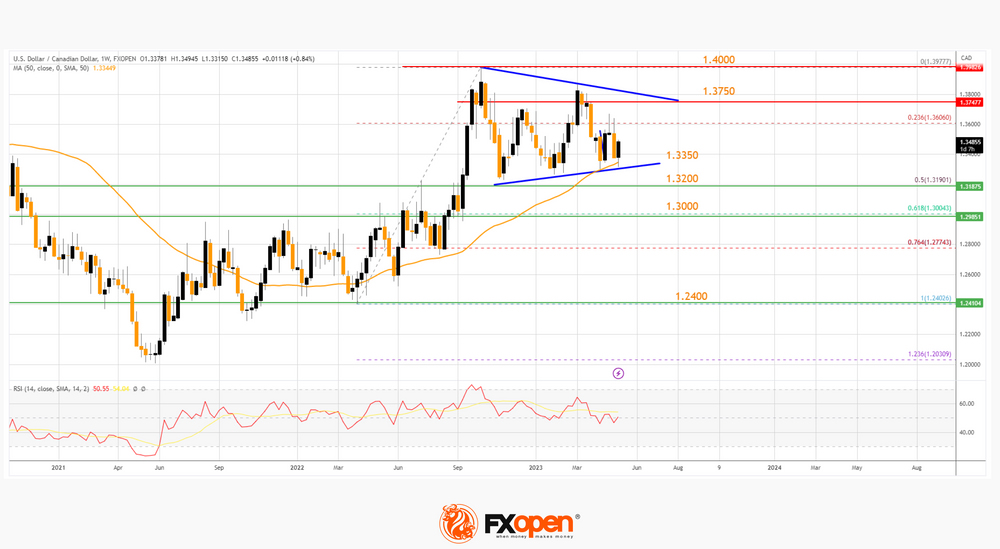
Immediate support on the USD/CAD chart is near the triangle trend line at 1.3350 and the 50-week simple moving average. The first major support is near the 50% Fib retracement level of the upward move from the 1.2402 swing low to the 1.3977 high at 1.3200.
The next major support is near the 61.8% Fib retracement level of the upward move from the 1.2402 swing low to the 1.3977 high at 1.3000. Any more losses may possibly open the doors for a drop toward the 1.2400 support zone in the medium term.
On the upside, the pair is facing resistance near the 1.3600 zone. The next major resistance is near the 1.3750 level. A clear break above the 1.3750 level could open the doors for more gains. The next major resistance is near the 1.4000 level, above which USD/CAD could rise steadily toward the 1.4200 resistance zone.
GBP/JPY Daily Outlook
Daily Pivots: (S1) 168.40; (P) 168.77; (R1) 169.34; More...
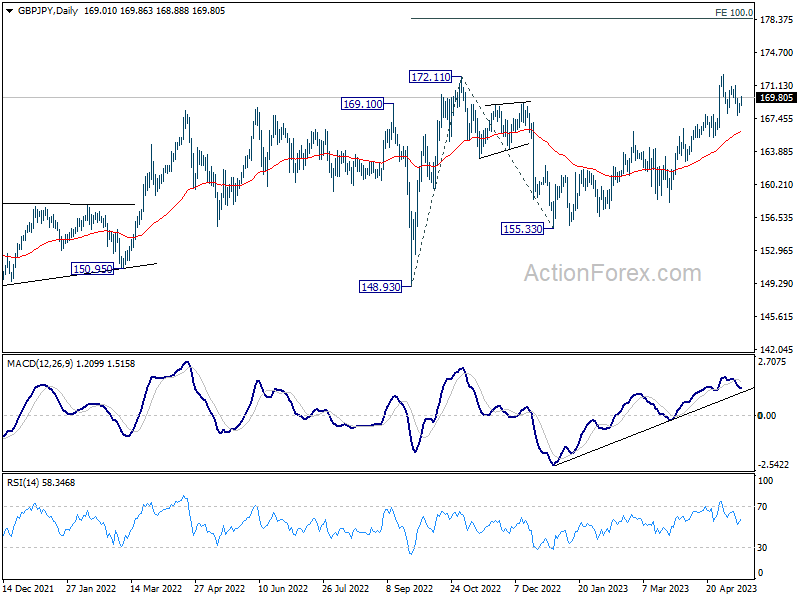
Intraday bias in GBP/JPY remains neutral as range trading continues below 172.30. On the upside, break of 172.30 will resume larger up trend to 100% projection of 148.93 to 172.11 from 155.33 at 178.51. Nevertheless, firm break of 167.95 should confirm short term topping, and turn bias back to the downside for deeper pull back to 165.40 support and possible below instead.
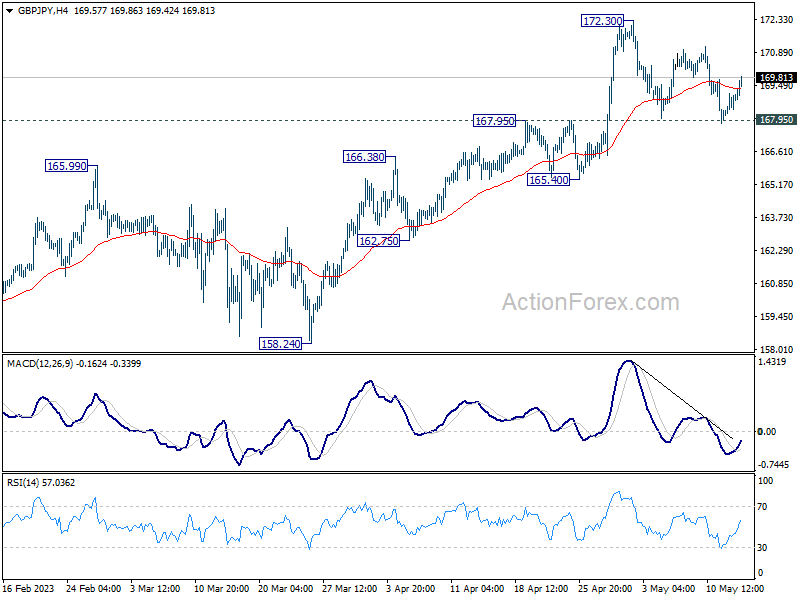
In the bigger picture, focus stays on 172.11 resistance (2022 high). Decisive break there will resume whole up trend from 123.94 (2020 low). Next target will be 161.8% projection of 122.75 (2016 low) to 156.59 (2018 high) from 123.94 at 178.69. Nevertheless, firm break of 165.40 support will indicate rejection by 172.11 and extend the corrective pattern from there with another falling leg.
EUR/JPY Daily Outlook
Daily Pivots: (S1) 146.81; (P) 147.14; (R1) 147.62; More....
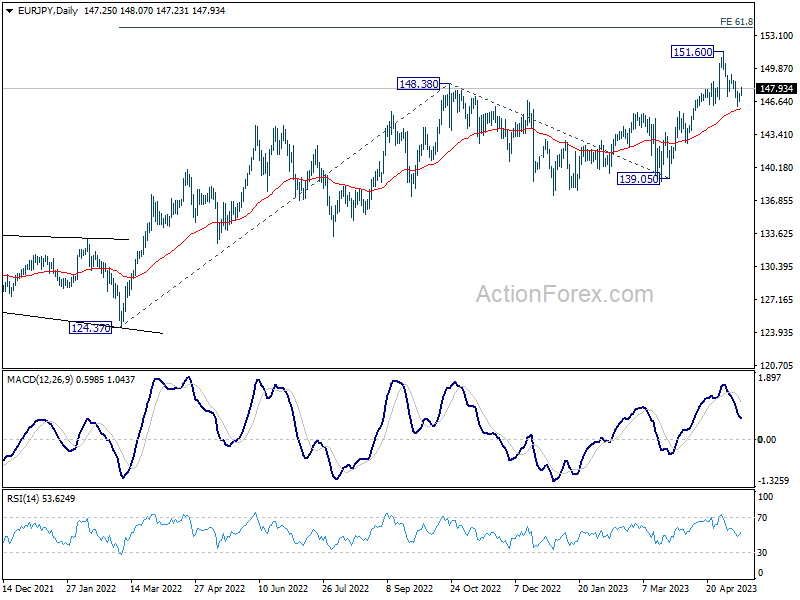
Intraday bias in EUR/JPY is neutral for consolidation above 146.12 temporary low first. But further decline is in favor as long as 149.25 resistance holds. Sustained trading below 55 D EMA (now at 145.93) will bring deeper pull back to 61.8% retracement of 139.05 to 151.60 at 143.84. On the upside, though, firm break of 149.25 will turn bias back to the upside for retesting 151.60 high instead.
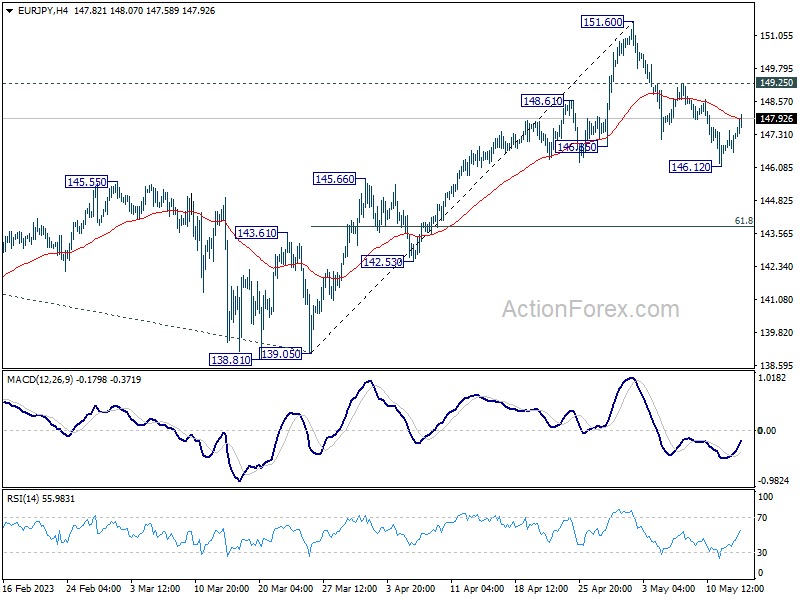
In the bigger picture, rise from 114.42 (2020 low) is in progress. Next target is 61.8% projection of 124.37 to 148.38 from 138.81 at 153.64. Sustained break there will pave the way to 100% projection at 162.82. For now, medium term outlook will remain bullish as long as 139.05 support holds, even in case of deep pull back.
EUR/GBP Daily Outlook
Daily Pivots: (S1) 0.8695; (P) 0.8714; (R1) 0.8733; More...
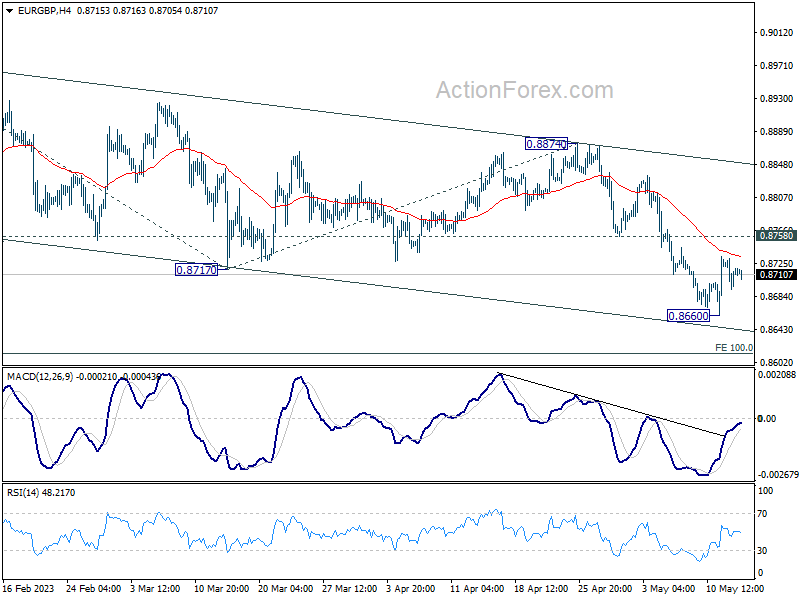
Intraday bias in EUR/GBP remains neutral for consolidation above 0.8660. Further decline is expected as long as 0.8758 resistance holds. On the downside, break of 0.8660 will resume recent decline to 100% projection of 0.8977 to 0.8717 from 0.8874 at 0.8614. Nevertheless, break of 0.8758 minor resistance will turn bias back to the upside for stronger rebound.
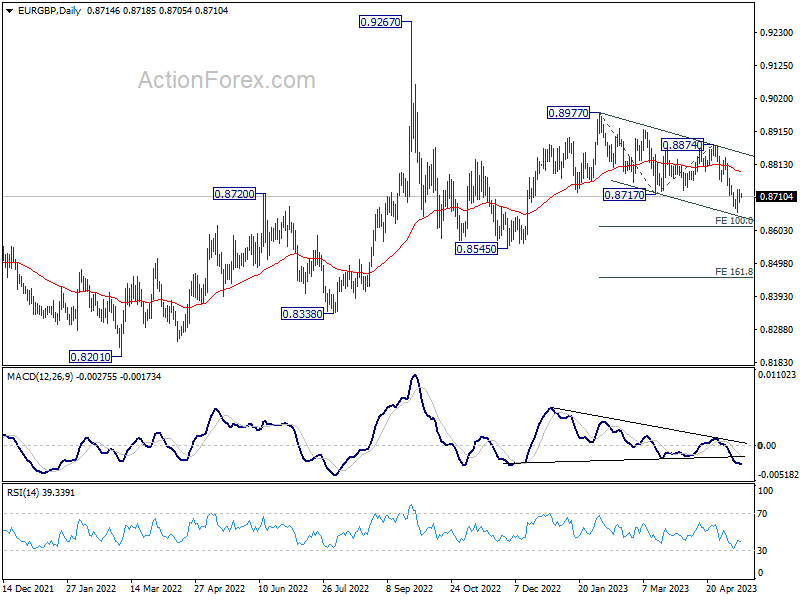
In the bigger picture, current development argues that whole decline from 0.9267 (2022 high) is still in progress. This is part of the long term range pattern from 0.9499 (2020 high). Deeper fall would be seen through 0.8545 support. his will now remain the favored case as long as 0.8874 resistance holds.
EUR/AUD Daily Outlook
Daily Pivots: (S1) 1.6289; (P) 1.6320; (R1) 1.6365; More...
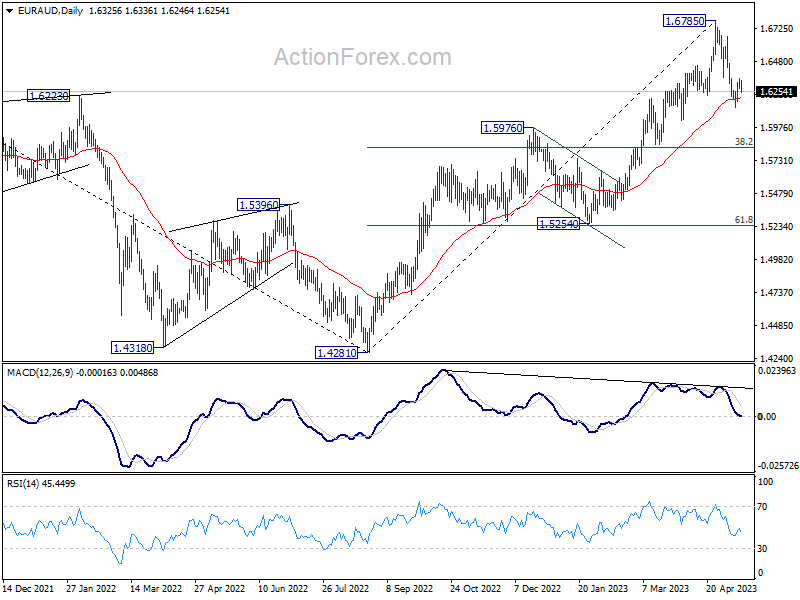
Intraday bias in EUR/AUD remains neutral first and further decline is expected with 1.634 minor resistance intact. Considering bearish divergence condition in D MACD, fall from 1.6785 might be a correction to whole up trend from 1.4281. Break of 1.6134 will target 38.2 retracement of 1.4281 to 1.6785 at 1.5828, which is inside 1.5254/5976 support zone. Nevertheless, sustained break of 1.6354 minor resistance will turn bias back to the upside for retesting 1.6785 high instead.
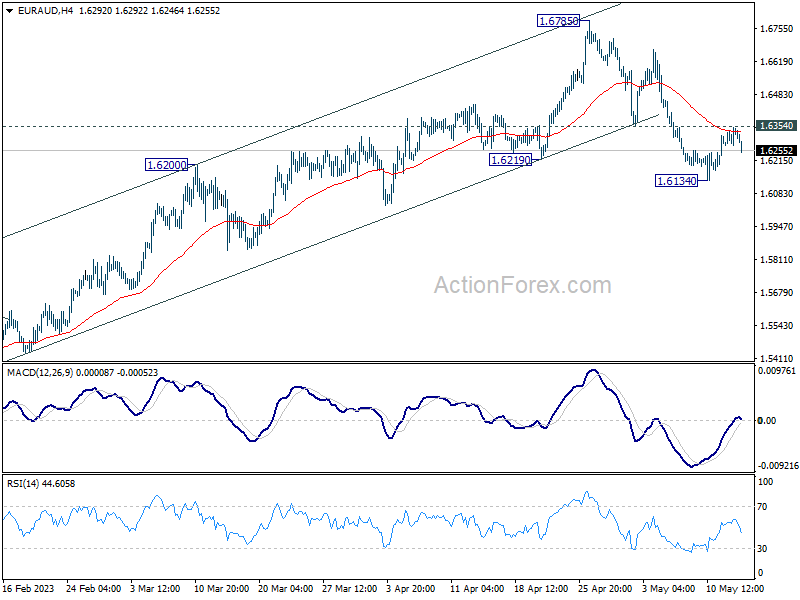
In the bigger picture, whole down trend from 1.9799 (2020 high) should have completed at 1.4281 (2022 low). Further rise should be seen to 61.8% retracement of 1.9799 to 1.4281 at 1.7691 next. For now, outlook will stay bullish as long as 1.5976 resistance turned support holds, even in case of deep pull back.
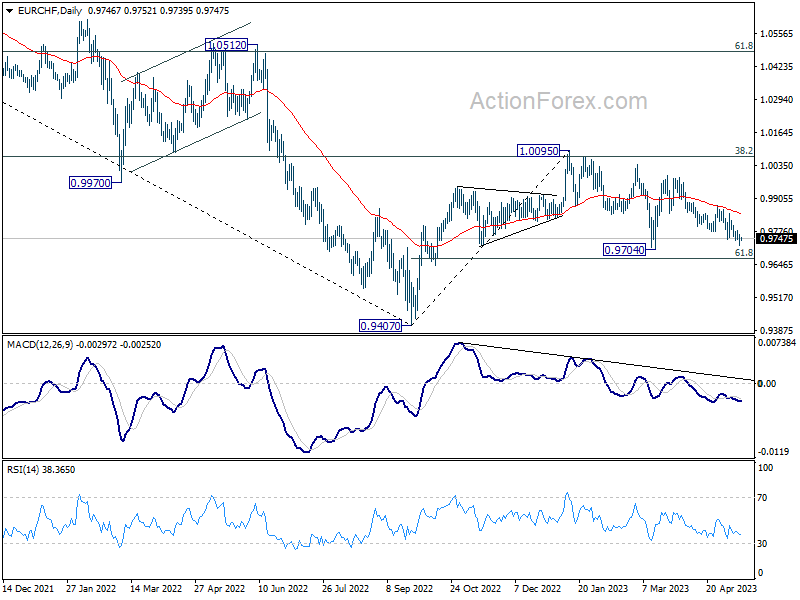
EUR/CHF Daily Outlook
Daily Pivots: (S1) 0.9725; (P) 0.9747; (R1) 0.9771; More...
Intraday bias in EUR/CHF remains mildly on the downside as the choppy decline from 0.9995 is in progress. Strong support should be seen from 0.9704 to bring rebound. Break of 0.9847 will argue that the fall has completed and turn bias back to the downside. However, firm break of 0.9704 will resume the whole decline from 1.0095 to 61.8% retracement of 0.9407 to 1.0095 at 0.9670.
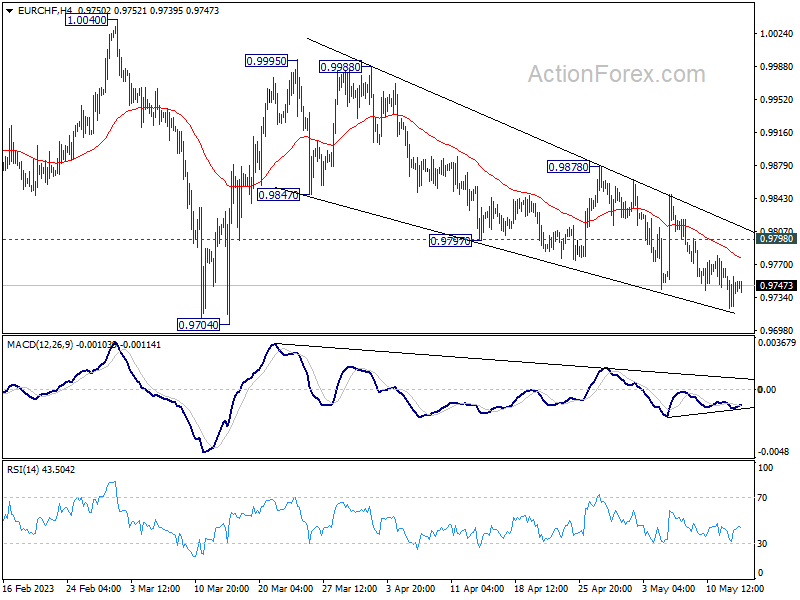
In the bigger picture, prior rejection by 38.2% retracement of 1.1149 to 0.9407 at 1.0072 suggests that medium term outlook is staying bearish. The pair is also capped below 55 W EMA (now at 0.9963). Down trend from 1.2004 is not completed yet and is in favor to resume through 0.9407 at a later stage. However, decisive break of 1.0095 resistance will raise the chance of bullish trend reversal. Rise from 0.9407 should then target 1.0505 cluster resistance (2020 low at 1.0505, 61.8% retracement of 1.1149 to 0.9407 at 1.1484).