Sample Category Title
AUD/USD Technical Analysis
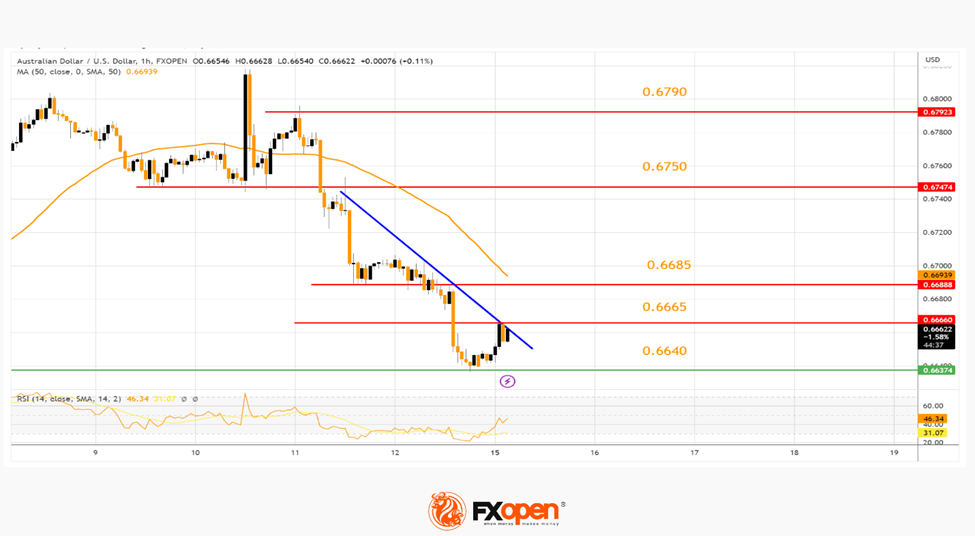
On the hourly chart of AUD/USD at FXOpen, the pair started a fresh decline from the 0.6790 resistance. The Aussie Dollar traded below the 0.6750 support to move into a bearish zone.
The pair tested the 0.6640 zone and is currently consolidating losses. It is slowly moving higher and approaching a key bearish trend line with resistance near 0.6655 on the hourly chart. The next key resistance is near 0.6685 and the 50-hour simple moving average.
If there is an upside break above the 0.6685 zone, the pair could rise steadily toward the 0.6750 level. Any more gains might send AUD/USD toward 0.6790.
On the downside, there is a decent support near the 0.6640 level. A downside break below the 0.6640 support might open the doors for a test of the 0.6620 support. Any more losses might send AUD/USD toward the 0.6580 support.
EURUSD Falls into Bearish Control
EURUSD traded muted near Friday’s one-month low of 1.0847 early on Friday after suffering its worst week since mid-September, having retreated from a one-year high of 1.1094.
Technically, the bears pressed the price below key trendlines and beneath its 20- and 50-day exponential moving averages (EMAs), dampening hopes for a bullish continuation. The weekly chart is also witnessing a negative tendency as the pair seems to have completed a bearish doji candlestick pattern after failing to crawl above its 200-weekly EMA.
Also, with the RSI trending lower below its 50 neutral mark and the MACD decelerating below its red signal line, the pair might be at risk of another downside correction. If this proves to be the case, the price may tumble towards the 1.0760 constraining zone, while lower, it may test the 1.0700 psychological level before meeting the 200-day EMA and the support trendline from September’s lows near 1.0630. The 38.2% Fibonacci retracement of the 2020-2022 downtrend is in the neighborhood too around 1.0600. Hence, a clear step below the latter point might add more fuel to the sell-off.
Alternatively, a bounce back above 1.0886, where the 50-day EMA intersects the broken support trendline, may lead the price up to the 23.6% Fibonacci mark of 1.0940 and the 20-day EMA. Then, the bulls will need to tackle the tough barrier of 1.1025-1.1094 in order to advance towards the March 2022 peak of 1.1184.
In brief, EURUSD is expected to resume its negative momentum in the short term, likely revisiting the 1.0700 zone. Otherwise, a successful move above 1.0886-1.0940 is required to shift the focus back to the upside.
Gold Finds Support Near 20-day SMA and Holds Above 2,000
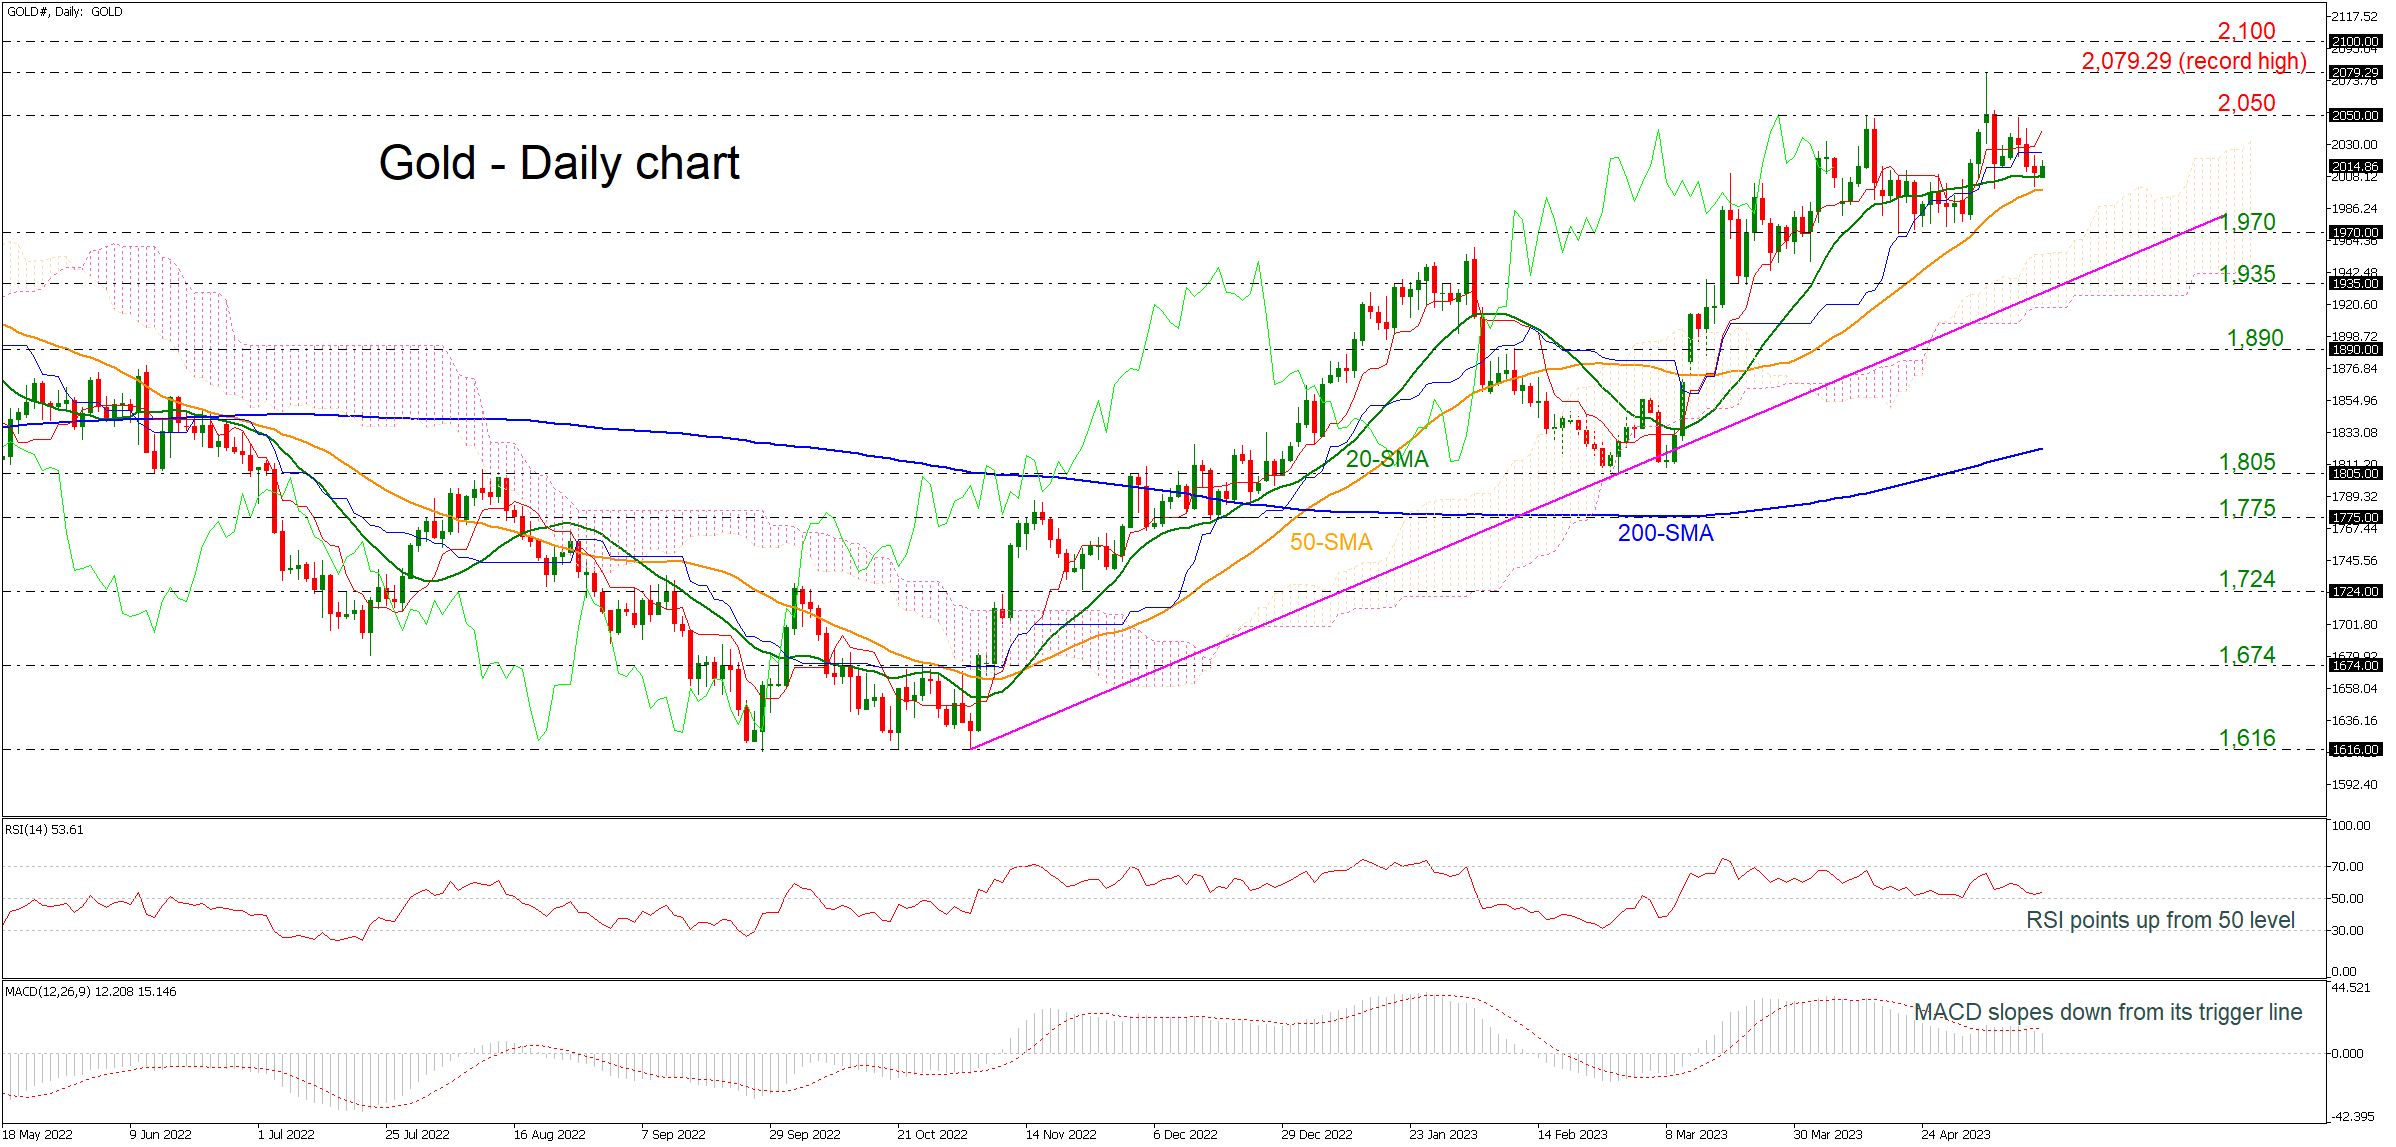
Gold is finding a strong support level near the short-term 20-day simple moving average (SMA) and remains well above the 2,000 level, confirming the long-term upside structure. The RSI is pointing north above the neutral threshold of 50, while the MACD is losing some momentum beneath its trigger line in the positive region.
Should the pair manage to strengthen its positive momentum, the next resistance could come around 2,050. A break above the aforementioned level would shift the bias to a more bullish one and open the way towards the 2,079.29 record high before the focus turns to the 2,100 psychological mark.
However, if prices are unable to break higher in the next few sessions, the risk may be to the downside, meeting first the 50-day SMA at 1,998 ahead of the 1,970 barrier. The next key support to watch lower down is 1,935 and the ascending trend line near 1,920.
To sum up, the outlook currently remains positive since prices are holding above all the moving average lines and the rising trend line.
SP 500: Ignoring US Debt Ceiling Standoff Risk
- US debt ceiling limit of US$31.4 trillion may be reached on 1 June.
- Prior movement of implied bond market volatility during the 2011 US debt ceiling standoff provided a leading indicator for the uptick in US stock market volatility.
- Given the current loop-sided performance among the major US benchmark stock indices, the downside adjustment to offset the relatively low level of the VIX may be significant.
The US debt ceiling limit is now getting closer to hitting the US$31.4 trillion cap that was approved previously in December 2021. Failure to extend the current ceiling and the shortfall in tax revenue collections to cover fiscal policies spending at this juncture will render the US government inability to issue new bonds to pay for its existing obligations.
US government at risk of technical default after 1 June
US Treasury Secretary Yellen warned earlier that based on current projections, the X-date, when the US government could lose the ability to meet all its payment obligations, could arrive as early as 1 June. Since the middle of January, the US Treasury has started to withhold scheduled contributions to a federal employee retirement fund and keep paying debts to delay the ceiling limit from being breached.
Based on the latest update from the US Treasury last Friday, 12 May, it had just US$88 billion worth of extraordinary measures left to enable it to pay the existing bills as of 10 May and this amount is justly slightly above a quarter of the US$333 billion of authorized measures that are still available to keep the US government from running out of borrowing room under the current debt ceiling limit of US$31.4 trillion.
Hence, time is running out for Congress to approve an extension of the debt ceiling before 1 June, and failure to do so increases the risk of a first-ever technical default in the US government’s obligations which has the potential to roil financial markets via a tightening in credit conditions via a similar downgrade of the long-term outlook and even credit rating of US sovereign bonds by credit rating agencies that occurred in the summer of 2011.
What happened to the markets during the 2011 debt ceiling standoff?
The 2011 US debt ceiling partisan squabbles started around 9 April 2011 between then Obama’s Democrats White House Administration and the Republicans’ controlled House.
Due to extraordinary measures and various accounting methods, the 2011 US debt ceiling extension deadline was prolonged to 2 August 2011. During this period, there were lots of drama, intense negotiations, and “horse trading” among key leaders of the Democrats and Republicans on tax cuts and fiscal spending to reduce the budget deficit.
A point to note is that during this period, the global financial markets had another risk factor to consider which was the European sovereign debt crisis inflicted on Greece, Portugal, and Spain.
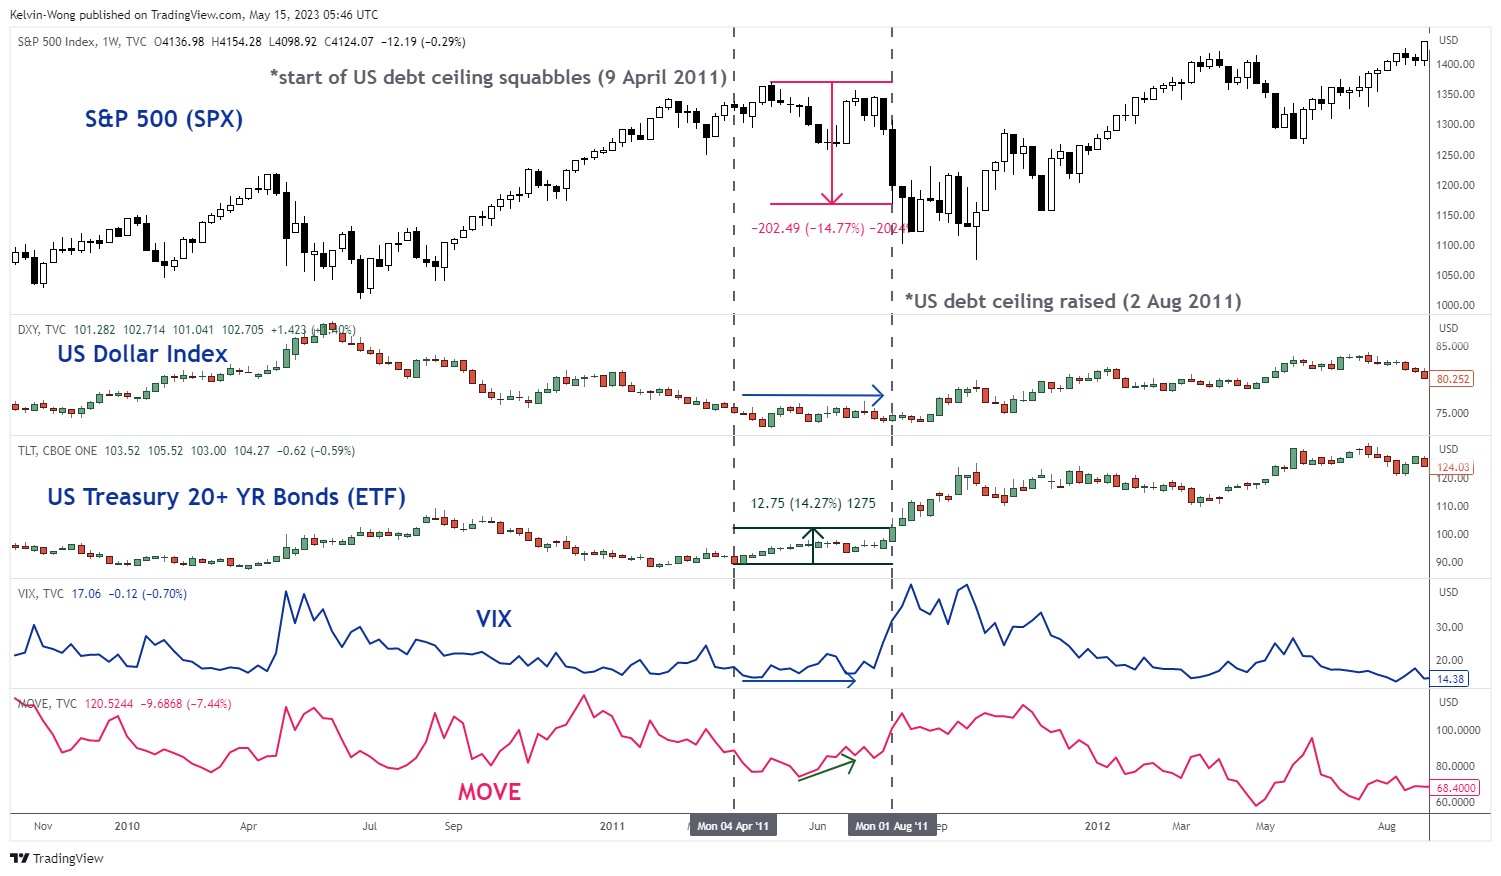
Fig 1: S&P 500, US Dollar Index, US Treasury Bonds, VIX & MOVE during 2011 US debt ceiling standoff.
(Source: TradingView, click to enlarge chart)
Before the US debt ceiling limit extension was finally approved by US Congress on 2 August 2011, the S&P 500 had tumbled by -15% from its May 2011 high to its August 2011 low and even fall further to record an accumulated loss of -20% before it hit a major swing low in early October 2011.
The US Dollar Index was almost unchanged during this period whereas else there was a flight to safety despite the credit ratings and outlook downgrade from Standard & Poor’s on the US sovereign debt from AAA to AA+ that saw the US Treasury 20+ year bonds ETF (TLT) to record return of +14% over the same period.
What’s interesting was the Chicago Board Options Exchange (CBOE) Volatility Index, the VIX, a measurement of the 30-day forward-looking volatility of the S&P 500 remained “calm” at around a level of 15 that indicating complacency before the S&P 500 recorded its most severe sell-off during May 2011 to Oct 2011.
In contrast, the ICE BofAML MOVE Index tracks the implied volatility (over-the-counter options) of the US Treasury yield on 2-year, 5-year, 10-year, and 30-year US Treasuries have ticked up before the S&P 500 plummeted. Hence, the bond market started to price the heightened risk of a credit condition crunch or squeeze that could be detrimental to equities via a higher cost of funding ahead of the VIX Index.
What are the volatility crystal balls of the MOVE and VIX saying now?
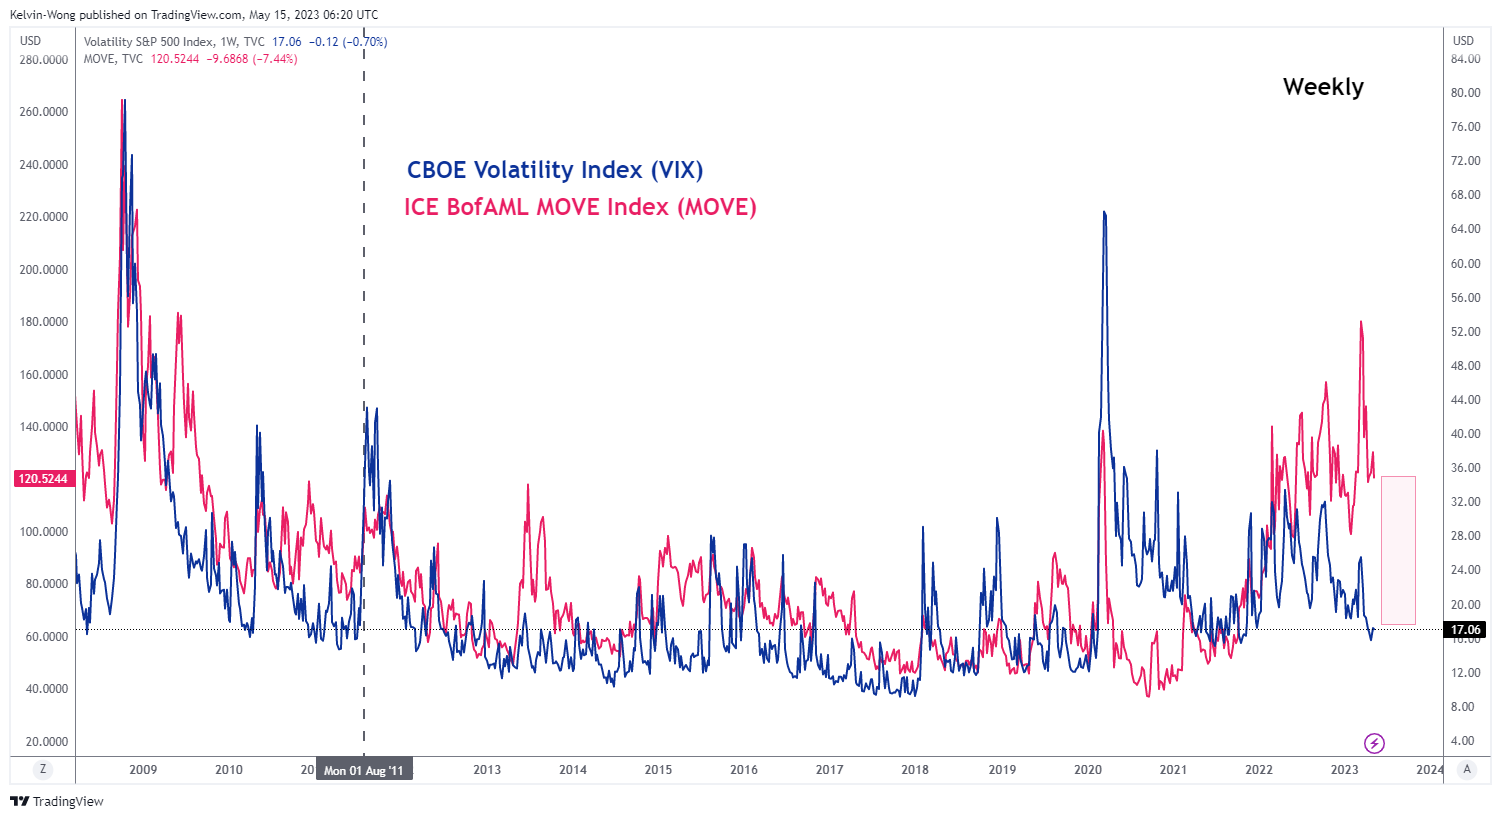
Fig 2: VIX & MOVE trend as of 12 May 2023 (Source: TradingView, click to enlarge chart)
Based on last Friday, 12 May data, the VIX has continued to plummet to 17.06 which is close to a 2-year low but in contrast, the MOVE Index has remained at an elevated level of 120.50 and this is still higher than the 90.00 level reached during the onset of the summer 2011 US debt ceiling extension negotiations.
Hence, the MOVE Index has now started to price in the risk of a risk-off scenario via a spike in the US Treasury yields which in turn may provide a leading signal for the VIX to stage a rebound at such low levels of “complacency”.
Thus, given the current loop-sided performance of the major US stock indices where the technology and long-duration concentrated Nasdaq 100 outperformed the rest of the pack with a current year-to-date return of (+21.9%) over the S&P 500 (+7.4%), Dow Jones Industrial Average (0.5%) and the Russell 2000 (-1.2%), the downside risk of the Nasdaq 100 and S&P 500 is indeed still a “live” event that may occur in the coming weeks as the clock ticks closer to 1 June coupled with an external risk of on-going geopolitical tensions and sticky inflationary environment.
EUR/USD: Weekly Close Below Key Fibo Support Was Bearish Signal
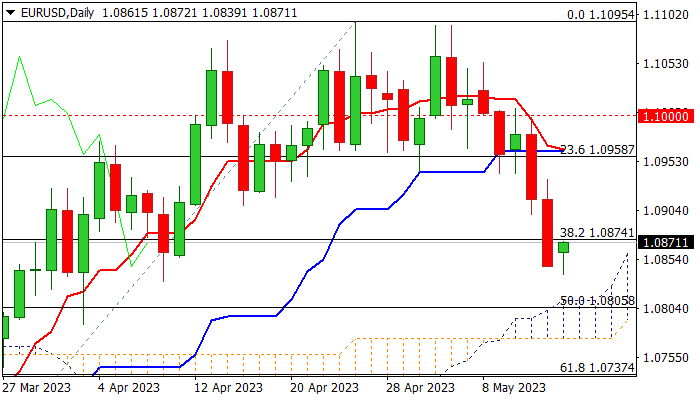
The Euro is consolidating within a narrow range in early Monday following strong acceleration lower last Thu/Fri and the biggest weekly loss since mid-February.
The pair also registered a weekly close below pivotal Fibo support at 1.0874 (38.2% of 1.0516/1.1095 rally), which generated bearish signal and further soured near-term sentiment.
Bears cracked rising 55DMA (1.0851) but find temporary footstep here and likely to consolidate as daily stochastic is oversold.
We are at the breakpoint, with sustained break of 1.0874/51 supports to open way for further weakness towards next strong supports at 1.0812/05 (top of rising and thickening daily cloud / 50% retracement of 1.0516/1.1095).
Daily studies maintain negative momentum and converged daily Tenkan-sen/Kijun-sen are about to form a bear-cross and reinforce near-term bearish bias.
Upticks should ideally stall under last Friday’s high (1.0935) to keep near-term bearish structure intact and offer fresh selling opportunities, while stronger acceleration higher and close above 1.0965 (daily Tenkan/Kijun-sen) would sideline bears and signal possible end of correction, which will require confirmation on lift and close below psychological 1.10 barrier.
Res: 1.0914; 1.0935; 1.0960; 1.1000.
Sup: 1.0831; 1.0812; 1.0774; 1.0737.
USD Bounces Back
USD/CHF tests key resistance
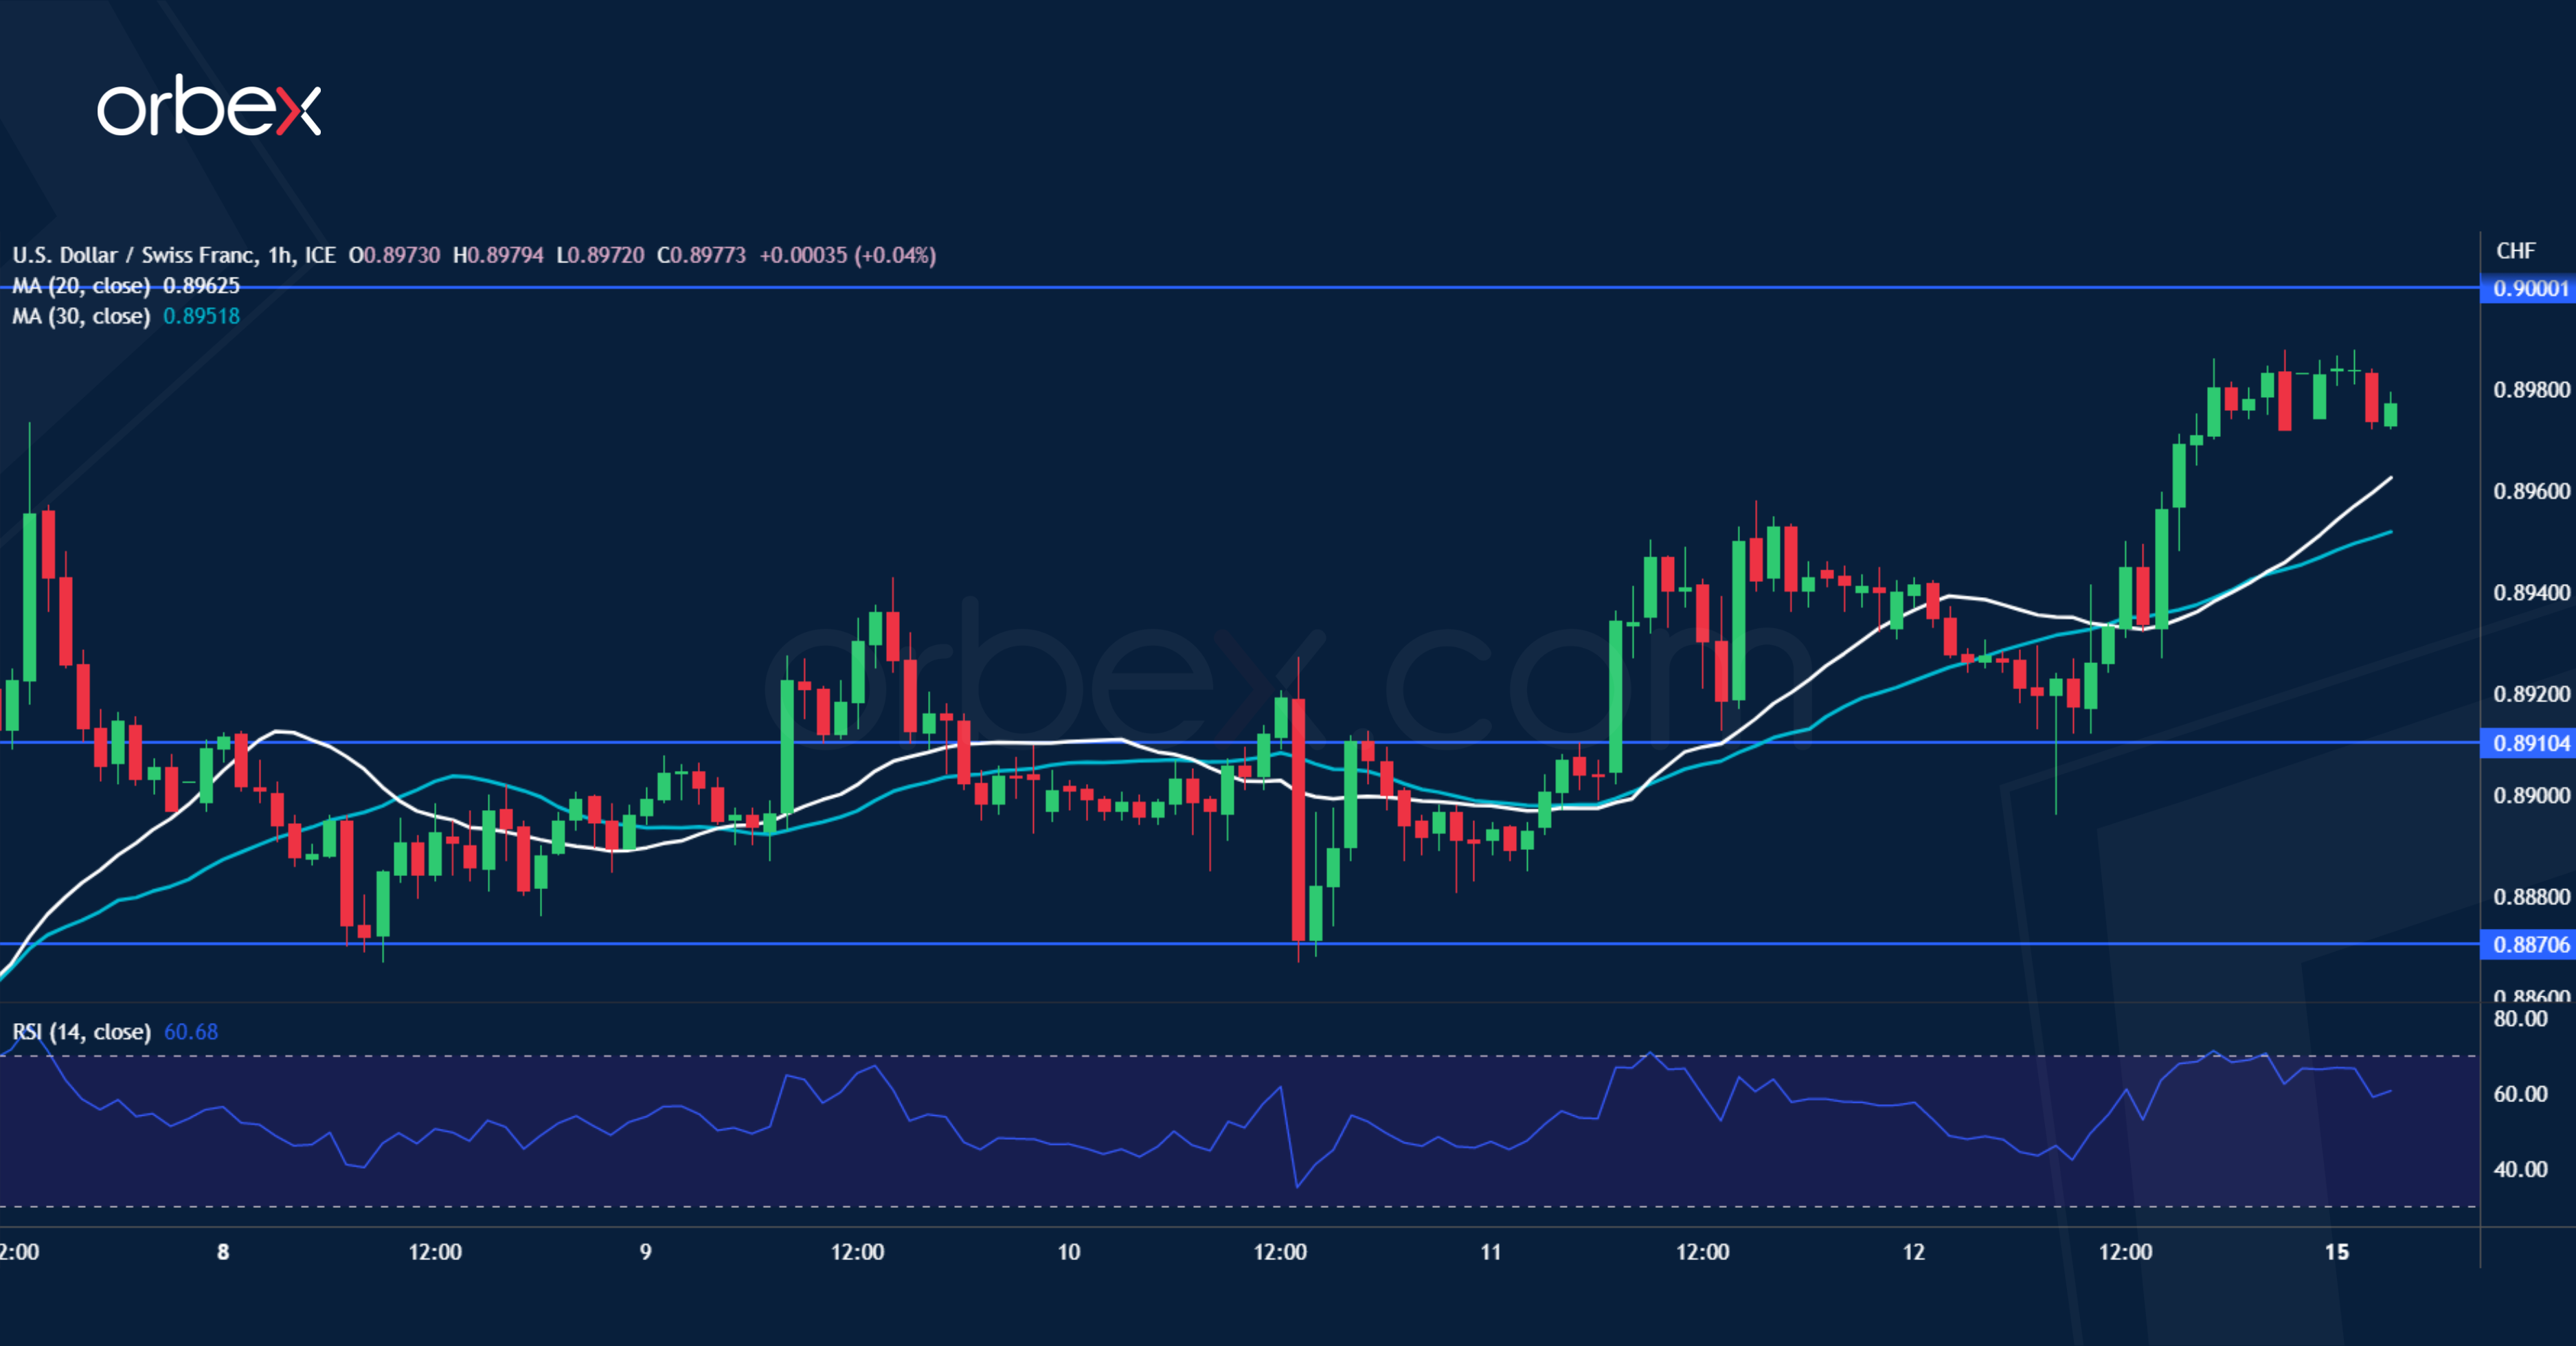
The US dollar bounces higher as signs of a slowing economy fuel demand for a safer currency. The pair has been grinding its way up from a 28-month low near 0.8820 and is aiming at the psychological level of 0.9000 which so far has acted as an offer magnet. A bullish breakout would prompt sellers to exit in mass and pave the way for a sustained rebound towards 0.9100. As the RSI flirts with the overbought area, 0.8910 is the first support and 0.8870 a second layer to maintain the current impetus in case of a fallback.
EUR/GBP struggles to bounce
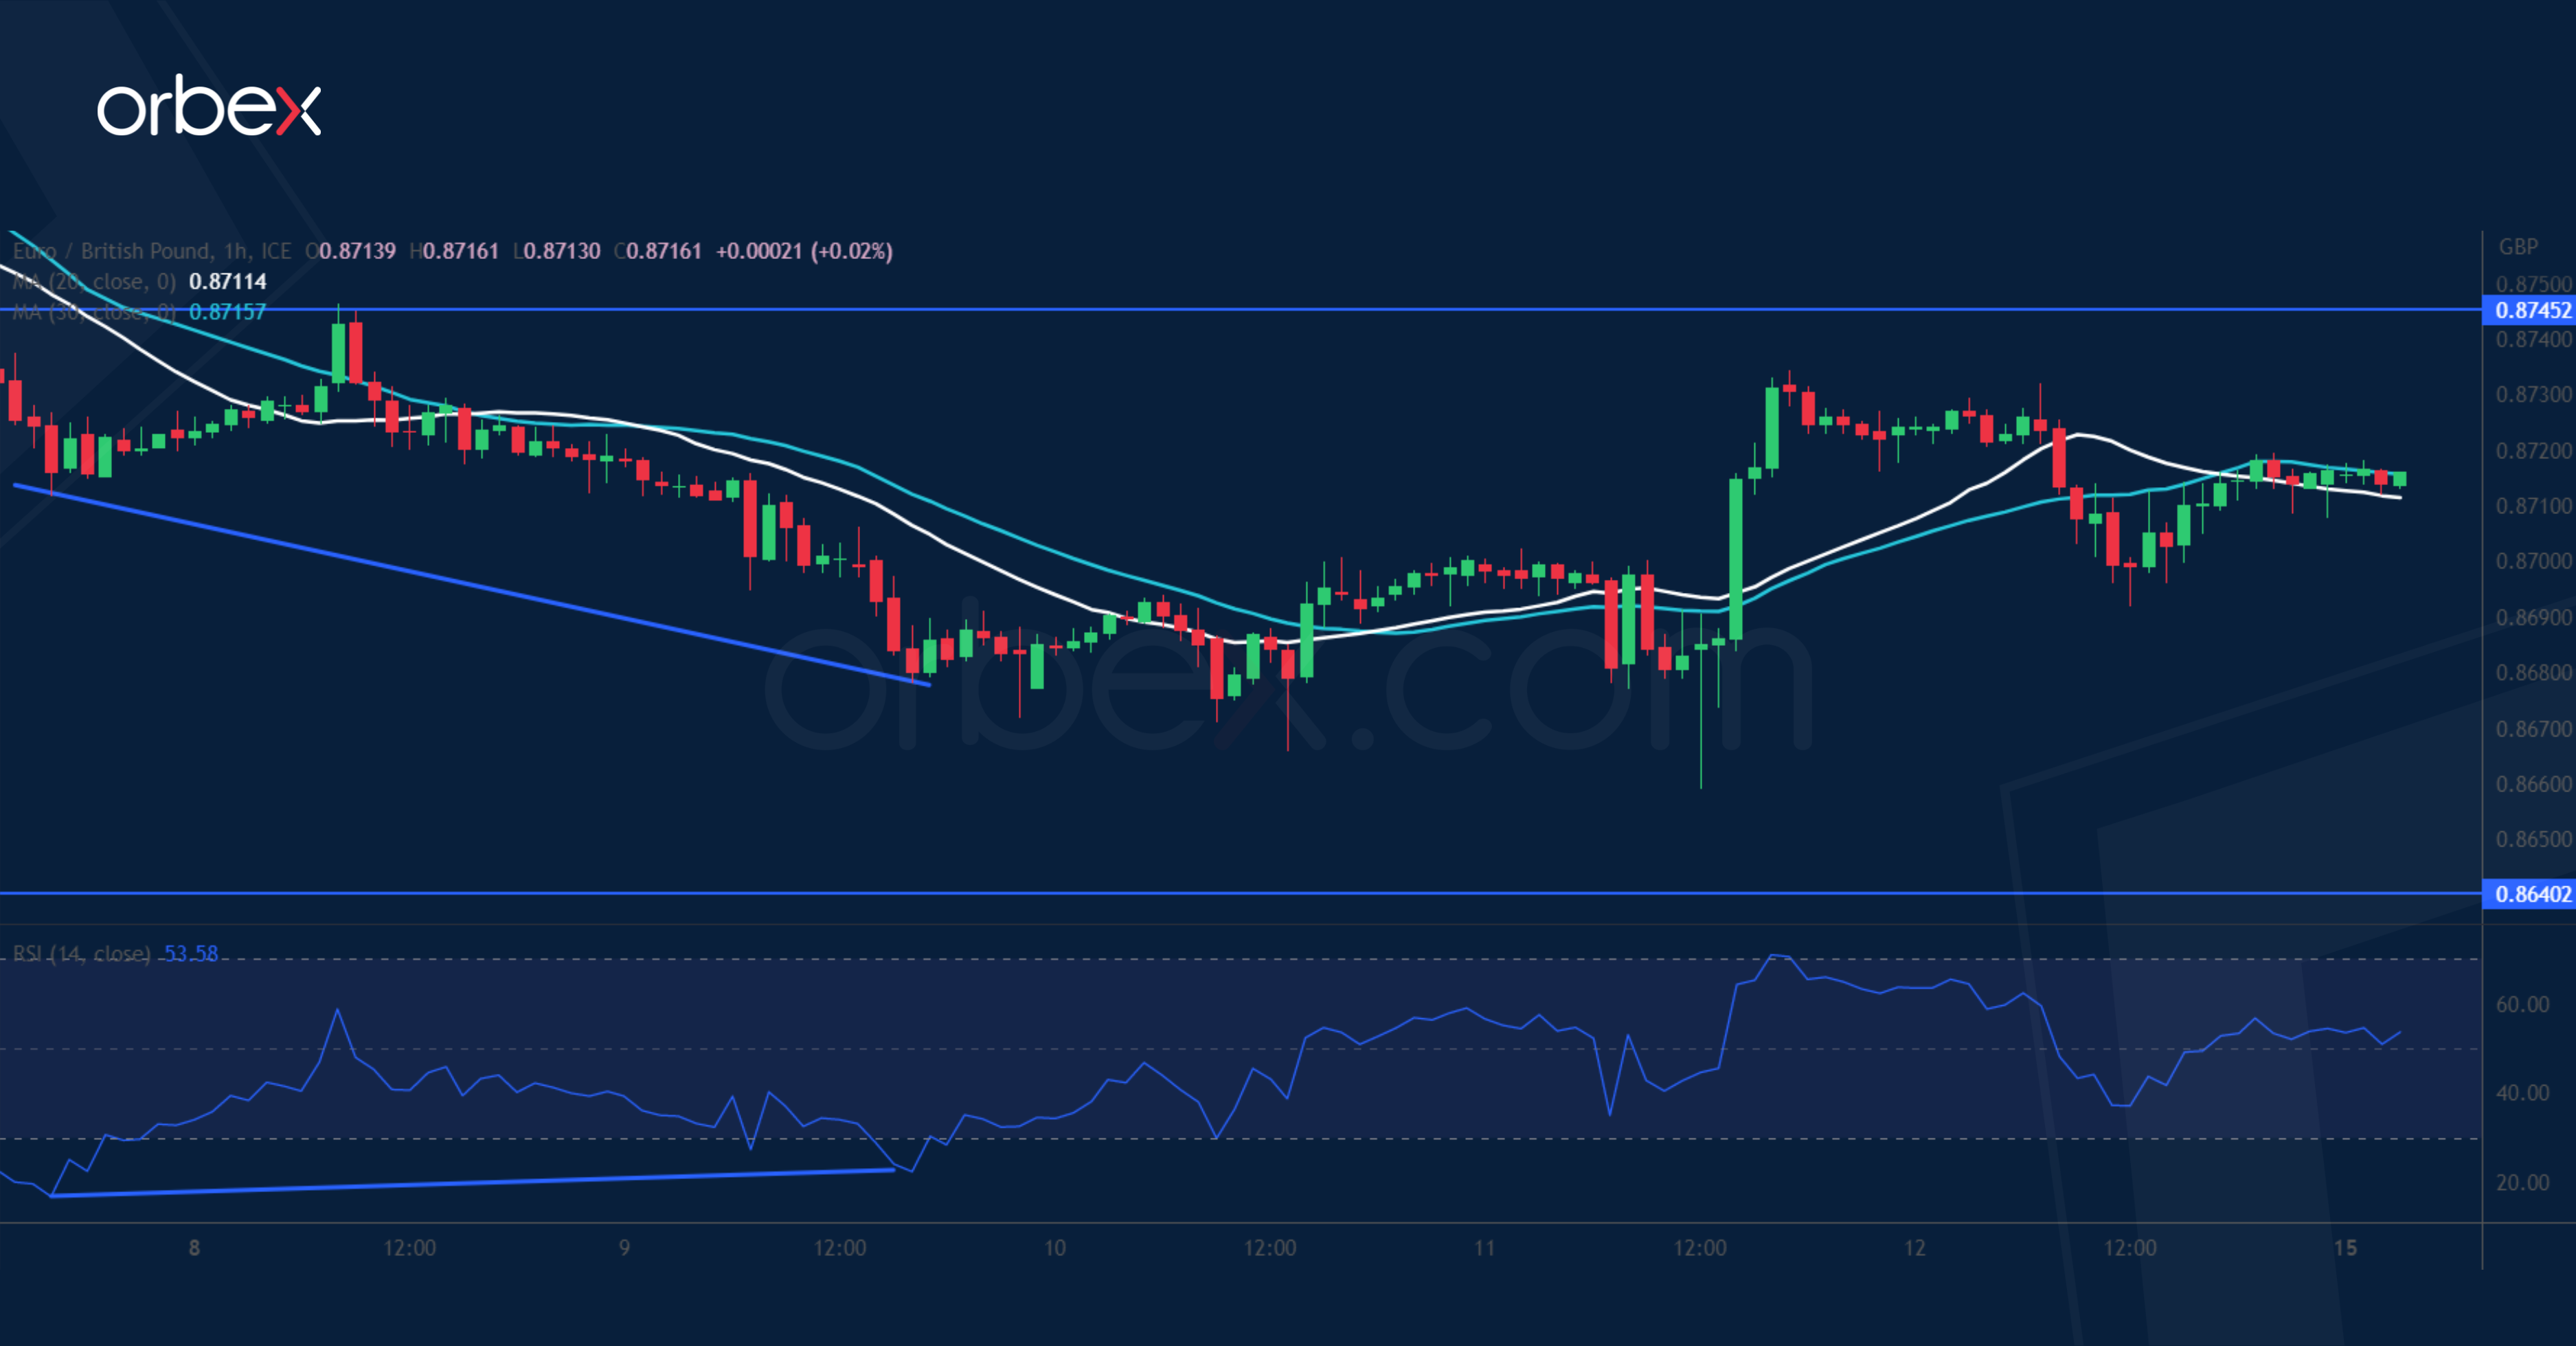
The pound holds as the UK narrowly avoided recession with 0.1% growth in Q1. The pair has dropped back to near the start of the breakout rally back in December 2022. A bullish RSI divergence in the vicinity of this important demand zone suggests a slowdown in the bearish drive. 0.8745 is the first obstacle to clear, then the bulls will need to lift the confluence of the support-turned-resistance of 0.8790 and the daily SMAs in order to instil some optimism. A break below 0.8640 would expose last December’s low of 0.8550.
GER 40 hits psychological level
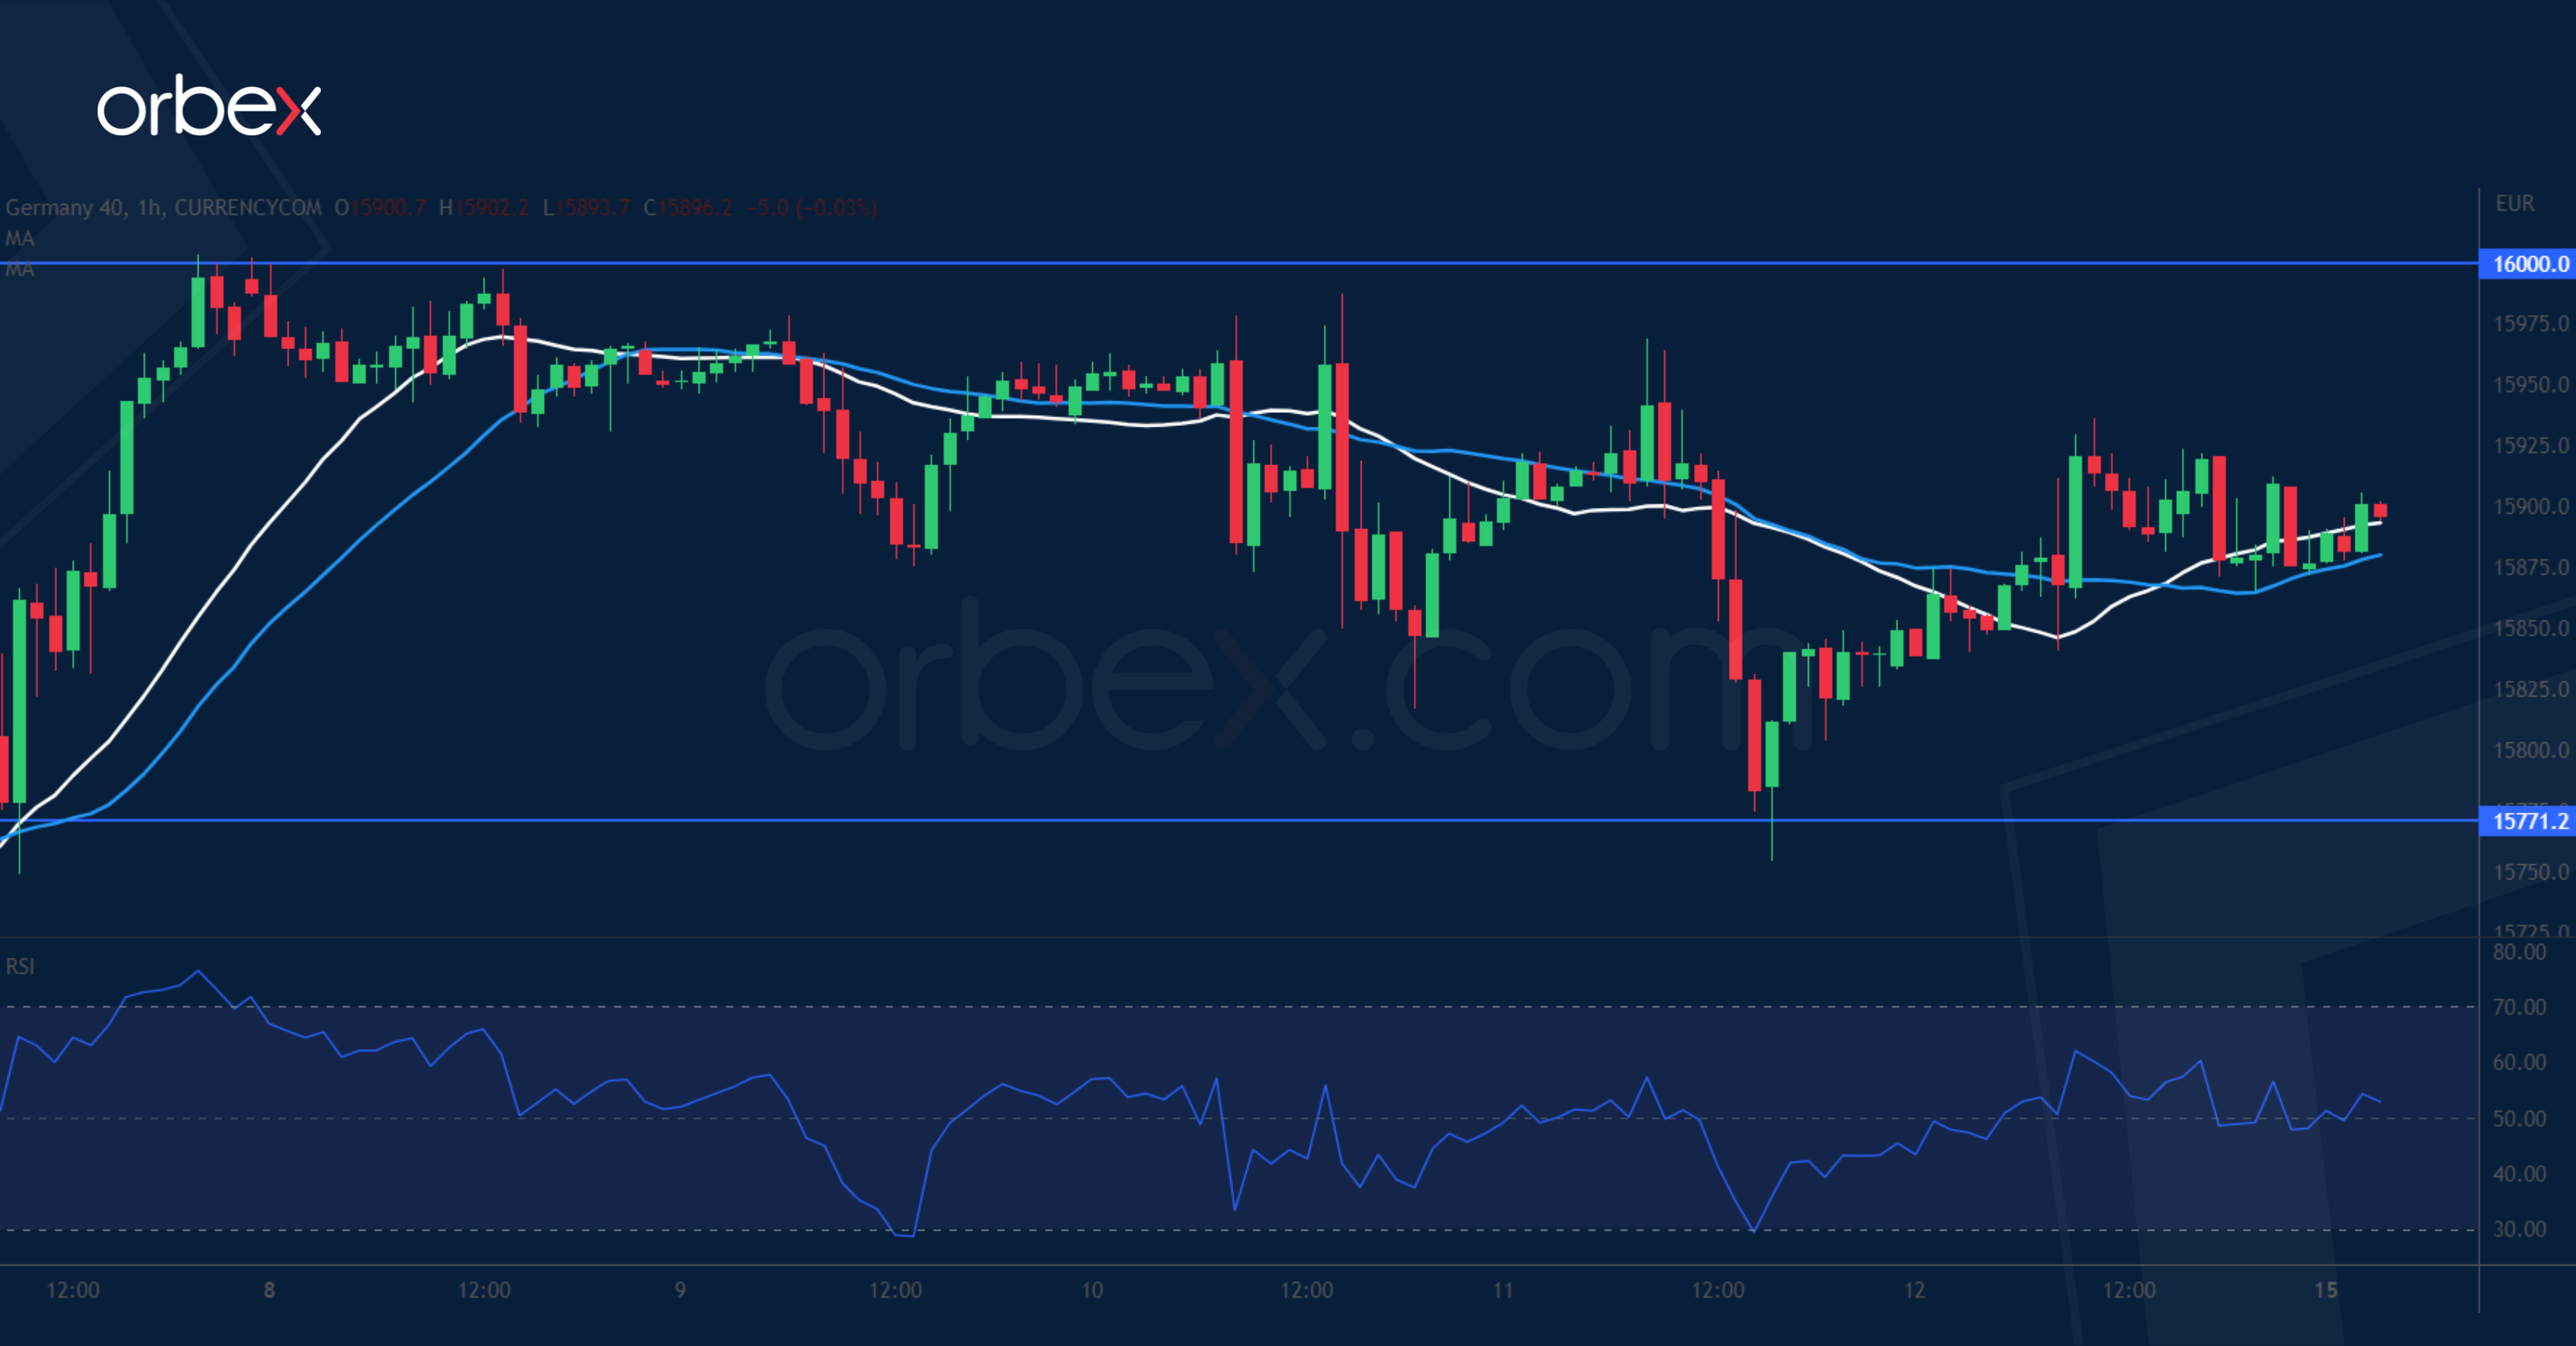
The Dax 40 retreats as investors fret more interest rate hikes are in the pipeline. The price has come off the psychological tag of 16000 where a previous spike revealed strong selling interests. The subsequent retracement has found support at 15770, giving the bulls another chance to push higher. A bullish breakout would trigger a runaway rally to the all-time high of 16300 from November 2021. On the downside, the swing low of 15650 next to the 30-day SMA is key in keeping the upward bias valid in the short-term.
Euro Having Harder Time Against Both Dollar and Sterling
Markets
May University of Michigan consumer confidence unexpectedly set the tone for the final WS trading session of last week. The headline indicator fell more than expected, from 63.5 to 57.7, the lowest level since July of last year. Markets zoomed in on the forward looking inflation expectations component of the report though. 1-yr forward inflation expectations fell less than hoped, from 4.6% to 4.5% with long term (5-10yr) expectations picking up from 3% to 3.2 % (vs 2.9% consensus), the highest level since March 2011! Similar signs came from the NY Fed’s most recent Survey of Consumer Expectations (3y & 5y inflation expectations up 0.1 ppt) and in Europe from the ECB’s Consumer Expectations Survey. Median expectations for 1y and 3y EMU inflation respectively rose from 4.6% to 5% and from 2.4% to 2.9%. US Treasuries sold off after the Michigan survey, underperforming German Bunds. US yields added over 9 bps at the 2-7y part of the curve with longer tenors adding 5 to 8 bps. The US 2y yield closed just below the psychological 4% mark. A dissection of the yield increase shows that it was especially driven by higher US real yields, suggesting that markets probably pushed the idea of a conditional rate pause and especially H2 2023 rate cuts too far. German yields rose by 5-6 bps across the curve last Friday. The relative yield advantage, higher real yields and a risk-off climate (US stocks initially sold off in line with US Treasuries) supported last week’s USD rebound. EUR/USD closed at 1.0849 (lowest close since March 31) from an open at 1.0916. The trade-weighted dollar powered ahead to 102.71, taking out first minor resistance at 102.40.
Today’s eco calendar contains EU Commission economic forecasts and the US Empire Manufacturing Survey. We don’t expect them to interfere with recent market trends. Core bonds are trapped in sideways rages. Especially the topside in German Bund future and US T-Note seems very well protected. In FX space, the euro is having a harder time against both the dollar and sterling. Risk sentiment is shacky, but stronger than feared given lingering issues like the US debt ceiling and regional banking crisis. Several ECB/BoE/Fed members shed their views on policy and this will be a red line throughout the week. It serves as a wildcard. Key eco points this week include tomorrow’s UK labour market report and US retail sales. Strong UK labour data could further help sterling moving away from the EUR/GBP 0.8719 support area, broken last week.
News and views
Turkish presidential elections might head for a second run-off vote. According to results mentioned by Bloomberg President Tayyip Erdogan is leading by winning 49.3% of the votes while opposition leader Kemal Kilicdaroglu gained 45% support. The tally was made on the basis of more than 98% of the votes counted. One of the candidates needs to reach 50% of the votes to avoid a run-off. A run-off would take place on May 28 and could lead to a period of additional uncertainty for Turkish markets, including for the Turkish lira. The lira in early trading this morning is losing modest further ground trading at USD/TRY 19.625. Anadolu news agency reported that the current parliamentary alliance, including Erdogan’s AKP and the Nationalist Movement party, managed to hold on to their majority, clinching 323 seats in 600-seat parliament.
Rating agency Fitch on Friday confirmed Italy’s credit rating at BBB with a stable outlook. Fitch took notice of stronger than expected growth in Q1 (0.5% Q/Q vs -0.2% expected). The rating agency upwardly revised Italy’s 2023 growth to 1.2%, but 2024 growth was downwardly revised to 0.8%. Fitch expects inflation to decline to an average 7.2% in 2023 and 3.5% in 2024 due to a normalization of energy prices and only limited second round effects. On fiscal policy, the agency indicated that recent Stability programme sets out credible fiscal goals in continuity with the fiscal policy of the previous government. The plan sets out a fiscal deficit of 4.5% in 2023, 3.7% in 2024 and 3% in 2025. The rating agency even sees risks for lower deficits as the government started from conservative assumptions. Fitch expects the debt-to-GDP ratio to decline to 142.3% of GDP in 2024 (was 144.4% in 2022). While this is a decline of 12.6 ppts compared to the peak in 2020, it is still above the pre-pandemic level of 134.1% (2019).
PBoC Extends Liquidity as Fed Doves Fly Away Amid Jump in US Inflation Expectations
The People’s Bank of China (PBoC) kept the interest rates unchanged at today’s monetary policy meeting, but extended long-term liquidity to boost anemic Chinese growth.
Many analysts expected a rate cut from the PBoC today, after the latest set of economic data revealed slowing exports and a faster-than-expected fall in Chinese inflation – both being a strong sign of insufficient growth momentum for the EM giant.
Today’s status quo in PBoC rate policy strengthens odds for an imminent PBoC rate cut. The first rate cut is expected in June.
But interestingly, the higher PBoC liquidity and looser PBoC rate expectations couldn’t boost global growth optimism this Monday. Crude oil slipped below $70pb, while copper futures slipped below the 200-DMA last week, and remain under decent selling pressure despite the PBoC news.
US inflation expectations jump
Data released Friday showed that the US consumer sentiment fell to a 6-month low, as long-term inflation expectations jumped to a 12-month high, fueling worries that the Federal Reserve (Fed) may not stop hiking the interest rates, or, it won’t be able to cut the rates anytime soon.
The June rate hike expectations rose to around 16%, the dollar index rallied past the 50-DMA and equities fell.
Selloff in equities were also fueled by a renewed pressure on US regional bank stocks as the selloff in PacWest shares extended to a second day after the bank revealed having lost nearly 10% of its deposits last week.
The S&P 500 tested the 4100, but closed the week a few points above this psychological mark, while Nasdaq advanced to a fresh high since last summer, but gave in to higher yields and close the session 0.37% lower.
While the Fed rate discussions swing in both directions, the ongoing stress on the US regional bank level will likely bring the Fed to inject liquidity into the system to keep the financial system sound and stable. In this context, excess liquidity will likely continue being supportive for stock valuations.
Debt ceiling saga
Rising US yields and the US debt ceiling impasse are major drags to investor appetite.
The meeting that was supposed to take place between Biden and McCarthy on Friday was postponed to this week. The latter has been partly taken as a sign that the staff level negotiations progress, and that an eventual agreement on spending could pave the way for an agreement on debt ceiling.
But nothing is less sure, and the debt ceiling suspense will likely continue until the last minute, keeping investors cautious, looking for safety in long-term US sovereign bonds and gold.
Tight, tight
Sunday’s Turkish election results were tight. According to the latest results, no candidate, including President Erdogan got a majority of votes to avoid a runoff.
It looks like Turks will go back to voting in two weeks to decide who between Recep Erdogan and Kemal Kilicdaroglu will be the next president.
Political uncertainty is never good for investor sentiment and the next two weeks will be marked by uncertainty, low predictability and high volatility in Turkish assets.
The USDTRY is holding up so far, but the pair advanced to the highest levels on record. The central bank of Turkey (CBT) is putting a lot of weight and money to keep the lira stable against the greenback.
Turkey’s 10-year yield jumped more than 8% this morning, while the BIST 100 is down by 1% at the time of writing.
The major risk is the lira. Will the CBT keep its FX strategy unchanged and defend the lira? Will it be able to counter an eventually increased selling pressure on the lira? If no, what happens to the lira?
A sudden jump in dollar-try is a possibility, a severe devaluation of the lira could inject further volatility to Turkish stock and bond markets.
Easing Global Inflation
Market movers today
We kick off the week with March euro area industrial production. The German data from last week indicates we are in for a significant decline.
The European Commission also publishes a new economic outlook.
In the US, we have both Fed's Bostic and Kashkari on the wires.
In Sweden, we expect a large decline in April inflation, see more below.
Overnight, we get a flurry of data out of China. Particularly retail sales will be interesting, as the consumer is set to drive the recovery.
The 60 second overview
Markets: This morning Asian equity markets are mixed. At the time of writing futures point to a red opening in the US and a green opening in Europe. On Friday, US equities generally ended in negative territory, while European equities closed higher. US yields were higher on the back of the University of Michigan 5y inflation expectations edging higher to 3.2%, the highest level since 2011. In our view this underscores that the Fed is unlikely to look towards cutting rates anytime soon. Elsewhere, the USD broadly appreciated, oil fell and gold was unchanged.
Sweden. For today's Swedish April inflation numbers we expect CPIF and CPIF excl. Energy to slow to 7.8 % YoY and 8.5 % YoY respectively (from 8.0% and 8.9% in March). This is 0.1 percentage points below Riksbank's forecasts on both. Given the high level of inflation this would be seen as negligible deviations and of little consequence for Riksbank policy as we see it.
Generally easing global inflation. Inflation drivers continue to paint a mixed picture, but inflation is likely to head lower through 2023 in the US and euro area. Price pressures from food, freight and energy have clearly eased. Labour markets remain tight, but underlying wage and inflation pressures have shown tentative signs of easing in the US. In euro area, services sector remains the key inflation driver, as price pressures continued to accelerate in April. Despite the uncertainty around financial stability risks, we expect the ECB to hike rates three more times, and the Fed to stay on hold for now. In China, CPI dropped further to 0.1% y/y in April from 0.7%; hence inflation is getting closer to deflation pointing to more stimulus. Read more in Global Inflation Watch - Diverging core inflation trends, 11 May.
Turkish election. With almost all votes counted, it seems neither Erdogan nor his rival will reach the key threshold of 50%. A second poll on 28 May looks likely. In the meantime, TRY volatility could be elevated.
Equities: Global equities slightly lower Friday, dragged down by US. The one thing sticking out Friday was the preliminary consumer confidence report from Michigan. Both current assessment and future expectations were lower and at the same time long-term inflation expectations ticked higher. Put on top of this that Friday still means lack of confidence in medium sized banks in the US and we have what it takes to bring equities lower. Value managed to outperform although US banks were under pressure. In US Dow -0.03%, S&P 500 -0.2%, Nasdaq -0.4% and Russell 2000 -0.2%. Asian markets are mixed this morning with Japanese equities outperforming. European and US futures in small gains this morning.
FI: It was a fairly muted rates session on Friday, amid EGBs higher across the board on hawkish ECB and Fed comments and higher than expected University of Michigan inflation expectations. On Friday night, Fitch affirmed Italy's rating at BBB and a stable outlook, despite the significant debt to GDP level. On Friday, Moody's has Italy up for review, where they are on negative outlook, but we do not expect a downgrade.
FX: Friday's session was characterised by broad USD appreciation in the G10 space ending the strongest week for the DXY USD index since February. EUR/USD fell below 1.09 and rising US yields on the back of Friday's stronger-than-expected long-term Michigan inflation expectations took USD/JPY above 135. EUR/NOK fell below 11.60 while EUR/SEK was little changed around 11.26.
Credit: CDS indices were unchanged last week, with iTraxx Main at 86bp (0bp) at Friday's close while Xover closed at 450bp. In terms of issuance it was a relatively busy week with nearly EUR18bn issued in corporate bonds, while EUR10.6bn was printed in financials, of which EUR7.3bn was in covered bonds.
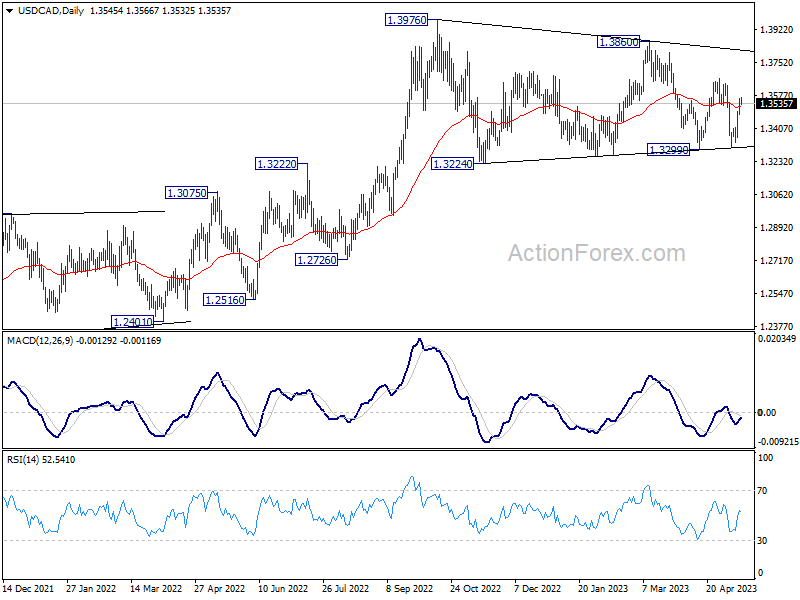
USD/CAD Daily Outlook
Daily Pivots: (S1) 1.3504; (P) 1.3534; (R1) 1.3589; More....
Intraday bias in USD/CAD remains mildly on the upside for the moment. Current development argues that rebound from 1.3313 is possibly another leg inside the triangle pattern from 1.3976. Further rise should be seen for 1.3666 resistance. Break there will target 1.3860 resistance next. On the downside, though, below 1.3478 minor support will turn intraday bias neutral instead.
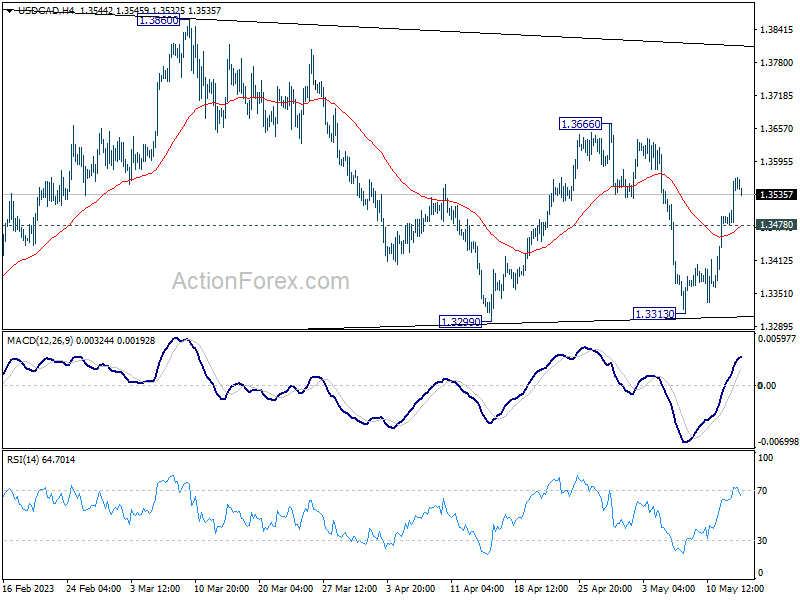
In the bigger picture, as long as 55 W EMA (now at 1.3321) holds, up trend from 1.2005 (2021 low) is still in favor to resume through 1.3976 at a later stage. However, sustained trading below the EMA and 38.2% retracement of 1.2005 to 1.3976 at 1.3233 will raise the chance of bearish reversal. Deeper should then be seen to 61.8% retracement at 1.2758 next.