

Sample Category Title
EUR/USD Daily Outlook
Daily Pivots: (S1) 1.0968; (P) 1.1030; (R1) 1.1073; More...
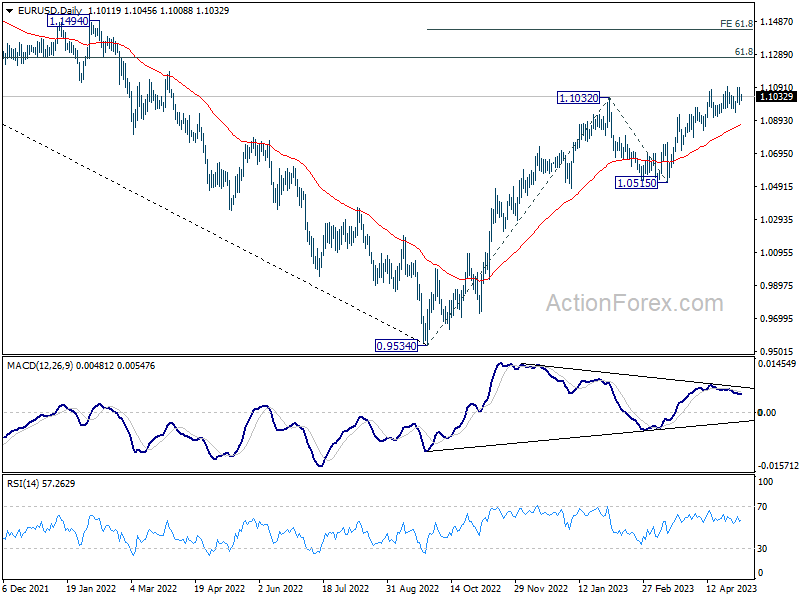
Range trading continues in EUR/USD and intraday bias remains neutral. Outlook stays bullish as long as 1.0908 support holds. Further rally remains in favor for now. On the upside, firm break of 1.1094 will resume larger up trend to 1.1273 fibonacci level. Break there will target 61.8% projection of 0.9534 to 1.1032 from 1.0515 at 1.1441 However, considering bearish divergence condition in 4H MACD, break of 1.0908 support will indicate short term topping and turn bias back to the downside.
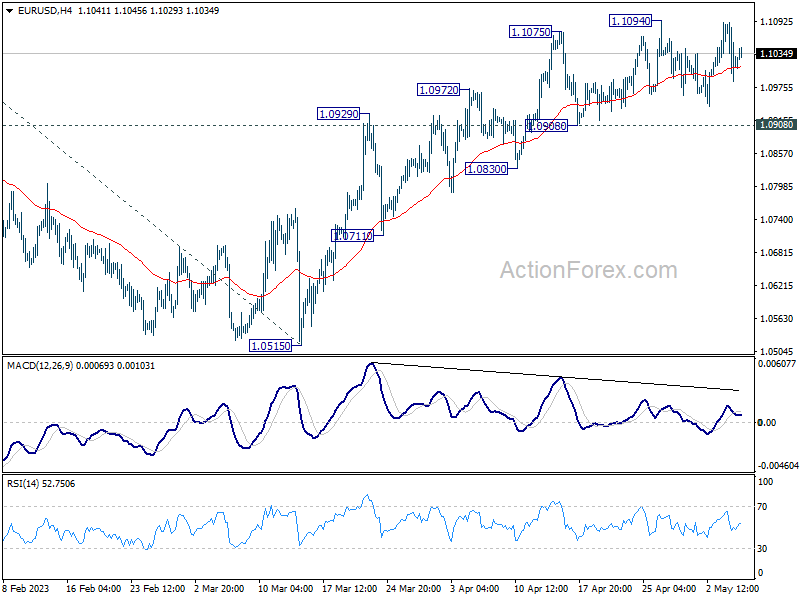
In the bigger picture, rise from 0.9534 (2022 low) is in progress for 61.8% retracement of 1.2348 (2021 high) to 0.9534 at 1.1273. Sustained break there will solidify the case of bullish trend reversal and target 1.2348 resistance next (2021 high). This will now remain the favored case as long as 1.0515 support holds, even in case of deeper pull back.
GBP/USD Daily Outlook
Daily Pivots: (S1) 1.2548; (P) 1.2573; (R1) 1.2598; More...
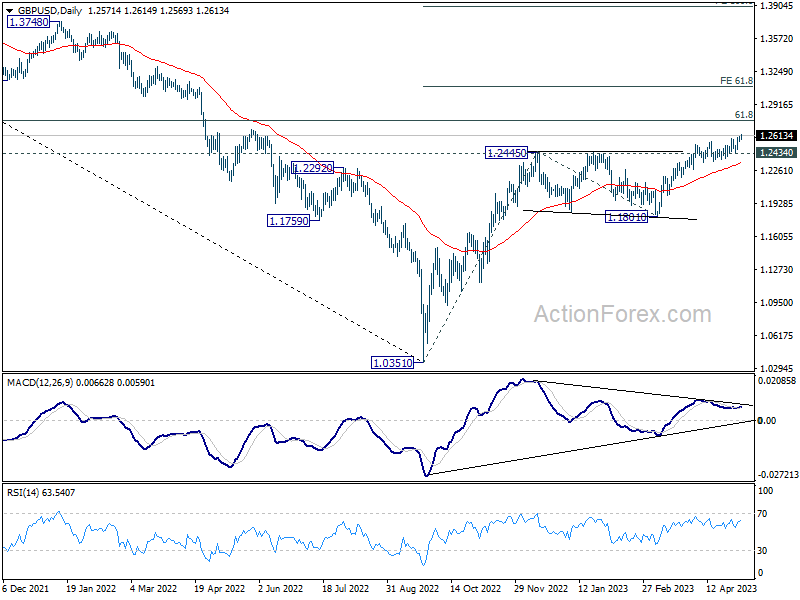
GBP/USD's rally is in progress and intraday bias remains on the upside. Current rally should target 1.2759 fibonacci level first. Firm break there will target 61.8% projection of 1.0351 to 1.2445 from 1.1801 at 1.3095. For now, near term outlook will stay bullish as long as 1.2434 support holds, in case of retreat.
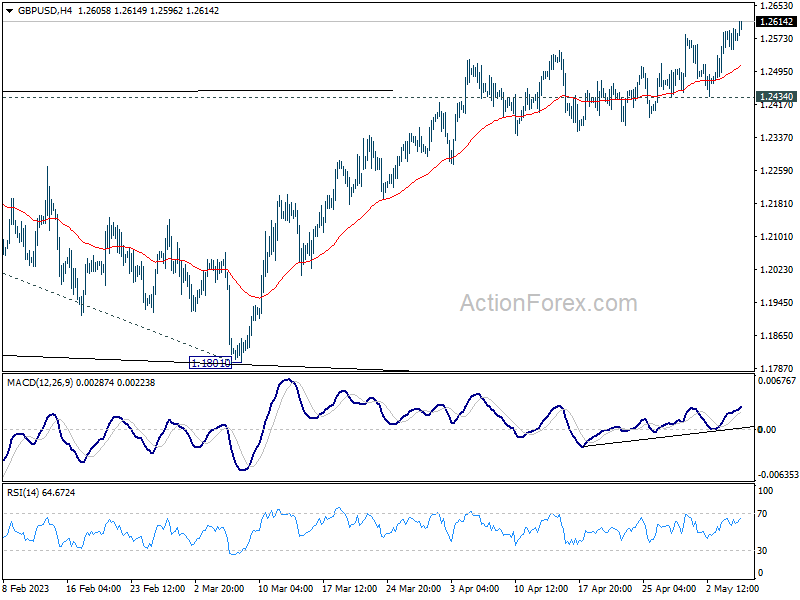
In the bigger picture, the rise from 1.0351 medium term term bottom (2022 low) is in progress for 61.8% retracement of 1.4248 (2021 high) to 1.0351 at 1.2759. Sustained break there will add to the case of long term bullish trend reversal. Further break of 61.8% projection of 1.0351 to 1.2445 from 1.1801 at 1.3095 could prompt upside acceleration to 100% projection at 1.3895. For now, this will remain the favored case as long as 1.1801 support holds, even in case of deep pull back.
USD/CHF Daily Outlook
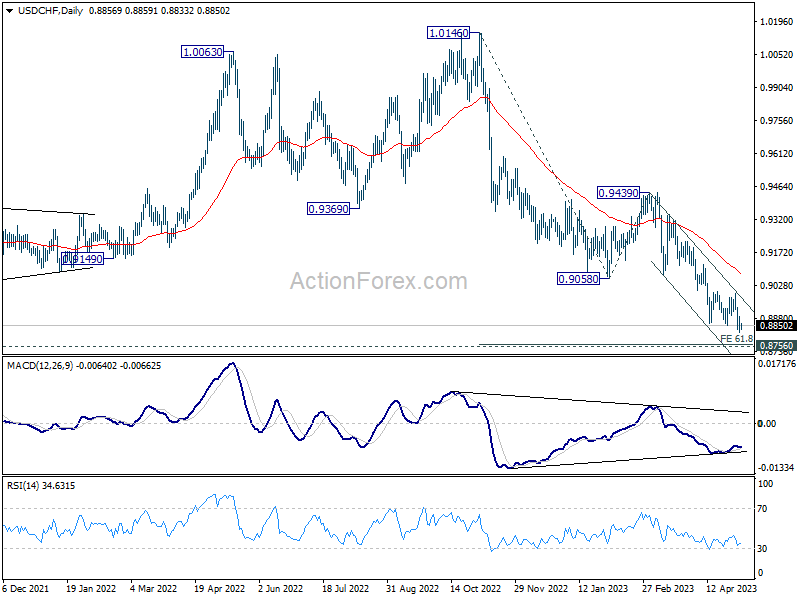
Daily Pivots: (S1) 0.8823; (P) 0.8857; (R1) 0.8894; More...
Intraday bias in USD/CHF stays on the downside and outlook is unchanged. The down trend from 1.0146 would target 61.8% projection of 1.0146 to 0.9058 from 0.9439 at 0.8767, which is close to 0.8756 long term support. Strong support is expected there to bring rebound, at least on first attempt. On the upside, break of 0.8993 resistance will indicate short term bottoming, on bullish convergence condition in 4H MACD, and turn bias back to the upside for stronger rebound.
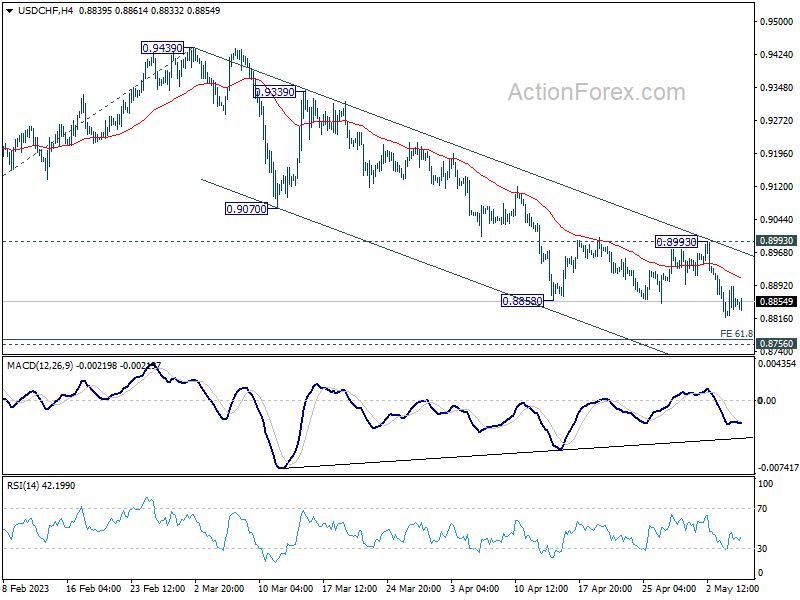
In the bigger picture, fall from 1.1046 (2022 high) is in progress for 0.8756 support (2021 low). But overall, this fall is still seen as a leg in the long term range pattern from 1.0342 (2016 high). So, downside should be contained by 0.8756 to bring reversal. Sustained break of 0.9058 support turned resistance will be the first sign of medium term bottoming. However, decisive break of 0.8756 will carry larger bearish implications.
USD/JPY Daily Outlook
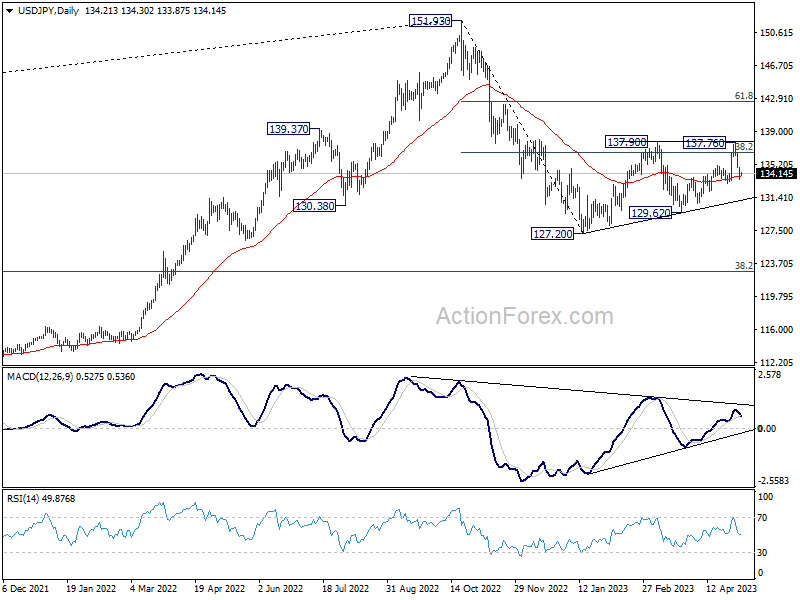
Daily Pivots: (S1) 133.56; (P) 134.22; (R1) 134.94; More...
Intraday bias stays on the downside at this point. Fall from 137.73 is seen as the third leg of the pattern from 137.90. Break of 133.00 will bring deeper fall towards 129.62 support. But still, as long as 129.62 holds, larger rebound from 127.20 is still in favor to resume at a later stage. On the upside, above 135.68 minor resistance will turn bias back to the upside for 137.76.90 instead.
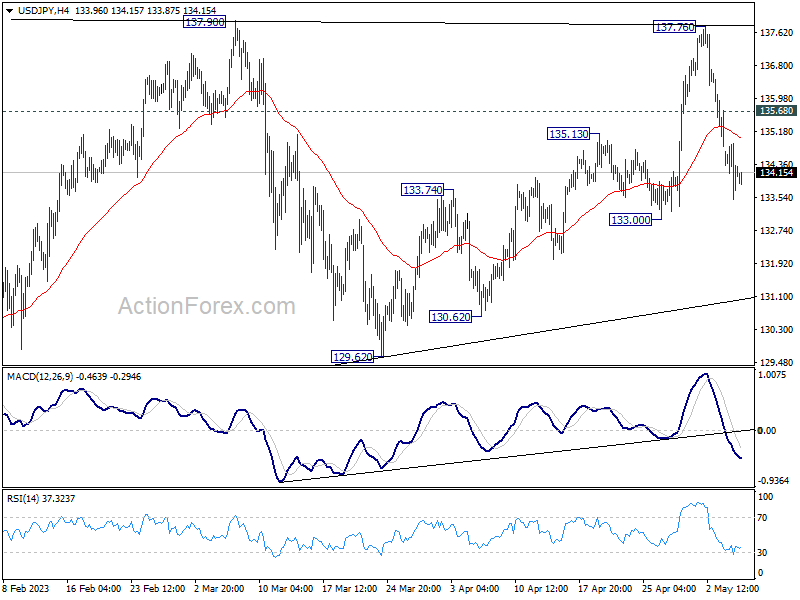
In the bigger picture, price actions from 151.93 high are currently seen as a corrective pattern to the long term up trend. The first leg should have completed at 127.20. Rebound from there is seen as the second leg. Sustained break of 31.8% retracement of 151.93 to 127.20 at 136.34 will bring stronger rebound to 61.8% retracement at 142.48. Meanwhile, break of 129.62 will argue that the third leg is starting through 127.20 low.
USD/CAD Daily Outlook
Daily Pivots: (S1) 1.3495; (P) 1.3564; (R1) 1.3608; More....
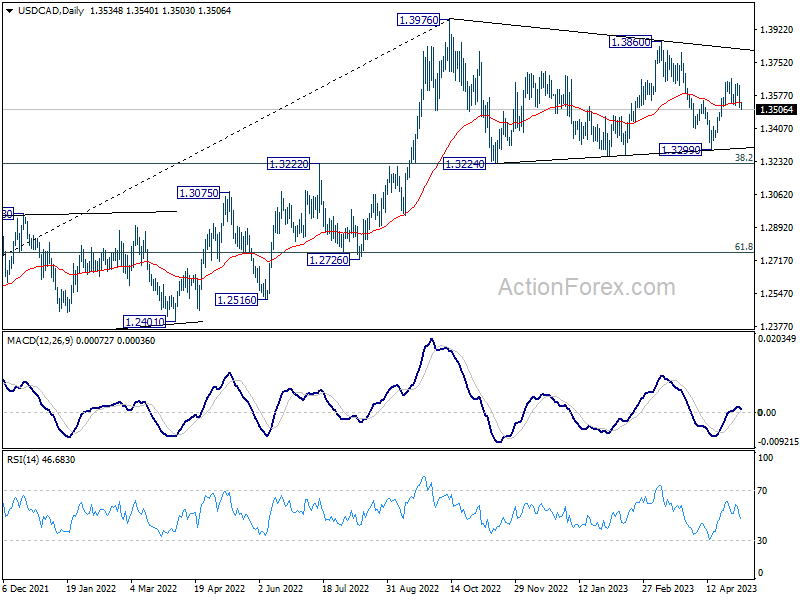
USD/CAD's break of 1.3521 dampened the bullish view and suggests that rebound from 1.3299 has completed at 1.3668. Fall from there could be another down leg in the corrective pattern from 1.3976. Intraday bias is back on the downside for 1.3299 support. On the upside, break of 1.3668 will resume the rebound instead.
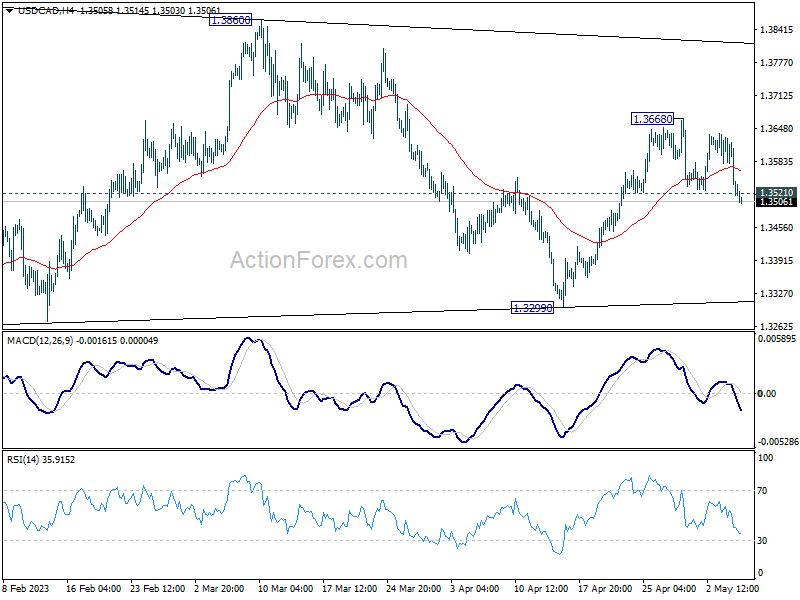
In the bigger picture, the up trend from 1.2005 (2021 low) is still in progress. Break of 1.3976 will confirm resumption and target 61.8% projection of 1.2401 to 1.3976 from 1.3261 at 1.4234. Firm break there will pave the way to long term resistance zone at 1.4667/89 (2016, 2020 highs). On the downside, sustained break of 55 W EMA (now at 1.3302) is needed to confirm medium term topping. Otherwise, outlook will remain bullish even in case of deep pull back.
USD/CNH: Animal Spirits in Control of China’s Equities
- China equities & its proxies are resilient against a lacklustre macro environment.
- Sentiment-driven animal spirits are playing a key role in the recent rebound of China equities.
- USD/CNH (part of the sentiment-driven factor) has flashed exhaustion conditions after failing to break above the key 200-day moving average.
The past four days of performances seen in the China stock market and its proxies seem to be more driven by animal spirits rather than fundamentals.
Let’s discuss a bit about the current macro environment of China. Both the official NBS and Caixin (consisting of more small and medium-sized firms) Manufacturing and Services PMIs data for April have shown a decline in activities after a growth spurt in Q1 due to policy changes such as more expansionary fiscal and monetary easing measures as well as the removal of stringent Covid-19 lockdown rules.
Key sub-components data of the China NBS Manufacturing PMI are pointing to weaker implied growth for the global economy in the coming months, such as New Orders and Import components have decelerated to 48.80 to 48.90 respectively.
Today’s release of the Caixin Services PMI saw a slowdown of growth in the services sector for April after four consecutive months of increase in growth, it declined to 56.4 from March’s 28-month high of 57.8 which suggests that China’s internal consumption growth is showing signs of fatigue.
In the past two trading sessions, China-related equities shrugged off such negative fundamental factors; both the US-listed iShares China Large-Cap ETF and KraneShares CSI China Internet ETF (a proxy for China Big Tech) rose +2.7% and +1.7% respectively yesterday which outperformed the iShares MSCI All-World Index ETF that recorded a loss of -0.4%.
Signal for more potential upcoming fundraising activities for China equities
The animals’ spirits seem to have come in the form of positive feedback loops in two different asset classes. Firstly, China’s Big Tech equities are back on the radar screen triggered by future potential international fundraising activities that gained traction after Alibaba Group announced that its international online unit that consists of the major brands Lazada and AliExpress is looking for a US initial public listing next year. This IPO valuation is estimated at around US$29 to US$39 billion according to research reports from Morgan Stanley and CICC released in March respectively.
A reversal of Yuan’s weakness is supporting recent up moves in China equities
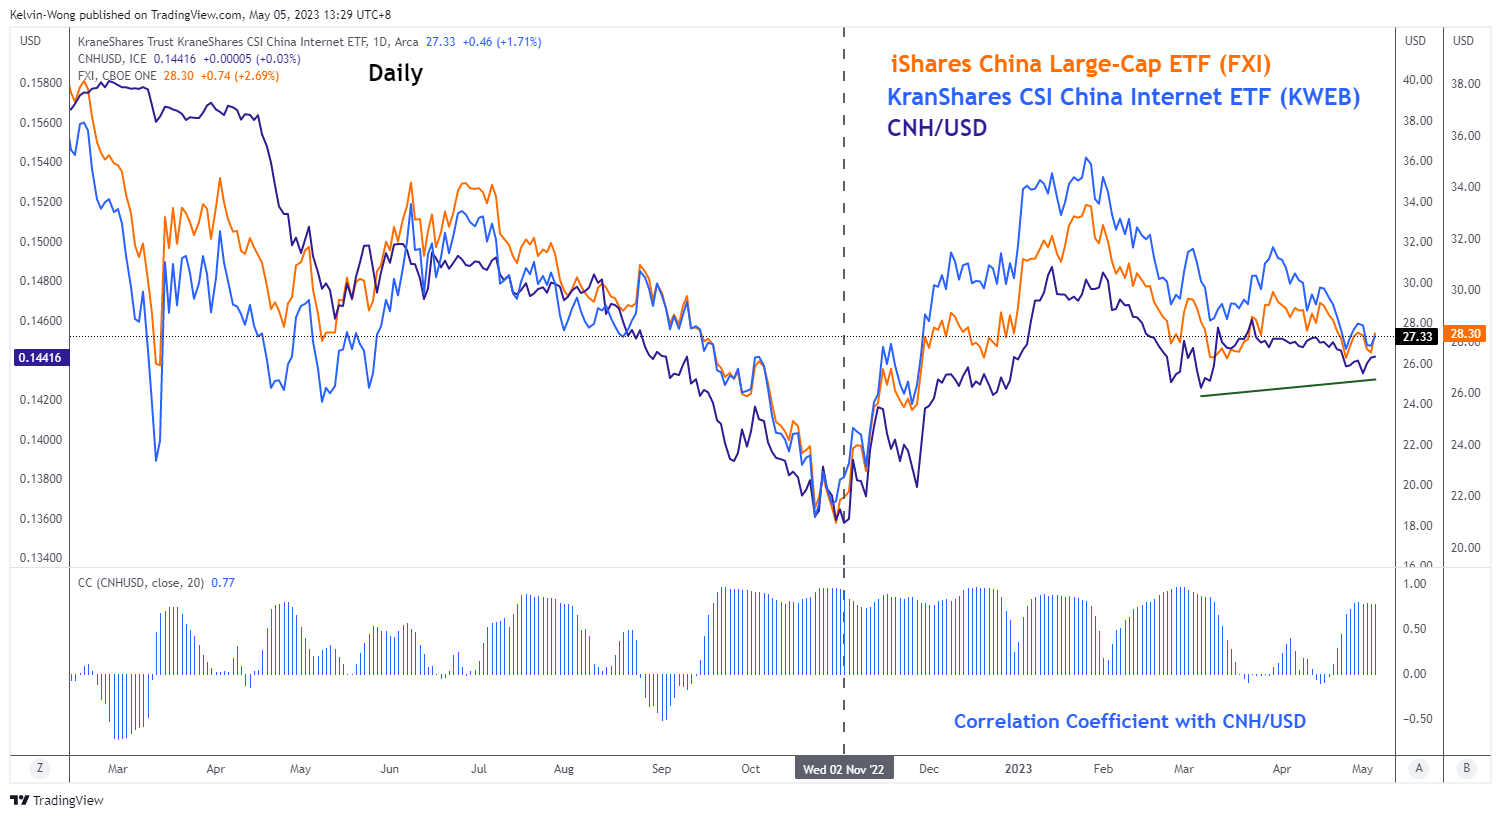
Fig 2: CNH/USD correlation with iShares China Large-Cap ETF and KraneShares CSI China Internet ETF as of 4 May 2023
(Source: TradingView, click to enlarge chart)
Secondly, the movement of China equities has moved in tandem with the offshore yuan (CNH) since early November 2022. The strengthening of the CNH against the US dollar as depicted by the foreign exchange rate of CNH/USD has led to an up move in both the iShares China Large-Cap ETF and KraneShares CSI China Internet ETF and vice versus when the CNH/USD staged a decline.
The past three sessions of movement seen in the CNH/USD have a high direct 20-day rolling correlation coefficient of around 0.80 with the KraneShares CSI China Internet ETF which implies that CNH/USD is a significant factor that may impact the future movements of China equities and its proxies at least in the near-term.
The sentiment of the US dollar has soured in recent weeks due to an increase in the expectations of a pause in the current Fed’s interest rate hiking cycle and the possibility of the US Congress that fails to extend the debt limit ceiling in a potential fast-approaching June deadline due to partisan squabbles.
Hence, a further strengthening of the CNH against the US dollar may add further impetus for animal spirits to push up the share prices of China equities and its proxies.
USD/CNH Technical Analysis – Bulls are capped below the 200-day moving average
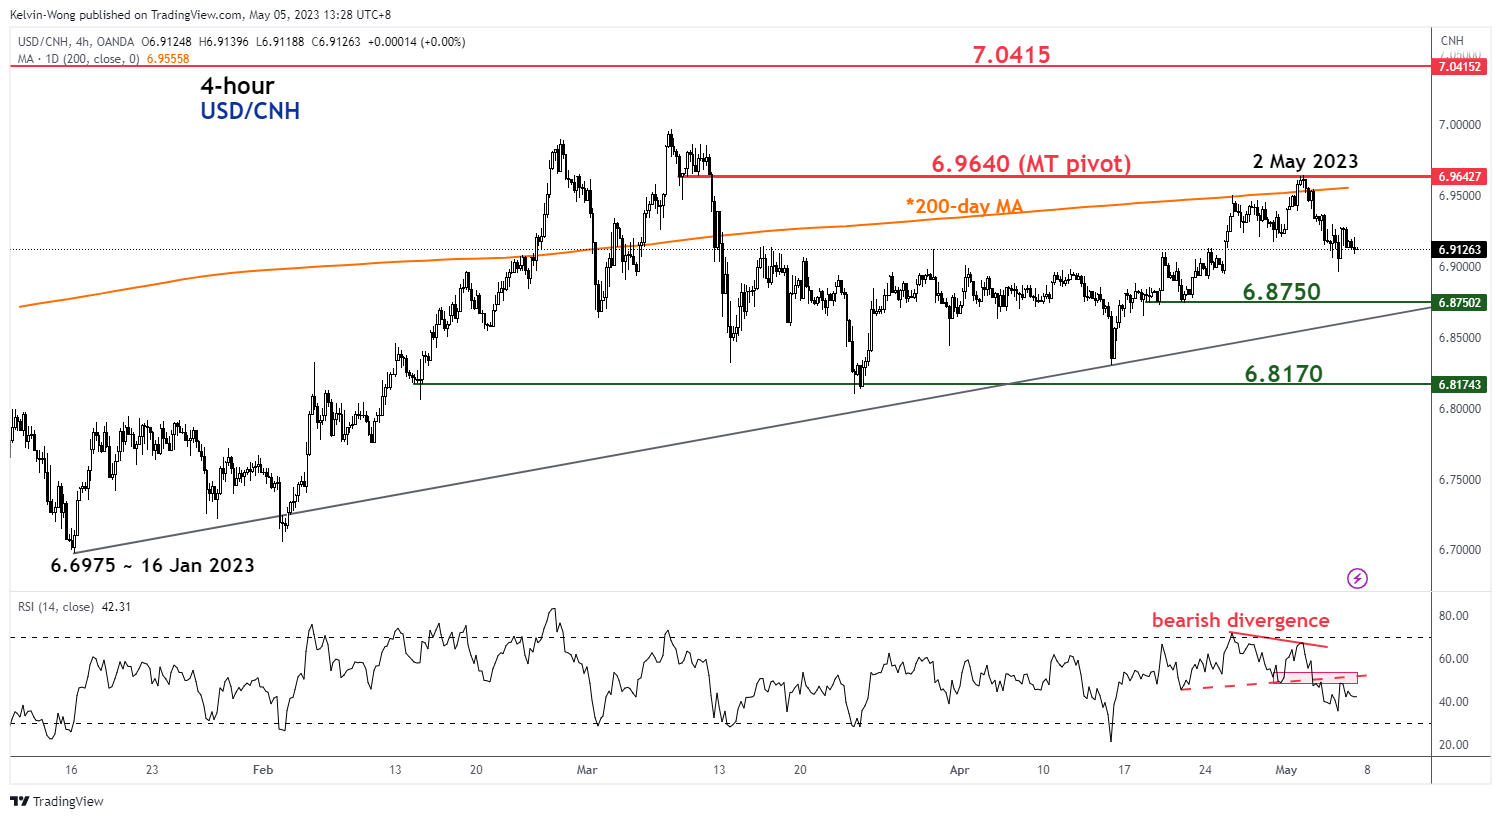
Fig 2: USD/CNH trend as of 5 May 2023 (Source: TradingView, click to enlarge chart)
The minor uptrend of the USD/CNH (offshore yuan) from its 14 April 2023 low to its recent high of 6.9646 printed on 2 May 2023 has shown signs of bullish exhaustion after it failed to break above the key 200-day moving average decisively.
In addition, the 4-hour RSI oscillator has flashed a prior bearish divergence signal at its overbought region and broke below corresponding support at the 50% level thereafter which indicates that short-term downside momentum remains intact.
The intermediate support to watch will be at 6.8750 (the ascending trendline in place since the 16 January 2023 medium-term swing low) and failure to hold at this level exposes the USD/CNH to the next support at 6.8170.
On the other hand, a clearance with a 4-hour close above 6.9640 key medium-term pivotal resistance negates the bearish tone for the next resistance coming in at 7.0415.
Fed is Expected to Cut Cates in July
There was nothing particularly unusual or unexpected about yesterday’s European Central Bank (ECB) decision and its Chief Christine Lagarde’s presser, other than the fact that Lagarde didn’t wear a scarf!
The ECB slowed the pace of rate hikes to 25bp this month. The strong decline in bank lending – as a result of bank stress, and signs of slowing inflation – despite last month’s rally in energy prices, justified the 25bp hike announced yesterday. The bank announced that it will no longer reinvest in APP from July, as well.
The key takeaway was, again, that inflation outlook in the Eurozone remained ‘too high for too long’.
Lagarde left the door wide-open to more rate hikes in the coming months, she pledged to lift the policy rates to sufficiently restrictive levels and to keep them there as long as necessary.
No one knows what ‘restrictive enough’ means, but the ‘decisions’ – in plural – reinforced expectations that there will likely be two more rate hikes on the wire before the ECB eventually pauses tightening after summer.
This is important because, it means a clear hawkish divergence between the Federal Reserve (Fed), which is weakened and handcuffed by the ongoing regional bank crisis, and the ECB, which isn’t facing the same intensity of bank stress than the US and which could continue to focus on inflation to make decisions.
The growing divergence between the ECB and the Fed policy outlooks builds a stronger case for a significantly higher euro against the US dollar; price pullbacks continue to be interesting opportunities to strength long positions in the single currency.
Contagion
Stress around the US regional banks don’t seem to be abating.
Lately on the chopping block are PacWest and Western Alliance. PacWest couldn’t avoid that 50% slump after the bank said that it considers strategic options the day before. Western Alliance slumped as much as 60%, before closing the session 38% down. First Horizon on the other hand tumbled more than 33% as the Canadian TD walk away from its acquisition plan, Goldman Sachs slid more than 2% on news that it’s under review regarding its role in Silicon Valley Bank’s (SVB) attempt to raise funds in March.
All in all, US banks slid close to 3% yesterday.
The FDIC now plans to ‘hit big banks with fees to refill the deposit insurance fund, leaving smaller lenders exempt’.
Bank stress fuels Fed doves. As of today, the market is not only expecting three rate cuts in the second half of this year, but price in the first potential rate cut for July.
A bit stretched? It depends on how messy the bank situation gets.
Apple beats
Happily, Apple results gave a smile to investors after the bell. Apple’s overall sales fell for the second quarter in a row, but iPhone sales were stronger than expected and helped Apple beat both revenue and profit expectations.
Apple’s share gained 2.5% in the afterhours trading. The announcement of a $90bn share buyback plan, unchanged from last year, also helped.
Note that Apple and Microsoft, together, made up around half of the gains in the S&P500 this year. And thanks to their sizeable balance sheets – and the falling yields, big tech companies remain a refuge for equity investors. That certainly explains why the S&P500 has been relatively resilient to the bank turmoil. What’s risky however is that, if winds change direction for the Big Tech, we could rapidly see gains in the S&P500 crumble.
US jobs
Data released yesterday revealed that US unemployment benefit applications jumped the most in six weeks, as a sign that the US labour market could be loosening.
Earlier this week, job openings data also came in softer than expected, yet ADP report released on Wednesday came in double the expectations, at 300’000 new private jobs.
Today, the NFP data is expected to reveal that the US economy added around 180K new nonfarm jobs last month, for a steady wage growth at 4.2% on annual basis, and a slight uptick in unemployment from 3.5% to 3.6%.
A soft NFP read, and ideally softening wages growth could further fuel the Fed doves and boost Fed rate cut expectations.
Technical Outlook and Review
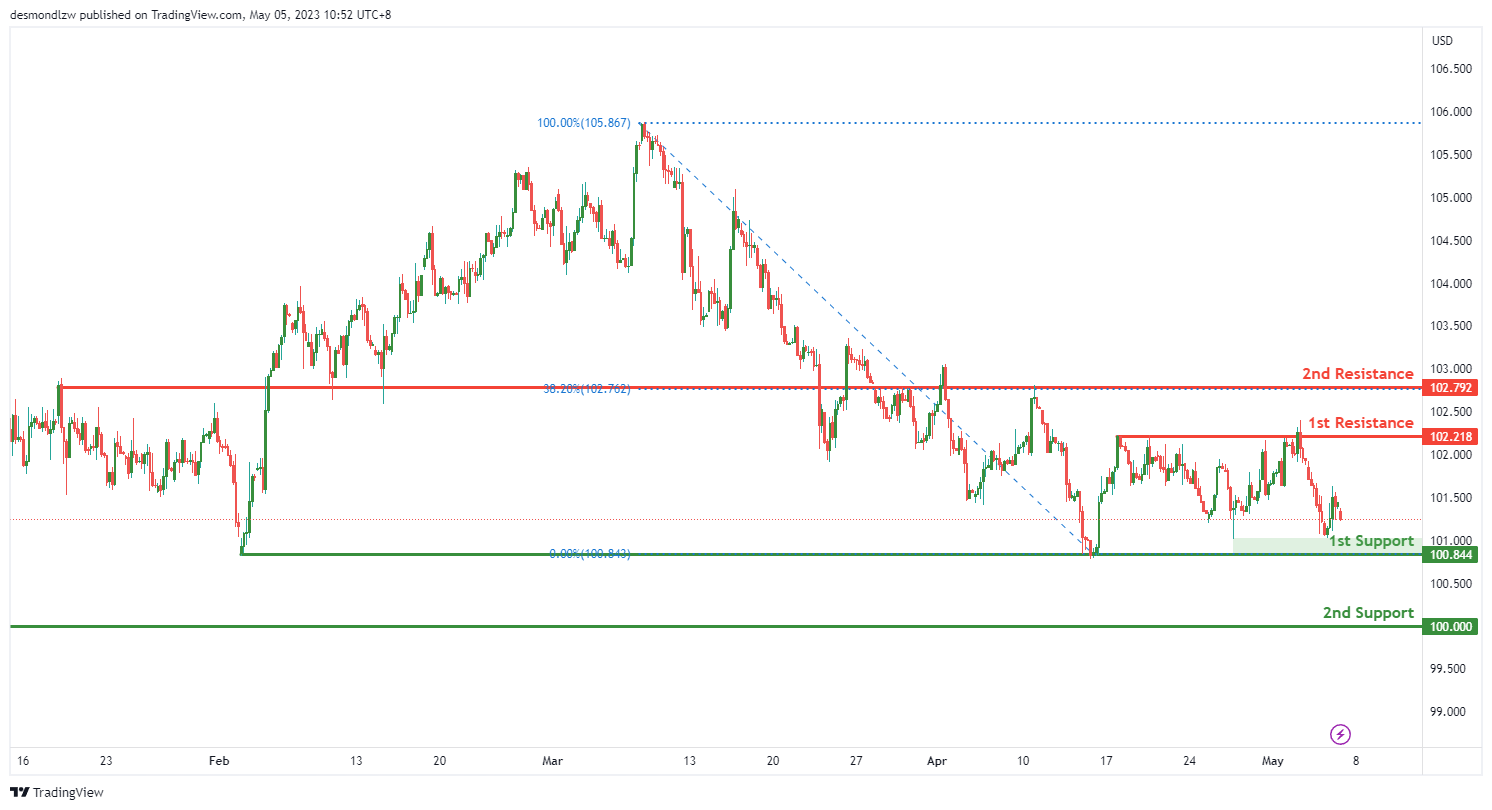
DXY:
The DXY chart is currently showing a bearish bias, with potential for a bearish continuation towards the first support level at 100.84. This level is a multi-swing low support and may provide a level of support for the price if it drops towards this level. The second support level at 100.00 is also a swing low support and may provide further support for the price if it drops below the first support level.
On the resistance side, the first resistance level at 102.21 is a multi-swing high resistance, suggesting potential for the price to drop from this level. The second resistance level at 102.79 is an overlap resistance and may act as a strong level of resistance for the price. Overall, the chart indicates bearish momentum, with potential for the price to drop towards support levels.
EUR/USD:
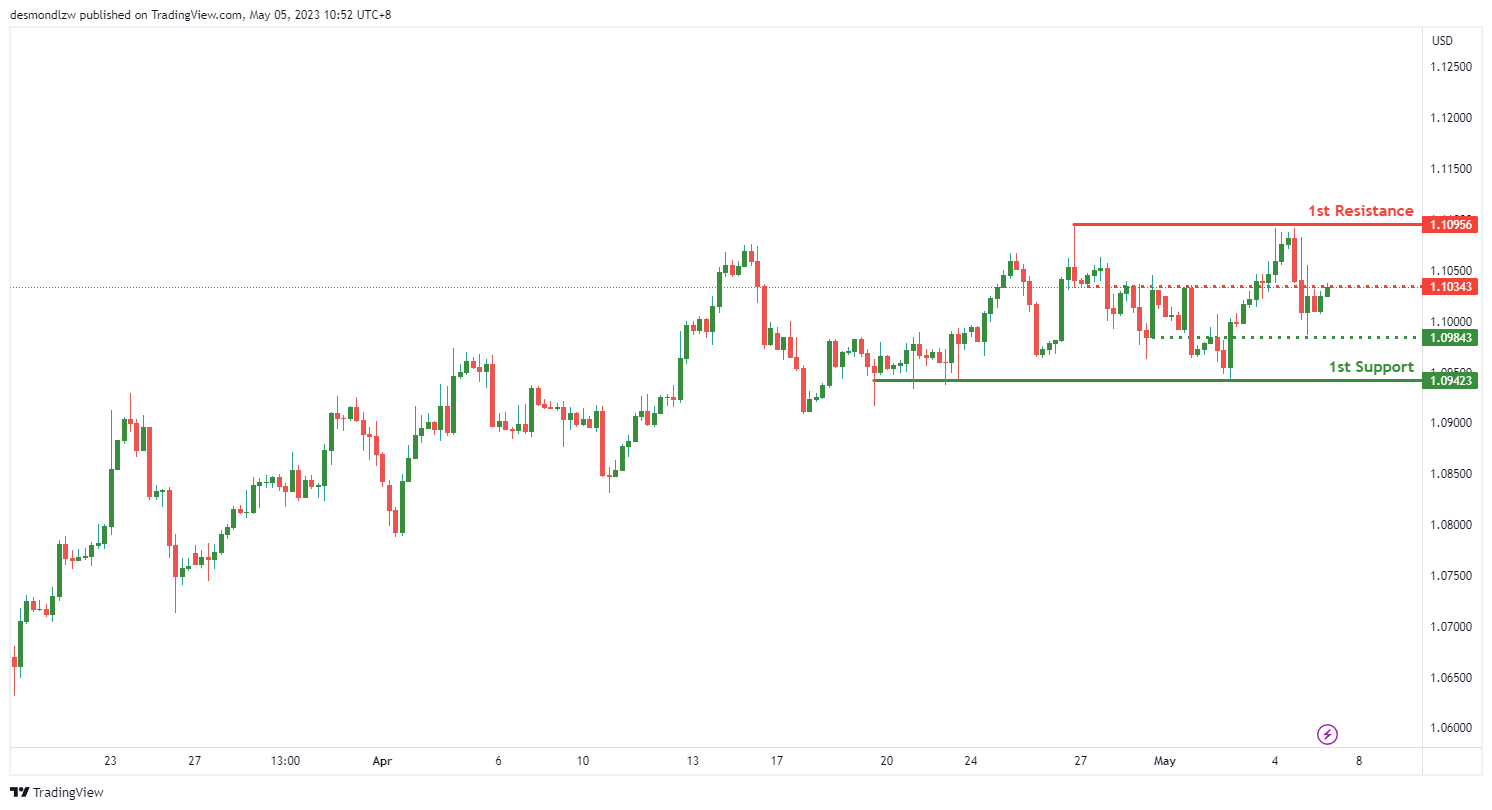
The overall momentum of the chart, it seems that we are currently experiencing weak momentum with low confidence on the EUR/USD pair. However, there is a potential for a bullish continuation towards the 1st resistance.
The 1st support level for the EUR/USD pair is at 1.0942. This level is a multi-swing low support which suggests that the price has bounced off this level multiple times in the past, making it a strong support level.
There is also an intermediate support level at 1.0984 which is an overlap support. This suggests that the price has previously stalled or reversed at this level, making it a potentially strong support level in the future.
On the other hand, the 1st resistance level is at 1.1095. This level is a multi-swing high resistance which indicates that the price has previously struggled to break through this level, making it a strong resistance level.
There is also an intermediate resistance level at 1.1034 which is an overlap resistance. This suggests that the price has previously faced resistance at this level, making it a potentially strong resistance level in the future.
It’s worth noting that the overall momentum of the chart is weak with low confidence. However, if the price manages to break through the 1st resistance level, there is potential for a bullish continuation.
GBP/USD:
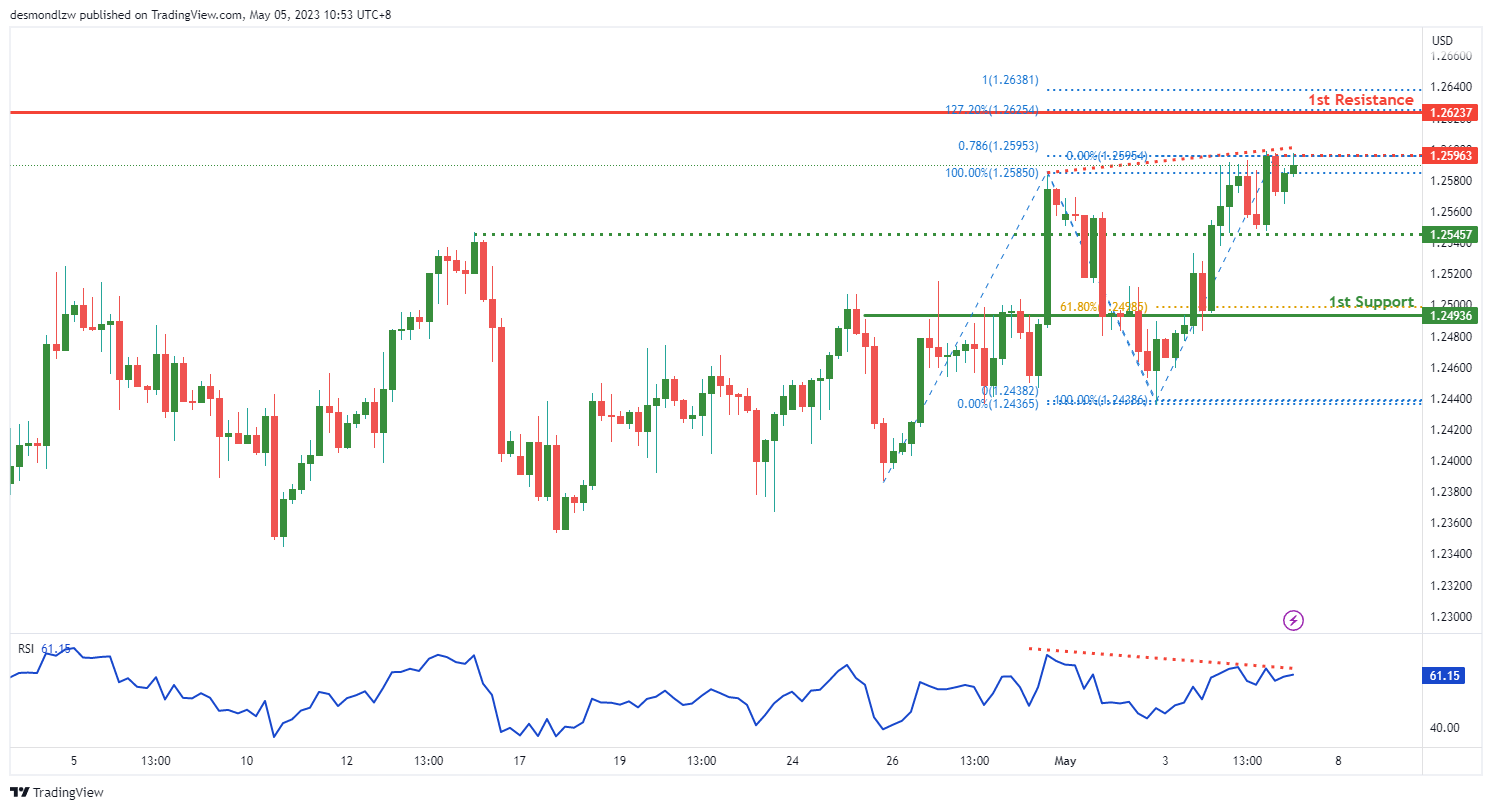
In the chart, it appears that the GBP/USD pair is experiencing strong bearish momentum with high confidence. There is potential for a bearish reaction off the 1st resistance level, with a drop towards the 1st support.
The 1st support level for the GBP/USD pair is at 1.2493. This level is an overlap support and also coincides with the 61.80% Fibonacci retracement, which indicates that it is a potentially strong support level.
There is also an intermediate support level at 1.2545 which is an overlap support. This level has previously acted as a support level and could potentially do so again in the future.
On the other hand, the 1st resistance level is at 1.2623. This level is a swing high resistance and is significant because it coincides with the 127.20% Fibonacci extension and the 100% Fibonacci projection. This represents Fibonacci confluence, which suggests that this level is a potentially strong resistance level.
There is also an intermediate resistance level at 1.2596 which is a multi-swing high resistance. This level is also significant because it coincides with the 78.60% Fibonacci projection, which suggests that it is a potentially strong resistance level.
Additionally, the RSI is displaying bearish divergence versus price, which suggests that there will likely be a rapid decline in price.
USD/CHF:
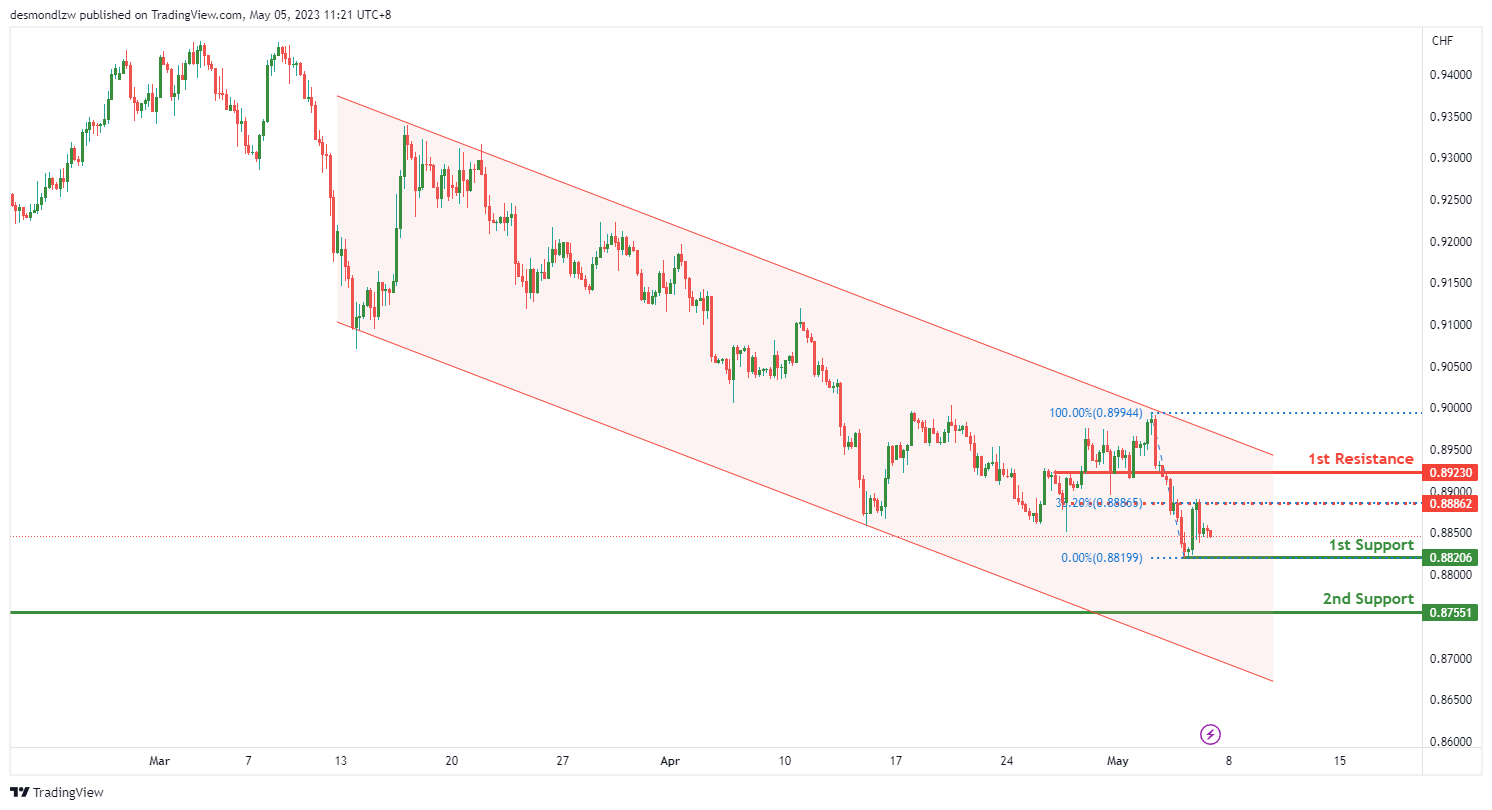
It appears that the USD/CHF pair is experiencing bearish momentum due to being in a bearish descending channel and within a bearish channel, which suggests that price might continue to go lower.
The 1st support level for the USD/CHF pair is at 0.8820. This level is a multi-swing low support, indicating that it has previously acted as a support level and could potentially do so again in the future.
There is also a 2nd support level at 0.8755 which is a swing low support. This level is significant because it has previously acted as a support level and could potentially provide support in the future.
On the other hand, the 1st resistance level is at 0.8823. This level is an overlap resistance, indicating that it has previously acted as a resistance level and could potentially do so again in the future.
There is also an intermediate resistance level at 0.8826 which is an overlap resistance. This level has previously acted as a resistance level and could potentially provide resistance in the future.
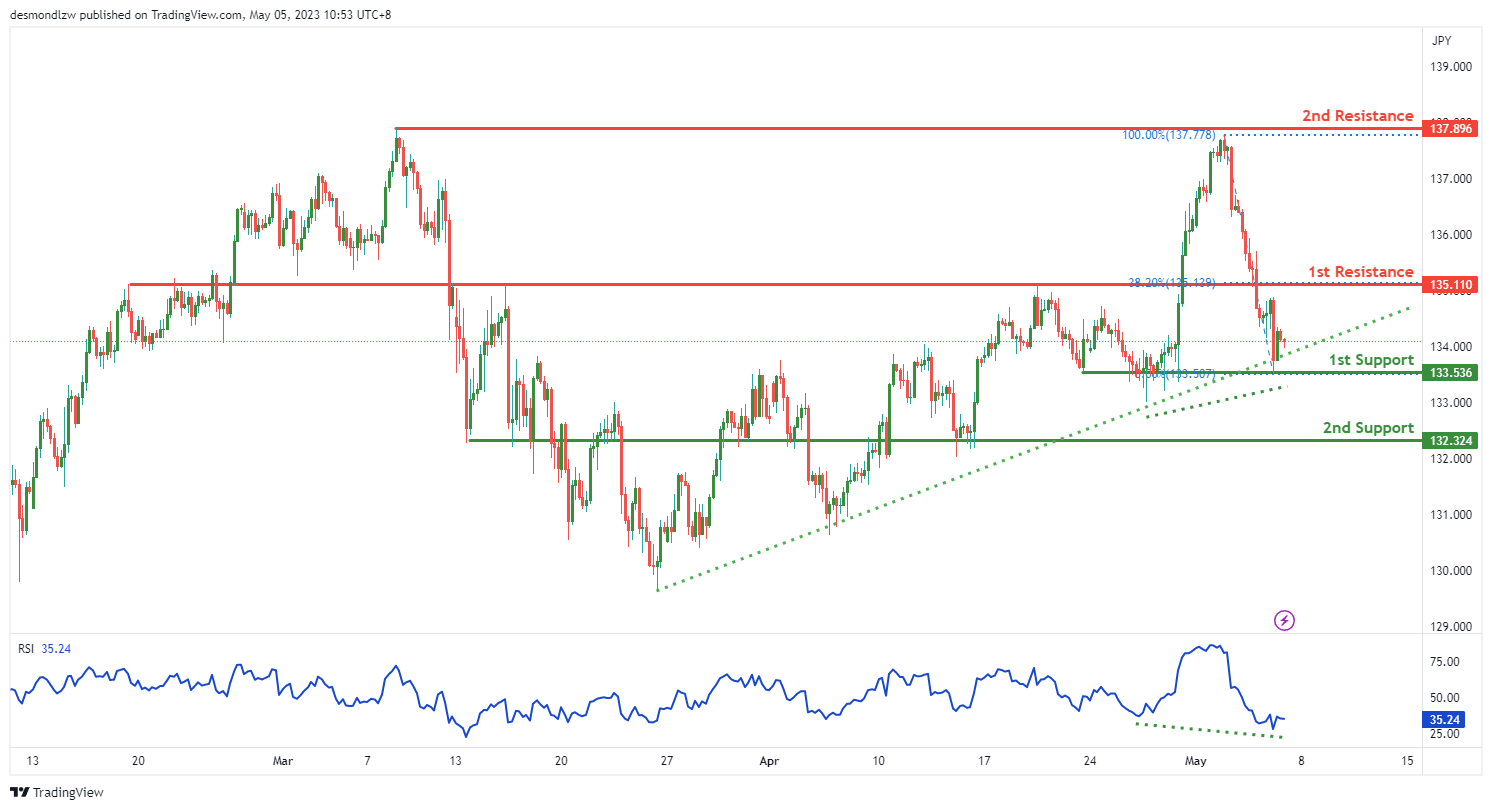
USD/JPY:
The USD/JPY chart currently shows strong bullish momentum, as price is in a bullish ascending channel and within a bullish ascending channel which suggests that the price might continue to rise due to its bullish momentum.
There is potential for a bullish bounce off the first support level at 133.53, which is a multi-swing low support level. If the price were to bounce from this level, it could head towards the first resistance level at 135.11. This resistance level is an overlap resistance, with a 38.20% Fibonacci retracement, which makes it a potentially strong resistance level.
In addition, there is a second resistance level at 137.89 which is a multi-swing high resistance level. If price were to break above the first resistance level, it could potentially rise towards this level.
The RSI is also displaying hidden bullish divergence versus price, suggesting that there could be a rapid incline in price. This is further confirmation of the potential for a bullish move in the near future.
AUD/USD:
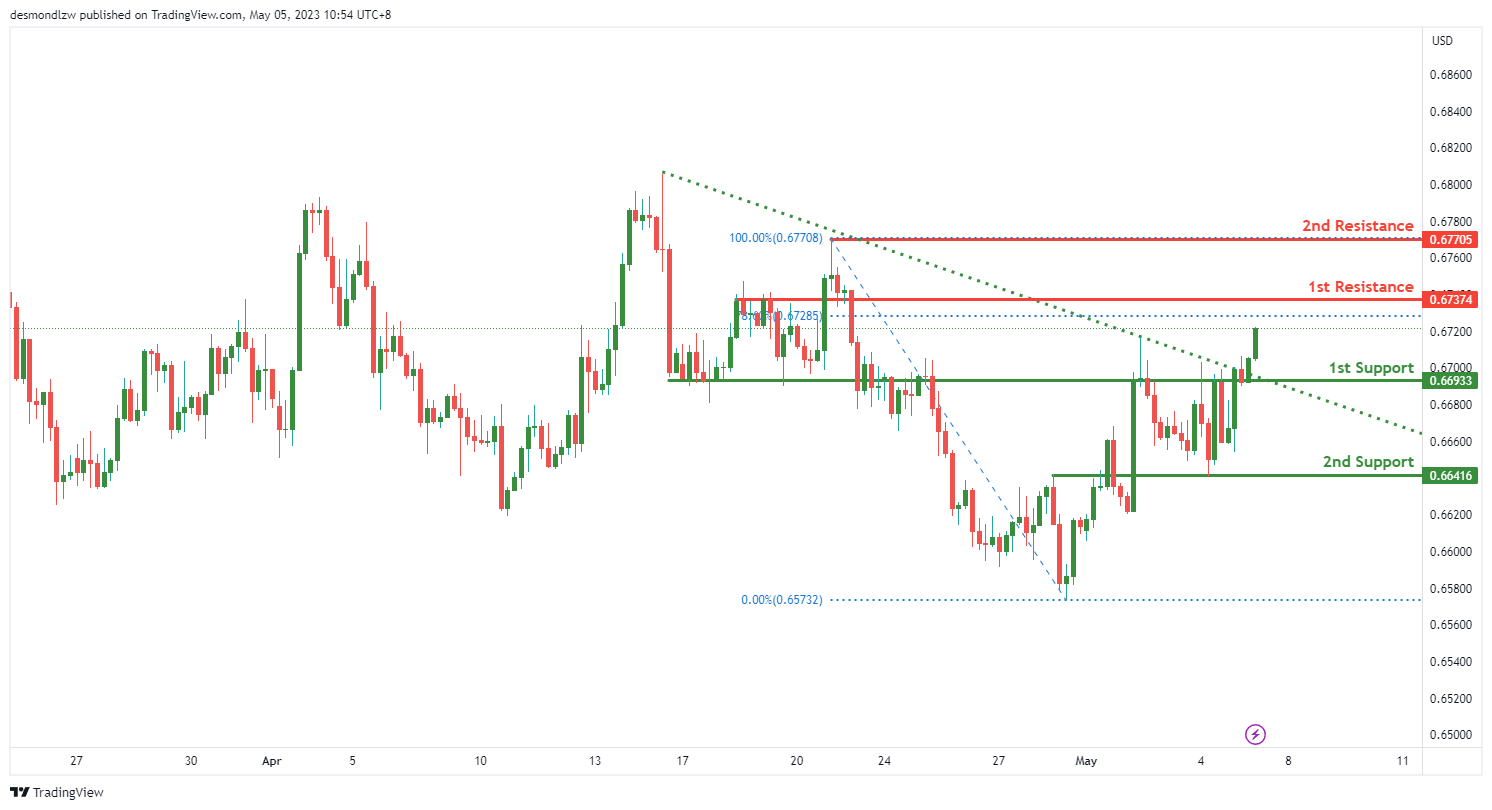
The overall momentum of the chart, it appears that the AUD/USD pair is experiencing bullish momentum due to breaking above a descending resistance line, triggering a potential bullish move.
The 1st support level for the AUD/USD pair is at 0.6693. This level is an overlap support, indicating that it has previously acted as a support level and could potentially do so again in the future.
There is also a 2nd support level at 0.6641 which is also an overlap support. This level is significant because it has previously acted as a support level and could potentially provide support in the future.
On the other hand, the 1st resistance level is at 0.6737. This level is a pullback resistance and coincides with the 78.60% Fibonacci retracement. This suggests that it is a potentially strong resistance level.
There is also a 2nd resistance level at 0.6770 which is a swing high resistance. This level is significant because it has previously acted as a resistance level and could potentially provide resistance in the future.
NZD/USD:
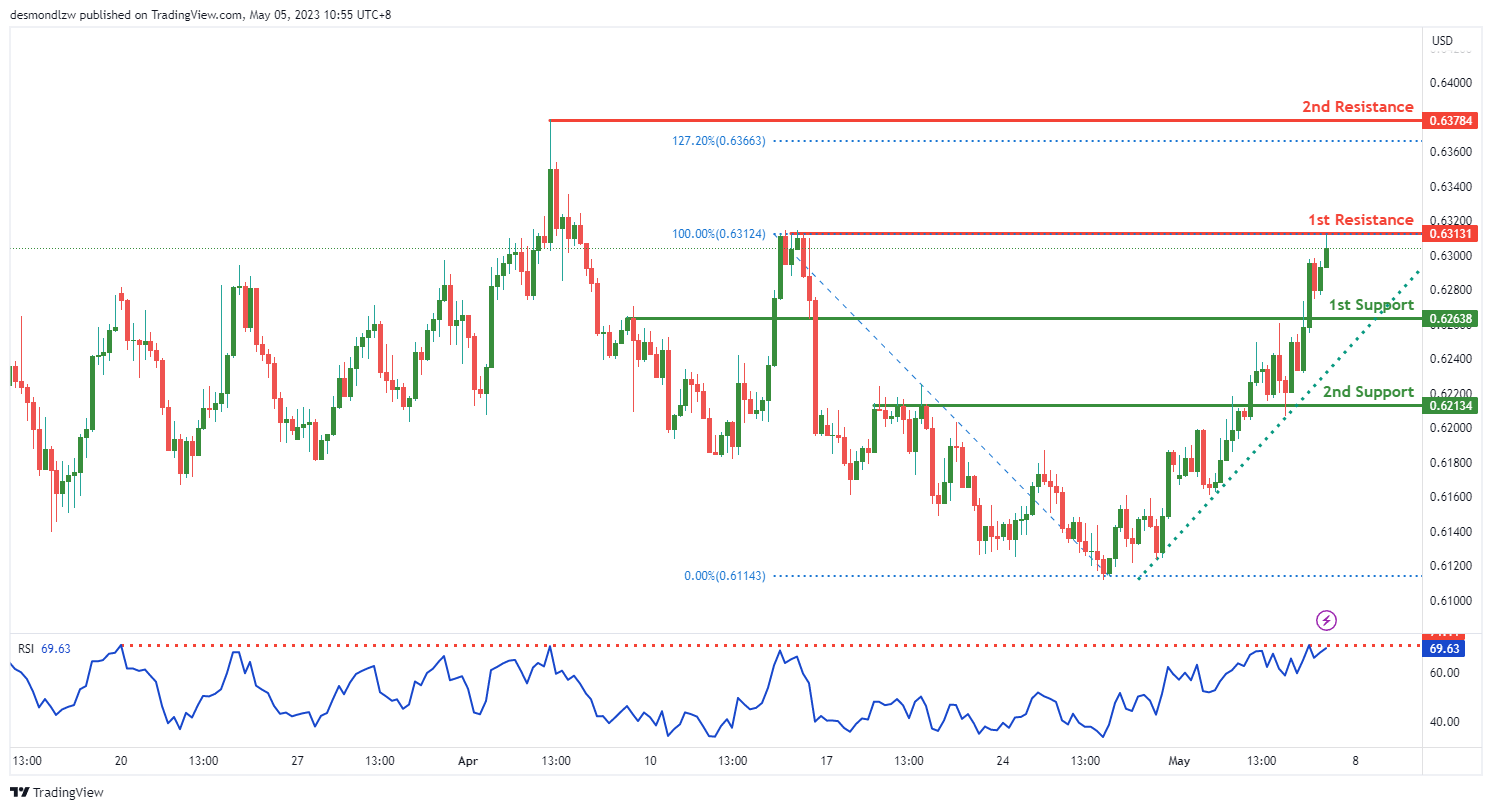
The overall momentum of the chart, it appears that the NZD/USD pair is experiencing bearish momentum.
The 1st support level for the NZD/USD pair is at 0.6263. This level is a pullback support, suggesting that it is a potentially strong level for support.
There is also a 2nd support level at 0.6213 which is an overlap support. This level is significant because it has previously acted as a support level and could potentially provide support in the future.
On the other hand, the 1st resistance level is at 0.6316. This level is a multi-swing high resistance, indicating that it has previously acted as a resistance level and could potentially provide resistance in the future.
There is also a 2nd resistance level at 0.6378 which is a swing high resistance. This level is significant because it has previously acted as a resistance level and could potentially provide resistance in the future.
It’s worth noting that the RSI suggests that the price is at a level where it has reversed in the past.
USD/CAD:
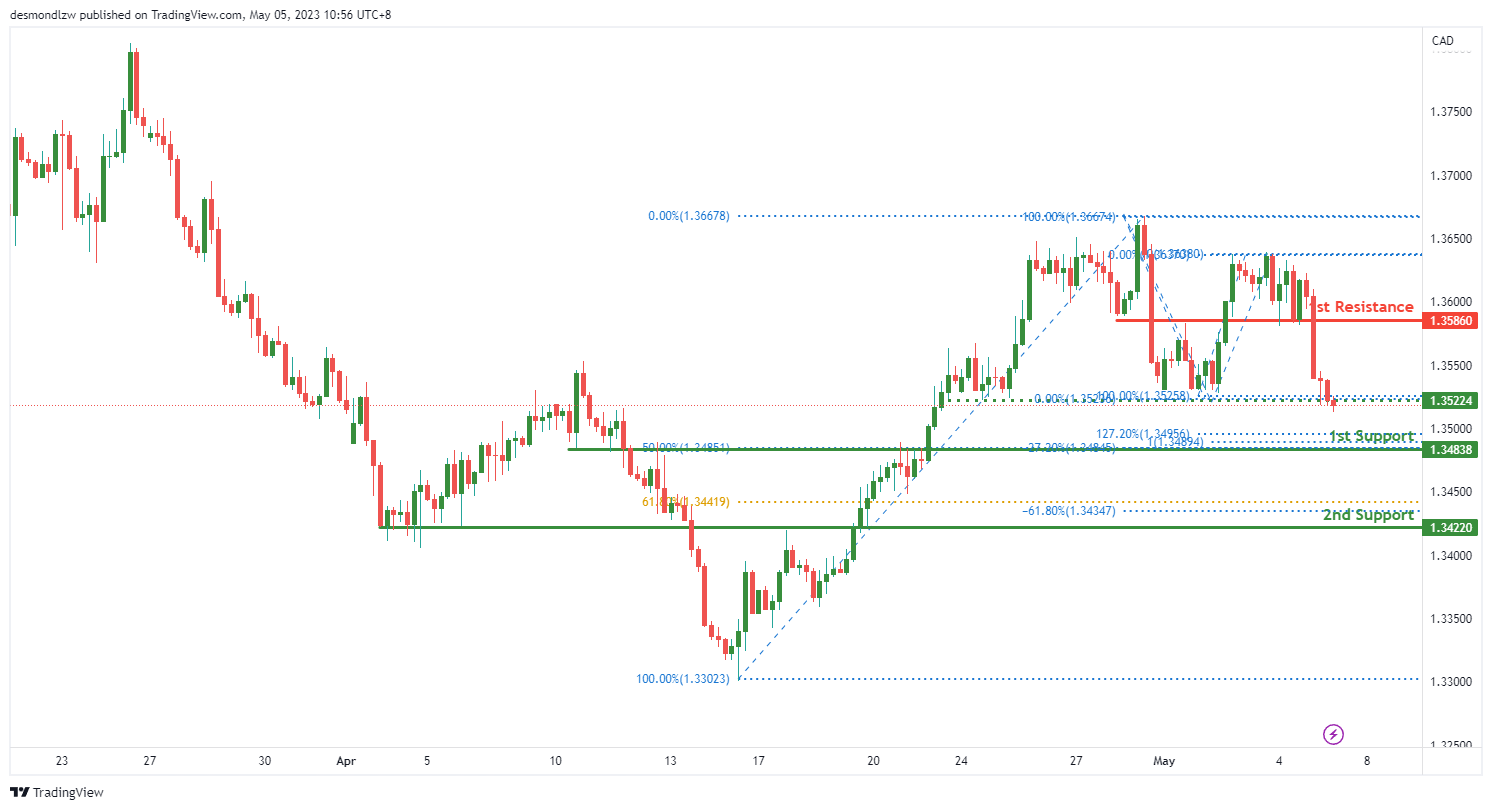
The overall momentum of the chart, it appears that the USD/CAD pair is experiencing bearish momentum.
The 1st support level for the USD/CAD pair is at 1.3483. This level is a pullback support and coincides with the 50% Fibonacci retracement and -27% Fibonacci expansion. This suggests that it is a potentially strong level for support.
There is also a 2nd support level at 1.3422 which is an overlap support and coincides with the 61.80% Fibonacci retracement. This level is significant because it has previously acted as a support level and could potentially provide support in the future.
On the other hand, the 1st resistance level is at 1.3586. This level is a pullback resistance, suggesting that it is a potentially strong level for resistance.
There is also an intermediate support level at 1.3522 which is a multi-swing low support. This level is significant because it has previously acted as a support level and could potentially provide support in the future.
DJ30:
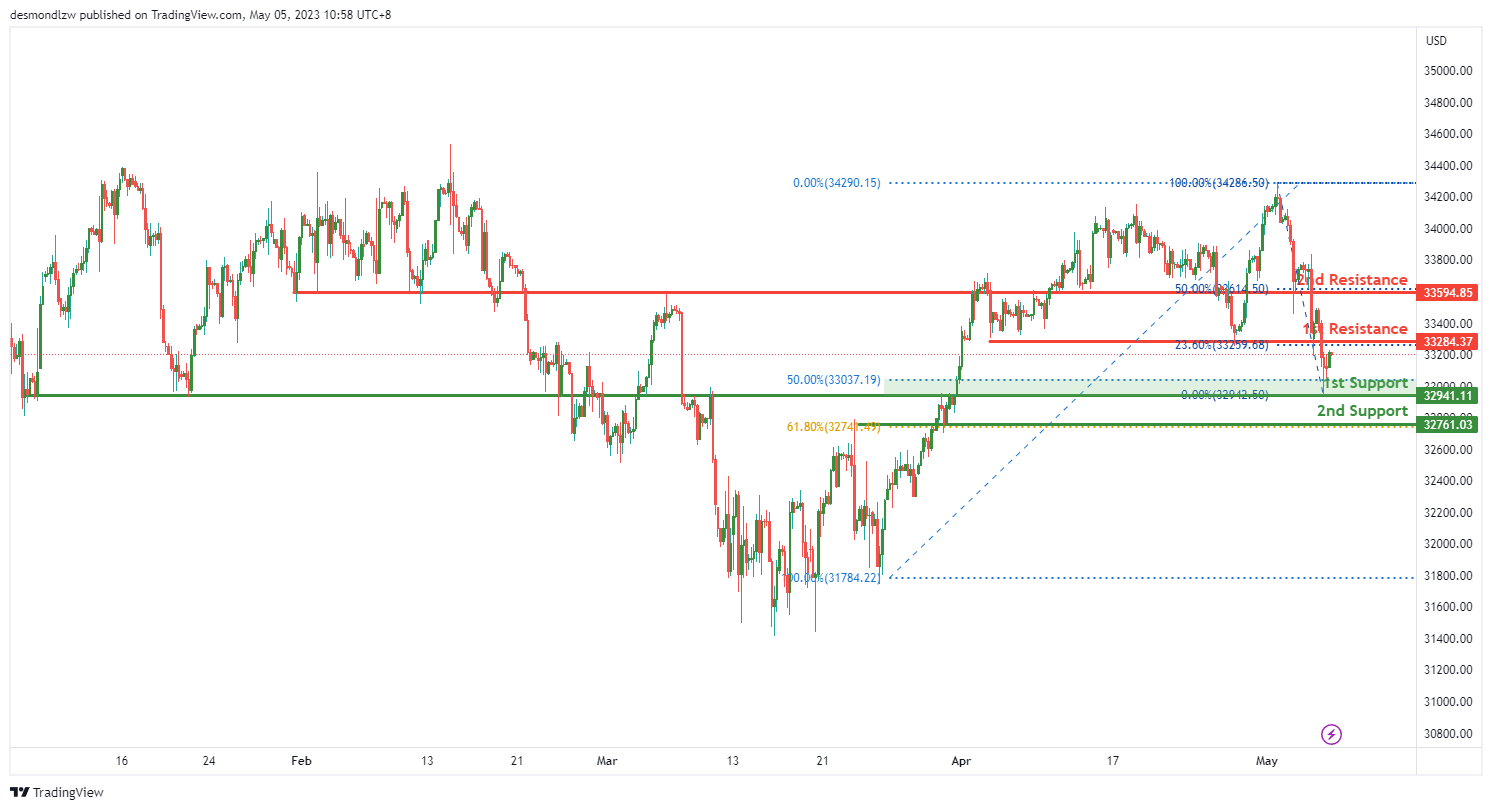
The overall momentum of the chart, it appears that the DJ30 is experiencing bullish momentum.
The 1st support level for the DJ30 is at 32941.11. This level is an overlap support and coincides with the 50% Fibonacci retracement, suggesting that it is a potentially strong level for support.
There is also a 2nd support level at 32761.03 which is an overlap support and coincides with the 61.80% Fibonacci retracement. This level is significant because it has previously acted as a support level and could potentially provide support in the future.
On the other hand, the 1st resistance level is at 33284.37. This level is a pullback resistance, suggesting that it is a potentially strong level for resistance.
There is also a 2nd resistance level at 33594.85 which is an overlap resistance and coincides with the 50% Fibonacci retracement. This level is significant because it has previously acted as a resistance level and could potentially provide resistance in the future.
GER30:
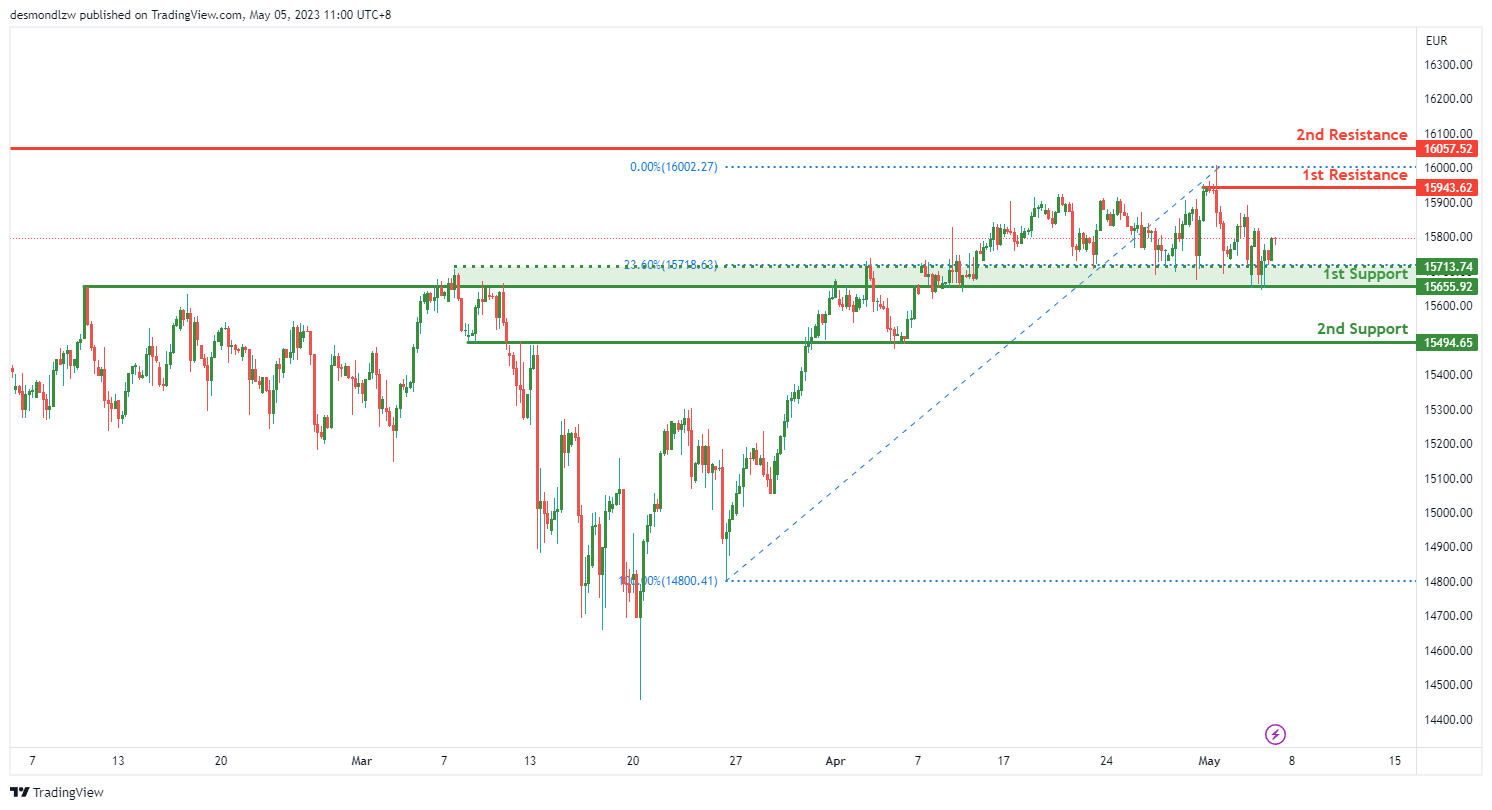
The overall momentum of the chart, it appears that the GER30 is experiencing bullish momentum.
The 1st support level for the GER30 is at 15655.92. This level is an overlap support and coincides with the 23.60% Fibonacci retracement, suggesting that it is a potentially strong level for support.
There is also a 2nd support level at 15494.65 which is an overlap support. This level has acted as a support level in the past and could potentially provide support in the future.
On the other hand, the 1st resistance level is at 15943.62. This level is a multi-swing high resistance, suggesting that it is a potentially strong level for resistance.
There is also a 2nd resistance level at 16057.52 which is a swing high resistance. This level has previously acted as a resistance level and could potentially provide resistance in the future.
BTC/USD:
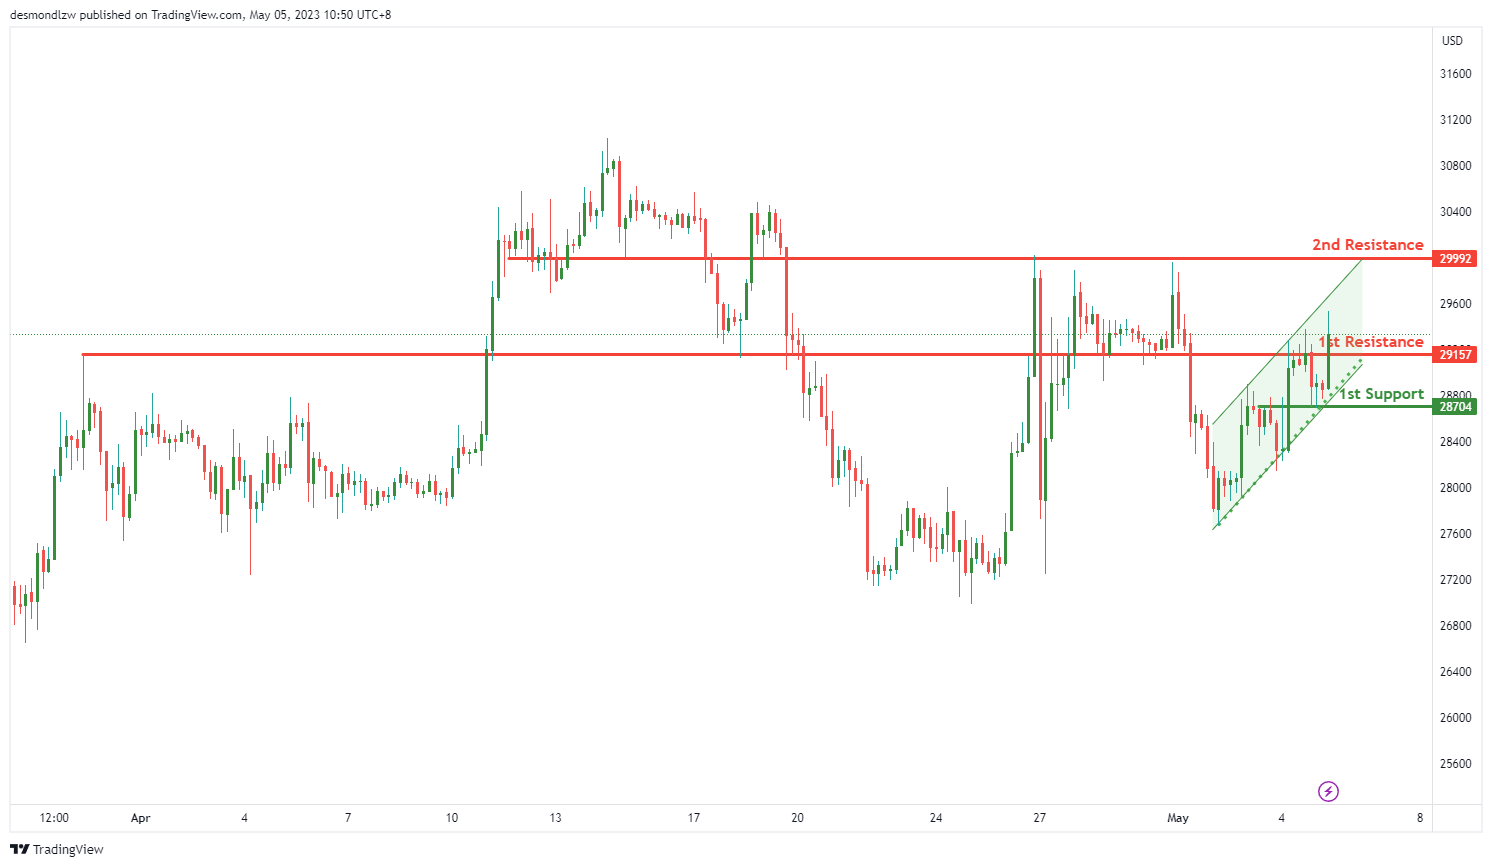
BTC/USD is currently seeing strong bullish momentum, as indicated by its position in a bullish ascending channel. The overall momentum of the chart is bullish, and this is reinforced by the fact that price is within a bullish ascending channel, which suggests that price might continue to rise due to its bullish momentum.
Price could potentially make a bullish break through the 1st resistance at 29157 and rise to the 2nd resistance at 29992. This is a significant level for the price of BTC/USD, as it marks an overlap resistance that has the potential to trigger a strong bullish acceleration towards the 2nd resistance level.
In terms of support, the 1st support level is at 28704, and it is an overlap support. This level is important because it can act as a base for the price to bounce off of and potentially continue its bullish trend.
US500
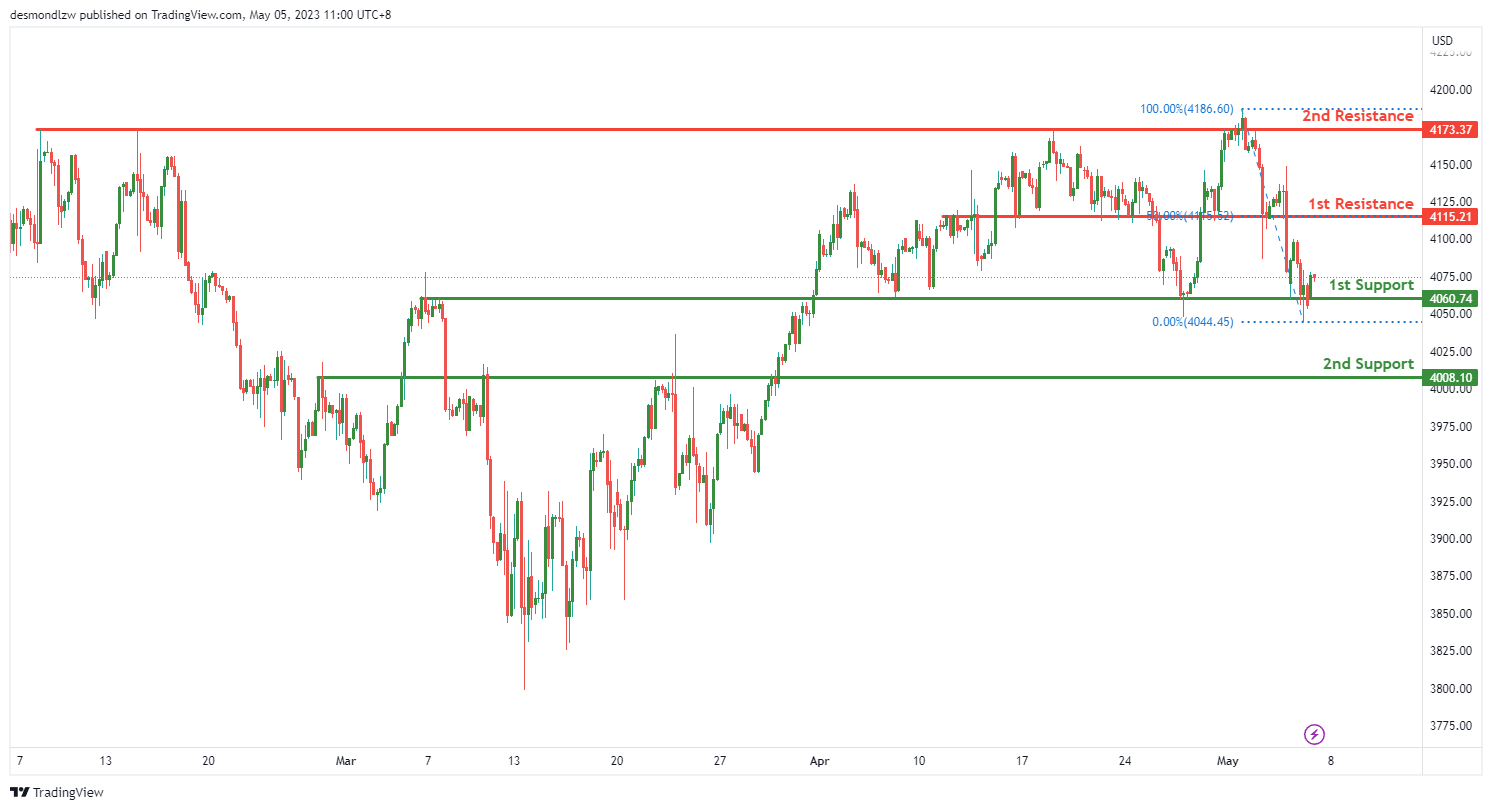
The US500 chart currently displays a strong bullish momentum, with a potential for price to continue rising towards resistance levels. The overall bias is bullish, with a high confidence level.
Factors contributing to this momentum include the fact that price is above a major ascending trend line, suggesting further bullish momentum is on the cards. In addition, price is within a bullish ascending channel, which further suggests that price might continue to rise due to its bullish momentum.
If price were to bounce off the 1st support level at 4061, it could potentially head towards the 1st resistance level at 4115. This resistance level is an overlap resistance, and also coincides with a 50% Fibonacci retracement. A break above this level could lead to a further rise towards the 2nd resistance level at 4173, which is a multi-swing high resistance.
On the other hand, if price were to break the 1st support level, the next support level it could drop to is the 2nd support level at 4008, which is a pullback support.
ETH/USD:
The ETH/USD chart is currently exhibiting a bullish momentum, which suggests that the price might continue to rise due to its bullish momentum. The overall momentum of the chart is bullish, and the price could potentially make a bullish continuation towards the 1st resistance level.
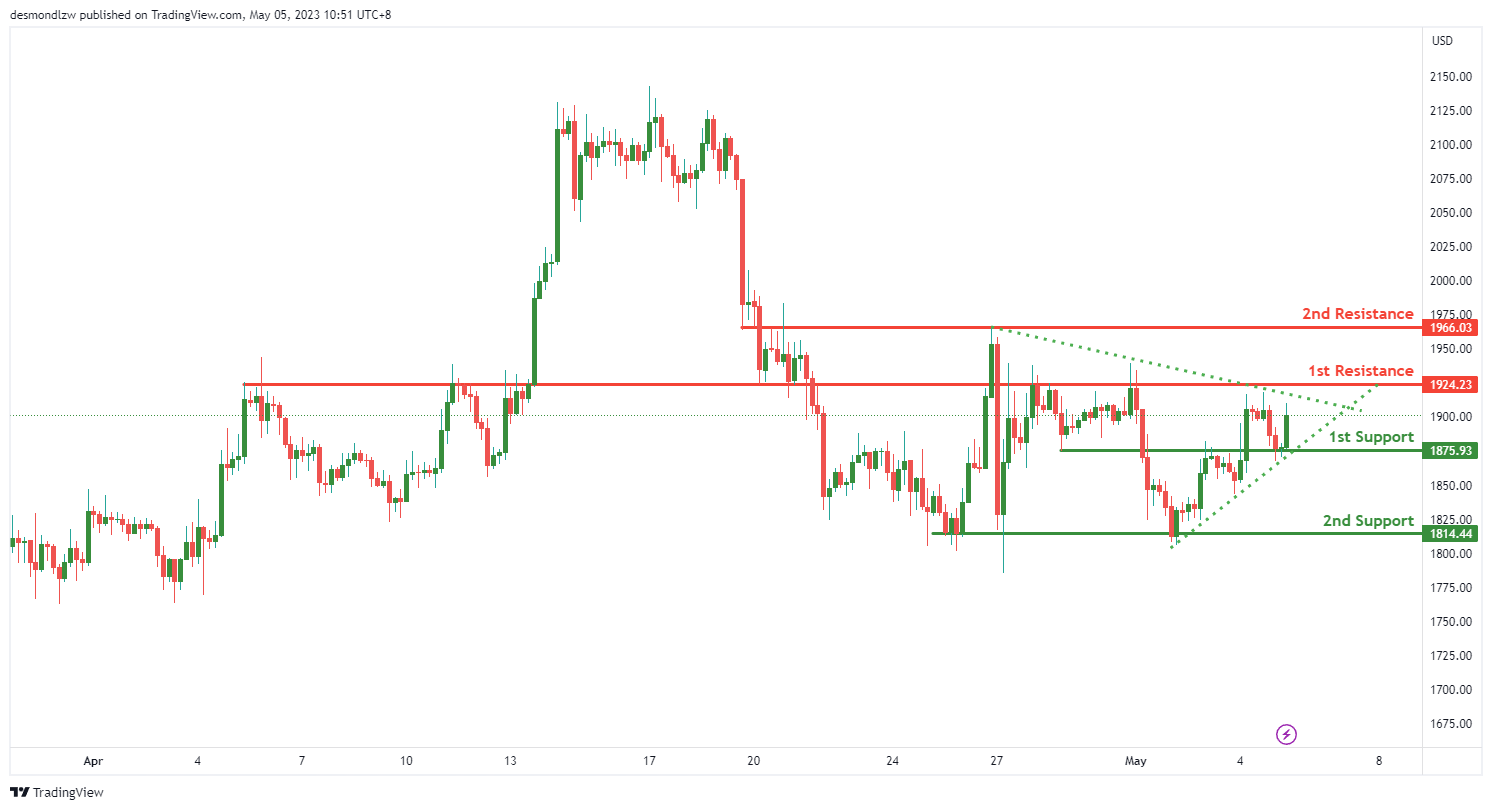
The 1st support level is at 1875.93, which is an overlap support level. This means that this level has been tested several times in the past and has held as a support level, which makes it a strong level to watch out for. The 2nd support level is at 1814.44, which is a multi-swing low support level.
The 1st resistance level is at 1924.23, which is an overlap resistance level. This level has been tested several times in the past and has acted as a strong resistance level. The 2nd resistance level is at 1966.03, which is also an overlap resistance level.
Additionally, there is a symmetrical triangle chart pattern on the chart, which represents a period of consolidation before the price is forced to breakout or breakdown. This suggests that there might be a potential breakout in the near future, which could lead to a bullish continuation in price.
WTI/USD:
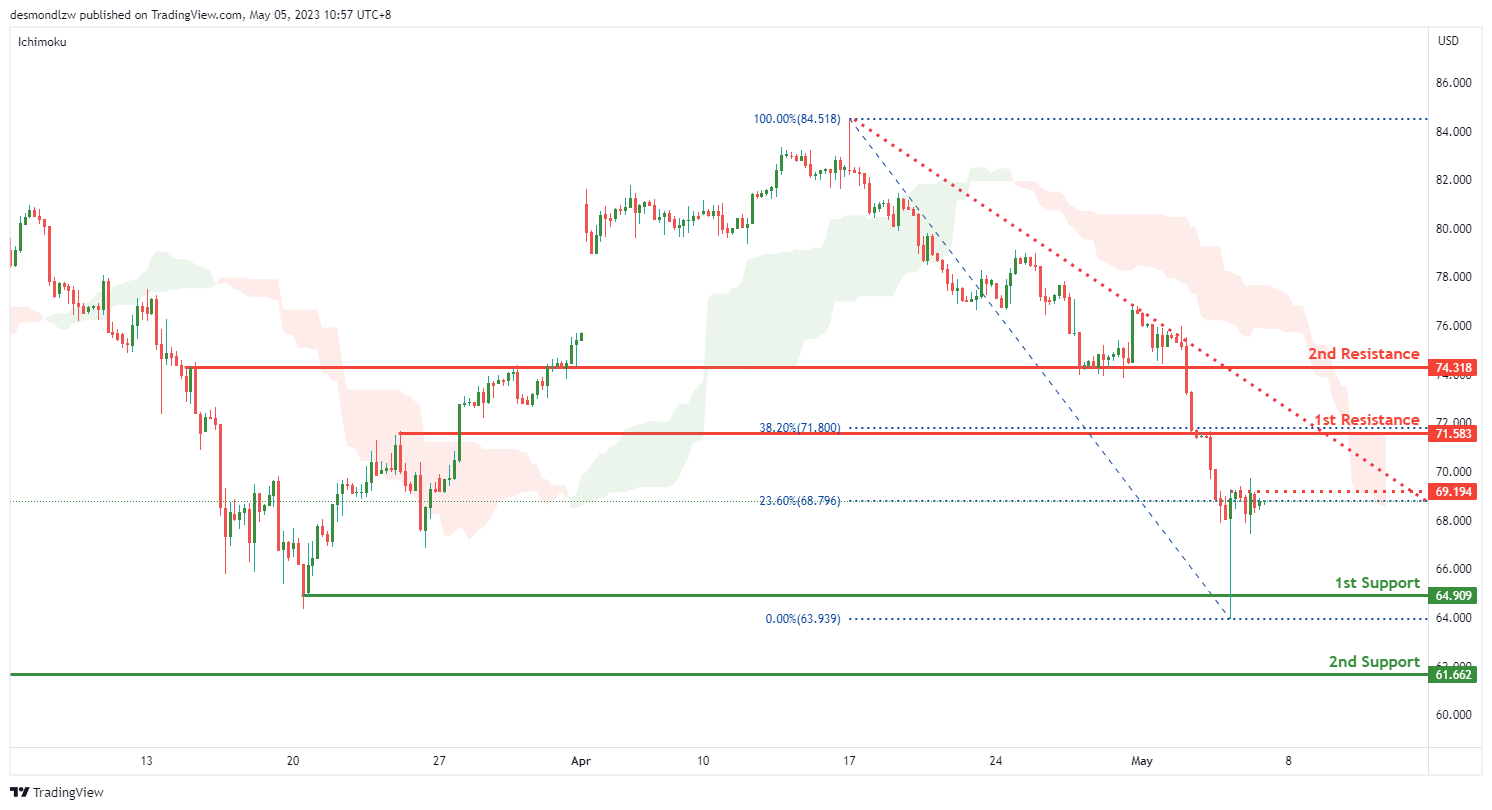
The WTI chart is showing a bearish momentum, with price below the bearish Ichimoku cloud. It is possible for the price to continue its bearish trend towards the first support at 64.90. This level is a strong support as it has acted as an overlap support in the past. If the price were to break below this level, it could potentially fall to the second support at 61.66, which is a swing low support.
On the other hand, if the price were to rebound from the current level, it could potentially head towards the first resistance at 71.58. This level is also an overlap resistance, and coincides with the 38.20% Fibonacci retracement level. If the price manages to break above this resistance, it could potentially move towards the second resistance at 74.31, which is a pullback resistance.
An intermediate resistance is also observed at 69.19, which is an overlap resistance and coincides with the 23.60% Fibonacci retracement level. If the price manages to break above this level, it could potentially act as a support and push the price higher.
XAU/USD (GOLD):
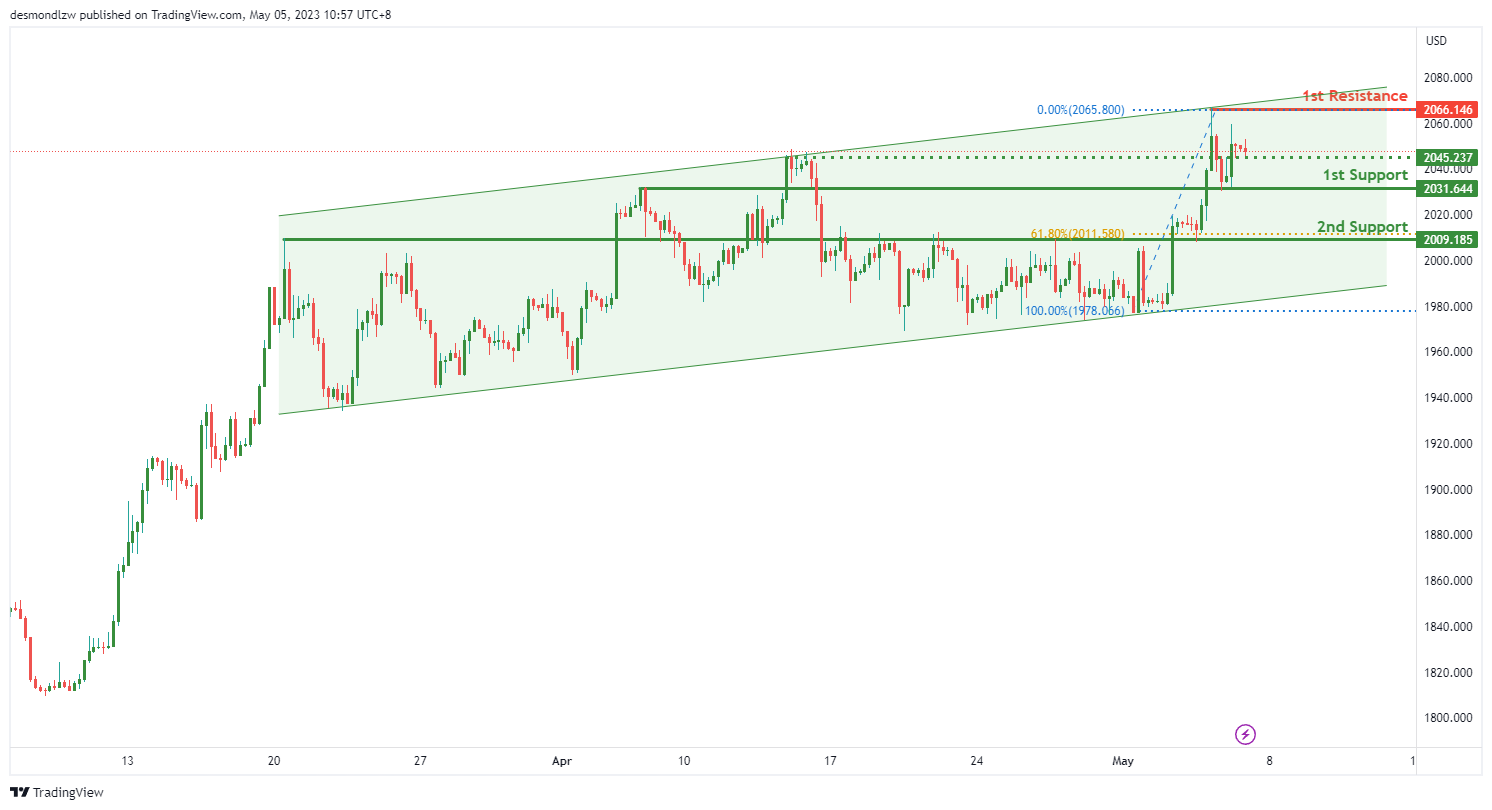
Gold’s bullish momentum has been strong and remains intact, as the overall momentum of the chart is bullish. Price is currently trading in a bullish ascending channel, which suggests that there may be further bullish momentum to come.
Looking at the support and resistance levels, the first support level is at 2031.64, which is an overlap support level, followed by a second support level at 2009.18, which is a 61.80% Fibonacci retracement level. On the other hand, the first resistance level is at 2066.14, which is a swing high resistance level.
Considering the current bullish momentum, it is likely that gold will continue its bullish run towards the first resistance level at 2066.14. However, it is important to keep an eye on the support levels as well. If the price drops below the second support level at 2009.18, it may signal a bearish correction or reversal.
AUD/USD Daily Report
Daily Pivots: (S1) 0.6653; (P) 0.6680; (R1) 0.6719; More...
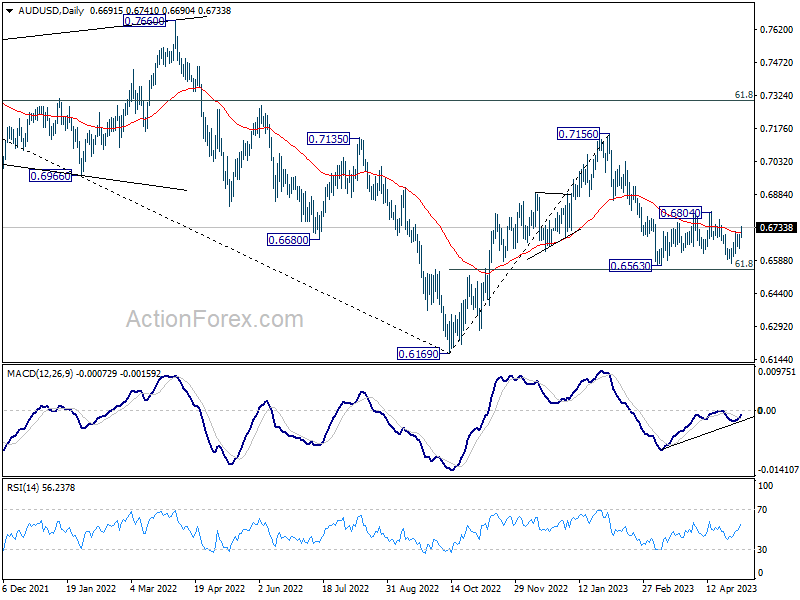
AUD/USD's rebound from 0.6572 extends higher today but stays well below 0.6804 resistance. Intraday bias remains neutral at this point. Near term outlook also stays bearish as long as 0.6804 resistance holds, and down trend resumption through 0.6563 low is in favor at a later stage. Nevertheless, sustained break of 0.6804 should indicate completion of whole fall from 0.7156, and turn near term outlook bullish for retesting this high instead.
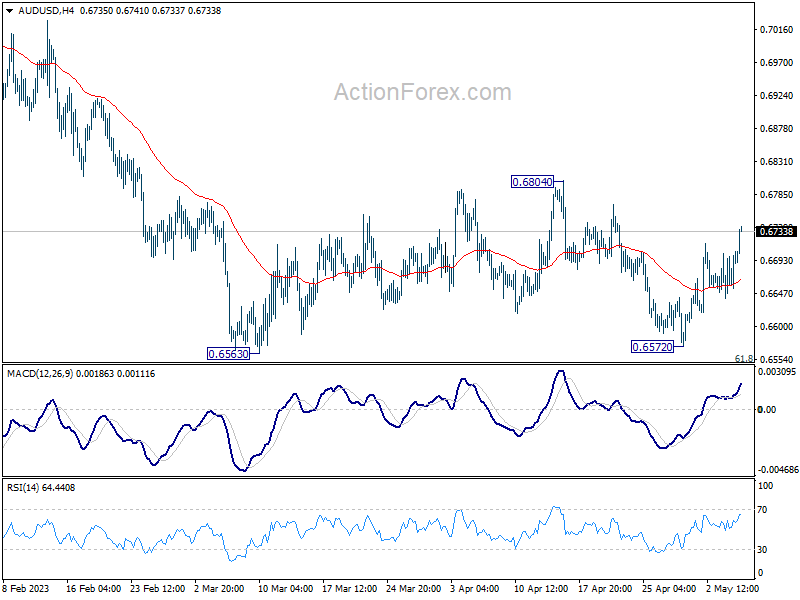
In the bigger picture, as long as 61.8% retracement of 0.6169 to 0.7156 at 0.6546 holds, the decline from 0.7156 is seen as a correction to rally from 0.6169 (2022 low) only. Another rise should still be seen through 0.7156 at a later stage. However, sustained break of 0.6546 will raise the chance of long term down trend resumption through 0.6169 low.
Aussie Flexes Muscles on RBA, Dollar Down ahead of NFP
Dollar trades broadly lower overnight and remains soft in Asian session. Despite risk-off sentiment in the US, the greenback failed to find support, as market participants bet on an earlier Fed rate cut due to ongoing bank concerns. Meanwhile, Euro is also facing pressure due to falling treasury yields, with yesterday's ECB rate hike now in the rearview mirror.
In contrast, Australian Dollar emerged as one of the stronger currencies today, following RBA's Statement on Monetary Policy, which suggested that further rate hikes could still be on the horizon. New Zealand Dollar is also showing strength, while Canadian Dollar lags far behind. Yen and Swiss Franc are firm but outpaced by Aussie. However, these two safe-haven currencies could potentially gain traction if risk aversion intensifies before the weekly close.
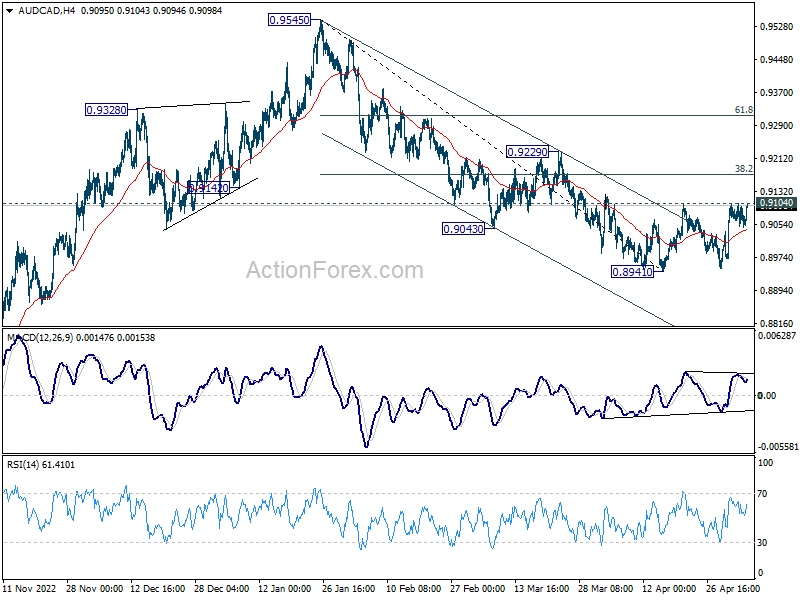
Technically, the case of near term bullish reversal in AUD/CAD is building up. Immediate focus is now on 0.9104 resistance. Strong rebound there will resume the rebound from 0.8941 short term bottom, to 38.2% retracement of 0.9545 to 0.8941 at 0.9172, or even further to 0.9229 resistance. Nevertheless, rejection by 0.9104, followed by break of 55 4H EMA (now at 0.9044) will retain near term bearishness for breaking through 0.8941 low at a later stage. Today's Canadian job data could be a trigger for the next move.
In Asia, Japan is still on holiday. Hong Kong HSI is up 0.59% at the time of writing, China Shanghai SSE is down -0.67%. Singapore Strait Times is down -0.18%. Overnight, DOW dropped -0.86%. S&P 500 dropped -0.72%. NASDAQ dropped -0.49%. 10-year yield dropped -0.052 to 3.351.
BoC Macklem: Getting inflation down to 2% would be more difficult
BoC Governor Tiff Macklem has reiterated the central bank's commitment to restore price stability, stating that it is prepared to raise rates further if inflation remains materially above the 2% target.
Macklem explained in a speech, "We expect [inflation] will hit 3% this summer, even as the economy continues to grow modestly." Although encouraged by the progress, he noted that bringing inflation back down to the 2% target would be "more difficult", with current projections pointing to the end of 2024.
The BoC Governor emphasized, "our job is not done until we restore price stability—in other words, until inflation is centered on our 2% target."
He also acknowledged the biggest upside risk to their inflation forecast is the persistence of services price inflation, which requires the labor market to rebalance, corporate pricing behavior to normalize, and near-term inflation expectations to come down further in order to return to the 2% target.
RBA SoMP: Faster inflation slowdown in 2023, but not after
In the quarterly Statement on Monetary Policy, RBA reiterated that "some further tightening of monetary policy may be required" to ensure that inflation returns to target in a "reasonable timeframe". But that will depend upon "how the economy and inflation evolve."
The new economic projections show both headline and trimmed mean inflation slowing more rapidly in 2023. However, both measures are only expected to reach the top of target range by mid-2025. Additionally, the central bank downgraded its GDP growth forecasts for 2023 and predicts a higher unemployment rate. The evolving economic landscape will be key in determining the RBA's future policy moves.
Year-average GDP growth forecast:
- 2023 at 1.75% (revised down from 2.25%).
- 2024 at 1.50% (unchanged).
Unemployment rate forecast:
- Dec 2023 at 4.00% (revised up from 3.75%).
- Dec 2024 at 4.50% (revised up from 4.25%).
Headline CPI forecast:
- Dec 2023 at 4.50% (revised down from 4.75%).
- Dec 2024 at 3.25% (unchanged).
- Jun 2025 at 3.00% (unchanged).
Trimmed mean CPI forecast:
- Dec 2023 at 4.00% (revised down from 4.25%).
- Dec 2024 at 3.00% (unchanged).
- Jun 2025 at 3.00% (unchanged).
China Caixin PMI services dropped to 56.4, remains to be seen if rebound sustainable
China's Caixin PMI Services dropped to 56.4 in April, down from 57.8 in March and slightly below the expected 56.5. According to Caixin, the sector experienced slower yet still sharp increases in activity and new work, while input cost inflation accelerated to a one-year high. Employment growth slowed and backlogs continued to build, with the PMI Composite index falling from 54.5 to 53.6.
Wang Zhe, Senior Economist at Caixin Insight Group said: "In April, the services sector kept up momentum, while manufacturing activity turned comparatively sluggish and became a drag on economic growth. It remains to be seen if the economic rebound is sustainable after a short-term release of pent-up demand, with a number of indicators flagging that the recovery has yet to find a stable footing."
US non-farm payroll data in focus, reactions to be complex
Market attention today is on US non-farm payroll data, with headline job growth anticipated to slow to 181k in April. Unemployment rate is predicted to remain steady at 3.5%, while average hourly earnings are expected to maintain a 0.3% mom pace.
Recent related data releases include a sharp rise in ISM manufacturing employment from 46.9 to 50.2 in April and a slight drop in ISM services employment from 51.3 to 50.8. Additionally, ADP private jobs saw a robust growth of 296k. But four-week moving average of initial jobless claims rose significantly from 198k to 239k.
Reactions to today's non-farm payroll data may be complex, as investors will likely want to see job market loosening up with a cooldown in wage growth. However, concerns surrounding banks and Dollar's reaction to Fed expectations, risk sentiment, and treasury yields also need to be considered.
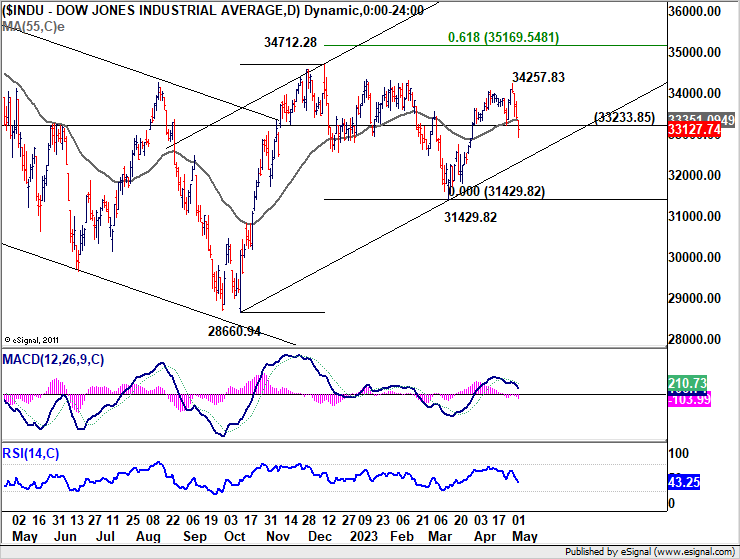
Following DOW's strong break of 55 D EMA (now at 33351.09) and 33233.85 support overnight, rebound from 31429.82 appears to have completed at 34257.83. Whether the fall from there represents a correction to rise from 31429.82 or a falling leg of the pattern from 37412.28 remains to be seen. But a deeper fall is expected in the near term. First line of defense will be trend line support at around 32350. The second line is 31429.82. Nevertheless a close above 55 D EMA for the week would revive near term bullishness.
Elsewhere
Swiss unemployment rate and CPI, Germany factory orders, France industrial output, Eurozone retail sales, and UK PMI construction will be released in European session. Later in the day, in additional to US NFP, Canada will also release job data.
AUD/USD Daily Report
Daily Pivots: (S1) 0.6653; (P) 0.6680; (R1) 0.6719; More...
AUD/USD's rebound from 0.6572 extends higher today but stays well below 0.6804 resistance. Intraday bias remains neutral at this point. Near term outlook also stays bearish as long as 0.6804 resistance holds, and down trend resumption through 0.6563 low is in favor at a later stage. Nevertheless, sustained break of 0.6804 should indicate completion of whole fall from 0.7156, and turn near term outlook bullish for retesting this high instead.
In the bigger picture, as long as 61.8% retracement of 0.6169 to 0.7156 at 0.6546 holds, the decline from 0.7156 is seen as a correction to rally from 0.6169 (2022 low) only. Another rise should still be seen through 0.7156 at a later stage. However, sustained break of 0.6546 will raise the chance of long term down trend resumption through 0.6169 low.
Economic Indicators Update
| GMT | Ccy | Events | Actual | Forecast | Previous | Revised |
|---|---|---|---|---|---|---|
| 01:30 | AUD | RBA Monetary Policy Statement | ||||
| 01:45 | CNY | Caixin Services PMI Apr | 56.4 | 56.5 | 57.8 | |
| 05:45 | CHF | Unemployment Rate Apr | 1.90% | 1.90% | ||
| 06:00 | EUR | Germany Factory Orders M/M Mar | -2.00% | 4.80% | ||
| 06:30 | CHF | CPI M/M Apr | 0.20% | 0.20% | ||
| 06:30 | CHF | CPI Y/Y Apr | 2.80% | 2.90% | ||
| 06:45 | EUR | France Industrial Output M/M Mar | -0.30% | 1.20% | ||
| 07:00 | CHF | Foreign Currency Reserves (CHF) Apr | 743B | |||
| 08:00 | EUR | Italy Retail Sales M/M Mar | 0.00% | -0.10% | ||
| 08:30 | GBP | Construction PMI Apr | 51.1 | 50.7 | ||
| 09:00 | EUR | Eurozone Retail Sales M/M Apr | -0.20% | -0.80% | ||
| 12:30 | USD | Nonfarm Payrolls Apr | 181K | 236K | ||
| 12:30 | USD | Unemployment Rate Apr | 3.50% | 3.50% | ||
| 12:30 | USD | Average Hourly Earnings M/M Apr | 0.30% | 0.30% | ||
| 12:30 | CAD | Net Change in Employment Apr | 21.6K | 34.7K | ||
| 12:30 | CAD | Unemployment Rate Apr | 5.10% | 5.00% |