Sample Category Title
EUR/JPY Daily Outlook
Daily Pivots: (S1) 148.01; (P) 149.22; (R1) 151.30; More....
Intraday bias in EUR/JPY remains on the upside for the moment. Current up trend should now target 153.64 projection level. On the downside, below 148.61 minor support will turn intraday bias neutral and bring consolidations first, before staging another rally.
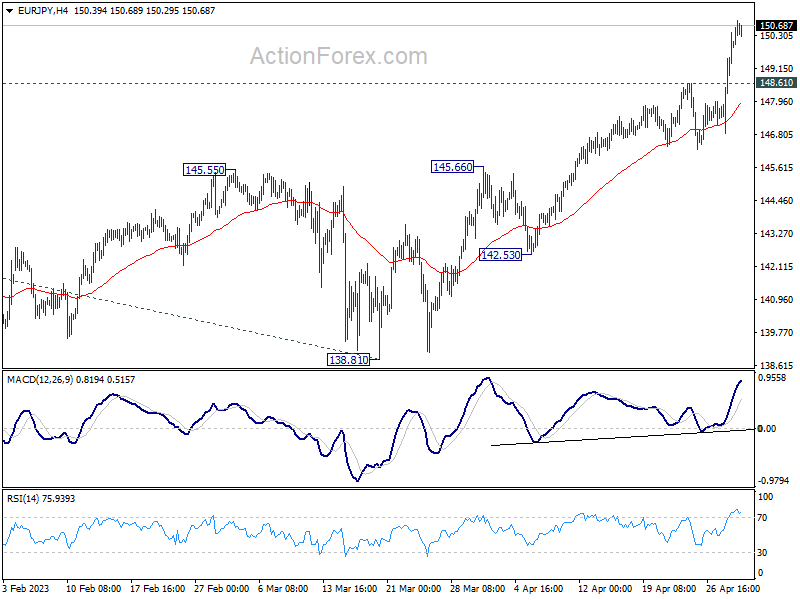
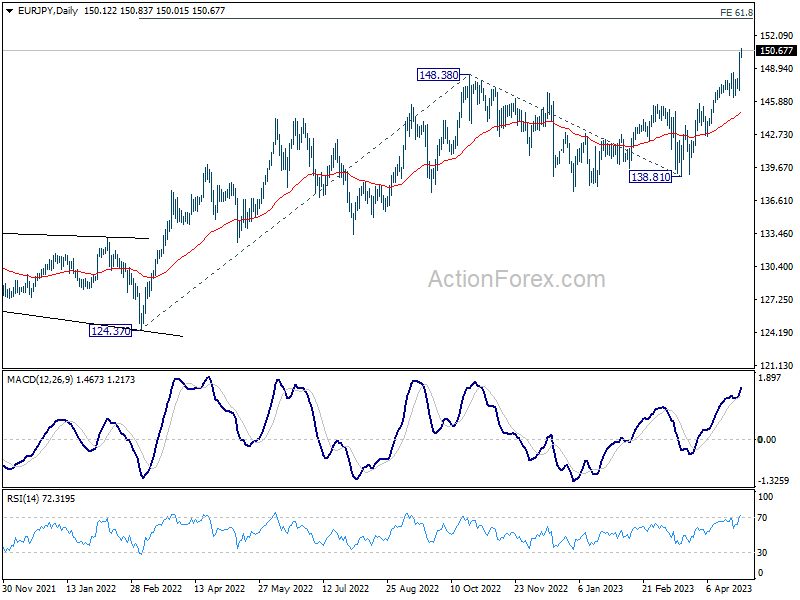
In the bigger picture, current development indicates that rise from 114.42 (2020 low) is in progress. Next target is 61.8% projection of 124.37 to 148.38 from 138.81 at 153.64. Sustained break there will pave the way to 100% projection at 162.82. For now, medium term outlook will remain bullish as long as 138.81 support holds, even in case of deep pull back.
EUR/GBP Daily Outlook
Daily Pivots: (S1) 0.8742; (P) 0.8790; (R1) 0.8816; More...
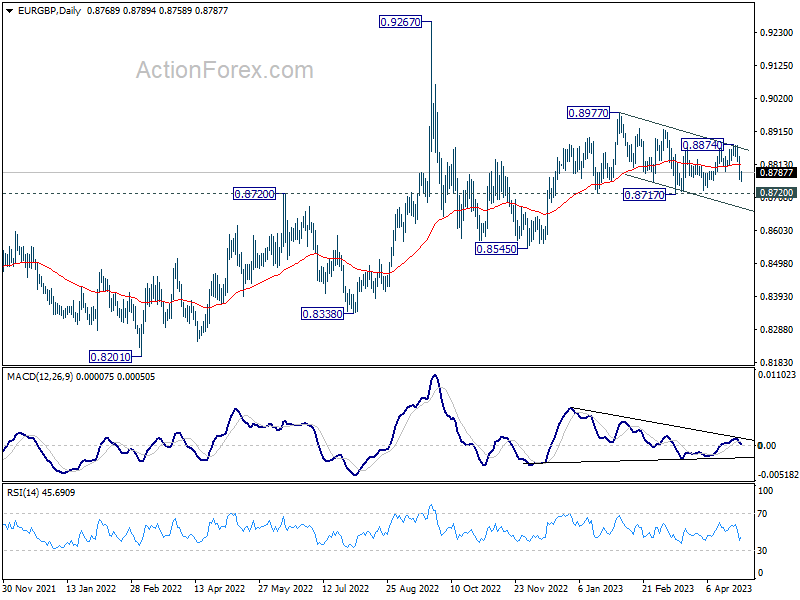
Intraday bias in EUR/GBP is turned neutral with current recovery. Near term outlook is mixed for now. On the downside, decisive break of 0.8717 support will resume whole choppy decline from 0.8977. On the upside, break of 0.8874 will resume the rebound from 0.8717 instead.
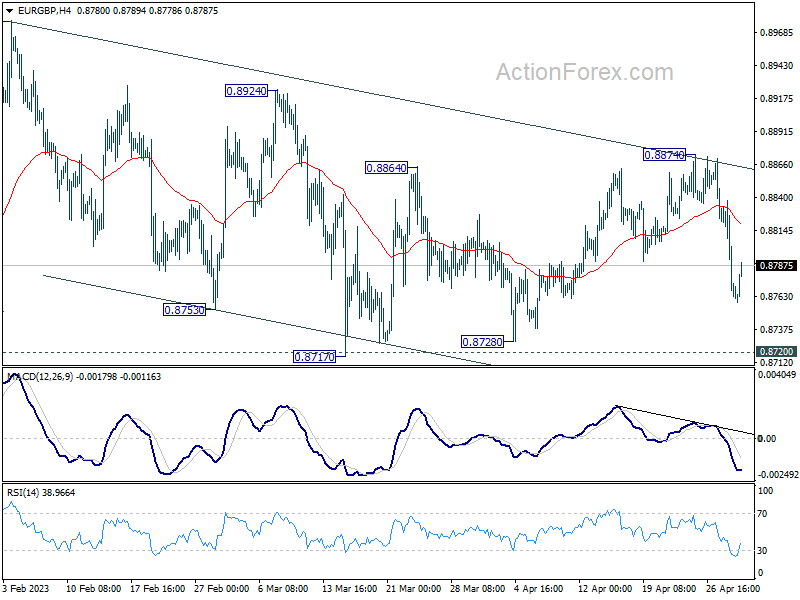
In the bigger picture, outlook remains rather mixed for now, except that price actions from 0.9267 (2022 high) are part of the long term range pattern from 0.9499 (2020 high). With 0.8720 support intact, rise from 0.8545 is in favor to continue through 0.8977. However, firm break of 0.8720 will argue that such rebound has completed, and open up deeper fall through this support level.
EUR/AUD Daily Outlook
Daily Pivots: (S1) 1.6601; (P) 1.6659; (R1) 1.6710; More...
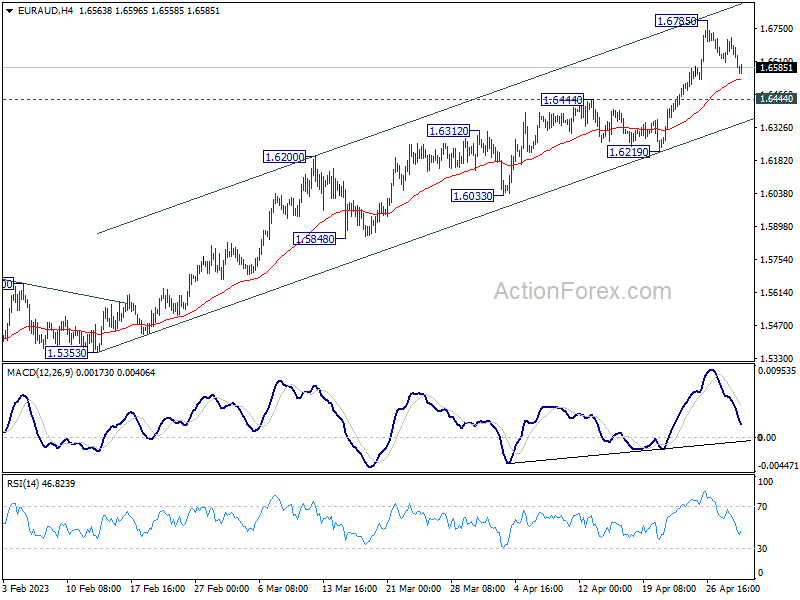
EUR/AUD's retreat from 1.6785 extends lower today but stays well above 1.6444 resistance turned support. Intraday bias remains neutral for the moment. Downside of retreat should be contained by 1.6444 resistance turned support to bring rally resumption. On the upside, break of 1.6785 will resume larger up trend from 1.4281 to 100% projection of 1.4281 to 1.5976 from 1.5254 at 1.6949.
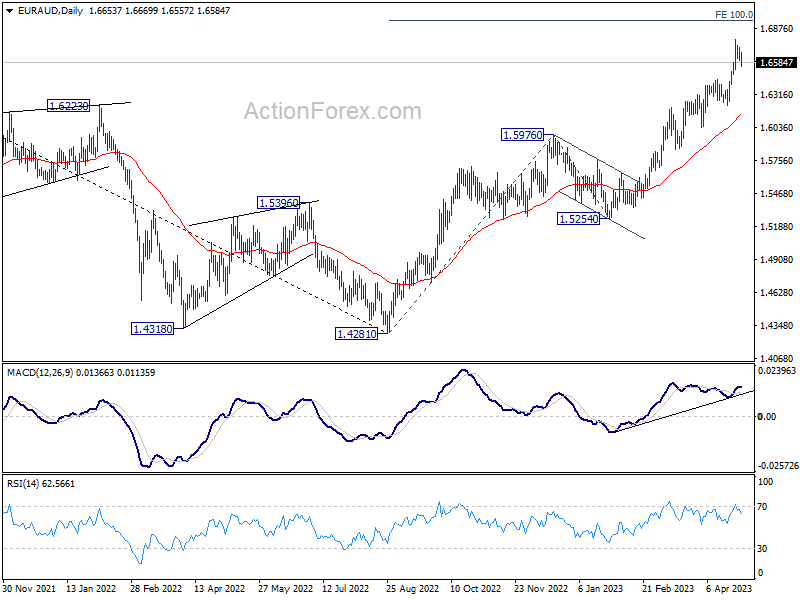
In the bigger picture, the solid break of 1.6434 resistance argues that whole down trend from 1.9799 (2020 high) has completed at 1.4281 (2022 low). Further rise should be seen to 61.8% retracement of 1.9799 to 1.4281 at 1.7691 next. For now, outlook will stay bullish as long as 1.5976 resistance turned support holds, even in case of deep pull back.
EUR/CHF Daily Outlook
Daily Pivots: (S1) 0.9826; (P) 0.9845; (R1) 0.9875; More...
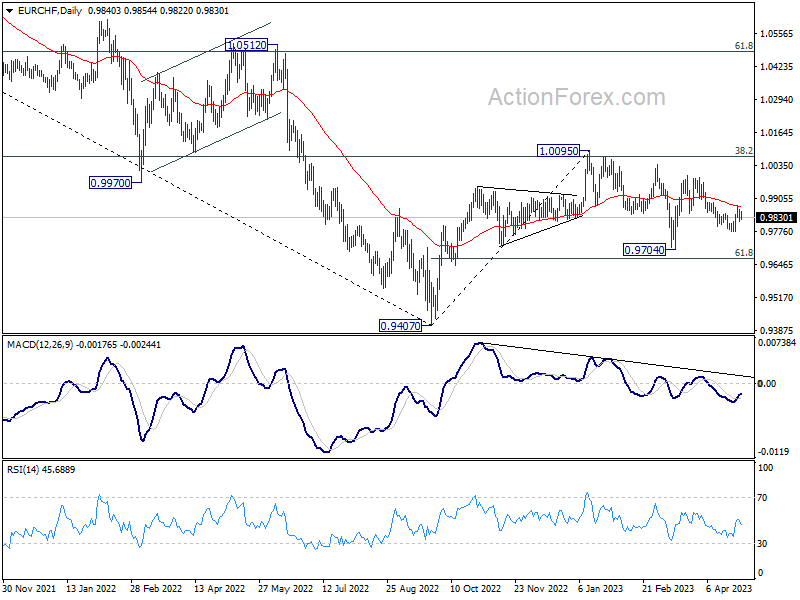
Intraday bias in EUR/CHF remains neutral for the moment. Risk will stay on the upside as long as as long as 0.9774 short term bottom holds. Current development suggests that whole correction from 1.0095 has completed at 0.9704. Break of 0.9878, and sustained trading above 55 D EMA (now at 0.9873) will affirm this bullish case, and target 0.9995 resistance next.
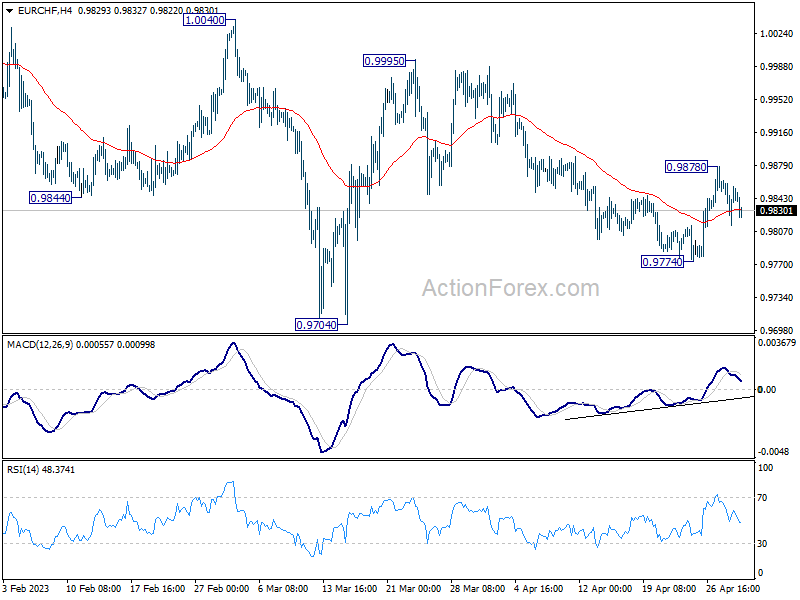
In the bigger picture, prior rejection by 55 W EMA (now at 0.9972) and 38.2% retracement of 1.1149 to 0.9407 at 1.0072 suggests that medium term outlook is staying bearish. That is, down trend from 1.2004 is not completed yet and is in favor to resume through 0.9407 at a later stage. However, decisive break of 1.0095 resistance will raise the chance of bullish trend reversal. Rise from 0.9407 should then target 1.0505 cluster resistance (2020 low at 1.0505, 61.8% retracement of 1.1149 to 0.9407 at 1.1484).
Cryptocurrencies Rock the Thin Market
Market picture
According to CoinMarketCap, cryptocurrency market capitalisation grew by 2.5% over the past seven days to $1.18 trillion, but the magnitude of the increase was twice greater on Sunday. The pressure on the market resumed last night and peaked on Monday morning. And it looks like Bitcoin is again behind this decline as its price approaches 30K.
Bitcoin approached 30K again on Sunday, from where the selling intensified. The situation looks like the big players are playing games to warm up the thin market over the weekend and early trading hours in Asia, amplifying the amplitude of the move on relatively low volumes.
Worryingly, we have seen a series of declining tops in the last three weeks, and significant downside momentum is building faster and faster.
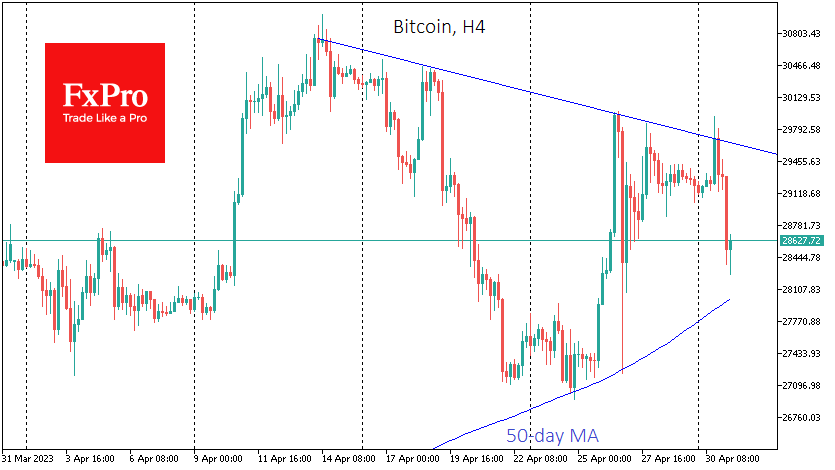
On the optimistic side, the avalanche of stop orders is not destabilising the market. Bitcoin is starting to buy back quickly as it approaches $28,000, where the 50-day moving average has shifted.
In terms of seasonality, May is considered a relative success for BTC. Over the past 12 years, bitcoin has ended the month up seven times and down five times. The average gain was 29.7%, and the average loss was 15.8%. Meanwhile, the last two Mays have disappointed BTC, with an average loss of 26% each.
News background
Glassnode recorded the most significant cryptocurrency inflows on Binance since the FTX crash last November. Often this signals a willingness to sell for dollars, but there are cases where Bitcoin sales fund the purchase of altcoins.
According to Germany’s oldest bank, Berenberg Bank, bitcoin could rise significantly after halving next year. The fact that VTC has become virtually the only crypto asset to be classified by the SEC as a commodity rather than a security could also help.
Gary Gensler, head of the SEC, has said that cryptocurrencies should be treated as investment contracts, requiring platforms offering them to register and comply with securities laws.
Investor and billionaire Ray Dalio said he has a small number of bitcoins, but because cryptocurrencies are unreliable anyway, he prefers gold. He told Bitcoin holders should be prepared for an 80% drop.
Oil Has Closed the Gap But Ready to Go Lower
WTI oil stabilises near $75 for the third day at the lowest monthly level. The economic slowdown is dragging down the Crude, but OPEC+ coordination supports the market. Oil has returned to a range from which an exit promises to have a dam-breaking effect.
Volatility in oil declined after the market closed a 7% gap that had formed following an unexpected OPEC+ quota cut over the weekend in early April. The current level of around 75 also acted as the bottom of the trading range from December to March.
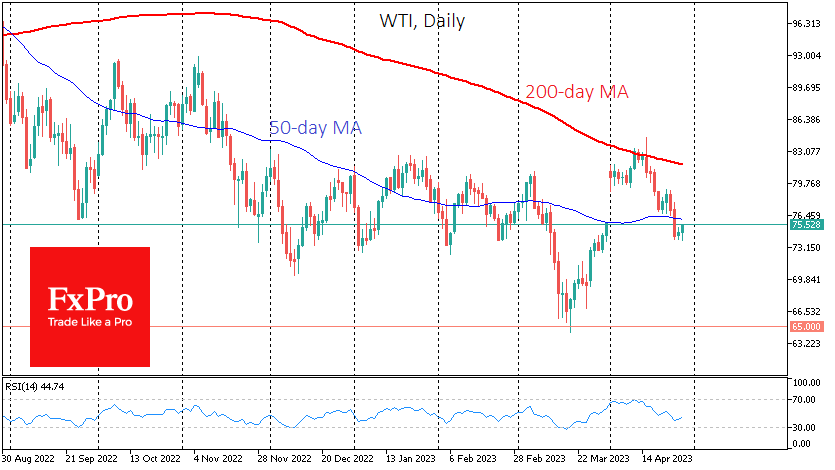
Oil’s decline accelerated in the first half of March, finding support only near $64 as markets began to price in a reversal of the Fed’s rate cut. OPEC quota cuts and Russia’s voluntary production cuts pushed the price up to $83 by mid-month.
The 200-day moving average was a critical resistance level in the second half of April. Oil failed to breach this line and remained within the bearish trend. At the beginning of the week, the price fell below the 50-day moving average in a sharp move. The dynamics of oil near key moving averages prove that the market remains bearish, with deteriorating macroeconomic conditions.
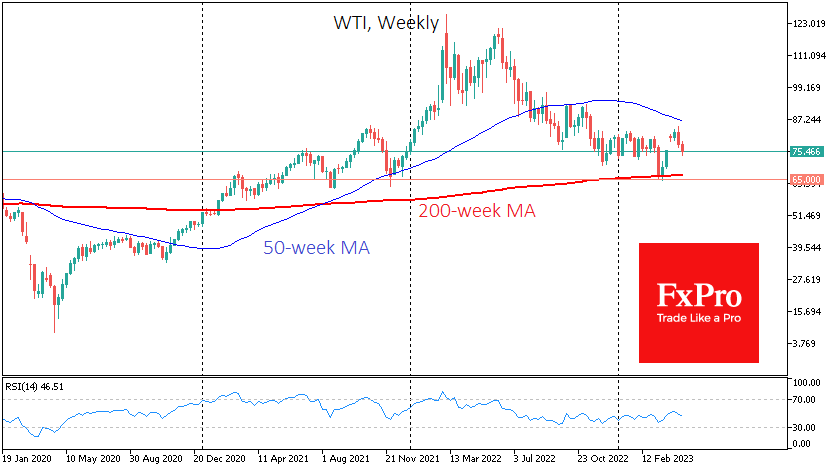
The $65-67 area looks like an attractive target for the bears. There are many pivot points from 2021 onwards. Before that, there was significant resistance in 2019. In addition, the 200-week moving average, the most crucial indicator of the long-term trend in commodities, is close to $67.
Nevertheless, sellers should remain cautious, as a sustained decline in prices will almost certainly attract the attention of OPEC.
How Will BoJ Meeting Affect Yen
Hold onto your hats, folks! The Japanese yen took a nosedive after the Bank of Japan (BOJ) left its ultra-loose policy settings unchanged, including its closely watched yield curve control (YCC) policy. But wait, there's more! The BOJ also removed its forward guidance, which had previously pledged to keep interest rates at current or lower levels. So, what's the scoop? Market expectations had been subdued going into the meeting, but some were still hoping for tweaks to the forward guidance to prepare for an eventual exit from the bank's massive stimulus. And while the options market was positioned for hawkish outcomes, the BOJ is no stranger to surprises - just ask those caught off guard by their December rate decision. So, what's next? Let's see what the price action looks like.
USDJPY - Daily Timeframe
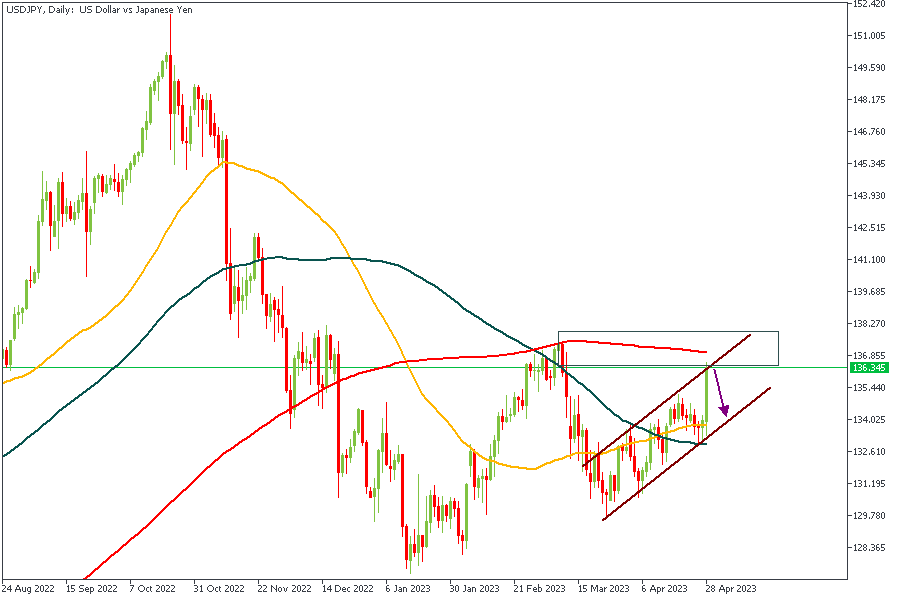
USDJPY could be on the verge of a reversal, and the reasons are not far-fetched. First, the price is trading within the rally-base-drop on the Daily timeframe while approaching the 200-Day Moving Average. Finally, the price is also retesting the trendline resistance of an ascending channel pattern. Moreover, the supply zone rests on 88% of the Fibonacci, which could be an added confluence towards the bearish reaction.
Analysts’ Expectations:
- Direction: Bearish
- Target: 134.341
- Invalidation: 137.912
GBPJPY - Daily Timeframe
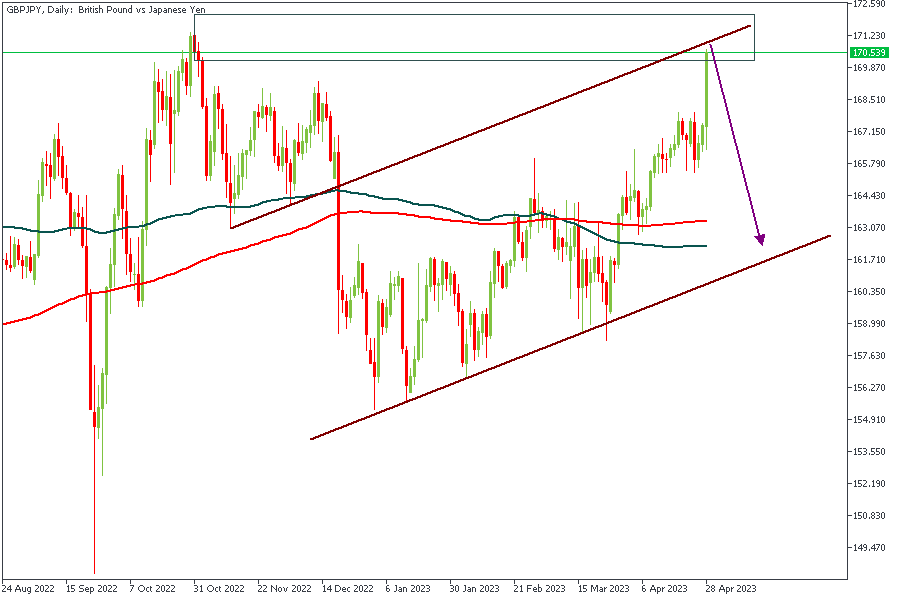
Based on the price action from the charts, one could almost call USDJPY and GBPJPY an identical twin. Just like we saw on the USDJPY, the rally-base-drop supply zone is also supported by the resistance trendline of an ascending channel. The only difference, however, is the position of the 200-Day Moving Average. However, the conclusion is that we can expect to see a bearish reaction from the marked supply zone.
Analysts’ Expectations:
- Direction: Bearish
- Target: 164.766
- Invalidation: 172.229
AUDJPY - Daily Timeframe
AUDJPY presents an interesting trading sentiment. Here we see the price steadily approaching the key level at the highlighted supply zone. The best part to note is meeting the two resistance trendlines on top of the supply zone. Remember, the 200-Day moving average is also acting as a resistance at the same region. I bet we will see a good deal of reaction from that zone soon.
Analysts’ Expectations:
- Direction: Bearish
- Target: 89.084
- Invalidation: 92.300

CONCLUSION
The trading of CFDs comes at a risk. Thus, to succeed, you have to manage risks properly. To avoid costly mistakes while you look to trade these opportunities, be sure to do your due diligence and manage your risk appropriately.
USD/JPY: Bulls to Accelerate on Break of Key Barriers, Consolidation Likely to Precede Rally
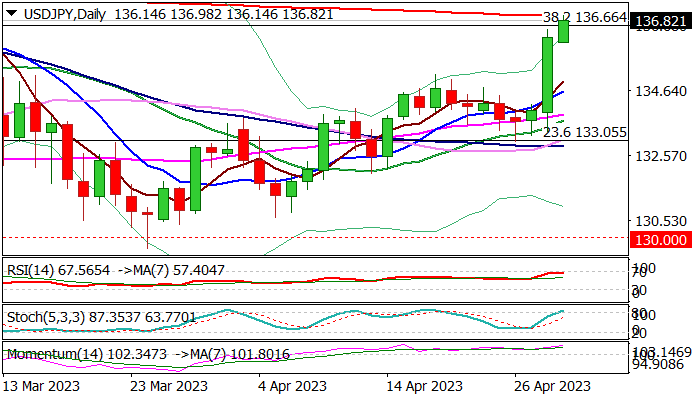
The USDJPY keeps firm bullish tone early Monday and extends gains after Friday’s 1.8% rally (the second biggest daily advance this year).
Japanese yen remains under increased pressure following dovish BOJ on Friday, while the dollar is underpinned by wide expectations for Fed’s 25 basis points hike, in the meeting due later this week.
In addition, the risk sentiment was weighed by the news about troubled US First Republic Bank over the weekend, adding to dollar’s bullish stance, in the Labor Day holiday thinned volumes.
Bulls broke through pivotal Fibo barrier at 136.66 (38.2% retracement of 151.94/127.22) and cracked 200DMA (136.98) but may face increased headwinds on overbought daily studies and likely magnetic Wednesday’s twist of daily Ichimoku cloud (132.75).
Shallow consolidation should ideally hold above broken Fibo barrier at 135.95 (76.4% of 137.90/129.65) to offer better burying opportunities for acceleration through 200DMA, towards key short-term resistance at 137.90 (Mar 8 lower top).
Res: 136.98; 137.90; 138.17; 139.58.
Sup: 136.14; 135.90; 135.10; 133.95.
EUR/USD: Shallow Correction to Keep Bulls Intact
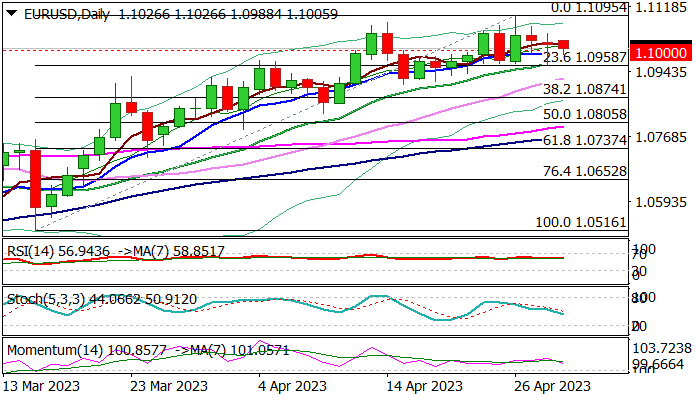
The Euro remains at the back foot at the start of the week and probing through psychological 1.10 support, pressured by firmer dollar and risk aversion.
However, fresh dips were so far limited, as Friday’s spike to pivotal support at 1.0960 zone (Fibo 23.6% of 1.0516/1.1095 / 20DMA) was short-lived and the action closed above 1.10 level, reinforced by 10DMA, leaving long-tailed daily candle, which suggests that the downside is well protected for now.
Renewed attempts lower need to stay above 1.0960 support zone to keep bullish bias, as the pair is in a larger uptrend which looks for limited dips before bulls resume.
Markets await Fed and ECB’s policy meetings this week, with the Fed likely to hike once more by 25 basis points before halting its policy tightening cycle for the rest of the year.
On the other hand, the ECB is widely expected to deliver 25 basis points hike, but the central bank could surprise by 50 basis points raise, as inflation in the Eurozone remains elevated and the ECB remains ready for more rate hike, depending on economic data.
This may offer further support to the single currency, which hit its new yearly high (1.1095) and may extend rally towards targets at 1.1195 (200WMA) and 1.1223 (Fibo 61.8% of 1.2266/0.9535).
Res: 1.1044; 1.1075; 1.1095; 1.1195.
Sup: 1.0960; 1.0909; 1.0874; 1.0831.
Canadian Dollar Edges Lower ahead of US, Canadian Mfg. PMIs
- Canada’s GDP rose 0.1% in March
- US, Canada to release Manufacturing PMIs
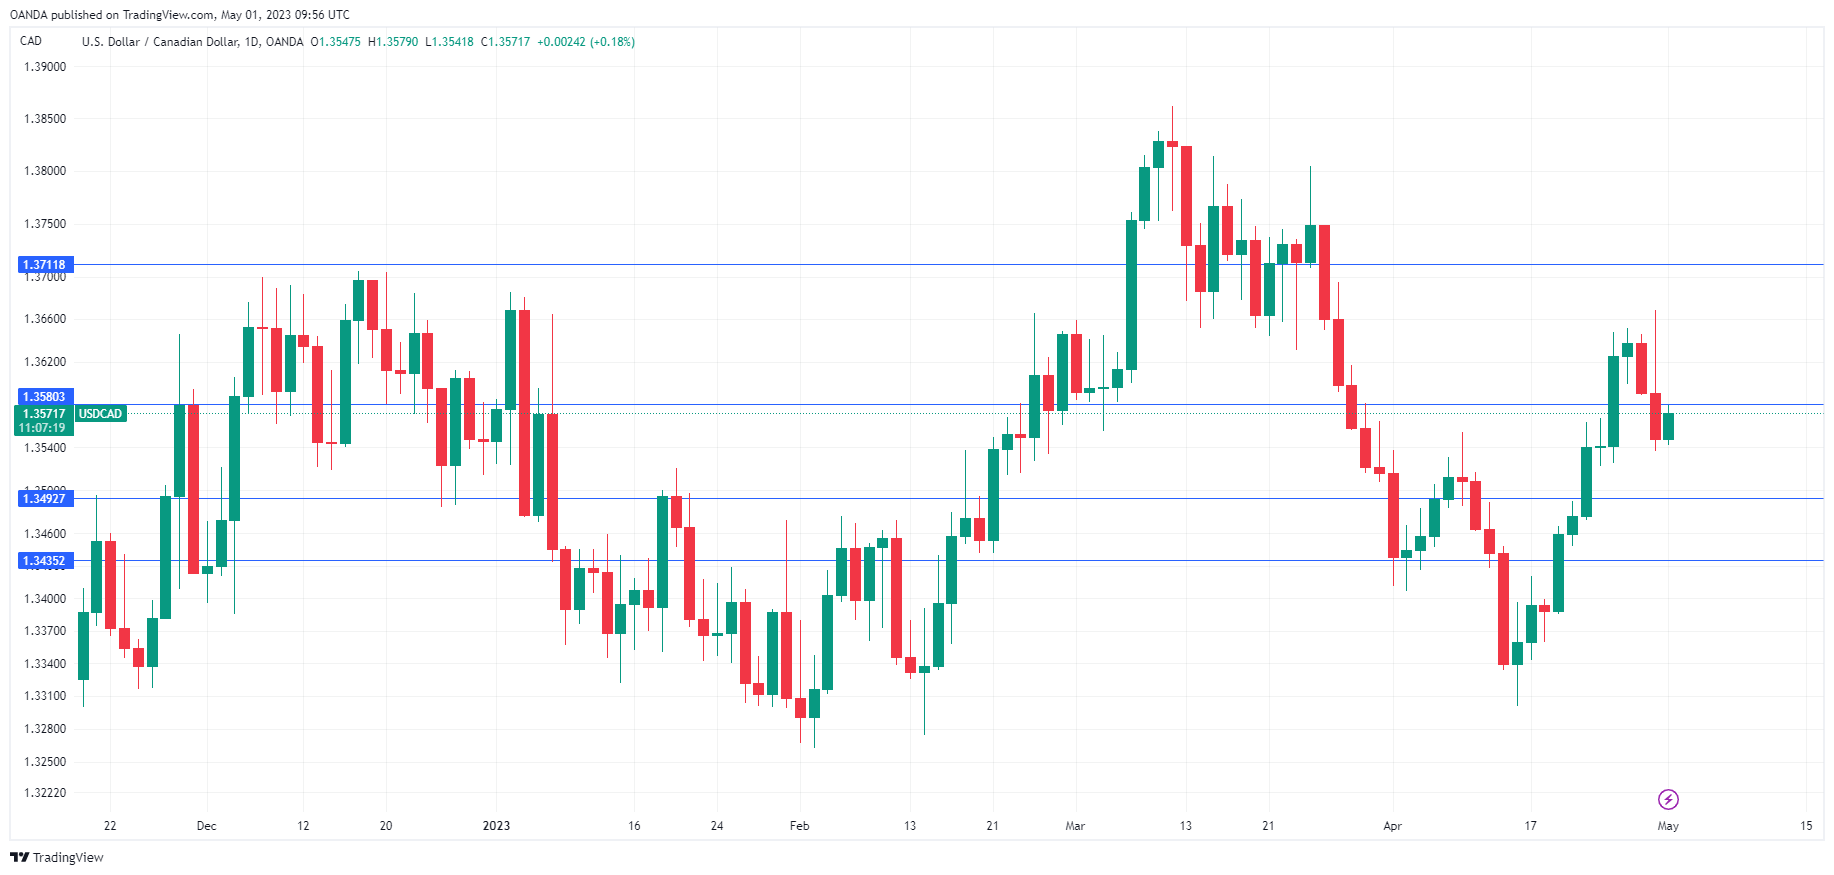
After a 2 day mini-rally, the Canadian dollar is lower on Monday. In the European session, USD/CAD is trading at 1.3569, up 0.20%.
Canada’s GDP ekes out 0.1% gain
Canada’s GDP came in at a paltry 0.1% in February, missing the 0.2% estimate and weaker than the upwardly revised 0.6% in January, according to Statistics Canada. The preliminary estimate for March is -0.1%, which points to the strong start in January quickly fizzling. On an annualized basis, growth is projected at a respectable 2.5%.
The weak growth shows that the economy is feeling the effect of the Bank of Canada’s rate tightening, with the benchmark cash rate at 4.5%, its highest level since 2007. The BoC could deliver further rate hikes until the slowdown in growth translates into lower core inflation, which fell from 4.9% to 4.5% in March but is still more than double the 2% target. At the April rate meeting, in which the BoC paused on rates, Governor Macklem signalled that there would be no rate cuts until 2024.
The Canadian economy is clearly slowing down, raising expectations that the labour market, which has been surprisingly resilient, will also cool off. The unemployment rate has remained around 5%, despite the BoC’s aggressive tightening. Employment levels lag several months behind growth, and the BoC is hoping that the labour market will weaken and help push inflation levels lower.
The week kicks off with Manufacturing PMIs on both sides of the border. The manufacturing sector continues to struggle across the globe, and Canada and the US are no exception. Canada’s PMI is expected to rise in April from 48.6 to 50.5, which would point to stagnation. In the US, manufacturing has declined for five straight months, with readings below the 50.0 level. The estimate for April stands at 46.6, following 46.3 in March.
USD/CAD Technical
- 1.3492 and 1.3435 are providing support
- 1.3580 is under pressure in resistance. Above, there is resistance at 1.3711