Sample Category Title
Will Australia’s “Rampant Inflation” Prevail in May?
Greetings, fellow forex traders! Exciting news for those with an eye on the Australian market - the upcoming interest rate decision could be good news for Aussies looking to refinance or take out new loans. The Mortgage and Finance Association Australia CEO, Anja Pannek, has suggested that these individuals will be the ones to benefit the most from the decision. Moreover, the market is currently seeing record levels of competition, which is great news for consumers, as banks are vying to win over as many customers as possible. With 880,000 borrowers coming off their fixed-rate mortgages this year, the market will be even more competitive than ever. So, if you're a forex trader keeping an eye on the Australian market, here are a few technical analyses to assist.
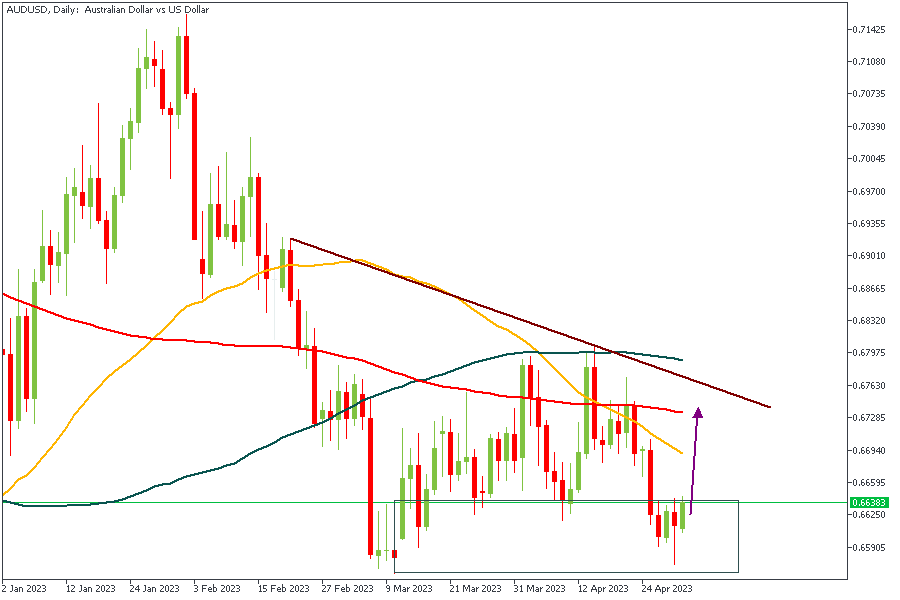
AUDUSD - Daily Timeframe
AUDUSD closed last week with a reversal pin bar candlestick. My major interest, however, is that the reversal candle was formed right inside a drop-base-rally demand zone, thus confirming a bullish intent with the 100-Day moving average as a likely target.
Analysts’ Expectations:
- Direction: Bullish
- Target: 0.67028
- Invalidation: 0.65567
AUDNZD - Daily Timeframe
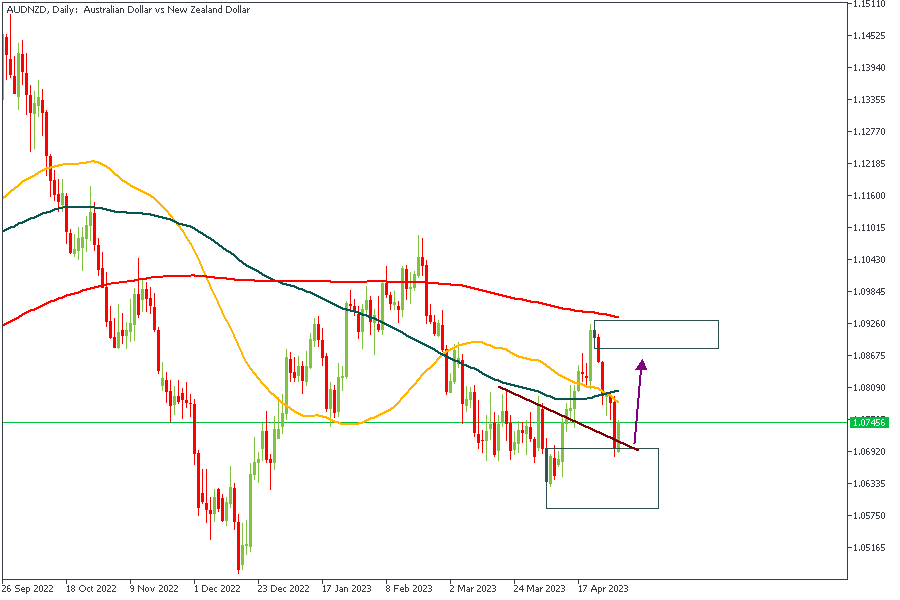
The AUDNZD chart above is clear on one thing; the intent of the current price action is bullish. This can be judged based on the break of the previous high (at the second retest of the trendline), the reaction from the drop-base-rally demand zone, the retest of the trendline, and the 76% of the Fibonacci retracement tool.
Analysts’ Expectations:
- Direction: Bullish
- Target: 1.08727
- Invalidation: 1.06193
AUDJPY - Daily Timeframe
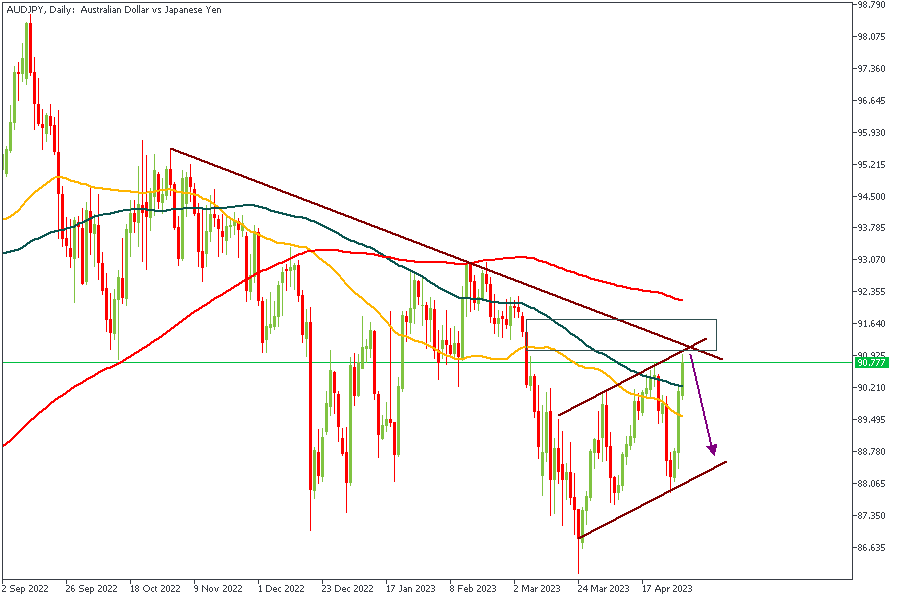
AUDJPY's price action is currently within the range of a drop-base-drop supply zone. This same zone is also a confluence area for the two resistance trendlines. Considering the bearish alignment of the moving averages, the bearish sentiment is the most logical conclusion based on the observed data we've already discussed.
Analysts’ Expectations:
- Direction: Bearish
- Target: 89.084
- Invalidation: 91.798
CONCLUSION
The trading of CFDs comes at a risk. Thus, to succeed, you have to manage risks properly. To avoid costly mistakes while you look to trade these opportunities, be sure to do your due diligence and manage your risk appropriately.
US: Manufacturing Sector Downturn Continued in April According to ISM
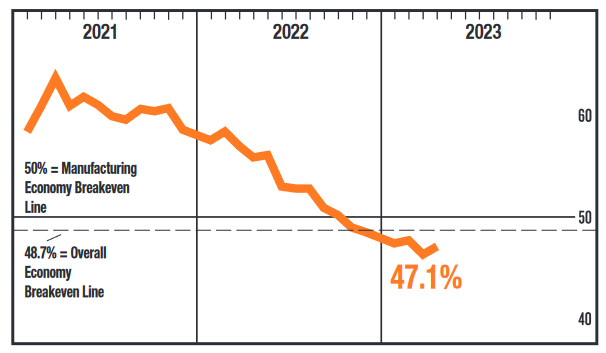
The ISM Manufacturing Index gained a sliver of ground in April, up to 47.1 from 46.3 in March. That is slightly better than market expectations, but marks six months of contractionary readings for the factory sector.
Demand eased again, with new orders contracting, albeit at a slower rate (45.7 in April vs. 44.3 in March). New export orders remained just in contractionary territory at 49.8 percent, customer inventories entered the low end of "too high" – a negative for future production – and the backlog of orders continued to ease (43.1 in April versus 43.9 in March).
Output/consumption measures were in positive territory, with the production index up to 48.9 from 47.8 in March and employment moving back into expansion territory at 50.2 from 46.9 in March.
The input side is described as being accommodative to future growth. Supplier deliveries are speeding up, as evidenced by the sub-index falling to 44.6 from 44.8 in March and inventories fell to 46.3 from 47.5 in March. However, the prices index moved back into expansion territory at 53.2, from 49.2 in March.
Despite the improvement in the headline index, fewer industries are reporting growth. Only five of 18 manufacturing industries reported growth in April. And of the six largest manufacturing industries, only two recorded growth in April – petroleum and coal products and transportation equipment.
Key Implications
While sentiment in the factory sector improved in April, the index remained below the 50-level consistent with expansion. Manufacturing remains in a cyclical slowdown as the impact of higher borrowing costs weighs on activity and demand for goods has downshifted from its pandemic heights.
Demand is likely to remain soft for a while yet, as consumer demand is expected to continue to slow through 2023. Against a backdrop of elevated recession concerns, it is worth remembering that manufacturing is more cyclical than the economy as a whole. It has seen numerous downturns outside of recessions over the past 50 years. Also, the index typically gets to readings in the low 40s during recessions. One silver lining is that the ongoing improvement on supply chains may help relieve the pent-up demand in the automotive sector over the coming year.
Dollar Rises Mildly after ISM, Yen Selloff Continues
Dollar rises against Yen after release of slightly better than expected ISM manufacturing data. But there is no clear pick up in buying against other major currencies. Weakness in Yen remains in the main theme. Overall trading is relatively subdued today, with most markets closed on holiday. But volatility will certain come back with lots of heavy weight events scheduled, including three central bank meetings in RBA, Fed and ECB.
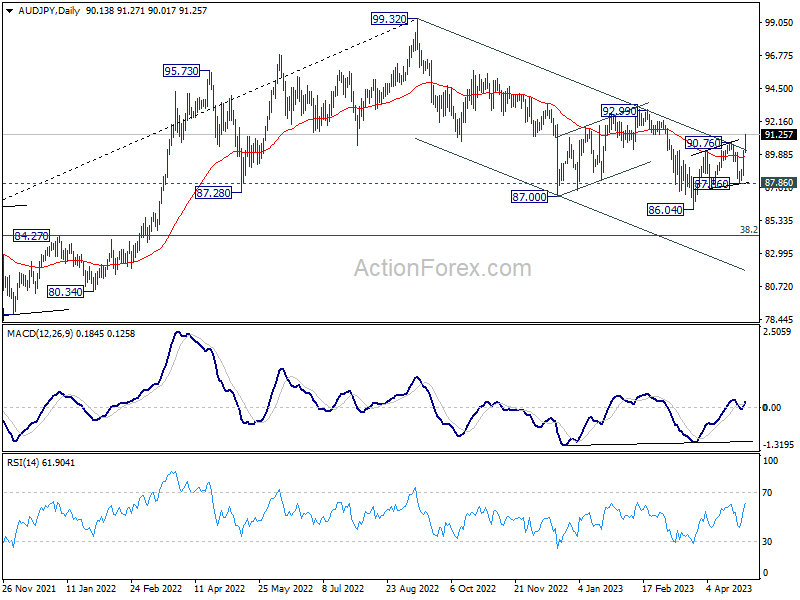
Australian Dollar recovers broadly today as traders await tomorrow's RBA rate decision. Technically, the turnaround in AUD/JPY in the last two days was very impressive. The break of 90.76 resistance, as well as channel resistance, now argues that whole correction from 99.32 has completed with three waves down to 86.04. Further rally is now expected as long as 55 D EMA (now at 89.76) holds. Break of 92.99 structural resistance will be a strong bullish sign. Let's see if RBA could give the cross a hand.
US ISM manufacturing rose to 47.1, sixth month of contraction
US ISM Manufacturing PMI rose from 46.3 to 47.1 in April, above expectation of 46.6. Looking at some details, new orders rose from 44.3 to 45.7. Production rose from 47.8 to 48.9. Employment rose from 46.9 to 50.2. Prices rose from 49.2 to 53.2.
ISM said: "This is the sixth month of contraction and continuation of a downward trend that began in June 2022. Of the five subindexes that directly factor into the Manufacturing PMI, only one (Employment) is in growth territory."
"The past relationship between the Manufacturing PMI and the overall economy indicates that the April reading (47.1 percent) corresponds to a change of minus-0.6 percent in real gross domestic product (GDP) on an annualized basis."
China's manufacturing PMI contracts for first time this year
Released over the weekend, China official PMI Manufacturing fell from 51.9 to 49.2 in April, below expectation of 51.4. The readings was alos back below 50-mark, the first contraction reading this year.
A sub-index to measure new orders dipped to 48.8 from 53.6, indicating decline in market demand and acting as a major contributor to the fall in the headline indicator. New export orders edged down to 47.6 from 50.4, hitting the lowest level in three months.
"A lack of market demand and the high-base effect from the quick manufacturing recovery in the first quarter" were among factors that led to the contraction in April, said senior NBS statistician Zhao Qinghe.
Production in the chemical fibre, ferrous metal mining and processing sectors have slowed due to weak market demand, while special equipment and electrical and mechanical equipment sectors have continued to expand, NBS said in a separate statement.
PMI Services fell from 58.2 to 56.4, below expectation of 57.0, but was still the second highest reading this year.
The composite PMI, which includes manufacturing and non-manufacturing activity, dropped to 54.4 from 57.0.
Japan's PMI manufacturing finalized at 49.5, sector remains in contraction
Japan's PMI Manufacturing for April was finalized at 49.5, marginally above March's 49.2, marking the sixth consecutive month of contraction in the sector. Jibun Bank noted that new order volumes displayed further signs of stabilization, while output charges experienced their strongest rise in five months. Additionally, input delivery times only lengthened slightly.
Usamah Bhatti, an economist at S&P Global Market Intelligence, commented that the Japanese manufacturing sector remained in contraction territory at the start of Q2 2023. However, the rate of deterioration eased to the softest in the current six-month sequence, primarily due to the slowest reduction in new order inflows since July of last year.
Bhatti further observed that firms reported supply chains continued on the path to normalization, with the softest lengthening in delivery times in the current 39-month sequence. Inflationary pressures remained historically high, but manufacturers signaled that input prices rose at the softest pace since August 2021. To protect profit margins, firms increasingly passed higher cost burdens onto customers, resulting in charge inflation accelerating to a five-month high.
RBA, FOMC, ECB, ISM, NFP... and so on...
This week, three major central banks are set to meet, with RBA expected to pause for the second consecutive meeting, leaving cash rate unchanged at 3.60%. But this is far from being a full consensus, with around a third of analysts still anticipating a rate hike. Regardless of the outcome, focus will be on RBA's new economic projections outlined in the Statement on Monetary Policy, which will shape market expectations moving forward.
FOMC is widely anticipated to continue tightening by increasing the federal funds rate by 25bps to 5.00-5.25%. The majority of market participants expect Fed to enter a pause phase following this hike. The key question now centers on when Fed will begin reversing tightening with rate cuts, with speculation pointing to a potential start in November. However, Fed's economic projections and dot plot will not be available until June, leaving some uncertainty.
Opinions are divided on whether ECB will opt for a 25bps or 50bps hike this time, but the primary concern is how long the tightening will continue. Current expectations suggest additional hikes until September, the end of summer. But IMF European Department head Alfred Kammer just threw out an idea durign the weekend that ECB should continue tightening until mid-2024. Ultimately, ECB's next decisions will remain data-dependent, on meeting-by-meeting basis, and be influenced by economic projections to be completed in June.
In addition to central bank decisions, the calendar is packed with crucial data releases, including US non-farm payrolls and ISMs, Eurozone CPI flash, Canada employment, New Zealand employment, Australia retail sales and trade balance, and China Caixin PMIs, etc.
Here are some highlights for the week:
- Tuesday: RBA rate decision, Japan monetary base; Germany retail sales; Swiss SECO consumer climate, PMI manufacturing; Eurozone PMI manufacturing final, M3 money supply, CPI flash; UK PMI manufacturing final; US factory orders.
- Wednesday: New Zealand employment; Australia retail sales; Eurozone unemployment rate; US ADP employment, ISM services, FOMC rate decision.
- Thursday: New Zealand building permit; Australia trade balance; China Caixin PMI manufacturing; Germany trade balance; Eurozone PMI services final, PPI, ECB rate decision; UK PMI services final, M4 money supply, mortgage approvals; Canada trade balance, Ivey PMI; US jobless claims, non-farm productivity, trade balance.
- Friday: China Caixin PMI services; Swiss unemployment rate, CPI, foreign currency reserves; Germany factory orders; France industrial production; UK PMI construction; Eurozone retail sales; Canada employment; US non-farm payrolls.
USD/JPY Daily Outlook
Daily Pivots: (S1) 134.42; (P) 135.49; (R1) 137.38; More...
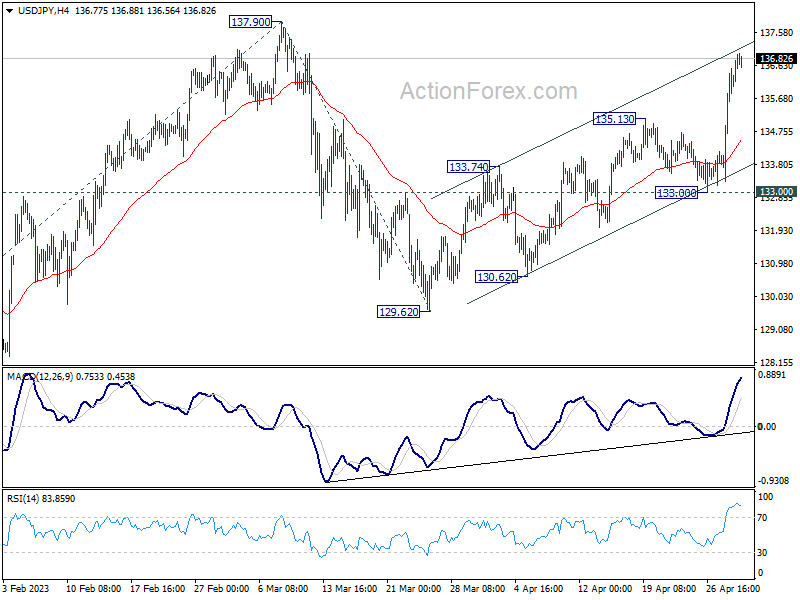
USD/JPY's rally continues today and intraday bias remains on the upside for 137.90 resistance. Break there will resume whole rebound from 127.20, and target 100% projection of 127.20 to 137.90 from 129.62 at 140.32. On the downside, below 135.13 support will turn intraday bias remains neutral first. But further rally will remain in favor as long as 133.00 support holds, in case of retreat.
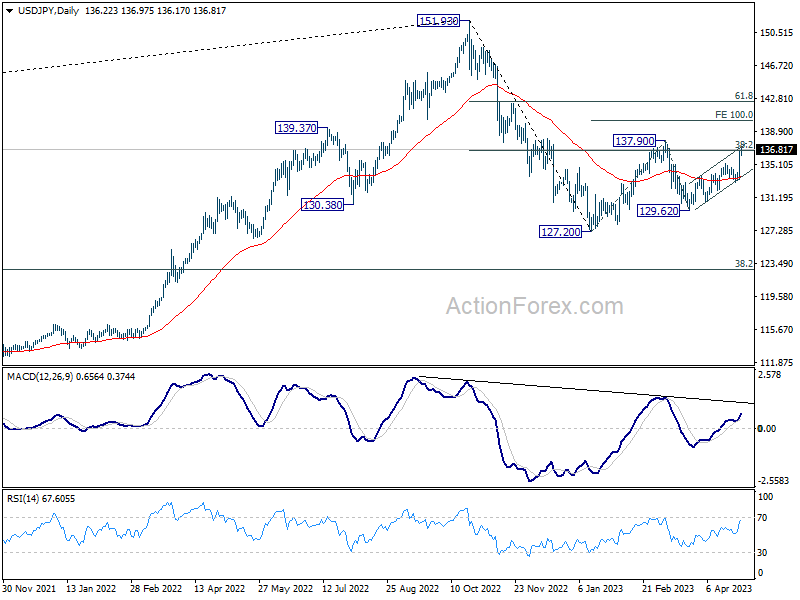
In the bigger picture, price actions from 151.93 high are currently seen as a corrective pattern to the long term up trend. The first leg should have completed at 127.20. Rebound from there is seen as the second leg. Sustained break of 31.8% retracement of 151.93 to 127.20 at 136.34 will bring stronger rebound to 61.8% retracement at 142.48. Meanwhile, break of 129.62 will argue that the third leg is starting through 127.20 low.
Economic Indicators Update
| GMT | Ccy | Events | Actual | Forecast | Previous | Revised |
|---|---|---|---|---|---|---|
| 00:30 | JPY | Manufacturing PMI Apr F | 49.5 | 49.5 | 49.5 | |
| 01:00 | AUD | TD Securities Inflation M/M Apr | 0.20% | 0.30% | ||
| 05:00 | JPY | Consumer Confidence Apr | 35.4 | 35 | 33.9 | |
| 13:30 | CAD | Manufacturing PMI Apr | 50.2 | 50.5 | 48.6 | |
| 13:45 | USD | Manufacturing PMI Apr F | 50.2 | 50.4 | 50.4 | |
| 14:00 | USD | ISM Manufacturing PMI Apr | 47.1 | 46.6 | 46.3 | |
| 14:00 | USD | ISM Manufacturing Prices Paid Apr | 53.2 | 50.4 | 49.2 | |
| 14:00 | USD | ISM Manufacturing Employment Index Apr | 50.2 | 46.9 | ||
| 14:00 | USD | Construction Spending M/M Mar | 0.30% | 0.20% | -0.10% |
US ISM manufacturing rose to 47.1, sixth month of contraction
US ISM Manufacturing PMI rose from 46.3 to 47.1 in April, above expectation of 46.6. Looking at some details, new orders rose from 44.3 to 45.7. Production rose from 47.8 to 48.9. Employment rose from 46.9 to 50.2. Prices rose from 49.2 to 53.2.
ISM said: "This is the sixth month of contraction and continuation of a downward trend that began in June 2022. Of the five subindexes that directly factor into the Manufacturing PMI, only one (Employment) is in growth territory."
"The past relationship between the Manufacturing PMI and the overall economy indicates that the April reading (47.1 percent) corresponds to a change of minus-0.6 percent in real gross domestic product (GDP) on an annualized basis."
A Sharp Slowdown in China
China’s PMIs released over the weekend were much weaker than expected, with the manufacturing index signalling a downturn.
The official manufacturing PMI fell to 49.2 in April from 51.9 the previous month and 51.4 expected. This sudden drop suggests that the economy has lost momentum much more quickly than analysts had expected, following a brief boom at the end of last year as the zero-coupon policy was rolled back. The publication’s commentary suggests a contraction in manufacturing demand after several months of rapid growth.
Historically, last month’s levels are nothing to write home about. This sets the mood that Chinese manufacturing activity is close to stagnating or even deteriorating, with a downtrend from 2018 despite a very bumpy road due to COVID-19.
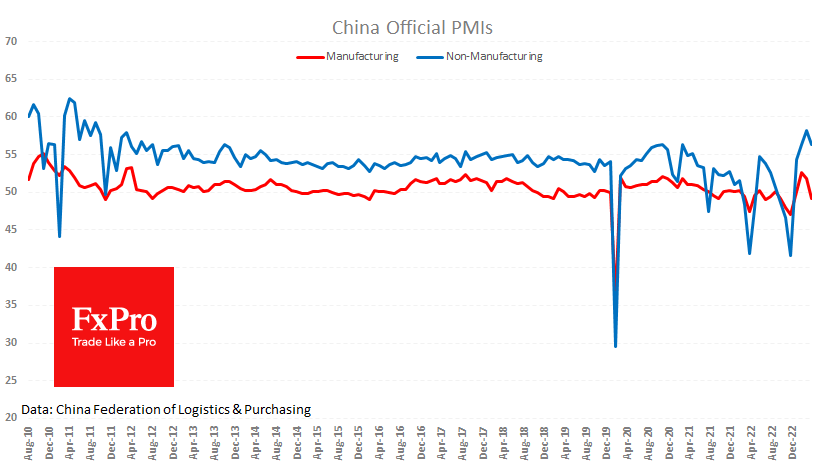
The non-manufacturing sector feels much better, losing 1.8 percentage points over the month to 56.4. The long history clearly shows that the growth rate of the non-manufacturing sector has long been a drag on the economy.
Traditionally, market participants pay more attention to production dynamics as it sheds light on global trends and allows for assessing export and import potential, affecting the renminbi exchange rate. Moreover, production often acts as a leading indicator of economic trends.
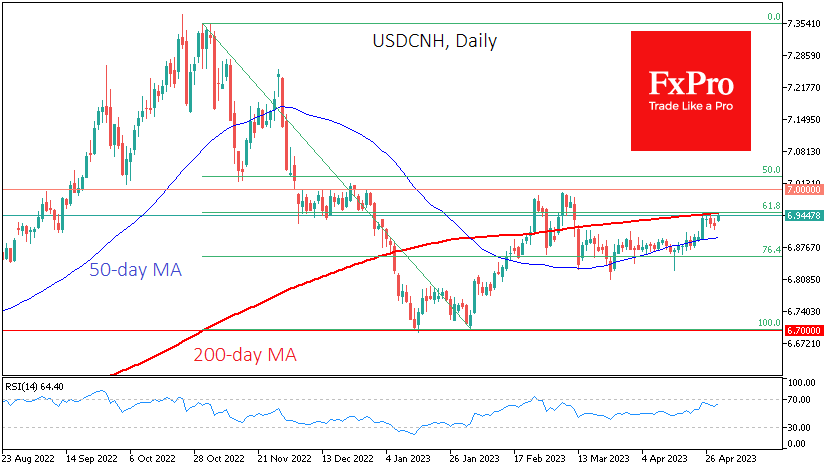
In this context, it is unsurprising that the renminbi fell, and the USDCNH rose on Monday. Last week it broke above its 200-day MA at 6.95 but did not dare to break through. At the same time, the pullback level to 61.8% of the November and February declines is also in this area.
A decisive break of this long-term trend indicator is likely to be postponed by the outcome of the Fed meeting. A move lower in the USDCNH could be the prologue to a move lower to 6.30 in the coming months. A sharp move higher would reclassify the pair’s rise in recent weeks from a correction to a new advance and could lead to a significant increase in the pair’s volatility.
USD/JPY Extends Gains Post-BoJ Meeting
- Bank of Japan meeting weighing on yen
- JP Morgan buys First Republic assets
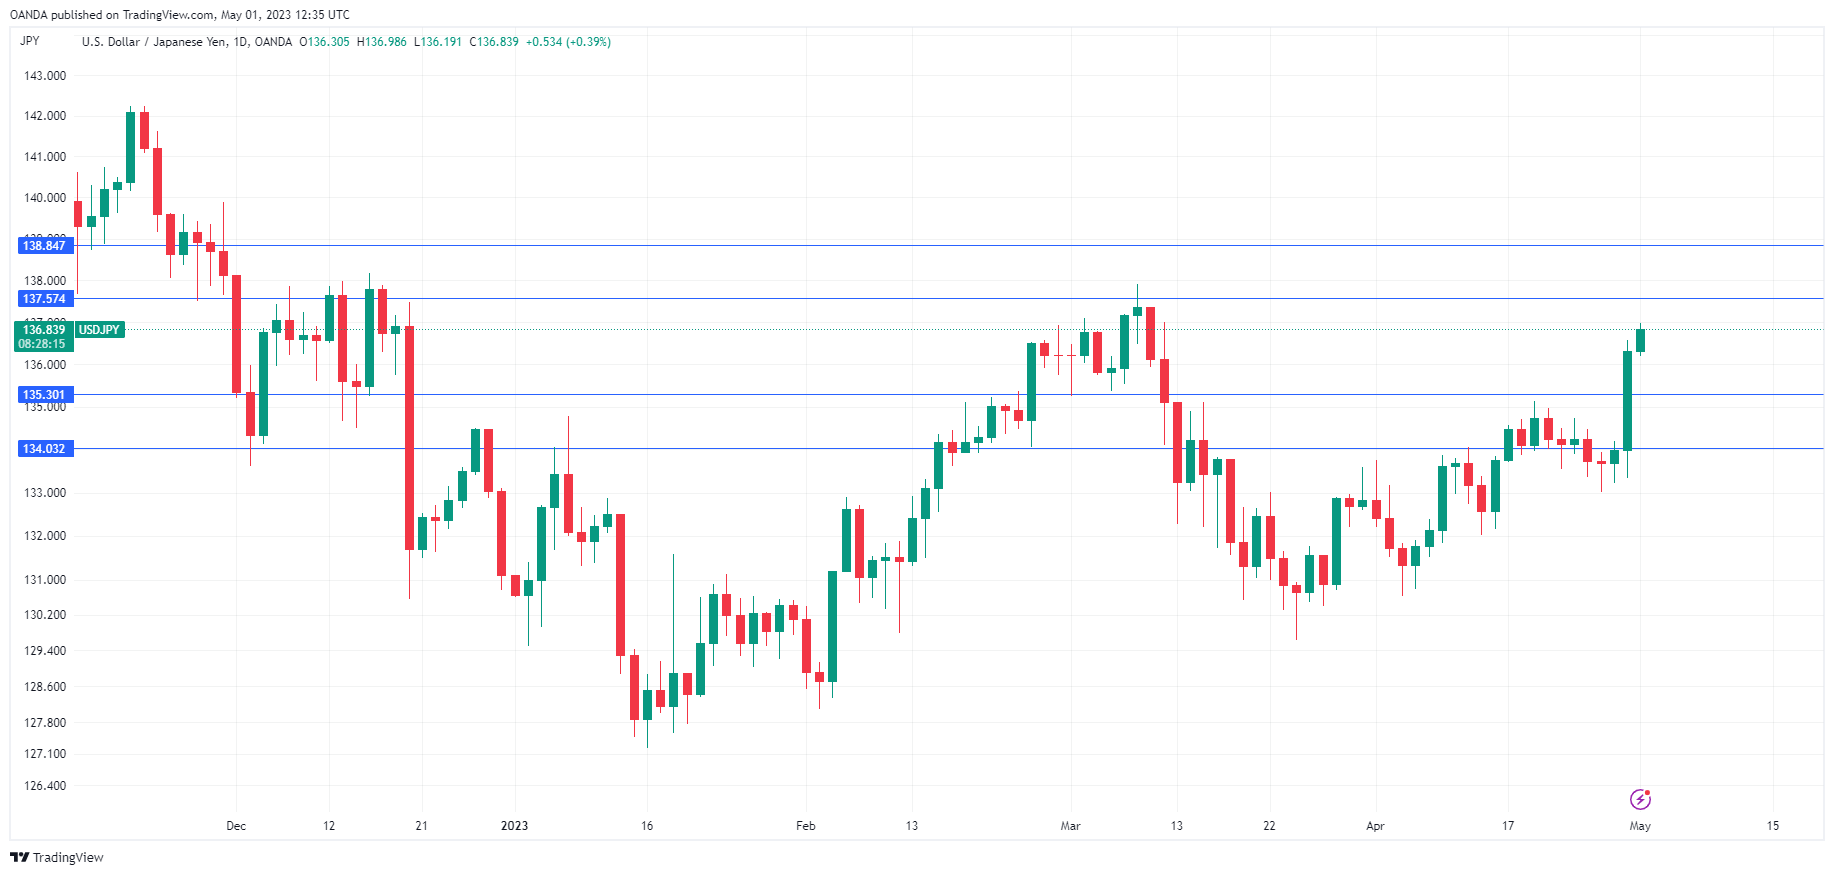
USD/JPY continues to rally and is trading at 136.84, up 0.40%.
BoJ signals change is coming
The Bank of Japan didn’t change any policy settings at Friday’s meeting, which was the first to be chaired by New Governor Kazuo Ueda. The yen took a tumble of 1.3% and the downward spiral has continued on Monday, with USD/JPY rising as high as 136.98. Investors may have been disappointed that the Ueda didn’t make any changes, but on closer examination, the BoJ provided some hints that change is coming which could explain the yen’s sharp fall.
The key signal was the removal of its forward guidance pledge to maintain rates at “current or lower levels”. Ueda stated last week that interest rates could rise if wages and inflation moved higher and at the meeting he announced a policy review. This shows that Ueda is open to change, although the review will take between a year and 18 months. The new Governor didn’t do anything dramatic, but he showed flexibility to making changes if warranted by economic conditions. Similar to the case with the ECB and the Fed, forward guidance has been ditched in favor of policy decisions at each meeting, based on the data.
In the US, First Republic Bank is again in the headlines. After US regulators seized the ailing bank, they announced that JP Morgan had acquired all of First Republic’s deposits. An attempt to convince large US banks to throw First Republic a second lifeline failed, making it the third US bank to collapse since March. Interestingly, JP Morgan CEO said just one month ago that the current banking crisis would have repercussions for “years to come”.
USD/JPY Technical
- USD/JPY faces resistance at 137.57 and 138.84
- 135.30 and 134.03 are providing support
EUR/USD Daily Outlook
Daily Pivots: (S1) 1.0972; (P) 1.1009; (R1) 1.1054; More...
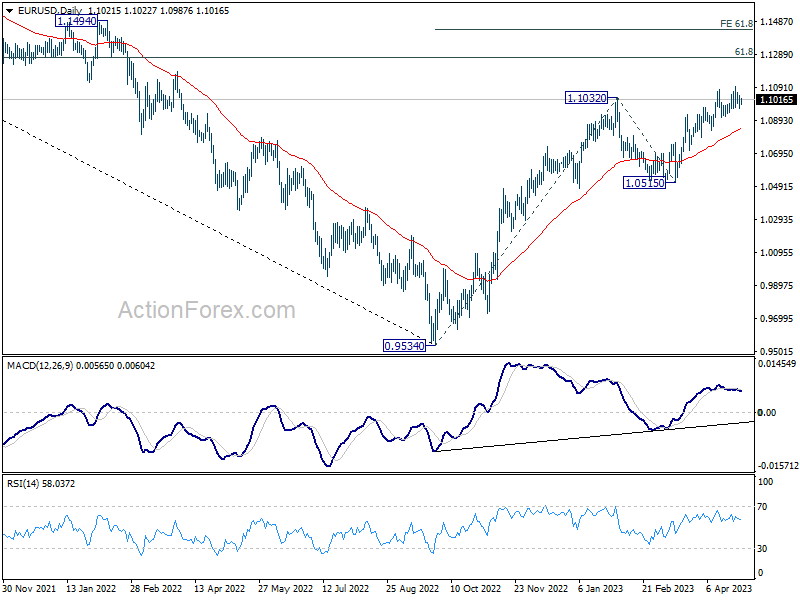
EUR/USD is extending the sideway consolidation from 1.1094 and intraday bias remains neutral. Further rally is expected as long as 1.0908 support holds. Break of 1.1094 will resume larger up trend to 1.1273 fibonacci level. Break there will target 61.8% projection of 0.9534 to 1.1032 from 1.0515 at 1.1441 However, considering bearish divergence condition in 4H MACD, break of 1.0908 support will indicate short term topping and turn bias back to the downside.
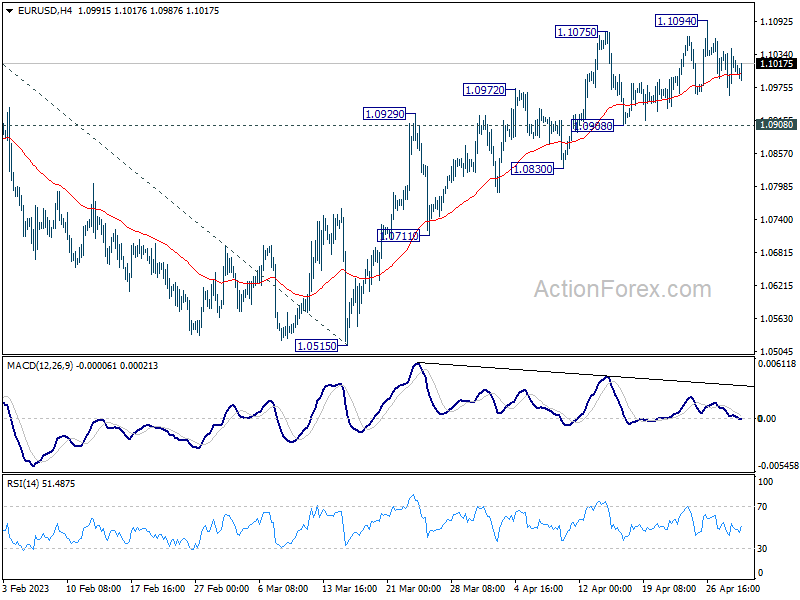
In the bigger picture, rise from 0.9534 (2022 low) is in progress for 61.8% retracement of 1.2348 (2021 high) to 0.9534 at 1.1273. Sustained break there will solidify the case of bullish trend reversal and target 1.2348 resistance next (2021 high). This will now remain the favored case as long as 1.0515 support holds, even in case of deeper pull back.
USD/JPY Daily Outlook
Daily Pivots: (S1) 134.42; (P) 135.49; (R1) 137.38; More...
USD/JPY's rally continues today and intraday bias remains on the upside for 137.90 resistance. Break there will resume whole rebound from 127.20, and target 100% projection of 127.20 to 137.90 from 129.62 at 140.32. On the downside, below 135.13 support will turn intraday bias remains neutral first. But further rally will remain in favor as long as 133.00 support holds, in case of retreat.
In the bigger picture, price actions from 151.93 high are currently seen as a corrective pattern to the long term up trend. The first leg should have completed at 127.20. Rebound from there is seen as the second leg. Sustained break of 31.8% retracement of 151.93 to 127.20 at 136.34 will bring stronger rebound to 61.8% retracement at 142.48. Meanwhile, break of 129.62 will argue that the third leg is starting through 127.20 low.
GBP/USD Daily Outlook
Daily Pivots: (S1) 1.2481; (P) 1.2533; (R1) 1.2618; More...
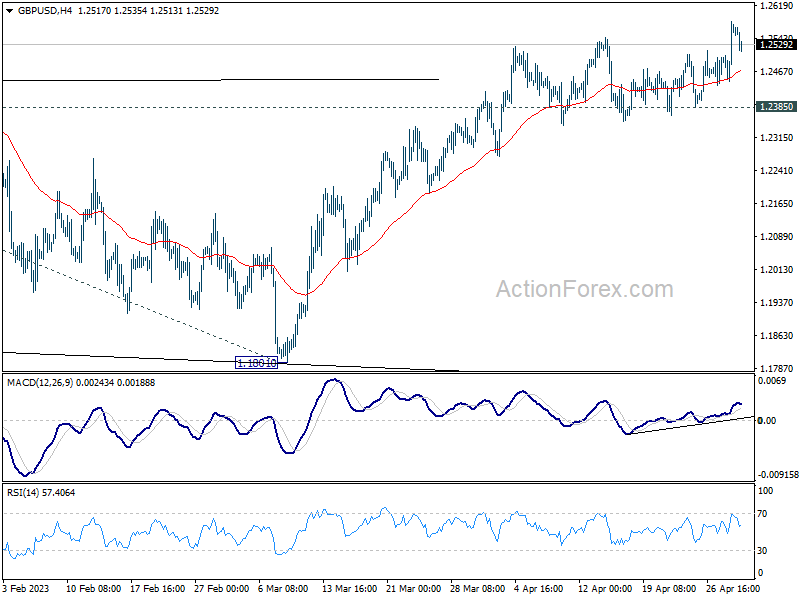
Intraday bias in GBP/USD remains on the upside despite today's retreat. Current up trend should target 1.2759 fibonacci level first. Firm break there will target 61.8% projection of 1.0351 to 1.2445 from 1.1801 at 1.3095. For now, outlook will remain bullish as long as 1.2385 support holds, in case of retreat.
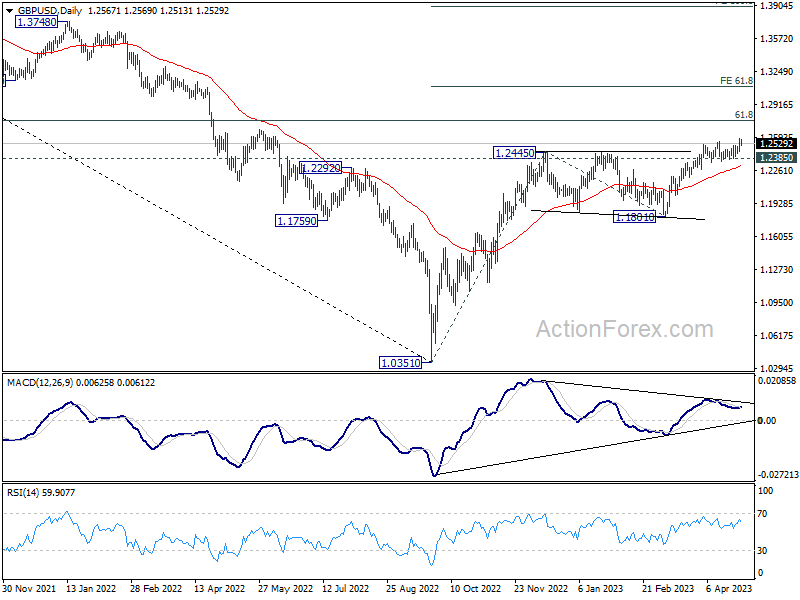
In the bigger picture, the rise from 1.0351 medium term term bottom (2022 low) is in progress for 61.8% retracement of 1.4248 (2021 high) to 1.0351 at 1.2759. Sustained break there will add to the case of long term bullish trend reversal. Further break of 61.8% projection of 1.0351 to 1.2445 from 1.1801 at 1.3095 could prompt upside acceleration to 100% projection at 1.3895. For now, this will remain the favored case as long as 1.1801 support holds, even in case of deep pull back.
USD/CHF Daily Outlook
Daily Pivots: (S1) 0.8905; (P) 0.8941; (R1) 0.8978; More...
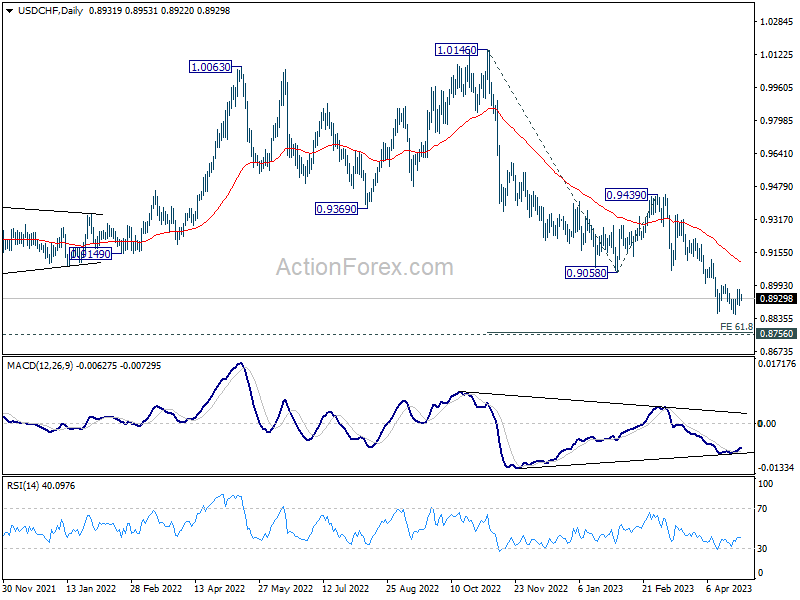
Intraday bias in USD/CHF stays neutral as range trading continues. On the upside, decisive break of 0.9001 resistance should confirm short term bottoming at 0.8850. Intraday bias will be back on the upside 55 D EMA (now at 0.9113). Sustained break there will be a strong sign of bullish reversal. On the downside, break of 0.8850 will resume larger fall from 1.0146, to 61.8% projection of 1.0146 to 0.9058 from 0.9439 at 0.8767, which is close to 0.8756 long term support. Strong support is expected there to bring rebound, at least on first attempt.
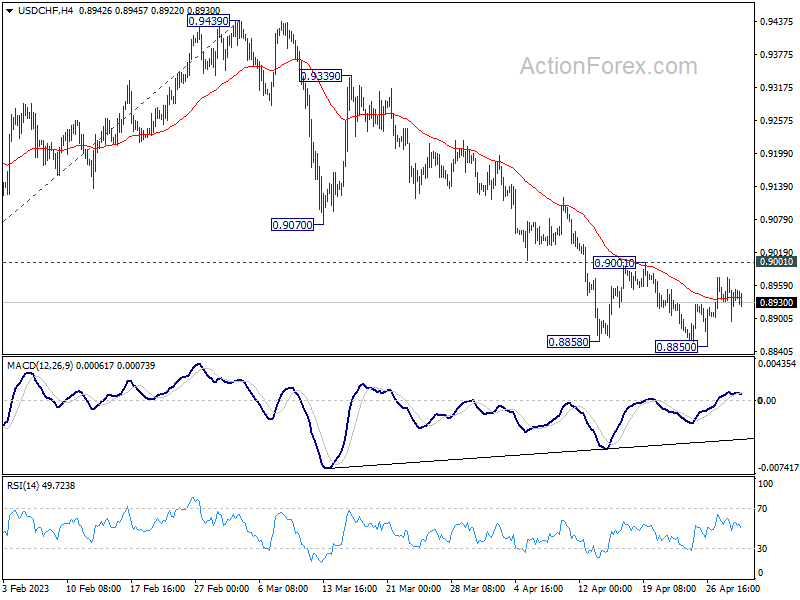
In the bigger picture, fall from 1.1046 (2022 high) is in progress for 0.8756 support (2021 low). But overall, this fall is still seen as a leg in the long term range pattern from 1.0342 (2016 high). So, downside should be contained by 0.8756 to bring reversal. Sustained break of 0.9058 support turned resistance will be the first sign of medium term bottoming. However, decisive break of 0.8756 will carry larger bearish implications.