Sample Category Title
Higher Yields as JPMorgan Picks up First Republic Bank Assets
Market movers today
Today's main data release will be the April flash HICP print for the euro area. Individual country data released last week points to an uptick in headline inflation and lower core inflation, but in any case, underlying price pressures remain too high for the ECB to stop hiking.
Markets will most definitely also pay attention to the euro area Q1 bank lending survey and loan growth data for March, and it will be interesting to see to what extent banking sector turmoil has affected credit conditions. While our base case is for the ECB to hike by 50bp on Thursday, a much steeper than expected tightening in credit conditions could tip the scale in favour of the doves.
We also get Swedish PMIs, see below.
In Denmark, we get the FX reserve figures for April, see below.
The 60 second overview
US debt ceiling: On Monday evening, US Treasury's Yellen warned that the treasury now estimates it will most likely be 'unable to meet' all payment obligations in early June, and potentially as early as June 1 due to the debt ceiling. Shortly following Yellen's statement, The Congressional Budget Office (CBO) noted that is sees 'significantly greater risk' of treasury running out of funds in early June. Previously, the CBO had estimated that the most likely window for the so-called 'x-date' was in July-September, but as we flagged in Research US - X-date looms closer as 'Tax Day' disappoints, 20 April, lower-than-expected tax revenues have increased the risk of an earlier default. We still see an eventual lift to the debt ceiling as a clear base case and expect the Fed to deliver a final 25bp hike tomorrow, but the official statements could further increase the stress in the markets, which has been the most evident in the US 5y CDS rising to the highest level since 2008.
US manufacturing: ISM manufacturing increased and came in better than expected at 47.1. Despite the improvement, April marks the sixth straight month below 50. It also highlights the murky picture we have of the manufacturing sector currently, though, due to the discrepancy to the S&P PMIs, which ticked in above 50 in April.
Banking turmoil: JPMorgan Chase & Co will buy most of First Republic Bank's assets after regulators seized it at the weekend. JPMorgan will pay $10.6 billion to the U.S. Federal Deposit Insurance Corp for most of the assets. The failure is the largest since Washington Mutual in 2008. It gave the market some relief and lifted US treasury yields, as the chance of another Fed hike increases.
Equities: Global equities, or just US markets marginally lower yesterday. Most of Europe closed for May Day, and while the Danish stock market has been growing relative to rest of Europe for the last two decades it is still a relatively small market. Danish stocks broadly higher yesterday with banks leading the gains as investors gain more confidence in the earnings reports from last week. In US a very mixed performance where Energy stood out as the worst performing sector with oil price declining. US performance yesterday, Dow -0.1%, S&P 500 -0.04%, Nasdaq -0.1% and Russell 2000 +0.01%. Asian markets are mostly higher this morning (mainland China still closed). US futures close to unchanged while European futures are higher in the ballpark of 0.2%.
FI: The handling of First Republic Bank and the stronger than anticipated ISM figures out of the US resulted in a sharp rise in US yields yesterday. 10y UST rose 10bp to 3.56% yesterday. European markets were closed. Last night Yellen said that debt-limit measures may be exhausted by 1 June.
FX: Yesterday's FX session was characterised by a rebounding USD returning EUR/USD slightly below the 1.10 mark. The cyclically sensitive currencies like NOK and SEK weakened somewhat while the JPY suffered from a rise in US yields bringing USD/JPY closer to the March peak of 137.9. EUR/GBP remains just south of the 0.88 mark.
Credit: CDS markets were closed on Monday.
Nordic macro
In Sweden we get PMI manufacturing numbers for April (March 45.7) and it will be interesting to see if Sweden follows Germany into even deeper contractionary territory.
We get Danish FX reserve figures for April. Given the weaker DKK, we do not expect the central bank intervened in FX markets in April, just as it did not intervene in the preceding two months.
RBA Board Hikes the Cash Rate by 0.25%
The decision to hike is the better policy option although not consistent with our interpretation of the implied guidance.
The Reserve Bank Board raised the cash rate by a further 0.25% at its May meeting, pushing the cash rate to 3.85%.
The decision came as a significant surprise to markets which had less than five basis points priced in. There have been a number of decisions in this tightening cycle that have been surprising to markets – the decision to hike by 50 basis points in June (instead of 25) and the decision to hike by 25 basis points in October (instead of 50 basis points.)
Markets and the majority of economists, including Westpac, had difficulty in following the Bank’s guidance.
In our bulletin last Friday we noted. “We have argued for the last six months that the peak in the current cycle will be the May Board meeting. Our preference was for that peak to be 3.85%, with a final 25bp hike in May based on the ‘here and now’ – record low unemployment and very high inflation – rather than relying on forecasts. We still believe this would be the better policy approach given the risks, but it appears to be out of line with the Board’s intentions.”
Our assessment of the Board’s intentions relied heavily on the guidance from the Governor’s recent speech pointing out the importance of the Inflation track being consistent with the Bank’s forecasts. The March quarter Inflation Report indicated that inflation was in line, (if not a little better), with that track.
He also emphasised the return to a policy of “to move interest rates multiple times then wait for a while to assess the pulse of the economy and move again if the situation warranted doing so … it is a return to that world.”
However, the Board had some doubts about the risks around the inflation profile. Although the revised staff forecasts have reduced the forecast inflation rate for 2023 from 4.8% to 4½% the Governor issued a strong warning that “services inflation is still very high and broadly based and experience overseas points to upside risks.”
Despite the improvement of inflation for 2023, the RBA left the inflation forecast for mid-2025 unchanged, at 3.0%.
The decision statement in highlighting that inflation is still too high – a point that we have stressed – gave a new prominence to “the importance of returning inflation to target within a reasonable timeframe”.
This clear emphasis on inflation means that the next “live” meeting is likely to be the August Board meeting when the Board will receive an update of the inflation path with the June quarter Inflation Report.
We expect that by August the Federal Reserve will be firmly on hold whereas for today’s meeting the Board will have been aware that the FOMC is almost certain to raise the federal funds rate by 25 basis points.
Our forecast for annual inflation in the June quarter is 6.3% (headline) and 6.1% (trimmed mean).
That should be an acceptable fall in inflation from 7.0% (headline) and 6.6% (trimmed mean).
By August we expect that the economy, particularly highlighted by the household sector, will be deteriorating. We expect that growth in the second half of 2023 will stagnate.
The cash rate is expected to remain on hold in August.
It is noteworthy that the Bank has lowered its forecast for growth in 2023 from 1.6% to 1¼%, most likely reflecting the downside adjustments to household spending that are already underway.
This weak growth environment in the second half of 2023 will be important to avert any further rate increases. A risk here is that the patience which the Governor has shown to only achieve the top of the target band by mid- 2025 might start to be questioned.
But the accumulation of the 375 basis point increase in rates over the past year, with the enhanced lagged increases associated with up to 35% of the total mortgage market moving from fixed to floating, means that even without further rate increases from the RBA overall average mortgage rates will increase substantially (possibly up to 1 ppt).
As expected, the Governor has maintained a tightening bias but has softened it somewhat from: “The Board expects that some further tightening of monetary policy may well be needed to ensure that inflation returns to target” to “Some further tightening of monetary policy may be required to ensure that inflation returns to target in a reasonable time.”
For now, “reasonable time” is accepted as mid -2025 and “target” is accepted as 3%. That may change but because our forecasts have the inflation target being reached at an earlier time (end 2024) due to our more pessimistic outlook for growth and a lower inflation forecast there will be no need to tighten policy or delay rate cuts.
That tightening bias is expected to hold at least until the August Board meeting.
We continue to expect that the first rate cut will come in the March quarter of 2024 with 100 basis points of cuts over the course of 2024.
Conclusion
The decision by the Board to respond to the current environment of full employment and very high inflation is the right policy decision and not relying on “forecast tracks” and previous policies of extended pauses.
However, we were surprised by the decision given the guidance in the lead up to today.
Going forward the weakness in the economy and slowing inflation is likely to eventually see the tightening bias fade; rates remain on hold for the remainder of the year with rate cuts beginning in the March quarter next year.
Technical Outlook and Review
DXY:
The DXY chart is currently showing strong bullish momentum overall, with the potential for a bullish breakthrough of the 1st resistance level and a rise towards the 2nd resistance level.
The 1st support level is at 101.24, which is a multi-swing low support level. This level has been tested multiple times in the past and has held up as a strong support level for the DXY chart.
If the price were to break below the 1st support level, it could potentially drop to the 2nd support level at 100.84. This level is also a multi-swing low support level and coincides with a 78.60% Fibonacci projection, making it a strong support level for the DXY chart.
On the other hand, the 1st resistance level is at 102.21, which is a multi-swing high resistance level. This level has also been tested multiple times in the past and has held up as a strong resistance level for the DXY chart.
If the price were to break above the 1st resistance level, it could potentially rise towards the 2nd resistance level at 102.79. This level is an overlap resistance level and coincides with a 38.20% Fibonacci retracement, making it a strong resistance level for the DXY chart.
It’s worth noting that the DXY chart is currently showing strong bullish momentum overall, with the potential for a bullish breakthrough of the 1st resistance level. Additionally, the price is currently above the Ichimoku cloud, which suggests bullish momentum.
However, it’s also worth noting that the price is below a descending trend line, which suggests possible bearish momentum. As such, it’s important to keep an eye on the chart and monitor any potential breakouts or trend changes.

EUR/USD:
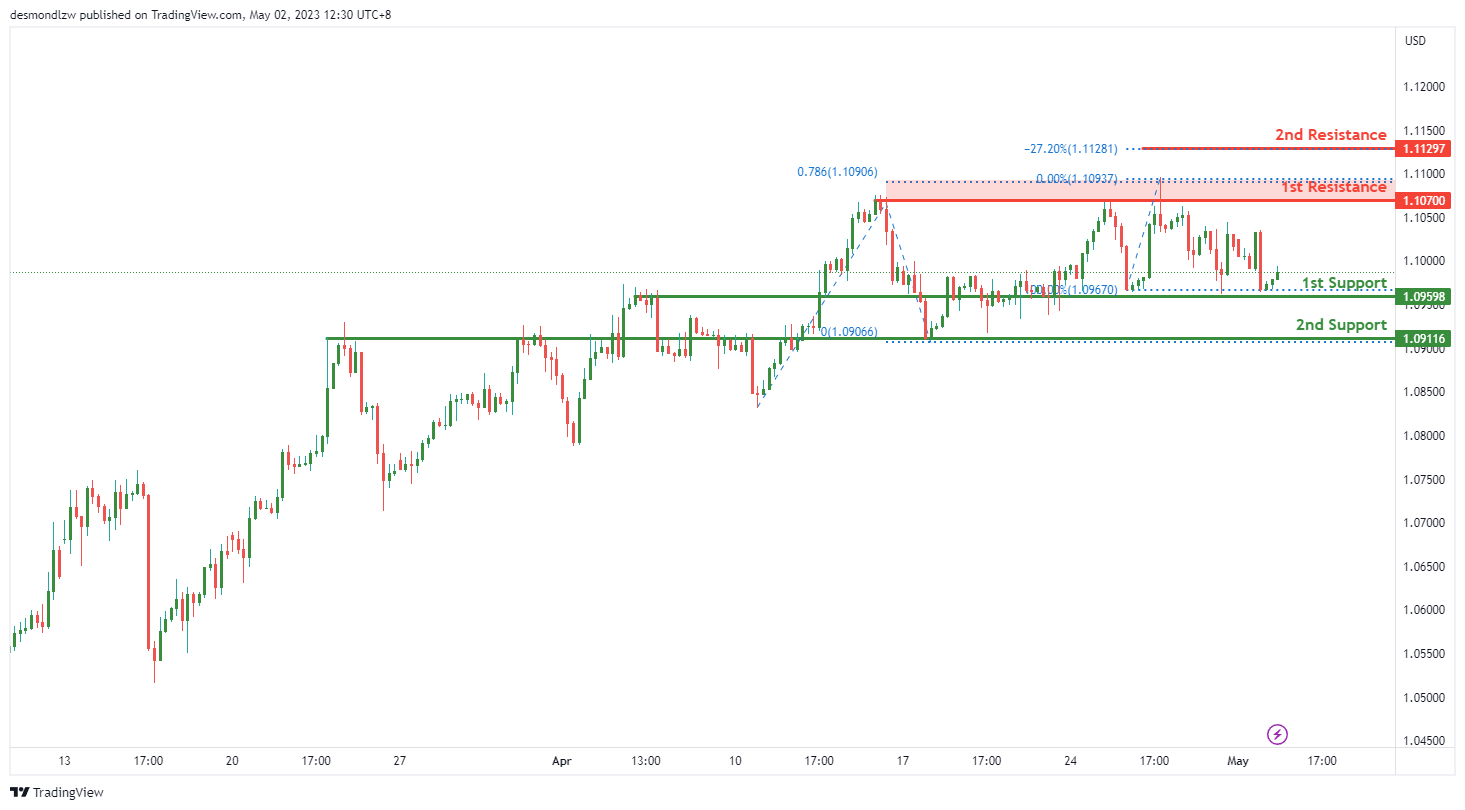
The EUR/USD chart is currently showing strong bullish momentum overall, with the potential for a bullish continuation towards the 1st resistance level.
The 1st support level is at 1.0959, which is an overlap support level. This level has been tested multiple times in the past and has held up as a strong support level for the EUR/USD chart.
If the price were to break below the 1st support level, it could potentially drop to the 2nd support level at 1.0911. This level is also an overlap support level and coincides with a previous swing low, making it a strong support level for the EUR/USD chart.
On the other hand, the 1st resistance level is at 1.1070, which is a multi-swing high resistance level. This level has been tested multiple times in the past and has held up as a strong resistance level for the EUR/USD chart. Additionally, this level coincides with a 78.60% Fibonacci projection, making it an even stronger resistance level.
If the price were to break above the 1st resistance level, it could potentially rise towards the 2nd resistance level at 1.1129. This level is a swing high resistance level and coincides with a -27% Fibonacci expansion, making it a strong resistance level for the EUR/USD chart.
GBP/USD:
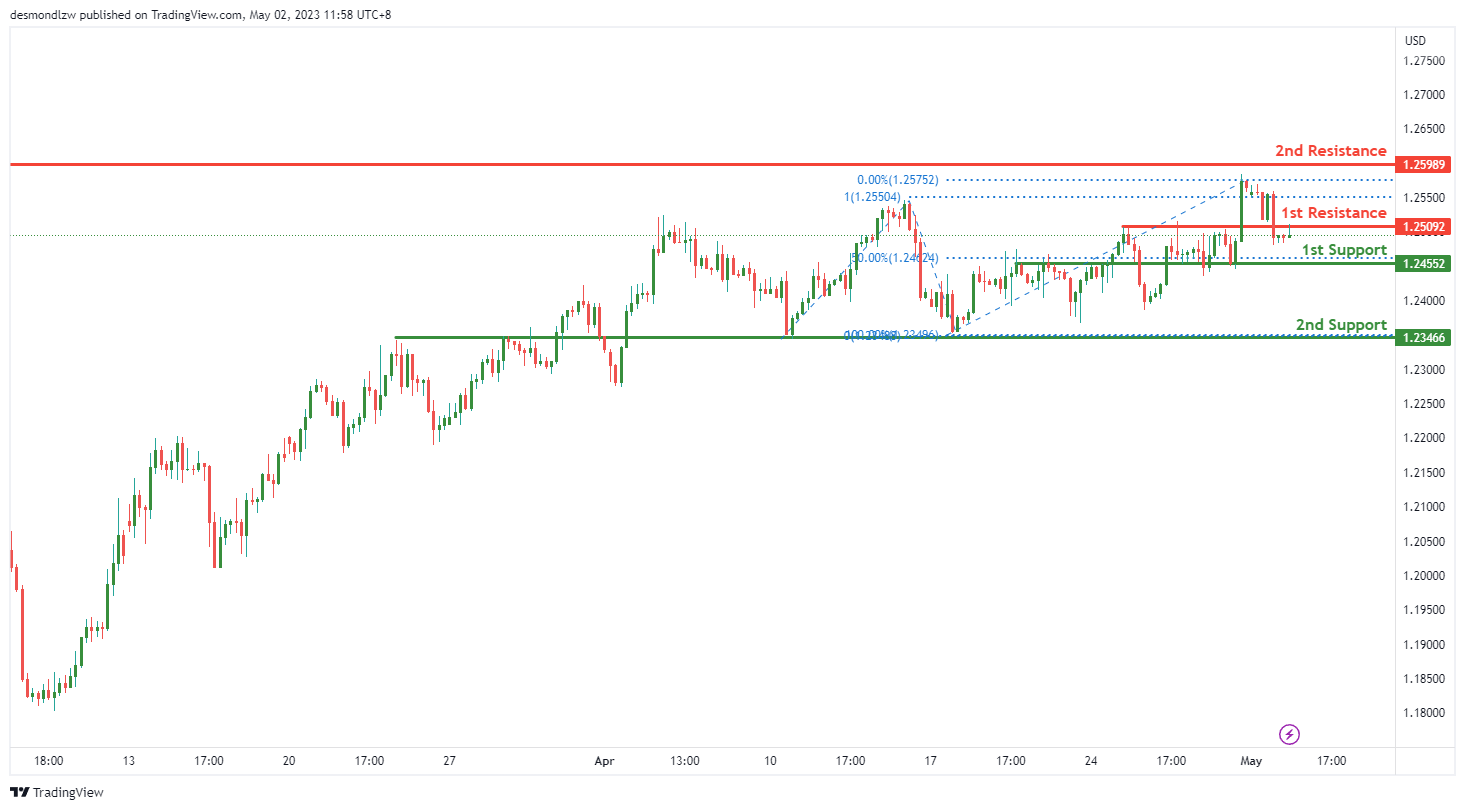
The GBP/USD chart is currently showing strong bullish momentum overall, with the potential for a bullish breakout towards the 2nd resistance level.
The 1st support level is at 1.2455, which is an overlap support level and coincides with a 50% Fibonacci retracement. This level has been tested multiple times in the past and has held up as a strong support level for the GBP/USD chart.
If the price were to break below the 1st support level, it could potentially drop to the 2nd support level at 1.2346. This level is also an overlap support level and has held up as a strong support level in the past.
On the other hand, the 1st resistance level is at 1.2509, which is a pullback resistance level. This level has been tested multiple times in the past and has held up as a strong resistance level for the GBP/USD chart.
If the price were to break above the 1st resistance level, it could potentially rise towards the 2nd resistance level at 1.2598. This level is a swing high resistance level and has held up as a strong resistance level in the past.
USD/CHF:
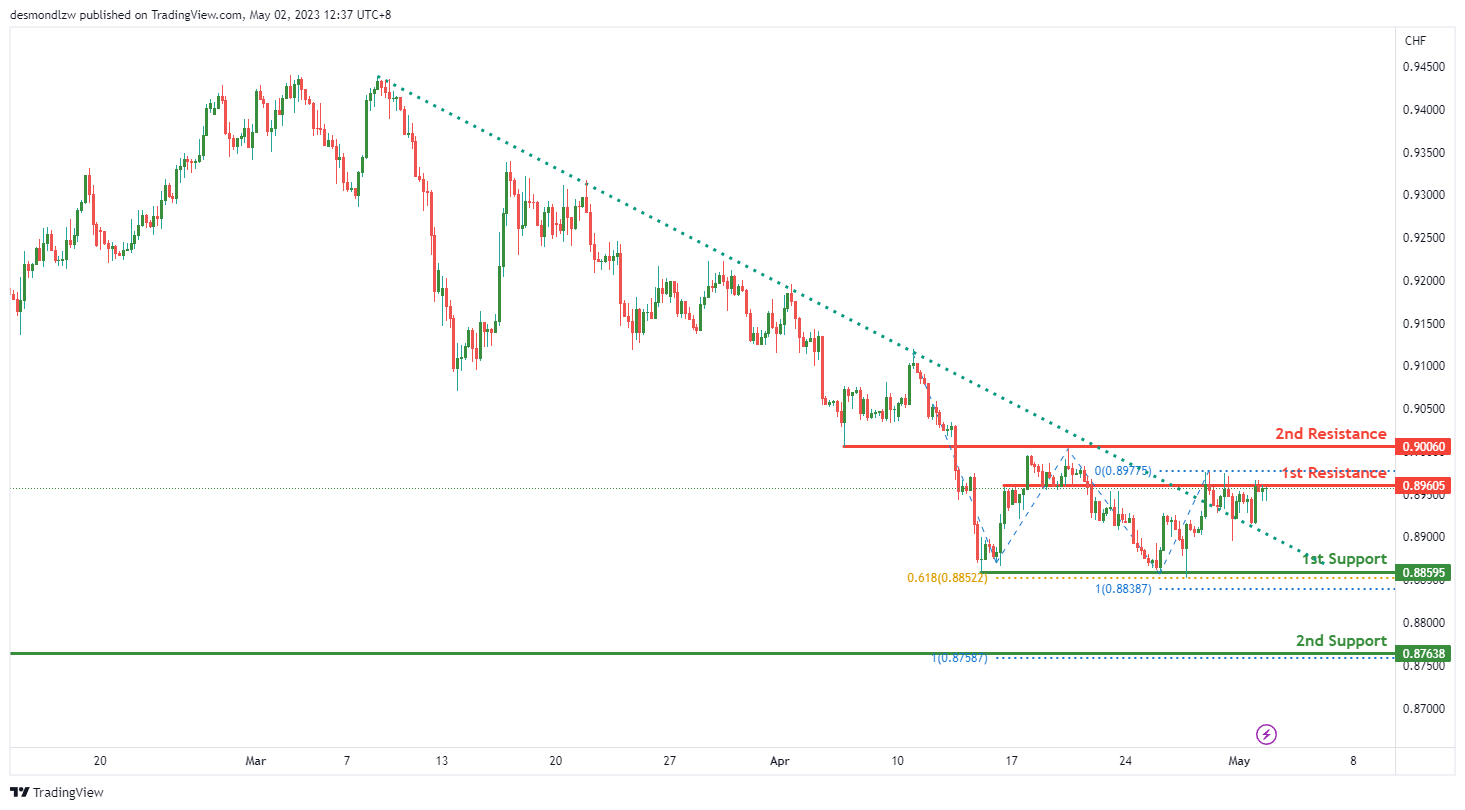
The USD/CHF chart is currently showing strong bullish momentum overall, with several factors contributing to this bullish momentum. Firstly, the price has crossed above the Ichimoku cloud, which is a bullish signal. Additionally, the price broke above a descending resistance line, triggering a potential bullish move.
The 1st support level is at 0.8859, which is a multi-swing low support level and coincides with a 61.80% Fibonacci projection. This level has been tested multiple times in the past and has held up as a strong support level for the USD/CHF chart.
If the price were to break below the 1st support level, it could potentially drop to the 2nd support level at 0.8763. This level is also a swing low support level and has held up as a strong support level in the past.
On the other hand, the 1st resistance level is at 0.8960, which is an overlap resistance level. This level has been tested multiple times in the past and has held up as a strong resistance level for the USD/CHF chart.
If the price were to break above the 1st resistance level, it could potentially rise towards the 2nd resistance level at 0.9006. This level is also an overlap resistance level and has held up as a strong resistance level in the past.
It’s worth noting that the USD/CHF chart is currently showing strong bullish momentum overall, with the potential for a breakout towards the 2nd resistance level.
USD/JPY:
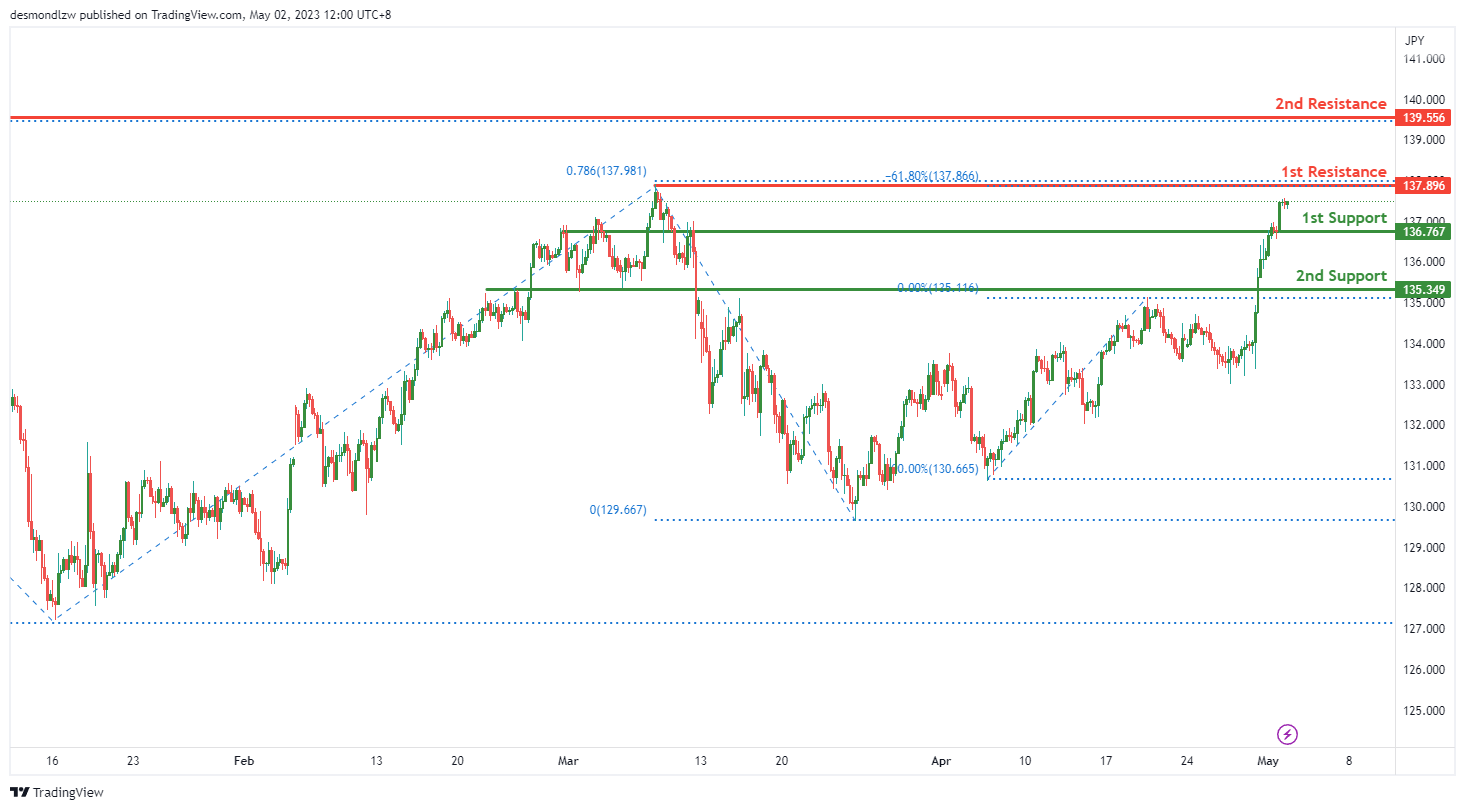
The USD/JPY chart is currently showing bearish momentum overall, with several factors contributing to this bearish momentum. The price could potentially make a bearish reaction off the 1st resistance level and drop to the 1st support level.
The 1st support level is at 136.76, which is a pullback support level. This level has been tested multiple times in the past and has held up as a strong support level for the USD/JPY chart.
If the price were to break below the 1st support level, it could potentially drop to the 2nd support level at 135.34. This level is also a pullback support level and has held up as a strong support level in the past.
On the other hand, the 1st resistance level is at 137.89, which is a swing high resistance level and coincides with a 78.60% Fibonacci projection. This level has been tested multiple times in the past and has held up as a strong resistance level for the USD/JPY chart.
If the price were to break above the 1st resistance level, it could potentially rise towards the 2nd resistance level at 139.55. This level is also a swing high resistance level and has held up as a strong resistance level in the past.
It’s worth noting that the USD/JPY chart is currently showing bearish momentum overall, with the potential for a bearish reaction off the 1st resistance level and a drop to the 1st
AUD/USD:
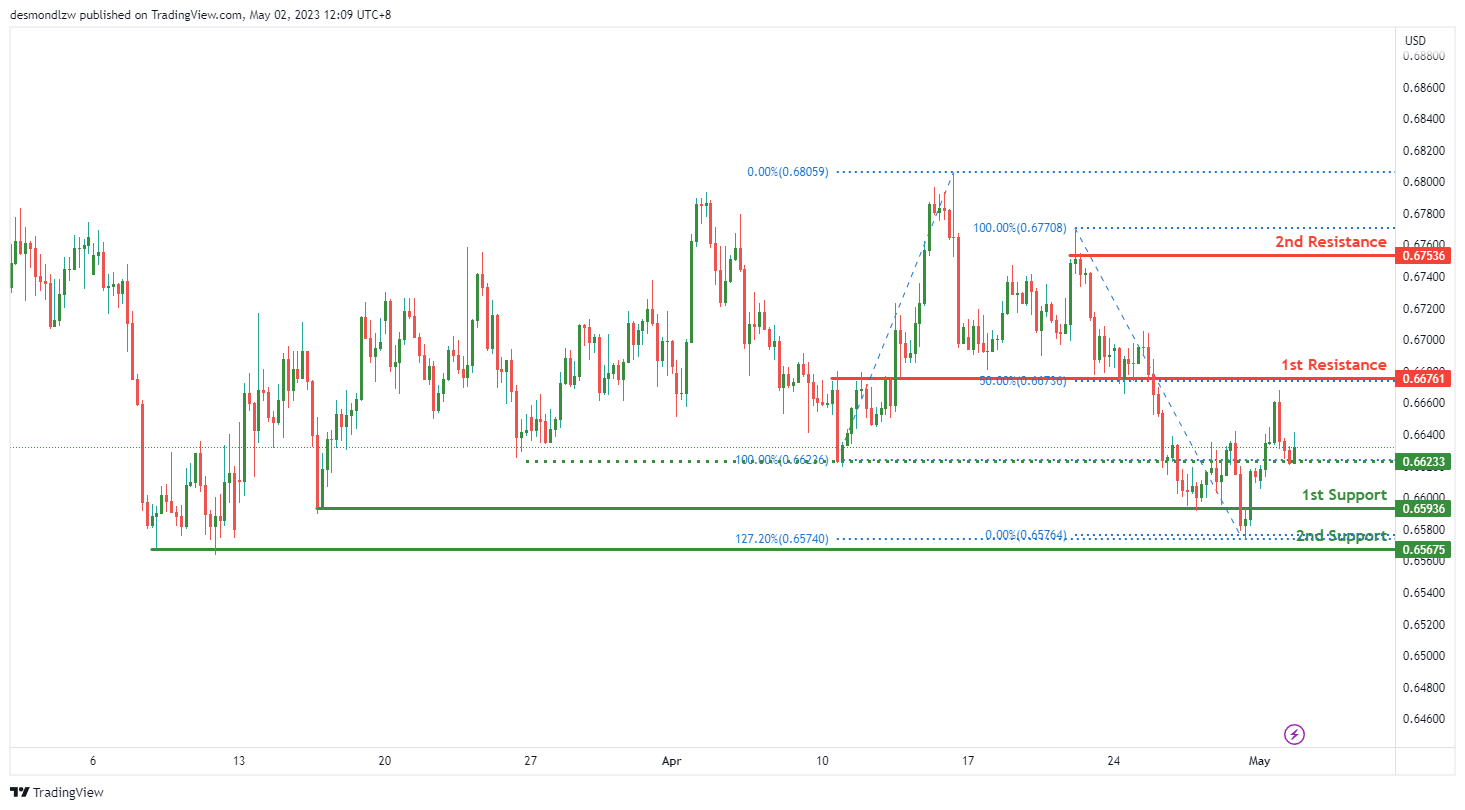
The AUD/USD chart is currently showing bullish momentum overall, with several factors contributing to this bullish momentum. The price could potentially continue its bullish trend towards the 1st resistance level.
The 1st support level is at 0.6593, which is a pullback support level. This level has held up as a strong support level in the past and could potentially provide a support level for the price as it continues its bullish trend.
If the price were to break below the 1st support level, it could potentially drop to the 2nd support level at 0.6567. This level is a multi-swing low support level and coincides with a 127.20% Fibonacci extension.
On the other hand, the 1st resistance level is at 0.6676, which is a pullback resistance level and coincides with a 50% Fibonacci retracement. This level has been tested multiple times in the past and has held up as a strong resistance level for the AUD/USD chart.
If the price were to break above the 1st resistance level, it could potentially rise towards the 2nd resistance level at 0.6753. This level is a swing high resistance level and has held up as a strong resistance level in the past.
It’s worth noting that there is an intermediate support level at 0.6623 between the current price and the 1st support level. If the price were to break below this intermediate support level, it could trigger a bearish acceleration towards the 1st support level.
NZD/USD:
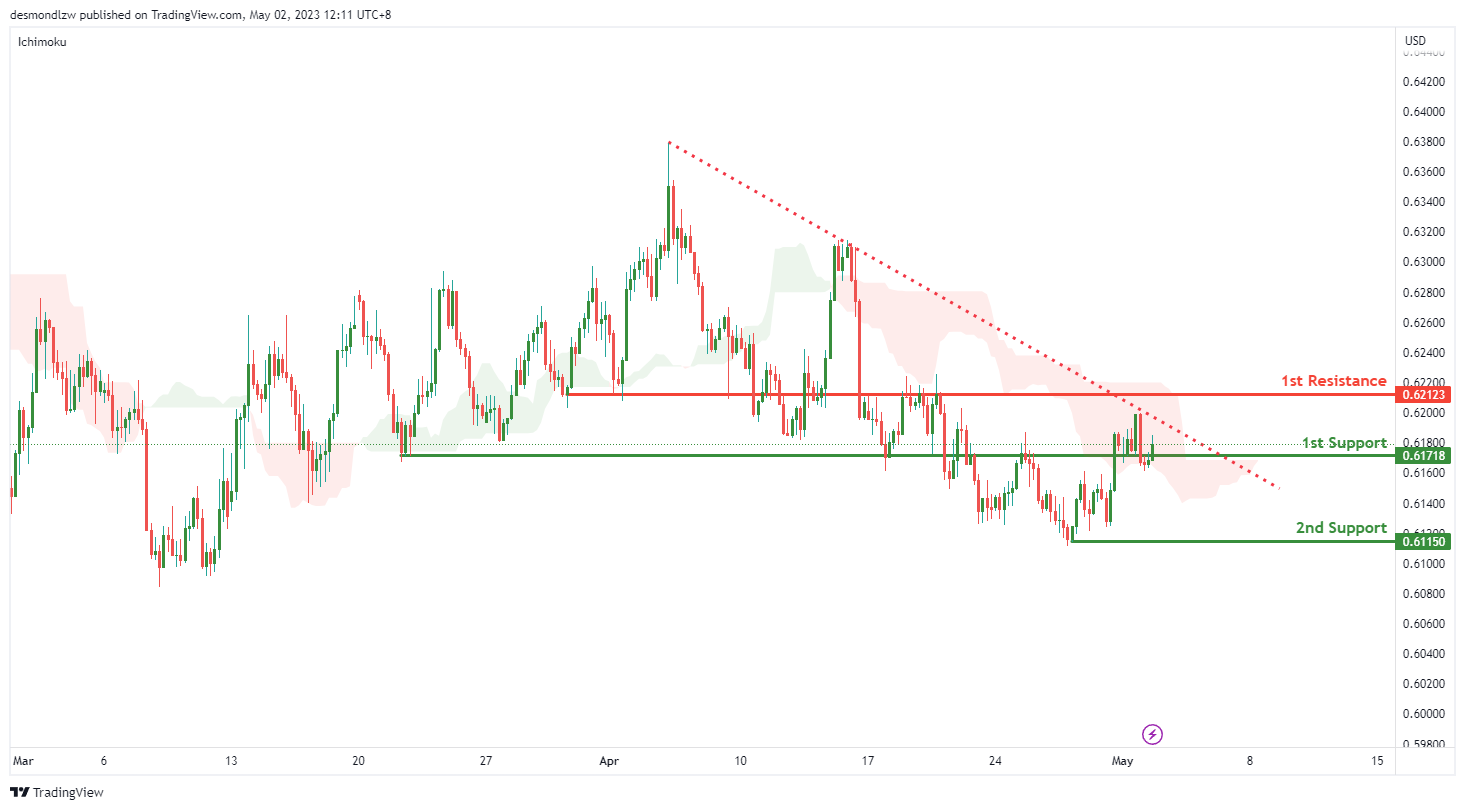
The NZD/USD chart is currently showing bearish momentum overall, with several factors contributing to this bearish momentum. The price could potentially make a bearish reaction off the 1st resistance level and drop to the 1st support level.
The 1st support level is at 0.6171, which is an overlap support level. This level has held up as a strong support level in the past and could potentially provide a support level for the price as it continues its bearish trend.
If the price were to break below the 1st support level, it could potentially drop to the 2nd support level at 0.6115. This level is a swing low support level and has held up as a strong support level in the past.
On the other hand, the 1st resistance level is at 0.6212, which is a pullback resistance level. This level has been tested multiple times in the past and has held up as a strong resistance level for the NZD/USD chart.
If the price were to break above the 1st resistance level, it could potentially rise towards higher resistance levels. However, given the current bearish momentum of the chart, it is more likely that the price will make a bearish reaction off the 1st resistance level and drop towards the 1st support level.
It’s worth noting that the NZD/USD chart is currently within the bearish Ichimoku cloud and below a major descending trend line. These factors contribute to the overall bearish momentum of the chart.
USD/CAD:
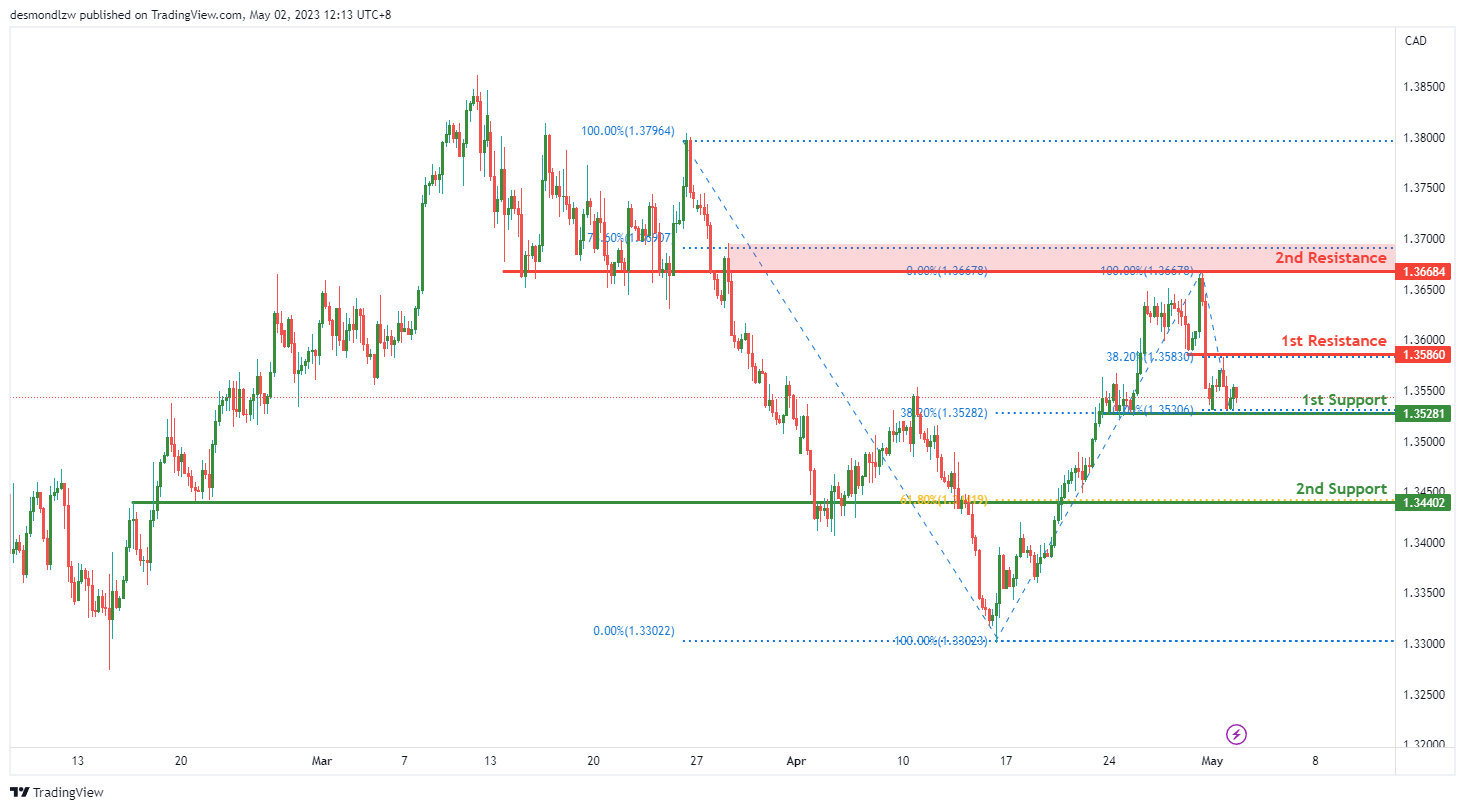
USD/CAD’s overall momentum is bullish as it shows potential for a bullish bounce off the 1st support and head towards the 1st resistance. The multi-swing low support at 1.3528, which also coincides with the 38.20% Fibonacci retracement level, is a good level to watch for a potential bullish bounce. The pullback support at 1.3440, which lines up with the 61.80% Fibonacci retracement level, could also provide a good level for buyers to step in if the price drops further.
On the upside, the 1st resistance at 1.3586, which coincides with the 38.20% Fibonacci retracement level, is a key level to watch for a potential bullish continuation towards the 2nd resistance at 1.3668. This overlap resistance level also lines up with the 78.60% Fibonacci retracement level.
DJ30:
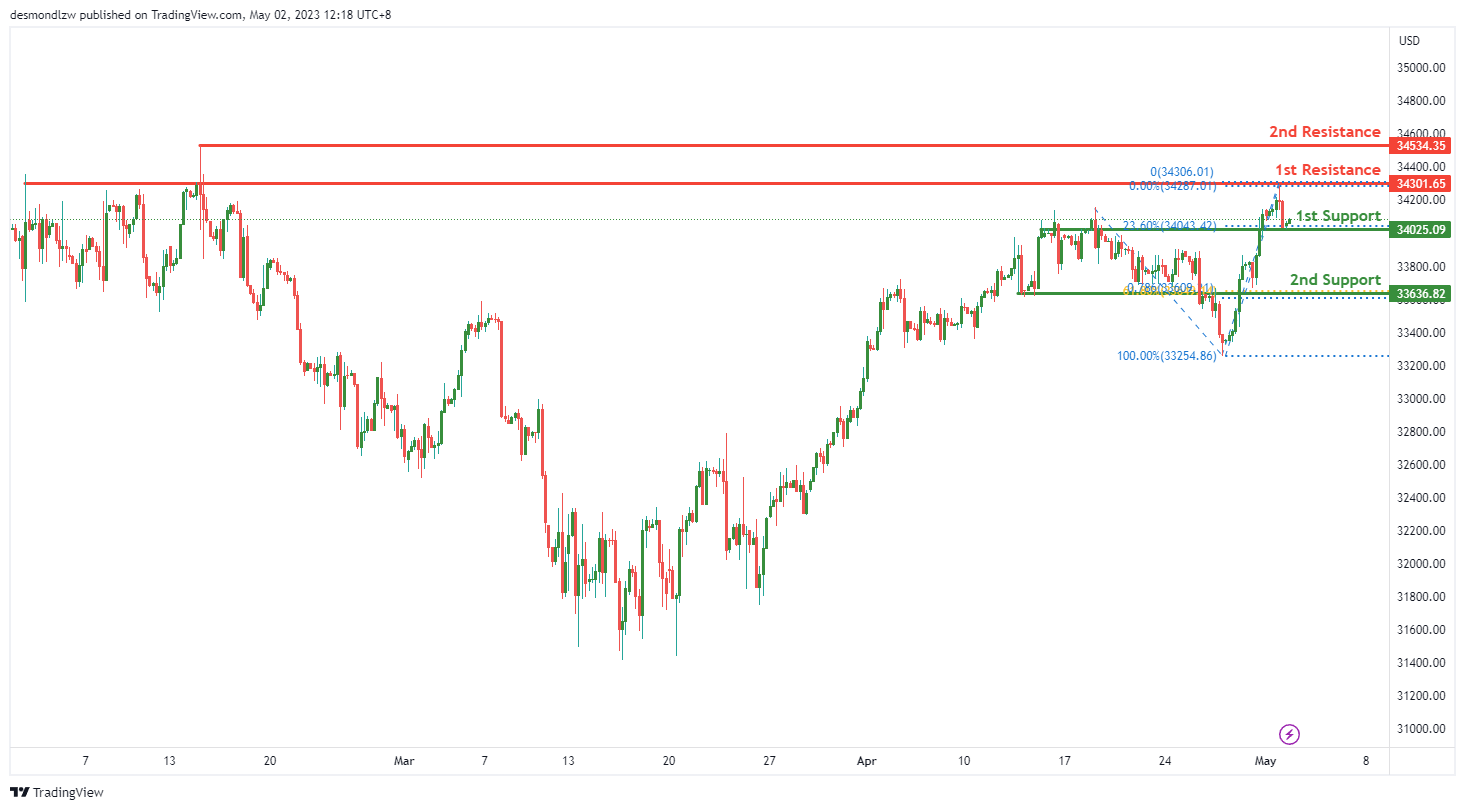
The DJ30 chart is showing strong bullish momentum, with prices bouncing off a key support level at 34025.09, suggesting that the index could potentially head towards the first resistance level at 34301.65. The momentum of the chart is bullish, which supports this view.
If the index were to break through the 1st resistance, it could potentially rise towards the 2nd resistance at 34534.35, which is a swing high resistance level. However, if the index fails to break through the 1st resistance, it could potentially bounce off this level and head back towards the 1st support at 34025.09.
The 1st support is a strong overlap support level with a 23.60% Fibonacci retracement lining up with it. Meanwhile, the 2nd support is also a good support level with a 61.80% Fibonacci retracement lining up with it. If prices were to break through the 1st support, they could potentially drop to the 2nd support.
GER30:
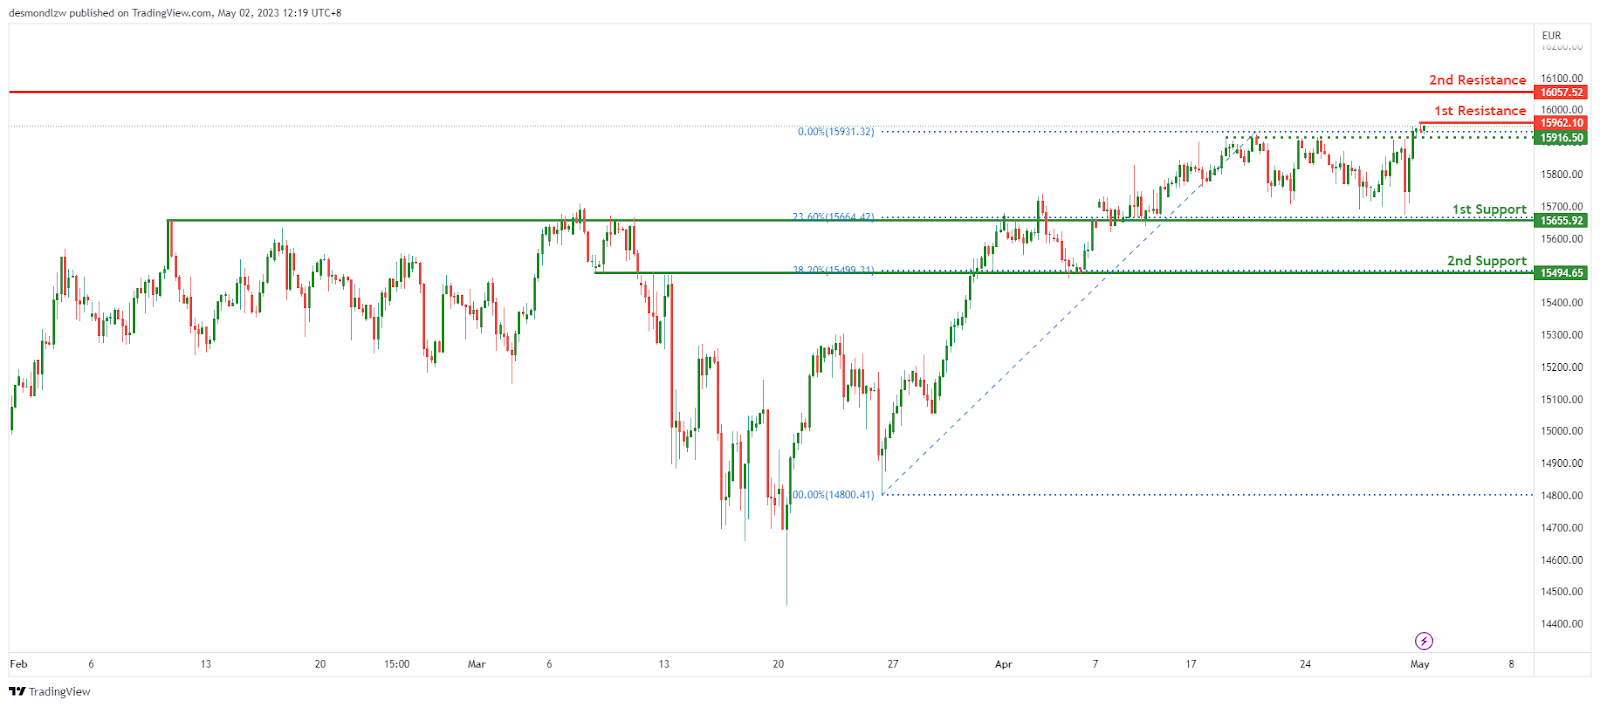
The German stock market, represented by the GER30 instrument, has been showing bullish momentum. The price is expected to potentially make a bullish break through of the first resistance and rise to the second resistance level.
The first support level is at 15655.92, and it is an overlap support level that has been established in the past. Additionally, it is at the 23.60% Fibonacci retracement level, which makes it an important level to watch. The second support level is at 15494.65, and it is also an overlap support level. This level is at the 38.20% Fibonacci retracement level, which provides further support to this level.
The first resistance level is at 15962.10, and it is a swing high resistance level. This level has been tested in the past and is expected to be a significant resistance level. The second resistance level is at 16057.52, and it is also a swing high resistance level. This level is expected to be even stronger than the first resistance level.
In addition to these support and resistance levels, there is an intermediate support level at 15916.50, which is a pullback support level. This level is expected to provide additional support in case the price retraces from the first resistance level.
BTC/USD:
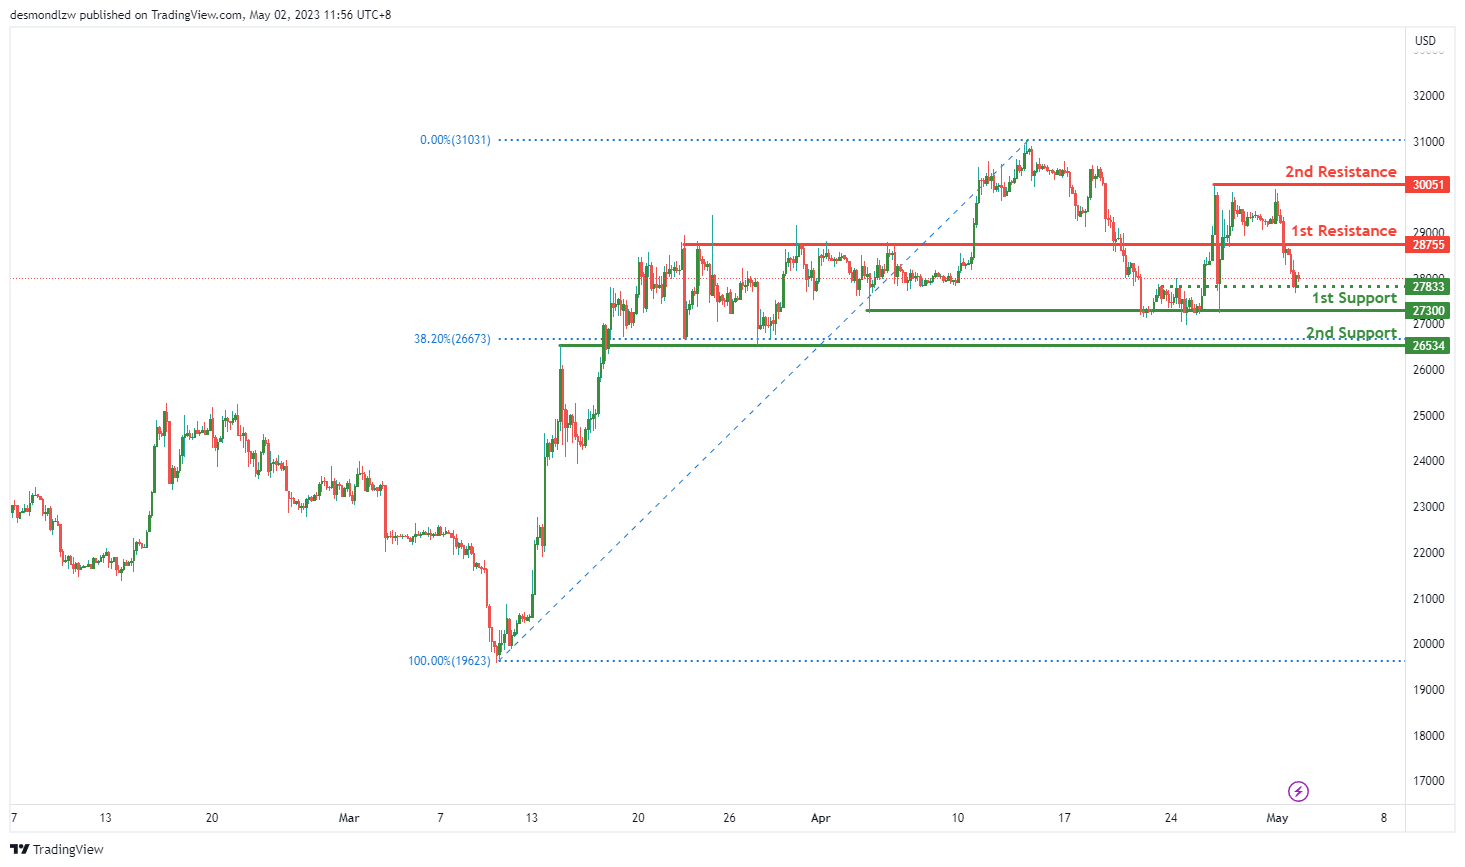
The cryptocurrency market has been experiencing some bearish momentum lately, and the BTC/USD pair is no exception. The overall momentum of the chart for BTC/USD is currently bearish, with potential for a bearish continuation towards the 1st support level.
The 1st support level for BTC/USD is at 27300, and it is a multi-swing low support level. This support level has held several times in the past, making it a strong area of support.
The 2nd support level for BTC/USD is at 26534, and it is an overlap support level. This level also coincides with the 38.20% Fibonacci retracement level, making it a key area of support to watch.
On the resistance side, the 1st resistance level is at 28755, and it is an overlap resistance level. If BTC/USD manages to break through this level, it could potentially rise towards the 2nd resistance level.
The 2nd resistance level for BTC/USD is at 30051, and it is a multi-swing high resistance level. This level has acted as a strong area of resistance in the past and could potentially do so again.
In between the 1st support and 1st resistance levels, there is an intermediate support level at 27833, which is also an overlap support level. If the price manages to break below the 1st support level, this intermediate support level could potentially act as a temporary area of support.
US500
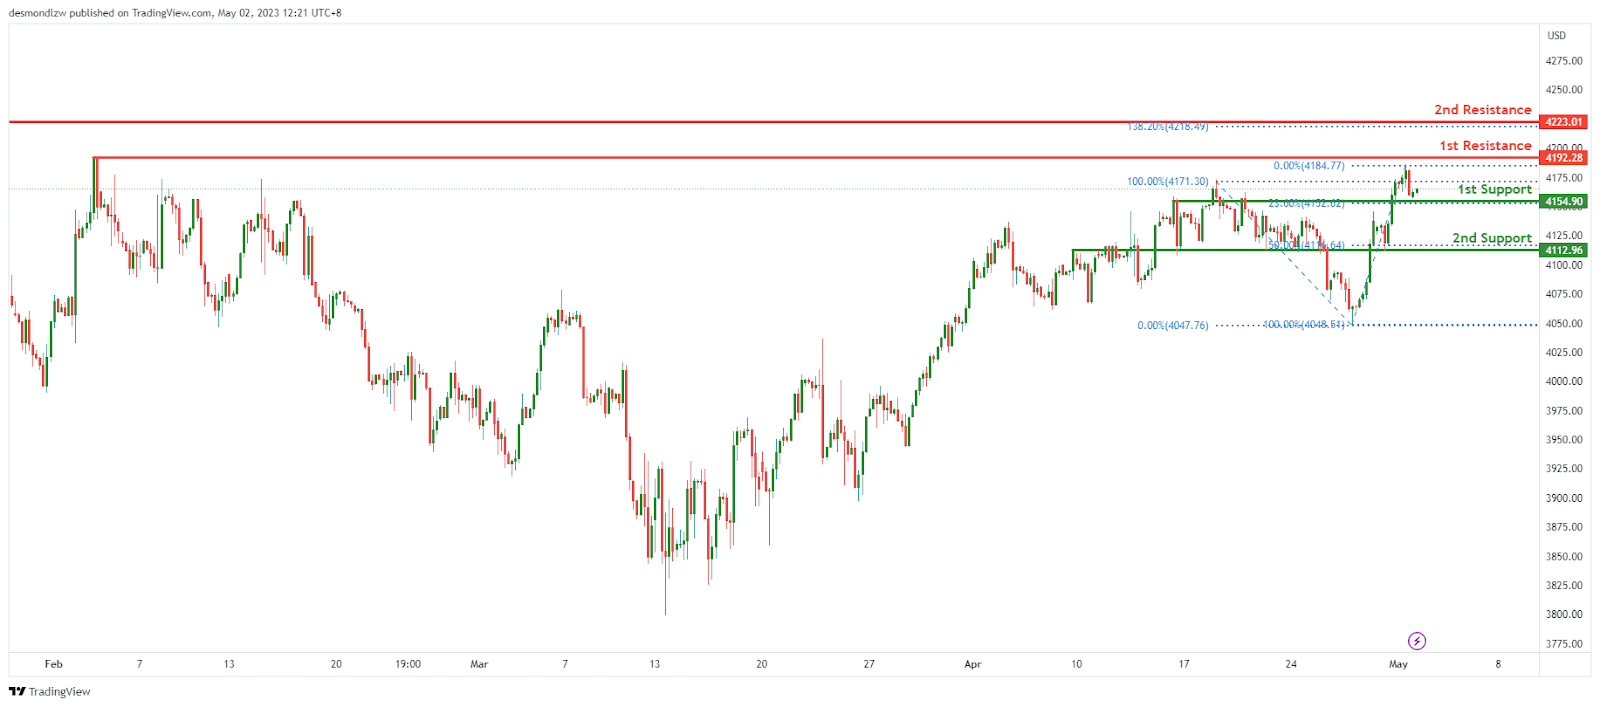
The US500 has been showing a strong bullish momentum, as the overall bias on the chart indicates. The price could potentially continue to rise towards the first resistance level, as it has already broken through previous levels of resistance.
Currently, the price is at the 1st support level of 4145.90, which is an overlap support and also marks the 23.60% Fibonacci retracement level. This support level suggests that buyers may enter the market, leading to a potential bounce in price. If the price bounces off this level, it could rise towards the first resistance at 4192.28, which is a swing high resistance level.
If the price breaks through the first resistance level, it could continue to rise towards the second resistance level of 4223.01. This resistance level also marks the 138.20% Fibonacci extension level, which further reinforces the potential for the price to rise towards this level.
On the downside, the 2nd support level at 4112.96 is another key support level to watch, as it is an overlap support and also marks the 50% Fibonacci retracement level. A break below this level could indicate a bearish reversal and potential further downside towards the 1st support level of 4145.90.
ETH/USD:
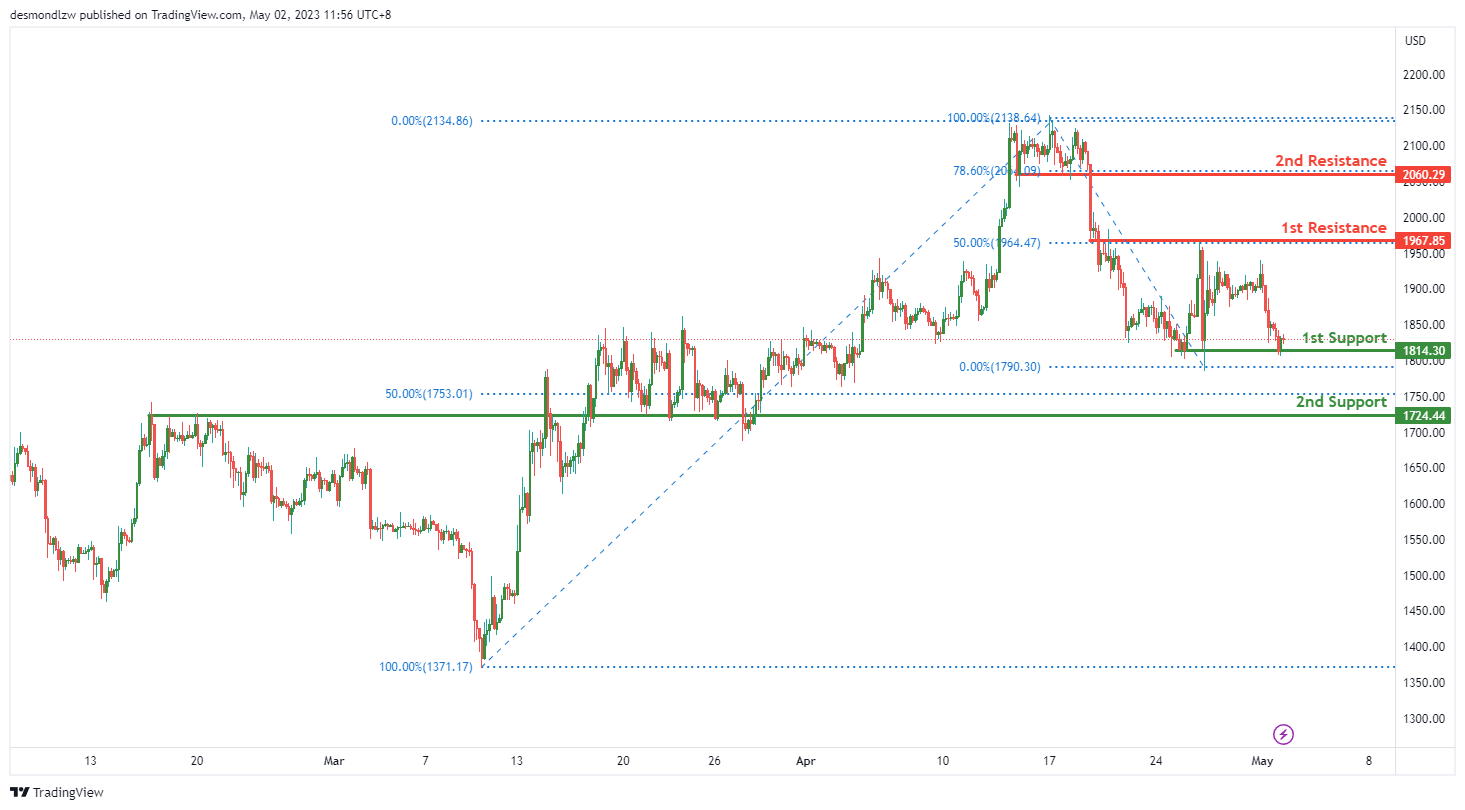
The overall momentum of ETH/USD appears to be bearish. The price is currently hovering below key resistance levels, suggesting that there may be further downside potential.
In the short term, price could potentially make a bearish break off the first support level at 1814.30 and drop towards the second support level at 1724.44. The first support level is a multi-swing low support level, which indicates that it has been tested multiple times in the past and could provide a strong level of support. The second support level is an overlap support level and coincides with the 50% Fibonacci retracement level, which adds further confluence to this level as a potential support zone.
On the upside, the first resistance level at 1967.85 is an overlap resistance level and also coincides with the 50% Fibonacci retracement level. The second resistance level at 2060.29 is a pullback resistance level and coincides with the 78.6% Fibonacci retracement level. A break above these resistance levels could potentially signal a reversal of the current bearish trend.
WTI/USD:
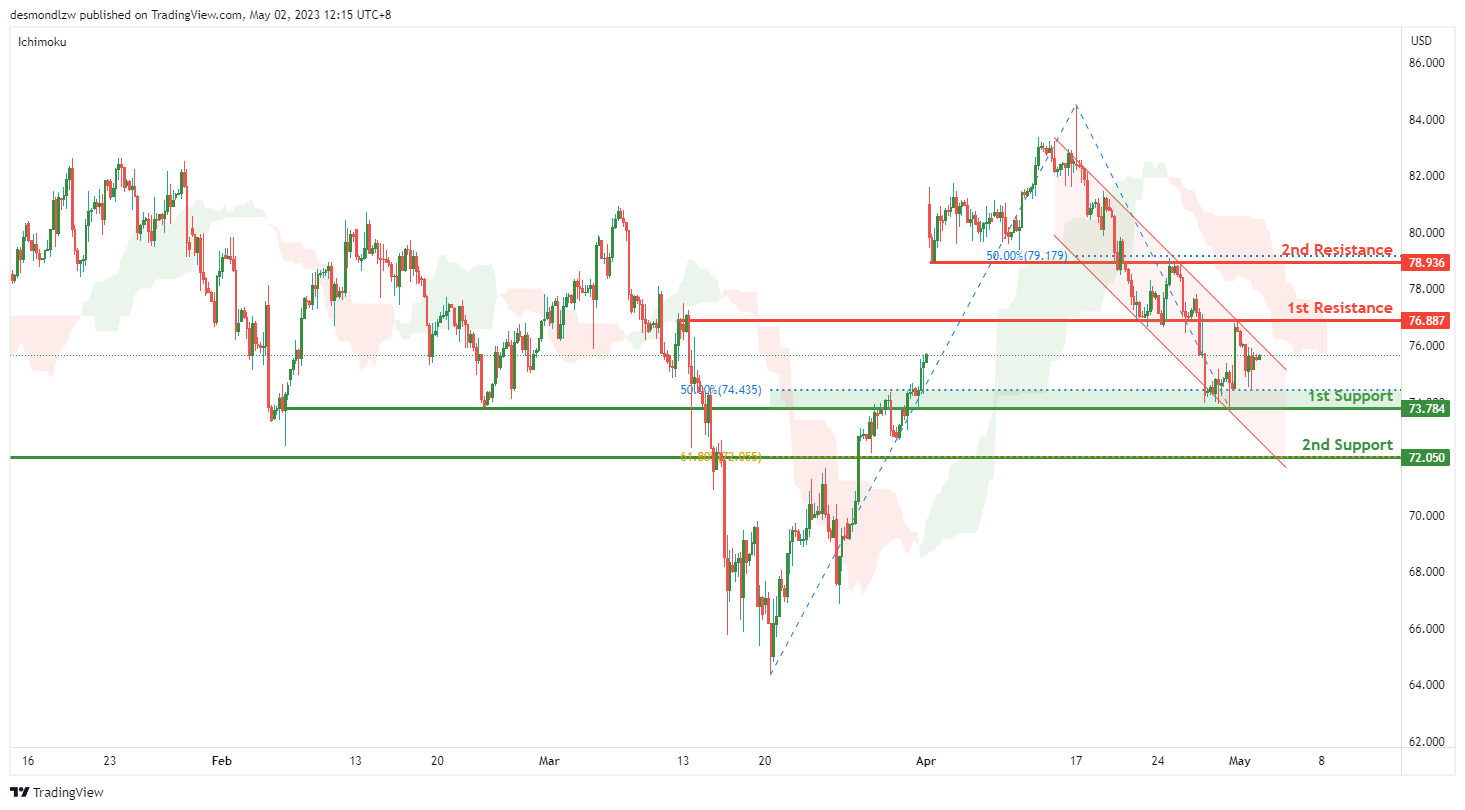
In terms of the WTI chart, the overall momentum is currently bearish. This is mainly due to the fact that the price is below the bearish Ichimoku cloud and it is also in a bearish descending channel.
Looking at potential price movements, we could potentially see a continuation of the bearish trend towards the first support level at 73.78. This level is an overlap support and lines up with a 50% Fibonacci retracement which makes it a strong level of support. If the price bounces off this level, it could potentially rise towards the first resistance level at 76.88 which is also an overlap resistance.
However, if the price were to break the 1st support level, the next level it could drop to is the 2nd support level at 72.05. This level is a swing low support and lines up with a 61.80% Fibonacci retracement, making it another strong level of support.
On the other hand, if the price were to break above the 1st resistance level, it could potentially rise towards the 2nd resistance level at 78.93. This level is an overlap resistance and lines up with a 50% Fibonacci retracement, making it another strong level of resistance.
XAU/USD (GOLD):
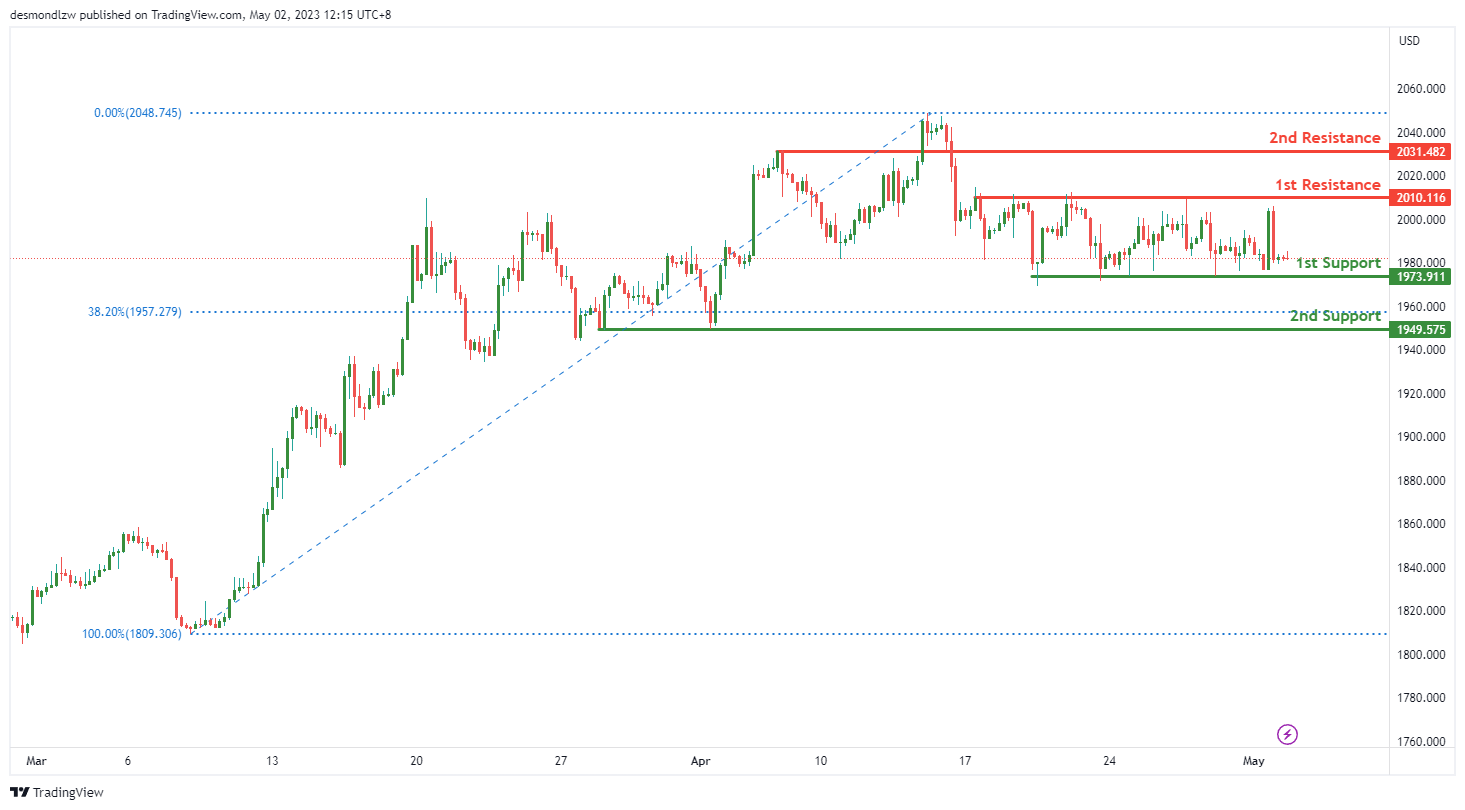
The current momentum of XAU/USD is neutral, meaning that there is no clear trend direction. The price is expected to fluctuate between the 1st resistance and 1st support levels in the short term.
The 1st support level is located at 1973.91, which is a multi-swing low support level. This level has held as support in the past, making it a significant level to watch. In addition, it coincides with a 23.6% Fibonacci retracement, adding further confluence to the support level.
If the price were to break below this support level, the next support level to watch would be the 2nd support at 1949.57. This level is also a multi-swing low support level and coincides with a 38.2% Fibonacci retracement, making it a strong level of support.
On the resistance side, the 1st resistance level is at 2010.11. This level is a swing high resistance, and if the price were to break above it, it could potentially trigger a bullish acceleration towards the 2nd resistance level at 2031.48. This level is a pullback resistance, meaning that it is an area where sellers may enter the market, making it an important level to
GBP/JPY Daily Outlook
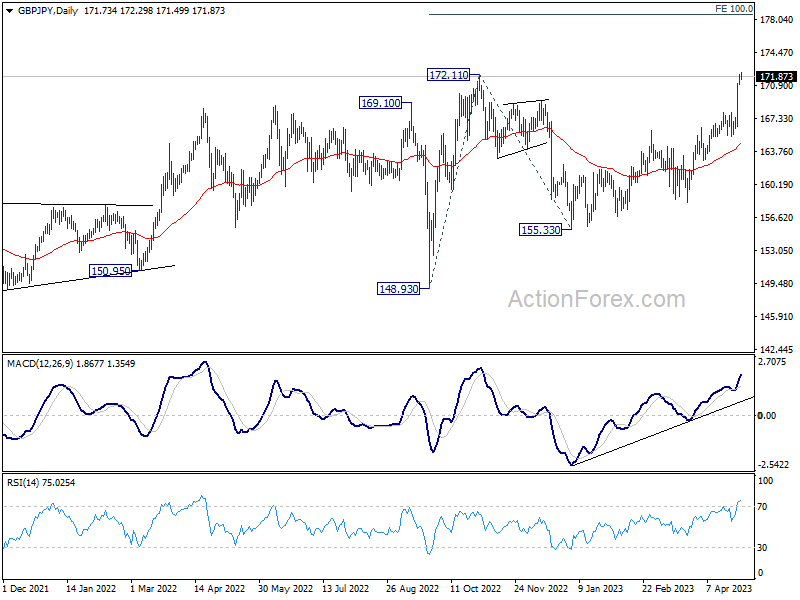
Daily Pivots: (S1) 171.15; (P) 171.62; (R1) 172.26; More...
GBP/JPY's rally continues today and hit as high as 172.29 so far. Intraday bias remains on the upside at this point. Decisive break of 172.11 high will resume larger up trend and target 100% projection of 148.93 to 172.11 from 155.33 at 178.51. On the downside, below 170.76 minor support will turn intraday bias neutral and bring consolidations first, before staging another rally.
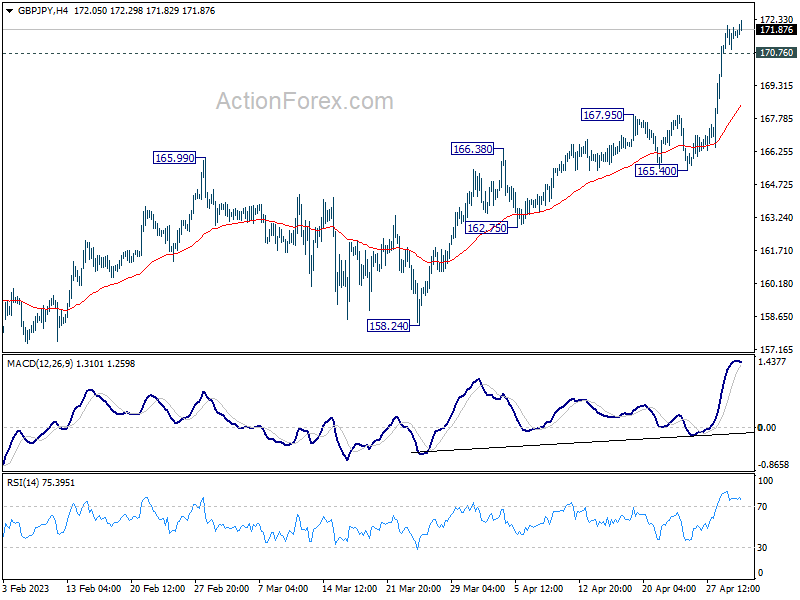
In the bigger picture, based on current momentum, up trend from 123.94 (2020 low) is likely ready to resume. Next target is 161.8% projection of 122.75 (2016 low) to 156.59 (2018 high) from 123.94 at 178.69. This will now remain the favored case as long as 165.40 support holds, in case of retreat.
EUR/JPY Daily Outlook
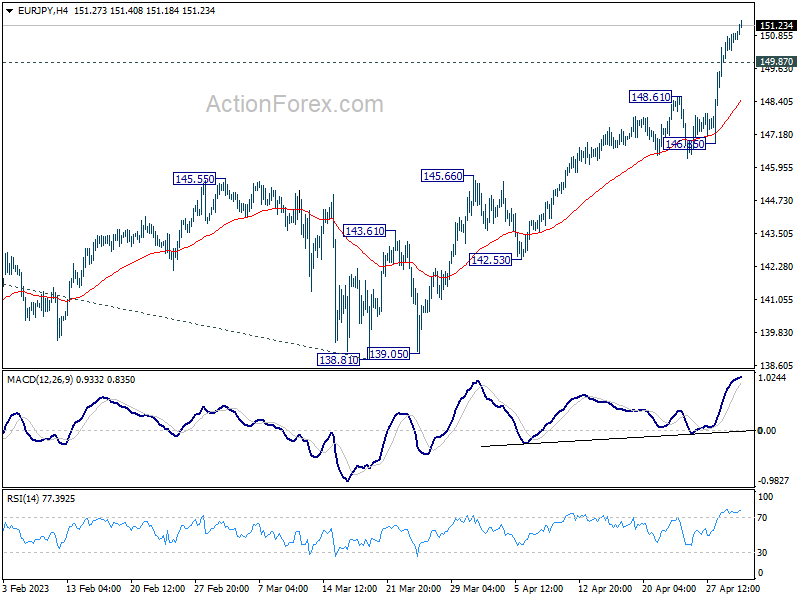
Daily Pivots: (S1) 150.32; (P) 150.64; (R1) 151.25; More....
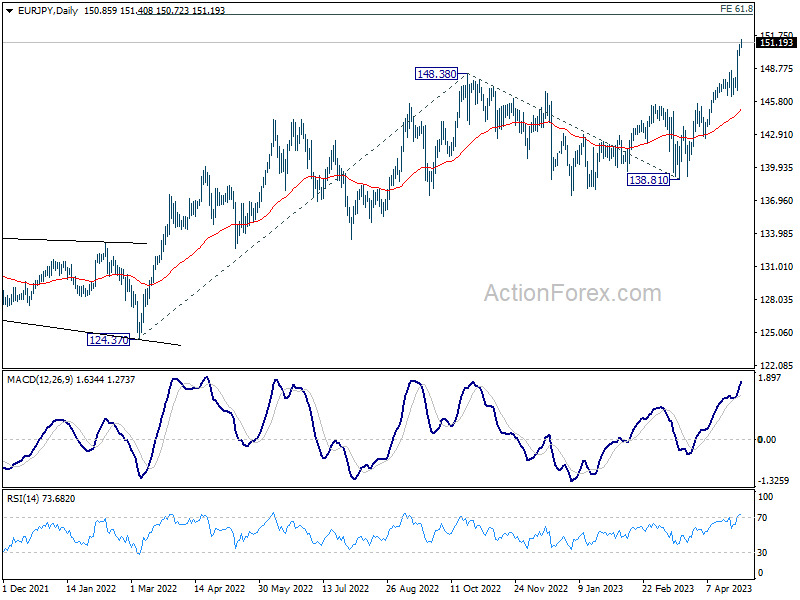
EUR/JPY's rally continues today and hits as high as 151.40 so far. Intraday bias stays on the upside and current up trend should now target 153.64 projection level. On the downside, below 149.87 minor support will turn intraday bias neutral and bring consolidations first, before staging another rally.
In the bigger picture, current development indicates that rise from 114.42 (2020 low) is in progress. Next target is 61.8% projection of 124.37 to 148.38 from 138.81 at 153.64. Sustained break there will pave the way to 100% projection at 162.82. For now, medium term outlook will remain bullish as long as 138.81 support holds, even in case of deep pull back.
EUR/GBP Daily Outlook
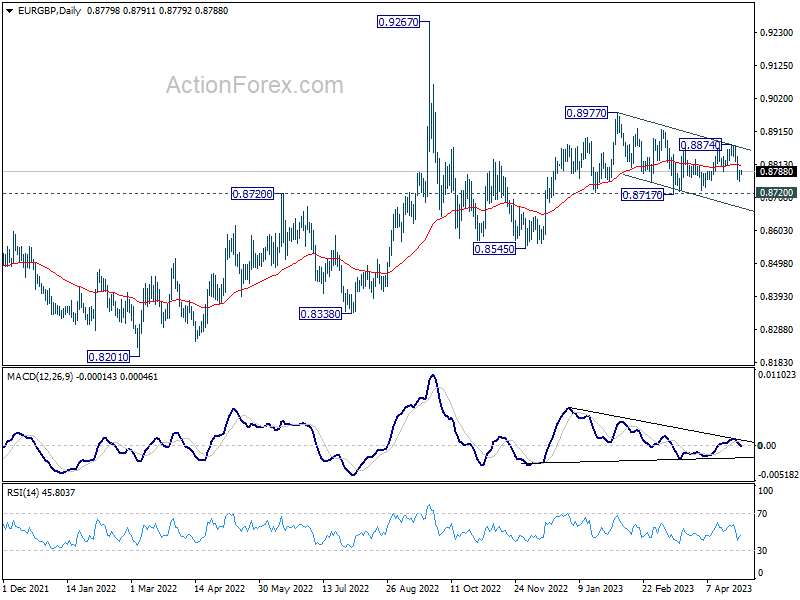
Daily Pivots: (S1) 0.8765; (P) 0.8779; (R1) 0.8799; More...
Intraday bias in EUR/GBP stays neutral and outlook is mixed for now. On the downside, decisive break of 0.8717 support will resume whole choppy decline from 0.8977. On the upside, break of 0.8874 will resume the rebound from 0.8717 instead.
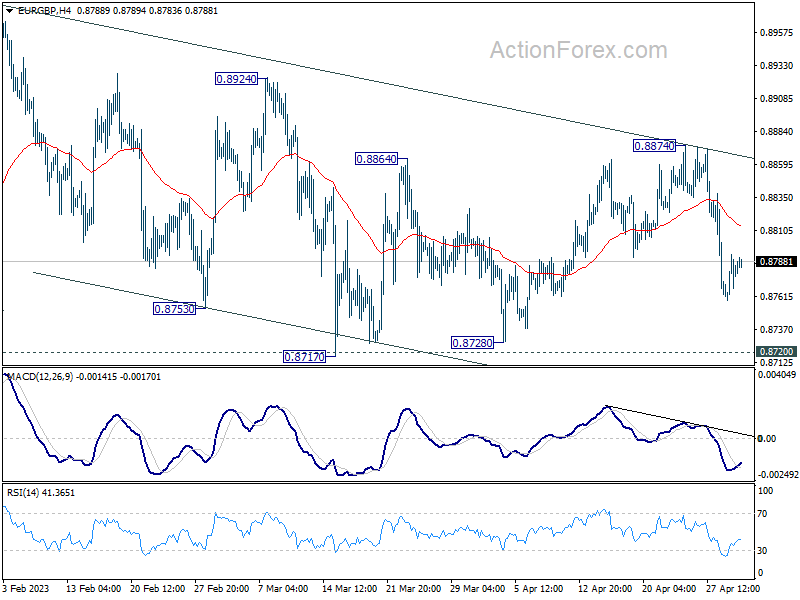
In the bigger picture, outlook remains rather mixed for now, except that price actions from 0.9267 (2022 high) are part of the long term range pattern from 0.9499 (2020 high). With 0.8720 support intact, rise from 0.8545 is in favor to continue through 0.8977. However, firm break of 0.8720 will argue that such rebound has completed, and open up deeper fall through this support level.
EUR/AUD Daily Outlook
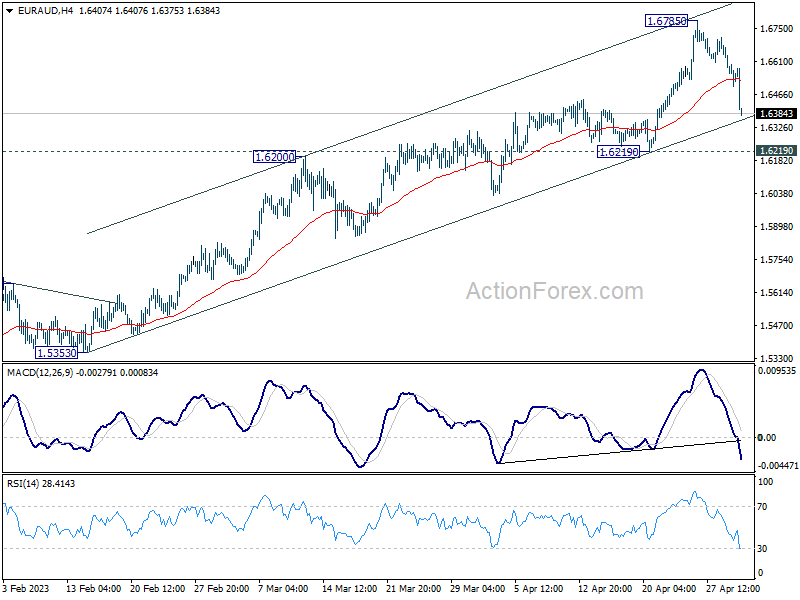
Daily Pivots: (S1) 1.6482; (P) 1.6578; (R1) 1.6652; More...
EUR/USD's break of 1.6444 resistance turned support indicates short term topping at 1.6785. Intraday bias is back on the downside for pull back to 1.6219 support. Firm break there will indicate that larger correction is on the way. Nevertheless, strong rebound from 1.6219 will maintain near term bullishness for another rise through 1.6785 at a later stage.
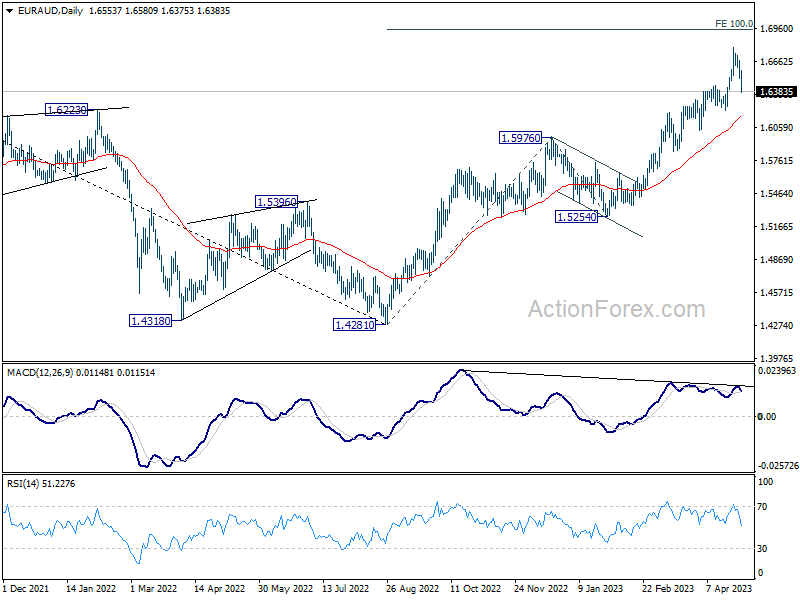
In the bigger picture, the solid break of 1.6434 resistance argues that whole down trend from 1.9799 (2020 high) has completed at 1.4281 (2022 low). Further rise should be seen to 61.8% retracement of 1.9799 to 1.4281 at 1.7691 next. For now, outlook will stay bullish as long as 1.5976 resistance turned support holds, even in case of deep pull back.
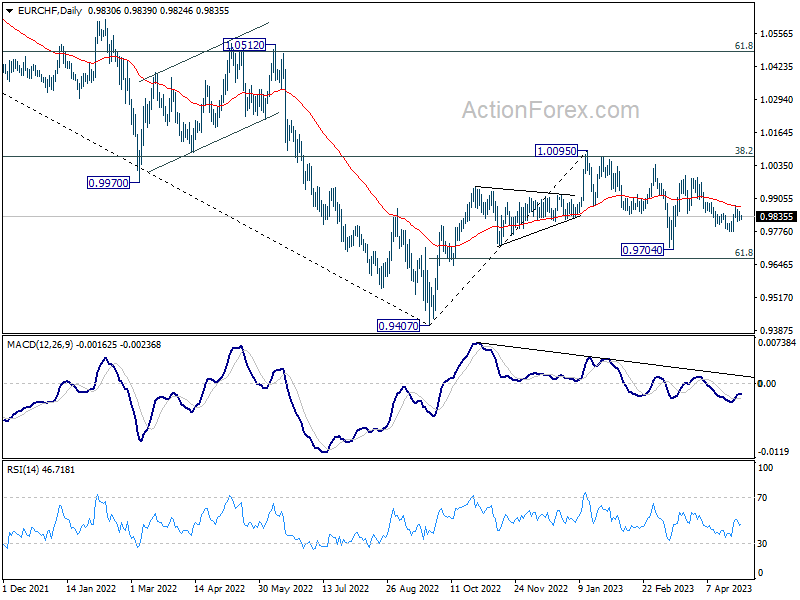
EUR/CHF Daily Outlook
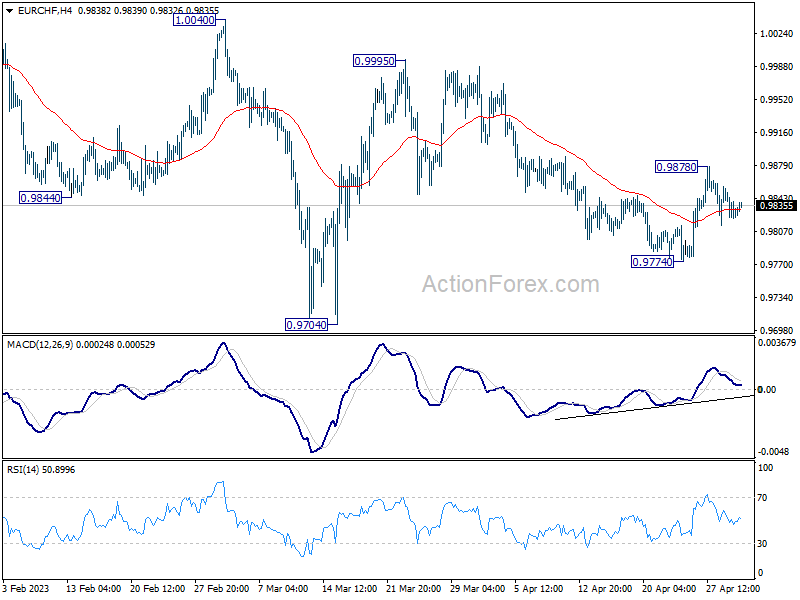
Daily Pivots: (S1) 0.9814; (P) 0.9835; (R1) 0.9851; More...
Intraday bias in EUR/CHF stays neutral and outlook is unchanged. Risk will stay on the upside as long as as long as 0.9774 short term bottom holds. Current development suggests that whole correction from 1.0095 has completed at 0.9704. Break of 0.9878, and sustained trading above 55 D EMA (now at 0.9873) will affirm this bullish case, and target 0.9995 resistance next.
In the bigger picture, prior rejection by 55 W EMA (now at 0.9972) and 38.2% retracement of 1.1149 to 0.9407 at 1.0072 suggests that medium term outlook is staying bearish. That is, down trend from 1.2004 is not completed yet and is in favor to resume through 0.9407 at a later stage. However, decisive break of 1.0095 resistance will raise the chance of bullish trend reversal. Rise from 0.9407 should then target 1.0505 cluster resistance (2020 low at 1.0505, 61.8% retracement of 1.1149 to 0.9407 at 1.1484).
EUR/USD Daily Outlook
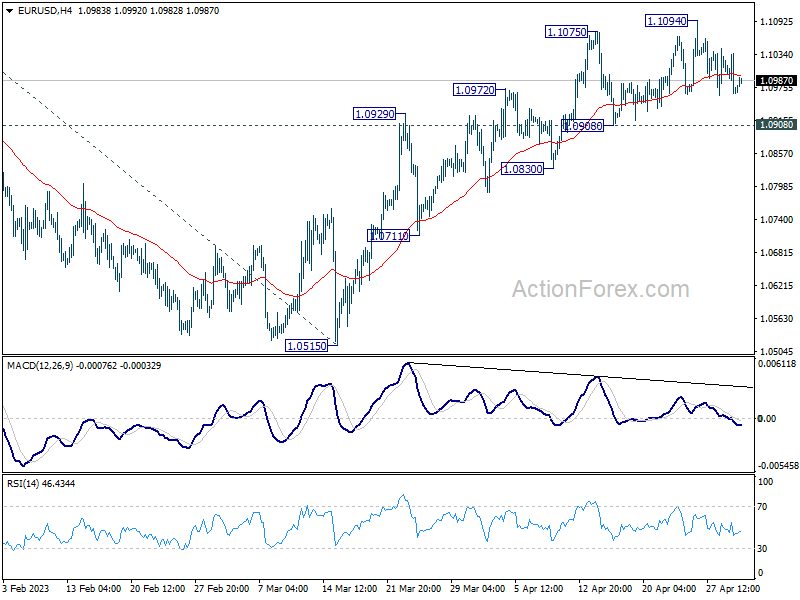
Daily Pivots: (S1) 1.0949; (P) 1.0992; (R1) 1.1021; More...
Intraday bias in EUR/USD remains neutral for the moment as sideway consolidation continues. Further rally is expected as long as 1.0908 support holds. Break of 1.1094 will resume larger up trend to 1.1273 fibonacci level. Break there will target 61.8% projection of 0.9534 to 1.1032 from 1.0515 at 1.1441 However, considering bearish divergence condition in 4H MACD, break of 1.0908 support will indicate short term topping and turn bias back to the downside.
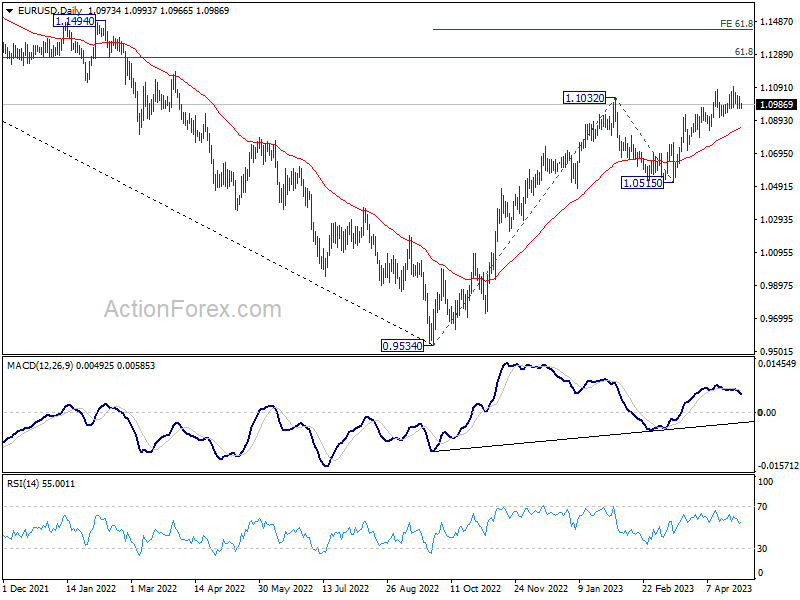
In the bigger picture, rise from 0.9534 (2022 low) is in progress for 61.8% retracement of 1.2348 (2021 high) to 0.9534 at 1.1273. Sustained break there will solidify the case of bullish trend reversal and target 1.2348 resistance next (2021 high). This will now remain the favored case as long as 1.0515 support holds, even in case of deeper pull back.
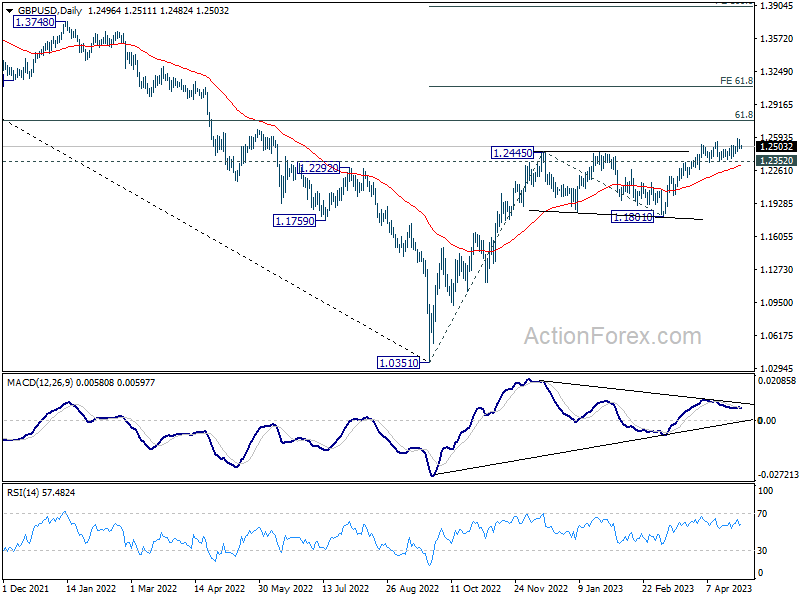
GBP/USD Daily Outlook
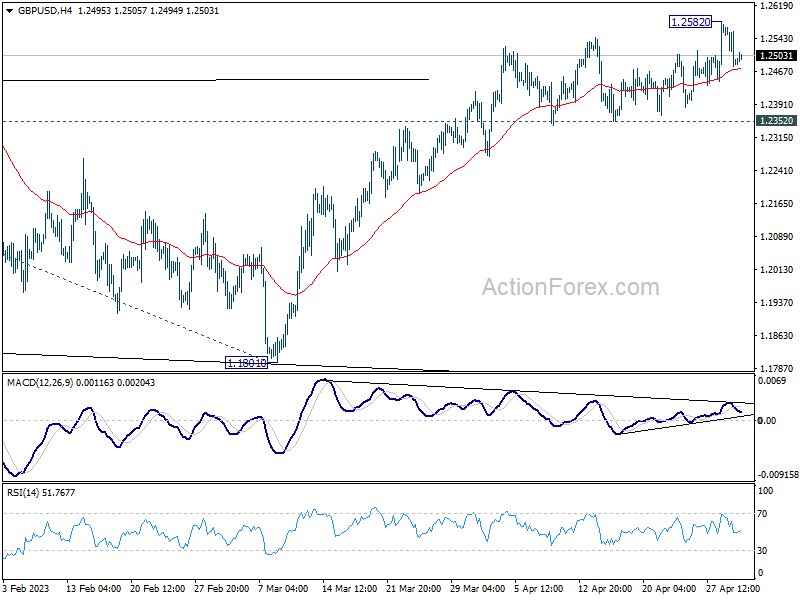
Daily Pivots: (S1) 1.2461; (P) 1.2516; (R1) 1.2551; More...
Intraday bias in GBP/USD is turned neutral with current retreat and some consolidations would be seen below 1.2582 first. Outlook will stay bullish as long as 1.2352 support holds. On the upside, above 1.2582 will target 1.2759 fibonacci level first. Firm break there will target 61.8% projection of 1.0351 to 1.2445 from 1.1801 at 1.3095.
In the bigger picture, the rise from 1.0351 medium term term bottom (2022 low) is in progress for 61.8% retracement of 1.4248 (2021 high) to 1.0351 at 1.2759. Sustained break there will add to the case of long term bullish trend reversal. Further break of 61.8% projection of 1.0351 to 1.2445 from 1.1801 at 1.3095 could prompt upside acceleration to 100% projection at 1.3895. For now, this will remain the favored case as long as 1.1801 support holds, even in case of deep pull back.