Sample Category Title
BTCUSD Analysis: Shooting Star Pattern Below $29,961
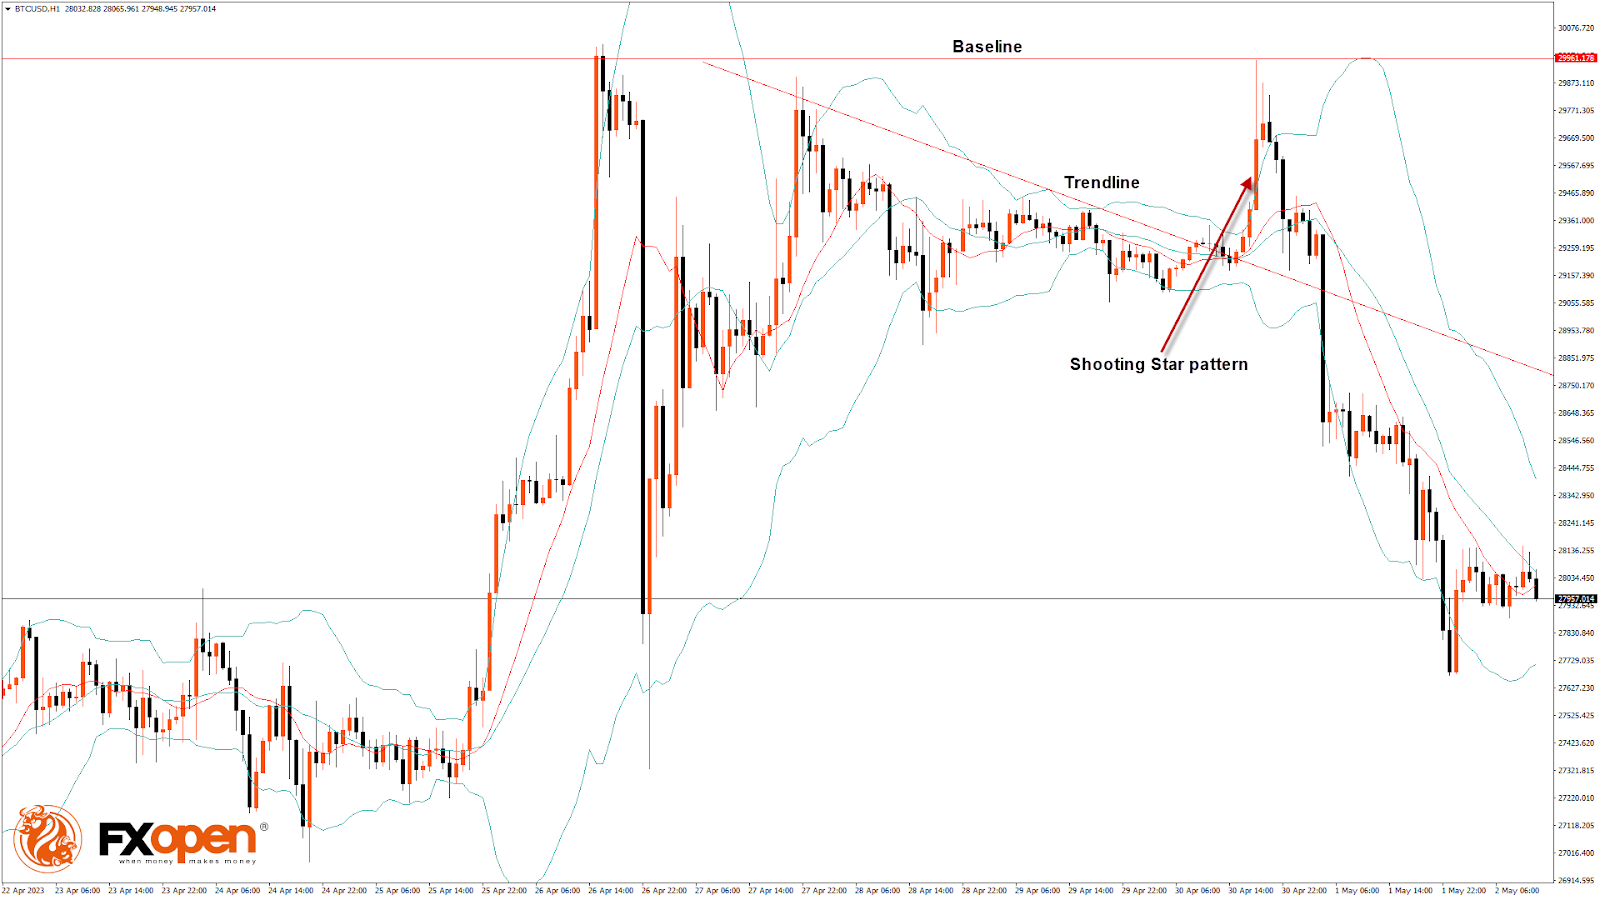
Bitcoin failed to continue its bullish momentum from last week, and after touching a high of $29,961 on April 30, it declined below the $28,000 handle today in the European trading session.
We can clearly see a shooting star pattern below the $29,961 handle on the H1 timeframe.
Bitcoin continues to move in a correction phase after crossing the $29,000 level, which is indicative of weakness in the immediate short term.
Both the STOCH and STOCHRSI are in overbought zones, which means that in the immediate short term, a decline in the price is expected.
We can see a bearish opening of the markets this week. The prices of Bitcoin are ranging near a new 1-month low.
The relative strength index is at 38.41, indicating very weak demand for Bitcoin and the continuation of the selling pressure in the market.
Bitcoin is now moving below 100-hour and 200-hour exponential moving averages.
Most of the major technical indicators are bearish, which means that in the immediate short term, we can expect a fall to $27,500 and $27,000.
The average true range indicates less market volatility with mild bearish momentum.
- Bitcoin bearish reversal is seen below $29,961.
- The RSI remains below 50, indicating a bearish market.
- The price is now trading below its pivot level of $28,078.
- The short-term range is mildly bearish.
- Some major technical indicators signal that the price may move to $27,000 and $26,500 soon.
Bitcoin Bearish Reversal Seen below $29,961
The price of Bitcoin continues to fall and is expected to enter into a consolidation zone above the $27,000 handle, after which we can see the start of a bullish move.
There is a bearish trend reversal pattern with a 20-period adaptive moving average in the 30-minute timeframe.
The price is ranging near the horizontal resistance in the weekly timeframe.
We can see the formation of a bearish engulfing pattern in the 4-hour timeframe.
A support zone is located at $26,624, which is a 38.2% retracement from the 13-week high, and at $26,940, which is the first support point of the pivot point indicator.
BTCUSD is now facing its classic support level of $27,904 and Fibonacci support level of $27,972, breaking which the price may move to $27,500.
There is a decrease of 15.23% in the daily trading volume, which is normal. The short-term outlook for Bitcoin is bearish, the medium-term outlook has turned bearish, and the long-term outlook remains neutral under present market conditions.
The Week Ahead
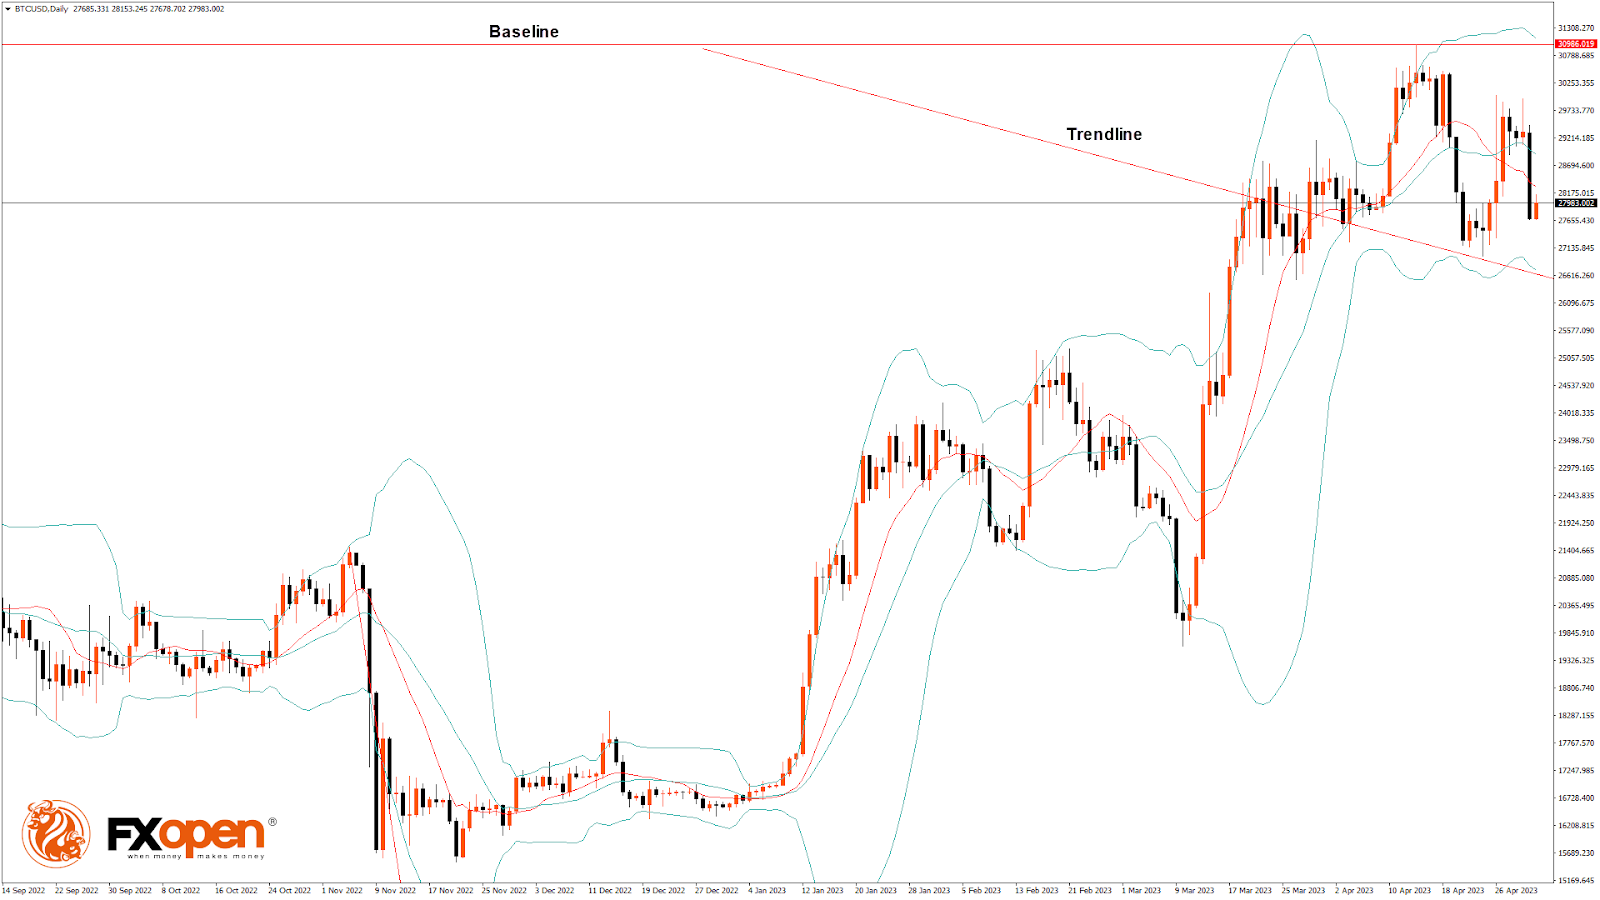
We can see that Bitcoin was unable to cross the $30,000 handle and remains in a downtrend, with the current support at $27,489, which is a 3-10 day MACD oscillator.
The support is at $27,200, after which we may see some consolidation in the zone of the $27,000 level.
The monthly RSI is at 50.15, which indicates the neutral market and the shift towards the consolidation zone in the medium-term range.
There is a bearish trend line from $29,961 to $27,760.
The BTCUSD is now facing resistance at $28,255, where the price crosses the 9-day moving average, and at $28,444, which is a pivot point.
The weekly outlook is $27,000, with a consolidation zone at $27,500.
EUR/USD: Violation of Key Support Makes the Downside More Vulnerable
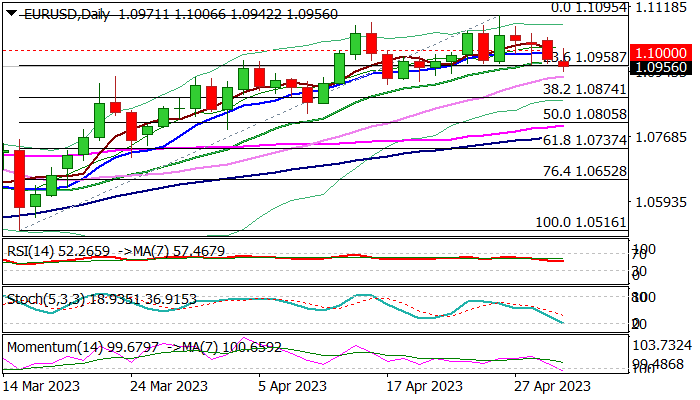
Near-term structure weakens as pullback from new 2023 high (1.1095) extends into fourth consecutive day and probes below pivotal supports at 1.0968/59 (20DMA / Fibo 23.6% of 1.0516/1.1095).
Extension of Monday’s nearly 0.5% drop below the floor of recent congestion suggests that larger bulls are losing traction and looking for deeper pullback, however, such scenario still requires confirmation on close below 1.0960 zone.
Extended pullback would still mark a healthy correction as long as the price stays above next key Fibo level at 1.0874 (38.2% retracement of 1.0516/1.1095), with solid supports at 1.0941 (daily Kijun-sen) and 1.0909 (Apr 17 trough), expected to obstruct fresh near-term bears.
Daily studies are rather mixed as Tenkan / Kijun-sen are still in bullish configuration, but rising negative momentum conflicts and keeps the downside vulnerable.
The single currency came under pressure as Eurozone inflation rose to 7% in April from 6.9% previous month, but core CPI unexpectedly eased to 7.3% from 7.5%, adding to argument that lower underlying inflation would prompt the European Central Bank to opt for smaller rate hike in its policy meeting on Thursday, against existing bets that the central bank may get more aggressive and raise its interest rates by 50 basis points.
Traders await key events on Wednesday and Thursday (Fed and ECB policy meetings) to get clearer signals, as the Fed is widely expected to deliver another 25 basis points hike tomorrow, but also to signal a pause in tightening cycle, which will give time to policymakers to estimate the impact of high borrowing cost to inflation, as well as to the economy, additionally weighed by growing tensions in the US banking sector.
On the other hand, the ECB is likely to extend its tightening campaign after a record 350 basis points hikes in past one year, as inflation is still too high and acceleration in wage growth adds to inflationary pressures.
The only one thing is not clear at the moment – the size of hike, as ECB’s doves and hawks argue about 25 and 50 basis points hikes.
This implies that the Euro is likely to remain supported by diverging policy views between the ECB and Fed in coming months and the larger uptrend could extend after current consolidation/correction.
Res: 1.1000; 1.1044; 1.1075; 1.1095.
Sup: 1.0930; 1.0909; 1.0874; 1.0831.
New Zealand Dollar Higher Ahead of Employment Data
- New Zealand to release employment for Q4
- NZD/USD hits 2-week high
- Fed expected to raise rates
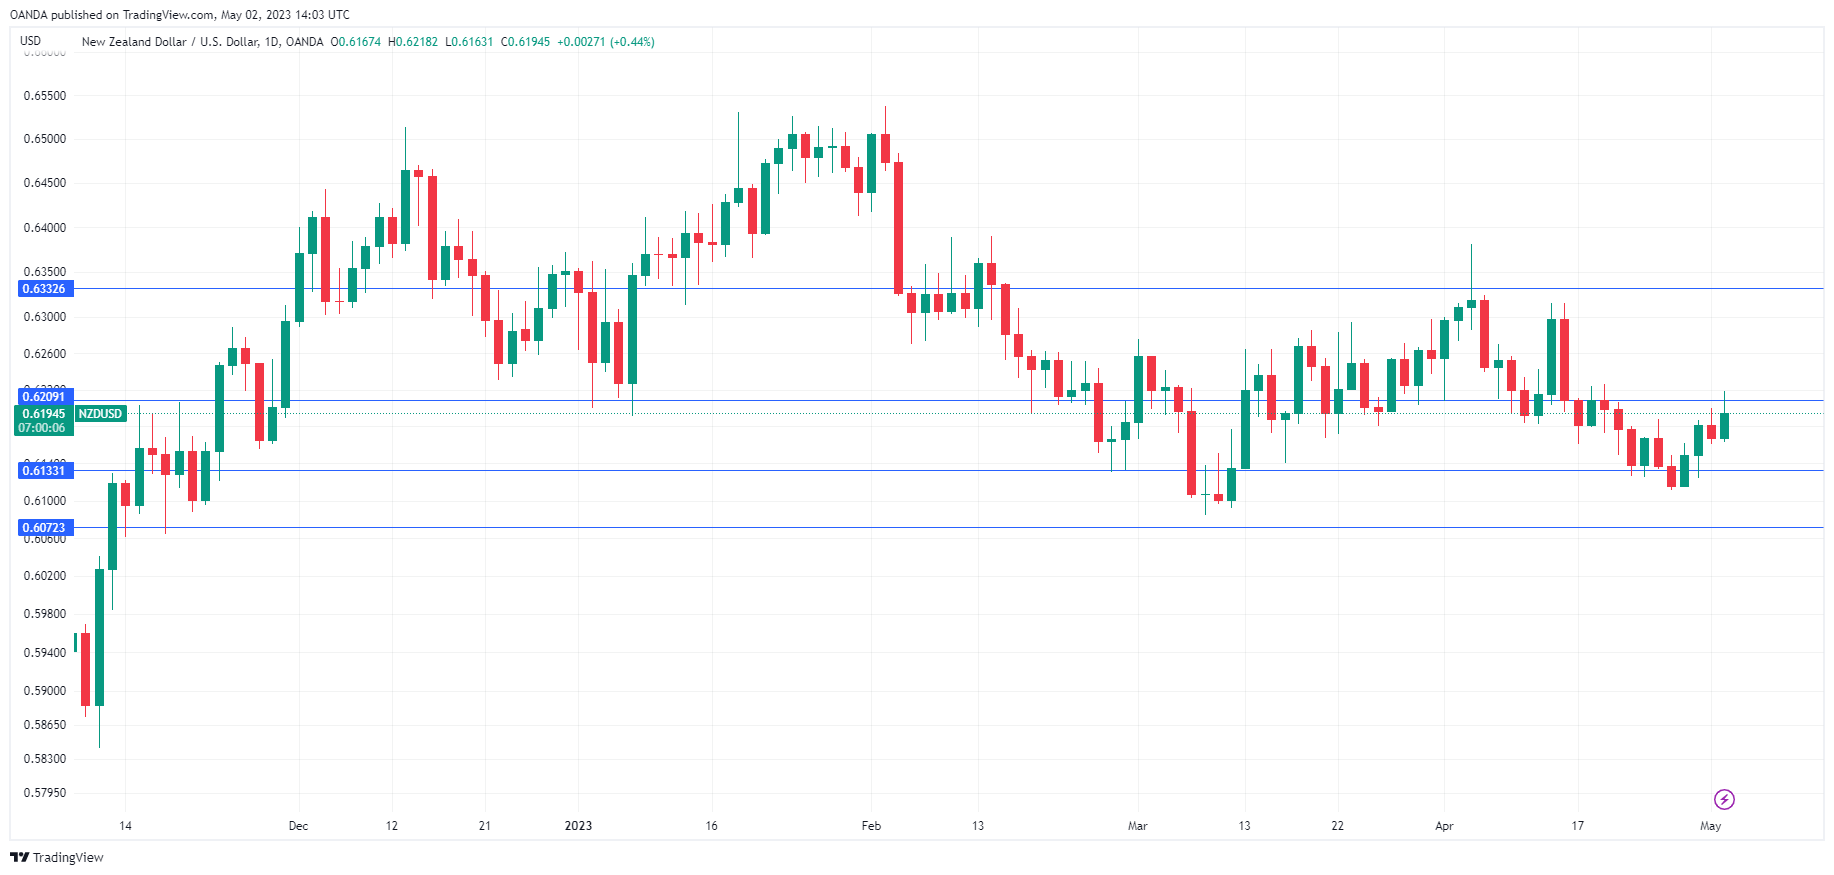
NZD/USD is considerably higher on Tuesday, trading at 0.6203, up 0.57%. Earlier, NZD/USD rose as high as 0.6218, its highest level since April 19th.
New Zealand job numbers expected to remain strong
New Zealand’s labour market has remained robust, despite relentless tightening from the Reserve Bank of New Zealand, which has raised rates to 5.25%. We’ll get a look at first-quarter employment numbers later today, with the markets expecting solid numbers. The unemployment rate is projected to come in at 3.5%, a touch above the 3.4% rate in Q4 of 2022. Employment change is expected at 0.4%, following a Q4 read of 0.2%.
The RBNZ would like to see the labour market weaken in order to hasten the fall of inflation, which remains its number one priority. The central bank will also release the Financial Stability Report later today, which will provide insights into the Bank’s take on inflation and growth. Investors will be looking for hints on rate policy, with the RBNZ meeting next on May 24th. Policy makers would like to pause rates and provide households with a bit of relief, but that will depend on the data, including inflation expectations which will be released next week.
The Fed meets on Wednesday and a 25-basis point hike is widely expected, with a 93% probability according to the CME Group. The banking crisis, which reappeared with First Republic Bank’s shares plunging, is off the radar for now after JP Morgan agreed to purchase First Republic’s assets. Still, credit conditions have tightened, which is estimated to be equivalent to a Fed hike of 25 or perhaps 50 basis points. That fallout is unlikely to prevent a Fed hike on Wednesday but could well lead the Fed to wind up its current tightening cycle earlier than anticipated.
NZD/USD Technical
- NZD/USD tested resistance at 0.6209 earlier today. Above, there is resistance at 0.6332
- 0.6133 and 0.6072 are the next support levels
Sunset Market Commentary
Markets
The ECB bank lending survey and the EMU April flash CPI were final key input for the ECB Monetary Policy Committee to start deliberations for Thursday’s interest rate decision. In the quarterly Bank Lending Survey EMU banks reported a further substantial net tightening on credit standards especially for loans to firms and for house purchases. Tightening was more than banks anticipated earlier this year. The tightening was partially due to higher perception of risk but mainly also the result of ECB policy as banks adapted credit/credit pricing to higher funding costs due to ECB rate hikes and a decrease in central bank liquidity. At the same time, demand for credit (especially housing loans) also declined sharply. Banks also indicated deteriorating funding conditions. The March financial turmoil played a role, but ECB policy was also important as a decline in excess liquidity (TLTRO repayments and lower APP reinvestment) was said to have a negative impact in market financing conditions, liquidity positions and total assets. In the wake of national CPI April CPI data published last week, the EMU April flash CPI brought no high profile surprise. Headline inflation printed at 0.7% M/M raising the Y/Y measures from 6.9% to 7.0% . Core inflation ‘eased’ marginally from 5.7% Y/Y to 5.6%, as expected. However the M/M headline figure shows that the inflation dynamics remains strong. A near record core inflation also can’t be really comfortable for the ECB (services costs accelerated further to 1.2% M/M and 5.2% Y/Y from 5.1%). Even so, markets post the release hardly changed their assessment on the chances between a 25 or 50 bps rate hike on Thursday (only about 15% probability discounted for 50 bps step). German yields are rising between 7 bps (2-y) and 4.5 bps (30-y) but most of these gains were mainly a catch up move with yesterday’s rise in the US and already on the screens before the EMU data releases. US yields are easing marginally (2-y minus 1 bp; 5-y minus 2.75 bps) as yields take a breather after yesterday’s jump higher. The March JOLTS jobs openings to be released after finishing this report still has market moving potential. US markets currently see hardly any chance for the Fed to resume its hiking cycle after taking a pause after tomorrow’s 25 bps point step. The RBA decision this morning shows the scenario still can turn out different when a CB stops its ani-inflation fight too early. The upside in both in European (Eurostoxx 50 -0.65%) and in US (S&P -0.4%) equities apparently is blocked with key resistance nearby (respectively at 4415 and 4200).
In FX markets, the dollar currently has the benefit of the doubt, but gains are far from impressive. DXY (102.2) broke out of ST downward sloping trend channel, but more is needed to call a it a real reversal. EUR/USD intraday touched the 1.0950 area, but one weaker than expected US data release might already be enough to change fortunes again. Sterling also joined the broader wait-and-see attitude with EUR/GBP holding a tight range close too, mostly slightly below the 0.88 barrier.
News & Views
Turkey’s central bank asked commercial banks to limit dollar sales to companies that don’t have urgent payments, people familiar with the matter said. Instead they are asked to prioritize dollar demand arising from maturing accounts under the KKM program. This government-backed scheme is designed to prop up the lira by compensating holders for Turkey currency losses against foreign currencies including the USD. According to the people, unusually high demand may arise today with a lot of those accounts reaching maturity. The total amount invested as per April 20 stands at $100bn. KKM is the government’s preferred (but costly) tool to prevent excessive lira losses. USD/TRY hits record highs (TRY-lows) every day but daily net gains are relatively small. Since March though the TRY-depreciation process sped up.
Swedish house prices extended a drawn-out decline in April dropping 1% m/m, data from the country’s state-lender showed. The fourteenth month of declines comes as the Swedish Riksbank still jacks up policy rates to fight well above-target inflation. With Swedish mortgages typically fixed for only a limited period (most of them for three months), the Riksbank’s tightening course filters through fairly quickly into mortgage rates and the housing market. The Swedish krone is trading relatively calm today with EUR/SEK hovering around 10.30.
Fed Hike, Then What?
There is a pretty strong consensus that the Fed will hike by a quarter of a point at the next meeting. But what could really throw the markets for a loop is what happens after that. Most traders for the moment expect a pause. But recent data shows that there remains a significant amount of price pressures, which could leave the Fed still signaling that more rate hikes could be coming.
The market, on the other hand, is projecting that the Fed will be forced to cut rates later in the year. So, a more dovish statement or messaging from Powell in the post-rate presser would align better with market expectations. Because of the strong consensus for later forecasts, it's quite likely that any strong reaction to the FOMC decision would fade relatively quickly.
What are the options?
The preferred measure of inflation for the Fed is the core PCE change. That has remained consistent since December of last year at, or slightly above, 4.6%. That's more than double the target of 2.0%, but more importantly, it's not coming down. Meaning that the Fed can interpret it as there is a need for more hiking to get inflation back in line.
What the Fed fears the most at the current juncture is initiating a pause, and then seeing inflation rise again. Which would force them to raise rates at a faster pace to control inflation. They would see this as losing "credibility" in the fight against inflation. The Fed believes that inflation is controlled by expectations, so pausing at the "wrong" time is a major concern. That could incline the scales in favor of another rate hike and keep the door open for rate hikes after that. But, such a stance would likely be interpreted as "hawkish" by a market that's pricing in a pause followed by rate cuts later in the year.
What about the banking crisis?
Higher rates are seen as the genesis of the current banking crisis, and the Fed pausing is seen as a way to assist banks that are struggling with low-yield assets in a high-yield environment. On the other hand, the Fed pausing for that reason could cause another crisis of confidence in the banking system, as it would be interpreted as the regulator knowing something the market does not. So far, the market has taken the second largest bank collapse and the fourth in under two months with relative calm.
The other factor, as explained previously, is that the banking crisis has the effect of tightening monetary policy. Which means that the Fed is under less pressure now to raise rates, and might be able to control inflation without taking action. This is the reason cited by the small number of people who argue that the Fed might pause at the next meeting.
Powell will be asked about the banking situation during the post-rate decision press conference if he doesn't address it in his prepared remarks. How much weight that has in the FOMC decision is likely to be the determinant factor for whether traders start pricing in another hike for June. The less talk about the banking situation, the more likelihood of another hike. The more talk of the banking situation, the more likely traders will expect cuts later in the year.
NZD/USD: Waiting for the Second Part of Bearish Intermediate Impulse (C)
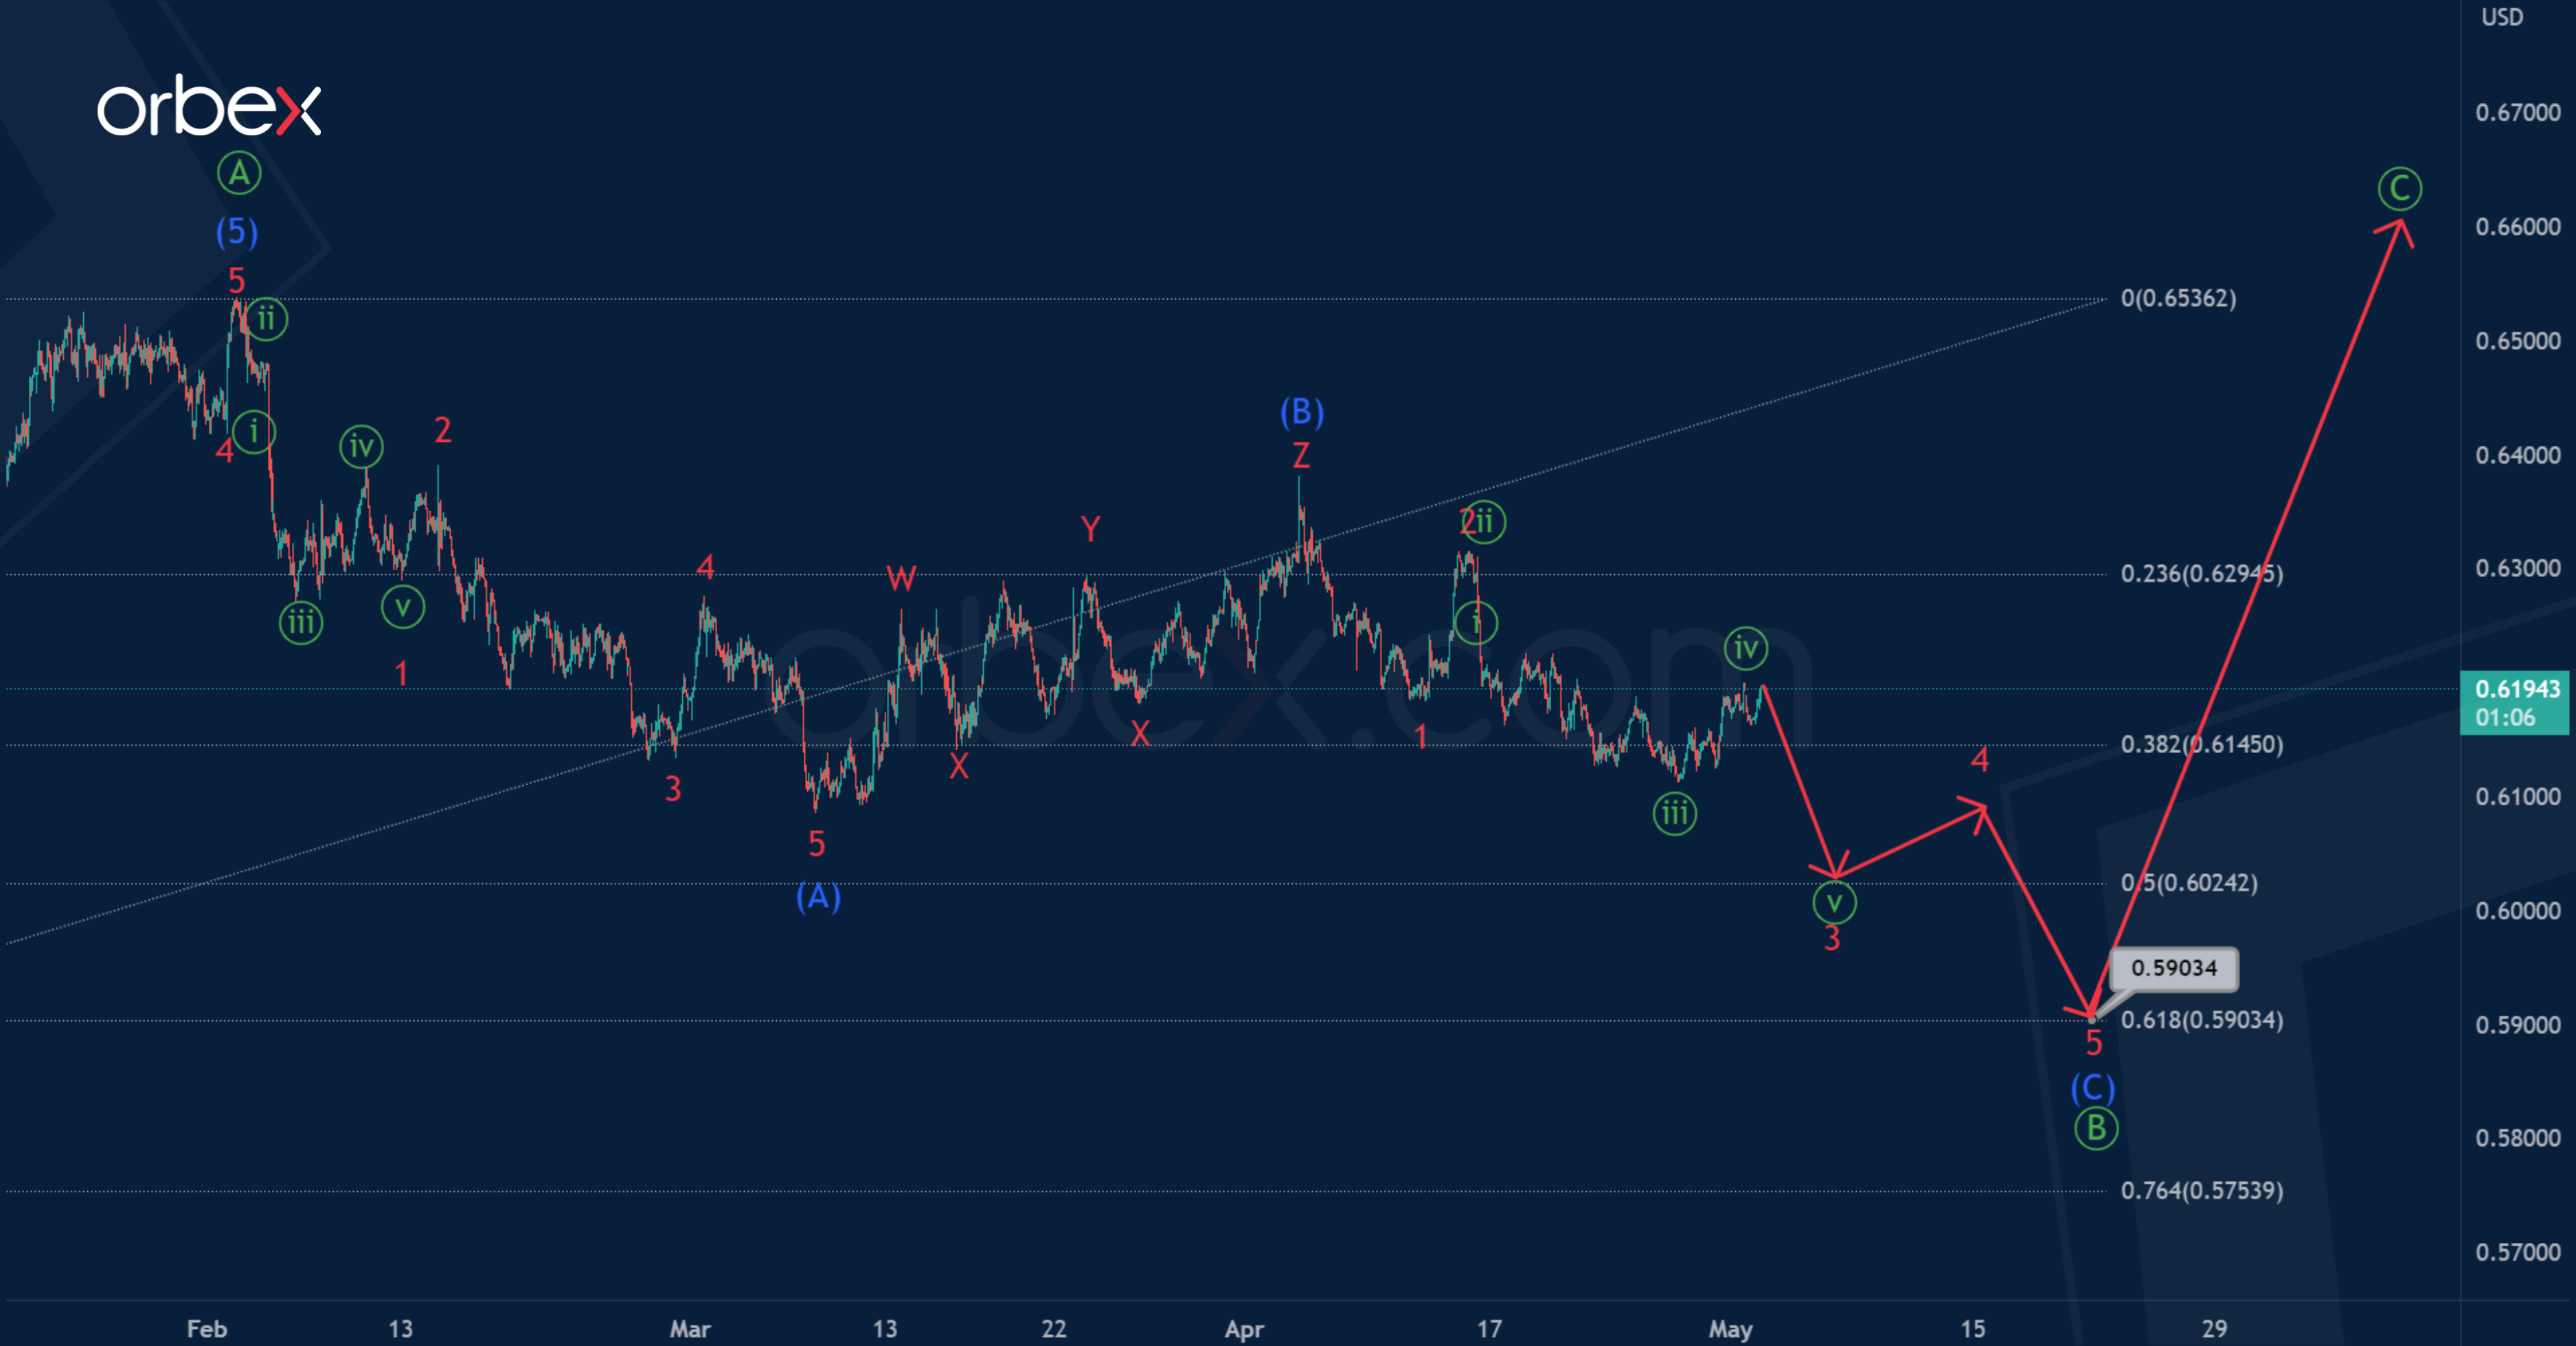
The NZDUSD pair seems to be forming a correction zigzag pattern consisting of three primary waves.
The first impulse wave has been successfully completed. The bearish correction is under development, its structure is similar to the standard zigzag (A)-(B)-(C). Impulse (A) and correction (B) can be considered completed.
In the near future, the price may drop in the intermediate impulse (C) to 0.590. At that level, primary correction will be at 61.8% of actionary wave.
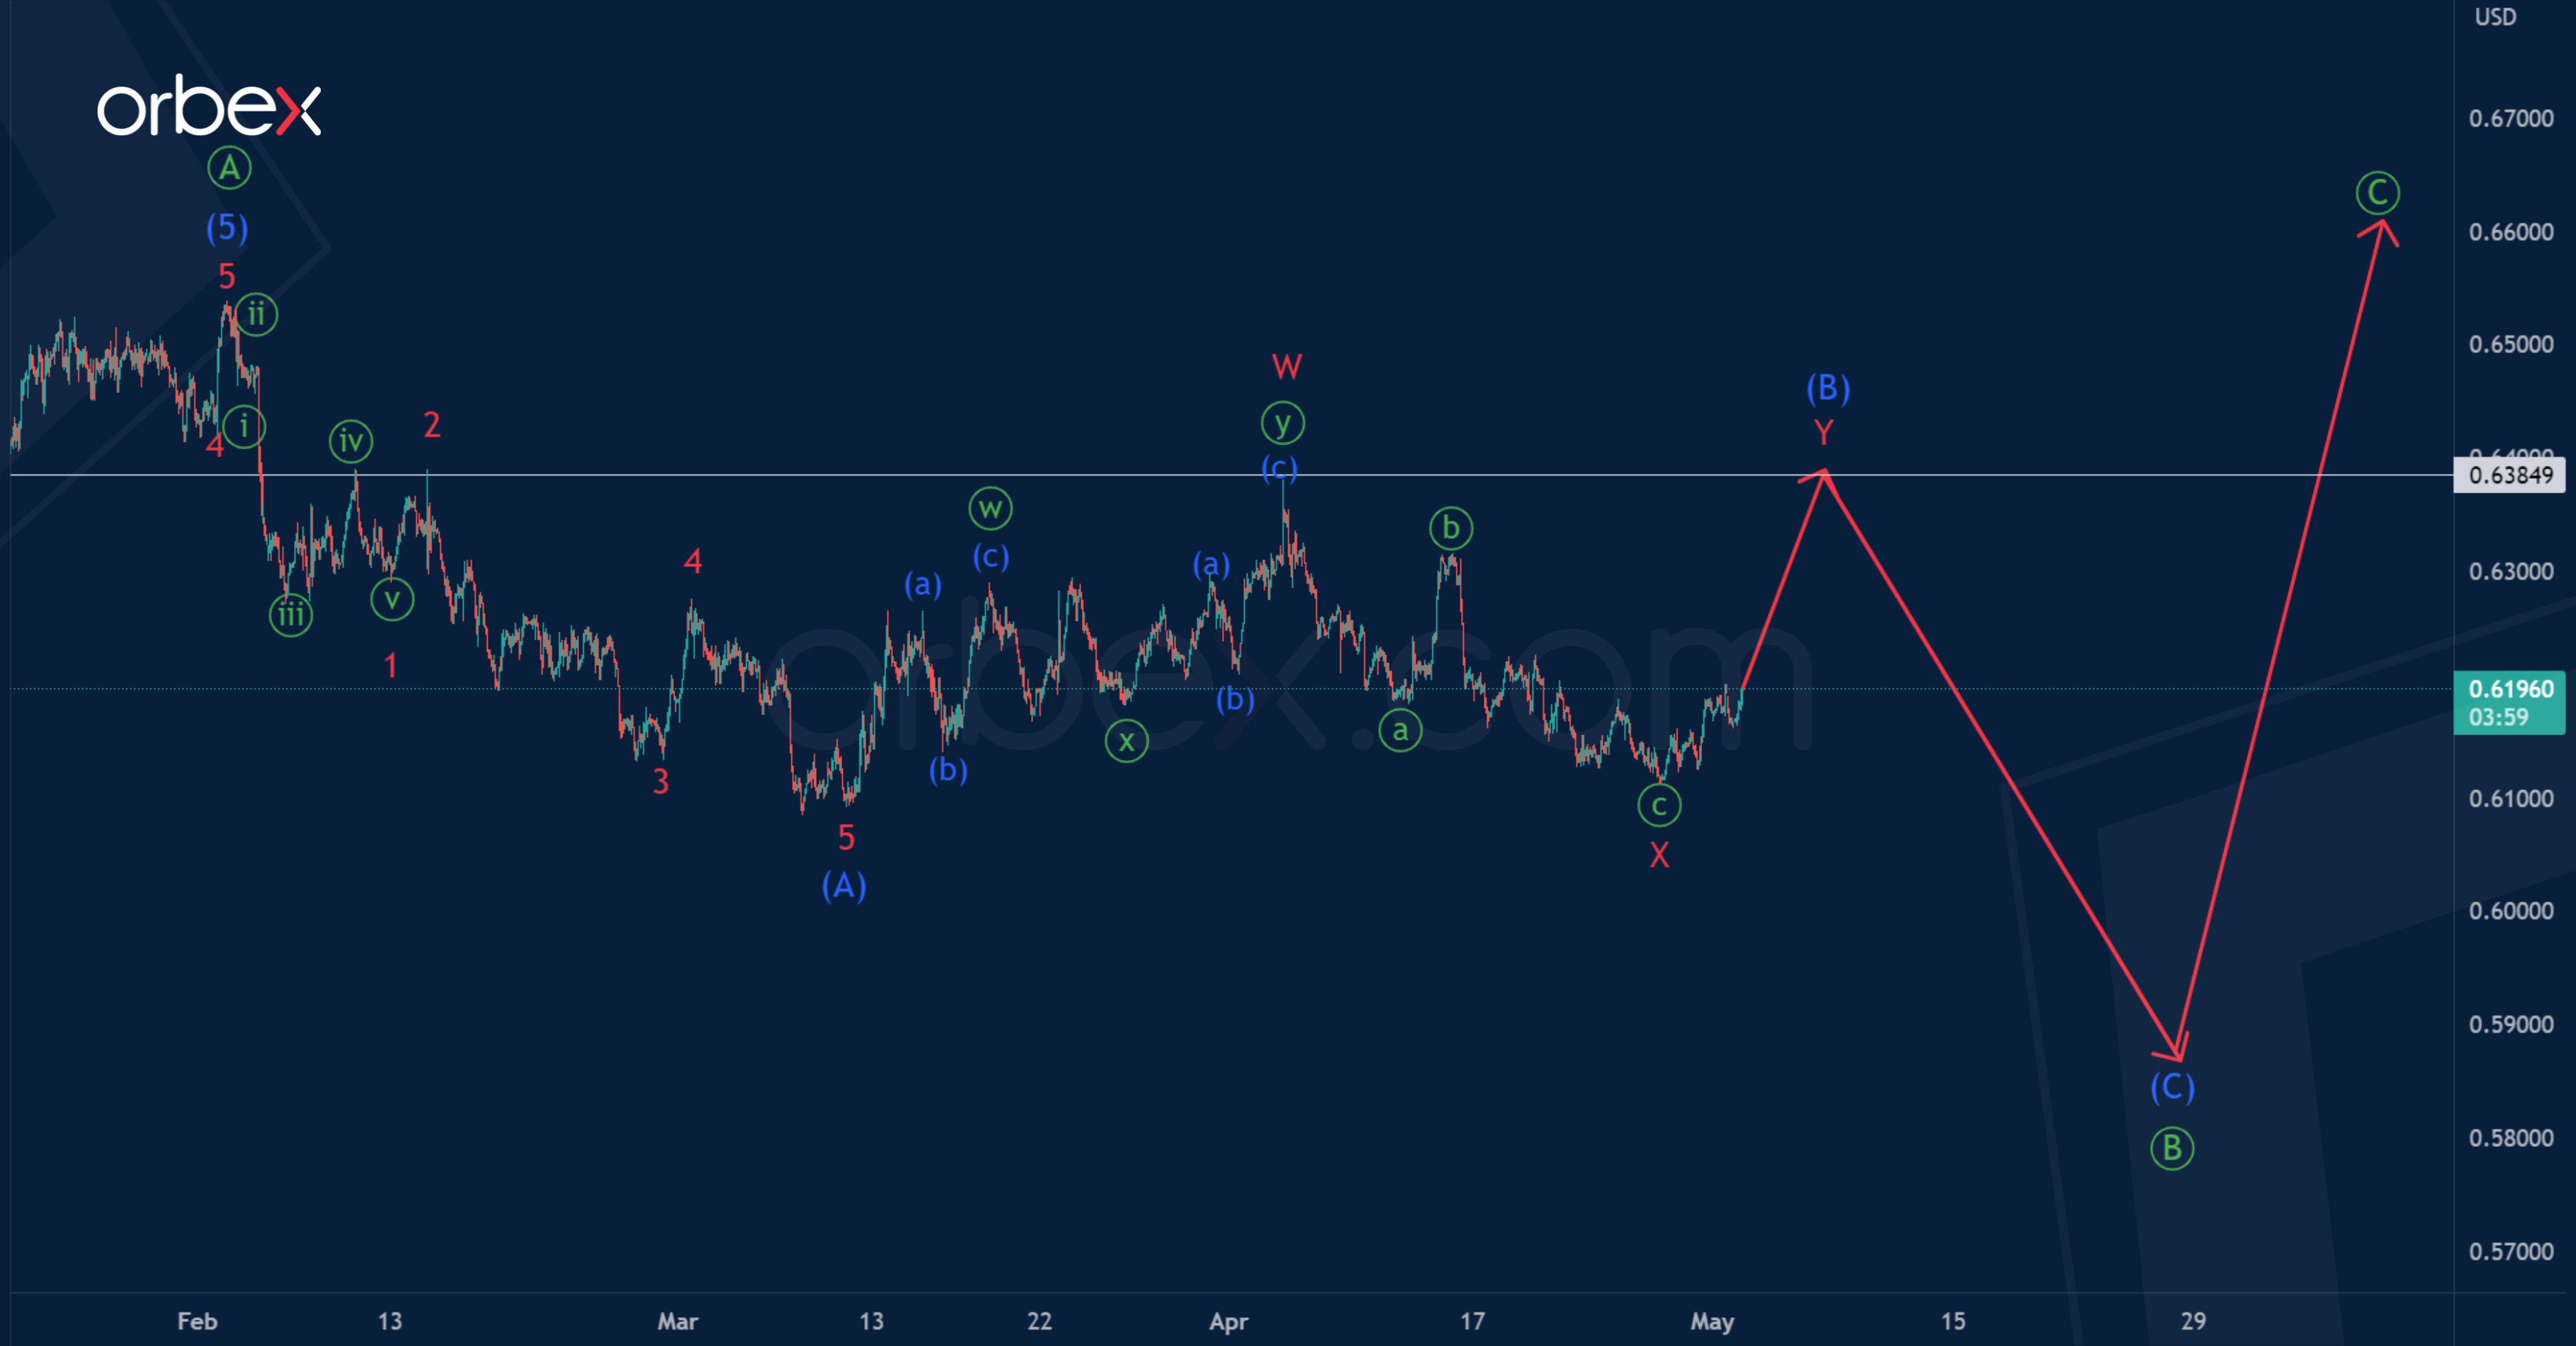
However, it is worth paying attention to the alternative option, in which only the first impulse wave (A) is completed inside the primary correction, and the intermediate correction (B) most likely continues to form.
It is possible that the correction (B) takes the form of a minor double three, inside which the first two parts could end. In the near future, market participants may observe a rise in the price in the final actionary wave Y.
It is assumed that the price will rise to 0.638, marked by the actionary wave W.
USD/JPY Mid-Day Outlook
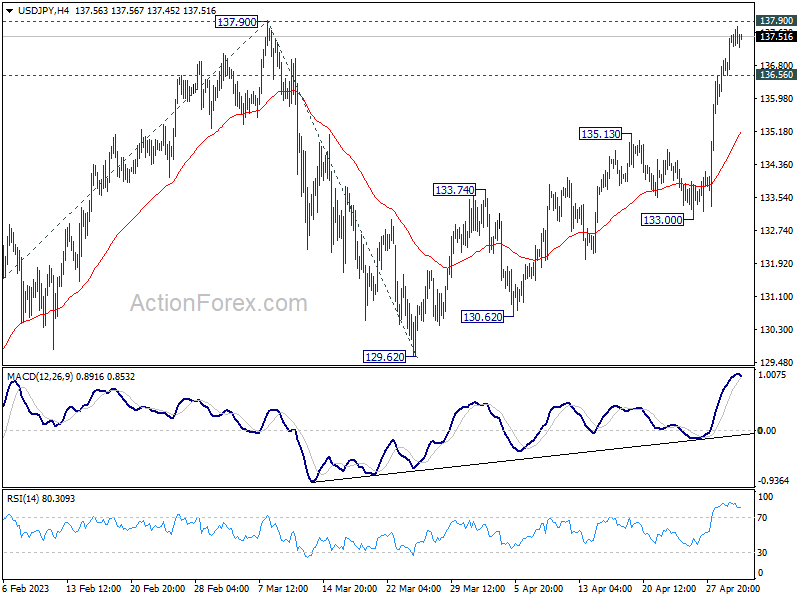
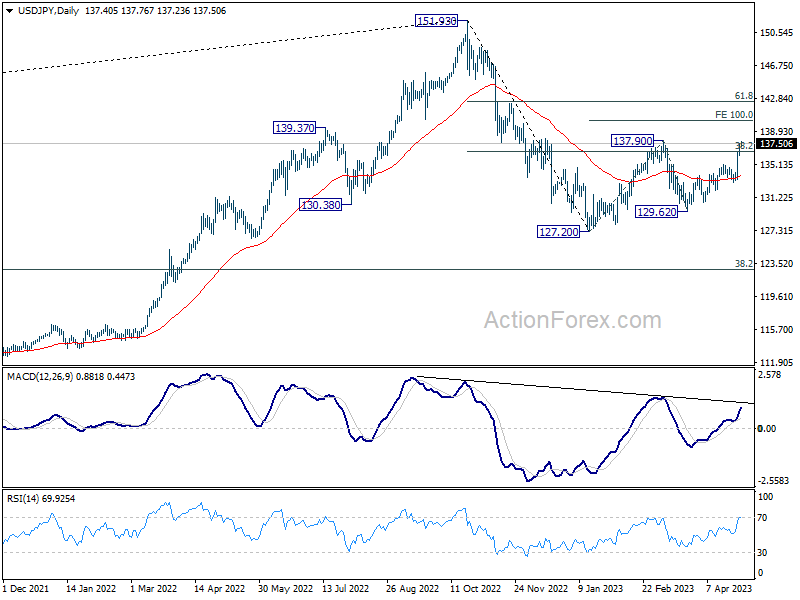
Daily Pivots: (S1) 136.57; (P) 137.05; (R1) 137.96; More...
Intraday bias in USD/JPY remains on the upside with focus on 137.90 resistance. Decisive break there will resume whole rebound from 127.20, and target 100% projection of 127.20 to 137.90 from 129.62 at 140.32. On the downside, below 136.56 support will turn intraday bias remains neutral first. But further rally will remain in favor as long as 135.13 resistance turned support holds, in case of retreat.
In the bigger picture, price actions from 151.93 high are currently seen as a corrective pattern to the long term up trend. The first leg should have completed at 127.20. Rebound from there is seen as the second leg. Sustained break of 31.8% retracement of 151.93 to 127.20 at 136.34 will bring stronger rebound to 61.8% retracement at 142.48. Meanwhile, break of 129.62 will argue that the third leg is starting through 127.20 low.
USD/CHF Mid-Day Outlook
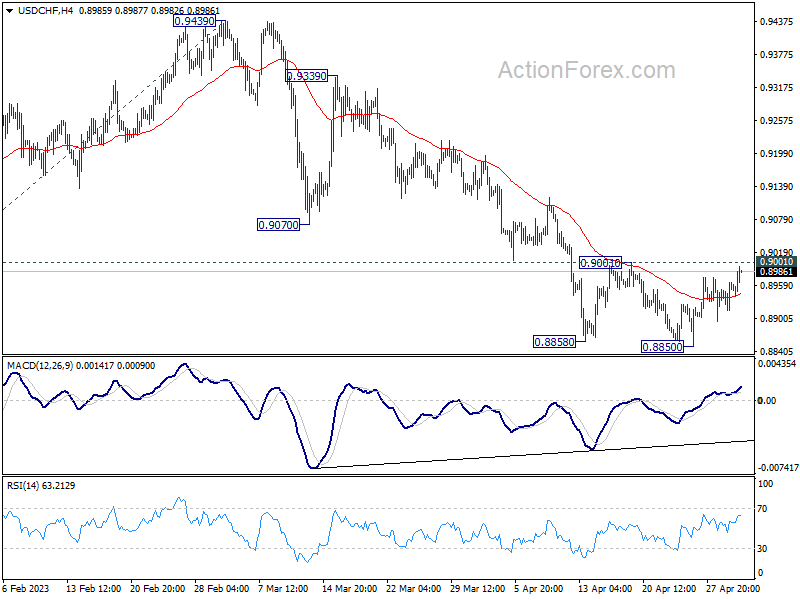
Daily Pivots: (S1) 0.8926; (P) 0.8946; (R1) 0.8977; More...
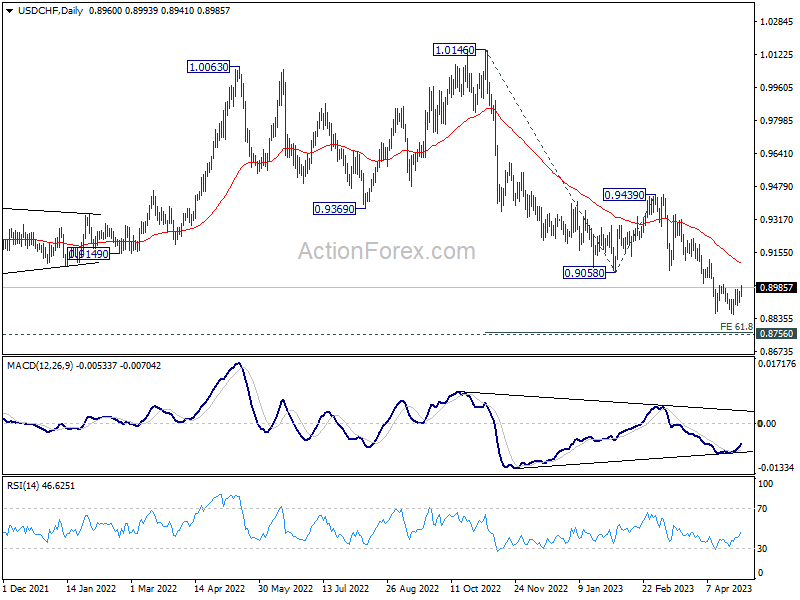
Intraday bias in USD/CHF remains neutral and outlook is unchanged. On the upside, decisive break of 0.9001 resistance should confirm short term bottoming at 0.8850. Intraday bias will be back on the upside 55 D EMA (now at 0.9102). Sustained break there will be a strong sign of bullish reversal. On the downside, break of 0.8850 will resume larger fall from 1.0146, to 61.8% projection of 1.0146 to 0.9058 from 0.9439 at 0.8767, which is close to 0.8756 long term support. Strong support is expected there to bring rebound, at least on first attempt.
In the bigger picture, fall from 1.1046 (2022 high) is in progress for 0.8756 support (2021 low). But overall, this fall is still seen as a leg in the long term range pattern from 1.0342 (2016 high). So, downside should be contained by 0.8756 to bring reversal. Sustained break of 0.9058 support turned resistance will be the first sign of medium term bottoming. However, decisive break of 0.8756 will carry larger bearish implications.
GBP/USD Mid-Day Outlook
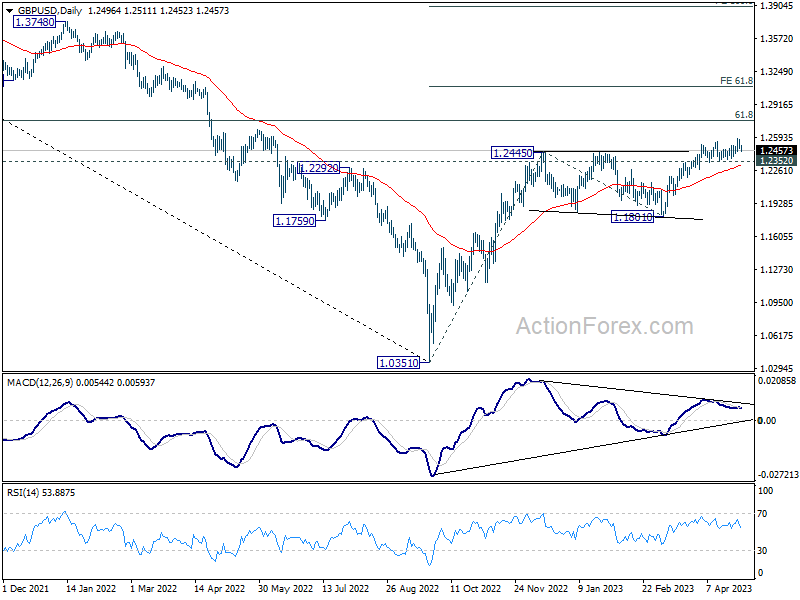
Daily Pivots: (S1) 1.2461; (P) 1.2516; (R1) 1.2551; More...
Intraday bias in GBP/USD stays neutral for consolidation below 1.2582. Outlook will stay bullish as long as 1.2352 support holds. On the upside, above 1.2582 will target 1.2759 fibonacci level first. Firm break there will target 61.8% projection of 1.0351 to 1.2445 from 1.1801 at 1.3095. However, considering bearish divergence condition in 4H MACD, break of 1.2352 will confirm short term topping, and turn bias back to the downside for deeper pull back.
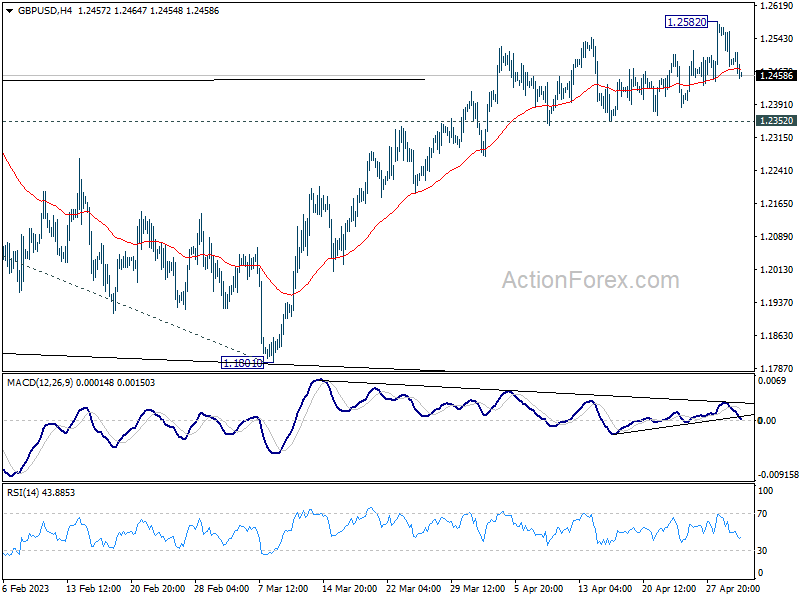
In the bigger picture, the rise from 1.0351 medium term term bottom (2022 low) is in progress for 61.8% retracement of 1.4248 (2021 high) to 1.0351 at 1.2759. Sustained break there will add to the case of long term bullish trend reversal. Further break of 61.8% projection of 1.0351 to 1.2445 from 1.1801 at 1.3095 could prompt upside acceleration to 100% projection at 1.3895. For now, this will remain the favored case as long as 1.1801 support holds, even in case of deep pull back.
EUR/USD Mid-Day Outlook
Daily Pivots: (S1) 1.0949; (P) 1.0992; (R1) 1.1021; More...
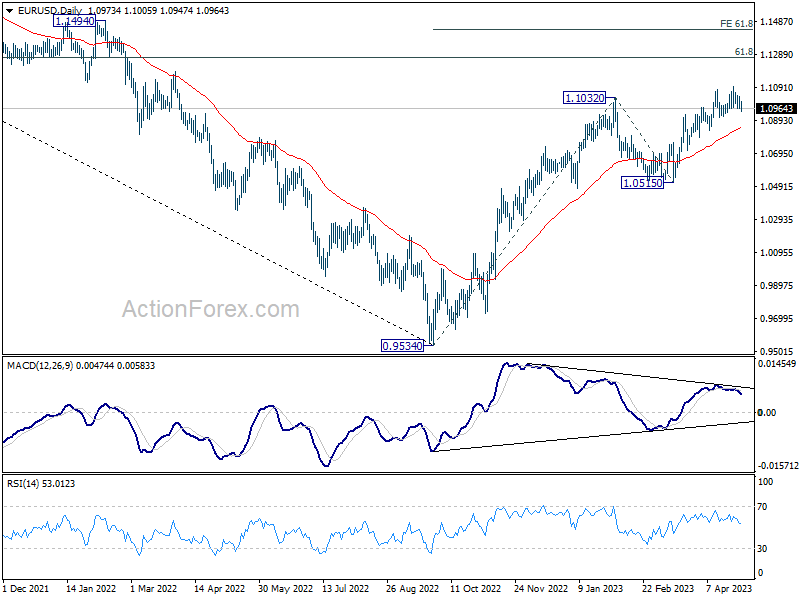
EUR/USD is staying in sideway consolidation below 1.1094 and intraday bias remains neutral. Further rally is expected as long as 1.0908 support holds. Break of 1.1094 will resume larger up trend to 1.1273 fibonacci level. Break there will target 61.8% projection of 0.9534 to 1.1032 from 1.0515 at 1.1441 However, considering bearish divergence condition in 4H MACD, break of 1.0908 support will indicate short term topping and turn bias back to the downside.
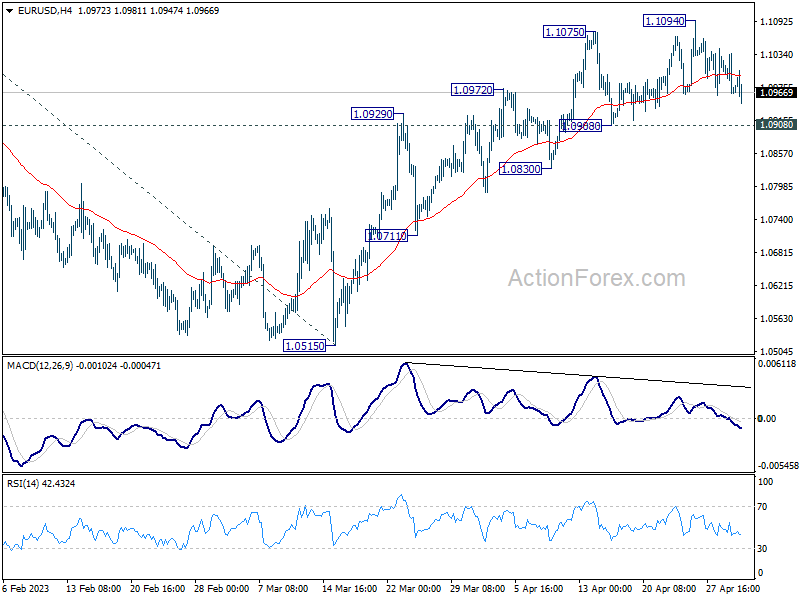
In the bigger picture, rise from 0.9534 (2022 low) is in progress for 61.8% retracement of 1.2348 (2021 high) to 0.9534 at 1.1273. Sustained break there will solidify the case of bullish trend reversal and target 1.2348 resistance next (2021 high). This will now remain the favored case as long as 1.0515 support holds, even in case of deeper pull back.