Sample Category Title
EUR/CHF Daily Outlook
Daily Pivots: (S1) 0.9785; (P) 0.9805; (R1) 0.9836; More...
Range trading continues in EUR/CHF and intraday bias remains neutral. Risk will stay on the upside as long as as long as 0.9774 short term bottom holds. Current development suggests that whole correction from 1.0095 has completed at 0.9704. Break of 0.9878, and sustained trading above 55 D EMA (now at 0.9869) will affirm this bullish case, and target 0.9995 resistance next.
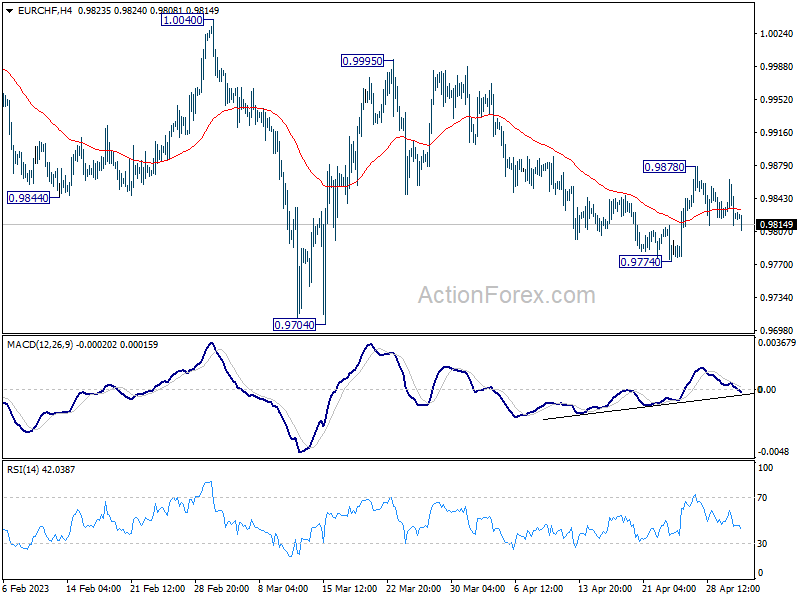
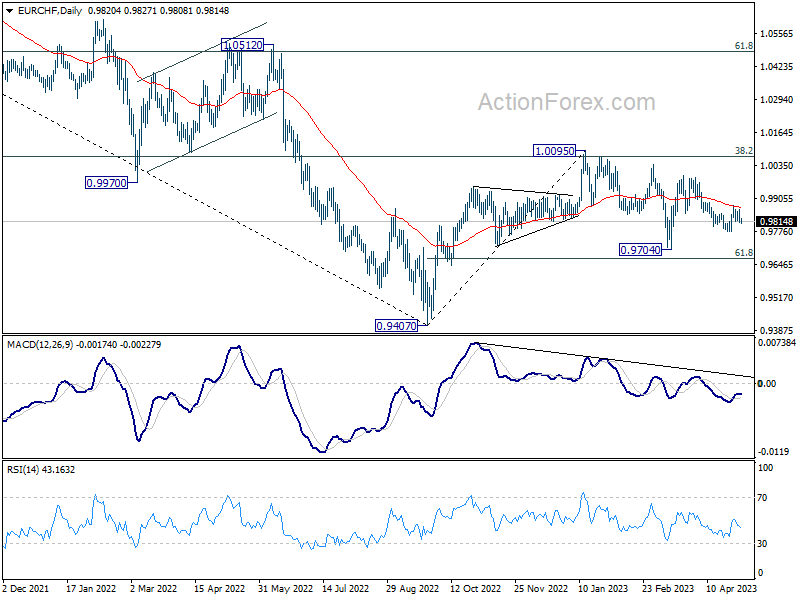
In the bigger picture, prior rejection by 55 W EMA (now at 0.9972) and 38.2% retracement of 1.1149 to 0.9407 at 1.0072 suggests that medium term outlook is staying bearish. That is, down trend from 1.2004 is not completed yet and is in favor to resume through 0.9407 at a later stage. However, decisive break of 1.0095 resistance will raise the chance of bullish trend reversal. Rise from 0.9407 should then target 1.0505 cluster resistance (2020 low at 1.0505, 61.8% retracement of 1.1149 to 0.9407 at 1.1484).
EUR/USD Restarts Increase While USD/JPY Corrects After Rally
EUR/USD started a fresh increase above the 1.1000 resistance. USD/JPY rallied significantly above 137.00 and recently started a downside correction.
Important Takeaways for EUR/USD and USD/JPY
- The Euro is rising and gaining pace above the 1.1000 resistance zone.
- There was a break above a key bearish trend line with resistance near 1.1000 on the hourly chart of EUR/USD at FXOpen.
- USD/JPY started a major rally above the 136.00 and 137.00 levels.
- There was a break below a key bullish trend line with support near 137.45 on the hourly chart at FXOpen.
EUR/USD Technical Analysis
On the hourly chart of EUR/USD at FXOpen, the pair formed a base above the 1.0945 level. The Euro started a fresh increase above the 1.0965 resistance against the US Dollar.
There was a move above a key bearish trend line with resistance near 1.1000 and the 50-hour simple moving average. The pair is now trading above the 50% Fib retracement level of the downward move from the 1.1095 swing high to the 1.0972 low.
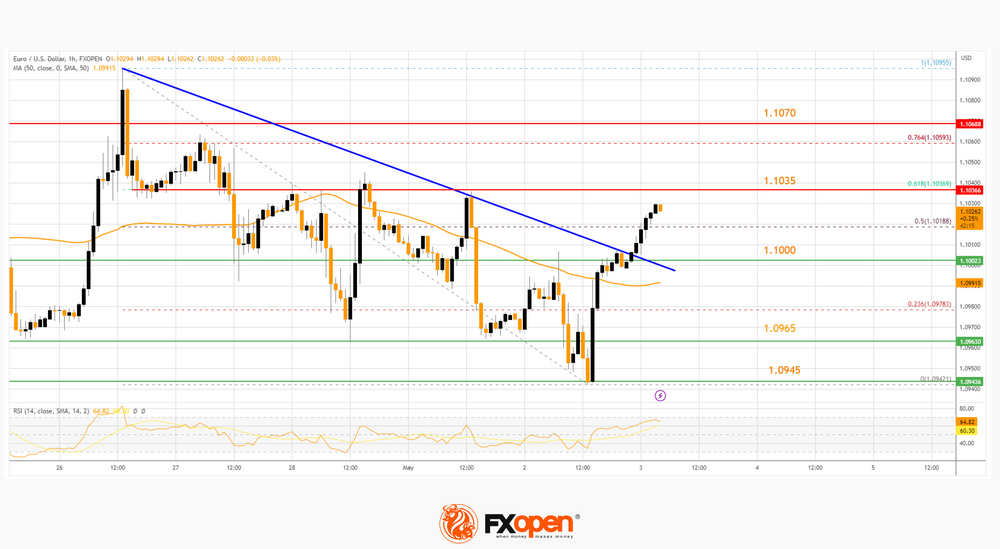
It is now facing resistance near the 61.8% Fib retracement level of the downward move from the 1.1095 swing high to the 1.0972 low at 1.1035.
The next major resistance is near the 1.1070 level. An upside break above 1.1070 could set the pace for another increase considering the hourly RSI is positioned nicely above 50. In the stated case, the pair might visit 1.1120. Any more gains might send the pair towards 1.1150.
If not, EUR/USD might start another decline from 1.1035. Initial support sits near the 1.1000 level. The first major support is near the 1.0965 level, below which the pair could start a major decline. In the stated case, the pair might dive toward the 1.0880 support zone.
USD/JPY Technical Analysis
On the hourly chart of USD/JPY at FXOpen, the pair started a fresh increase from the 133.00 zone. It gained bullish momentum and was able to clear the 135.00 resistance.
Finally, there was a move above 137.00 and the pair spiked above 137.50. A high is formed near 137.77 and the pair is now correcting gains. There was a minor decline below a break below a key bullish trend line with support near 137.45.
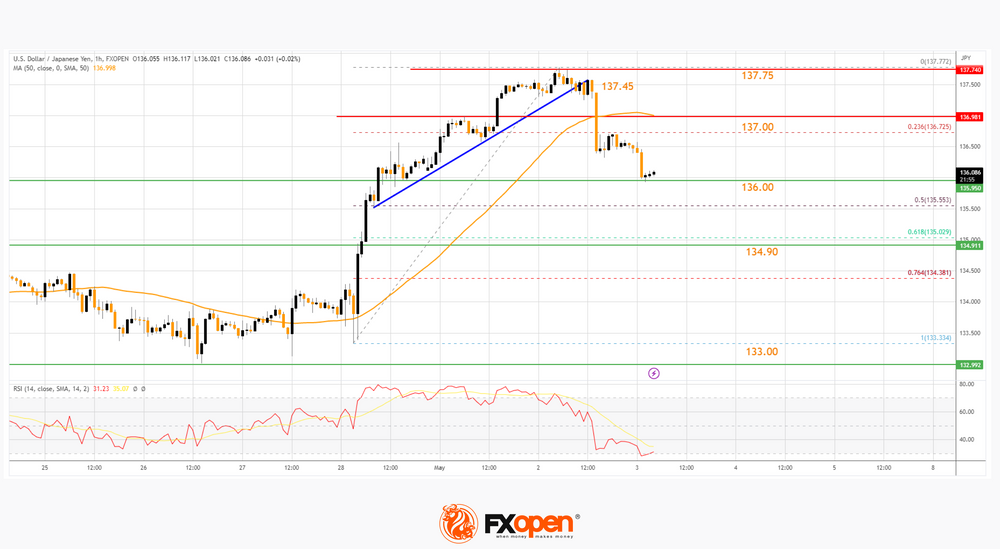
The pair declined below the 23.6% Fib retracement level of the upward move from the 130.33 swing low to the 137.77 high. It is now consolidating near the 136.00 support and trading well below the 50-hour simple moving average.
If there is a downside break below the 136.00 support, USD/JPY might extend losses. The next major support is near the 61.8% Fib retracement level of the upward move from the 130.33 swing low to the 137.77 high at 134.90, below which the pair could start a major decline.
In the stated case, the pair might dive toward the 133.00 support. Any more losses might send the USD/JPY pair toward the 132.15 support.
On the upside, the pair is facing resistance near the 50-hour simple moving average at 137.00. If there is a close above the 50-hour simple moving average, the pair could revisit 137.75. The next major resistance is near 138.00, above which the pair could test 138.80.
S&P 500 Analysis: Worrisome Dynamics Ahead of Fed Decision
On the first of May, the US stock market turned out to be optimistic: the S&P 500 index exceeded the April maximum and approached the February maximum. The growth of the weekend was facilitated by the resolution of the crisis with the First Republic bank, which was bought by JPMorgan. According to former Treasury Secretary Larry Summers, most of the problems in the banking sector are over.
The opinion of Fundstrat analysts added to the positive. They indicated that the S&P 500 is up 9% YTD, has been in an uptrend for the past 7 months and has posted 2 quarters of growth in a row. This has never happened in a bear market, and according to the statistics, it is over. Analysts expect the index to return to highs at 4,750 by early 2024.
However… Yesterday, May 2, weak Job Openings data was published (actual – 9.59 million open vacancies, forecast – 9.74M, a month ago – 9.97M, a year ago – 11.5M). The sharp decline in supply in the US labor market led to a fall in stock prices and a rise in gold prices — presumably, investors preferred safer gold over stocks, as their fears of a recession intensified again against the backdrop of a weak labor market.
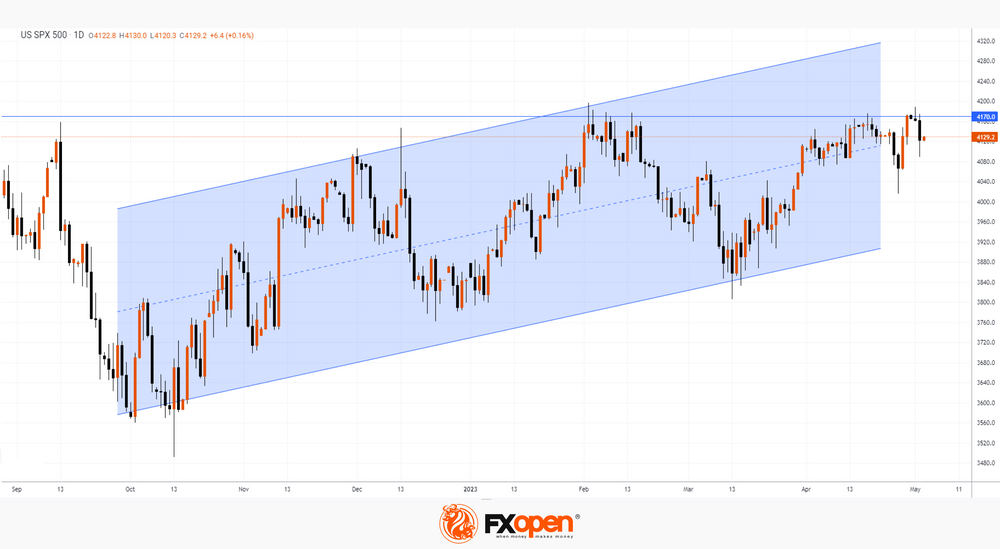
At the same time, the chart shows that the key resistance at 4170 continues to be relevant (as we wrote earlier, this level originates as early as 2022).
As a reminder, today we expect:
→ US release Fed interest rate decision at 21:00 (GMT+3)
→ Press conference US Federal Open Market Committee (FOMC) at 21:30 (GMT+3)
Get ready for bursts of volatility. Perhaps yesterday's bearish dynamics will intensify, and there will be no trace of the May Day positive.
USD Struggles to Bounce
AUD/USD tests key resistance
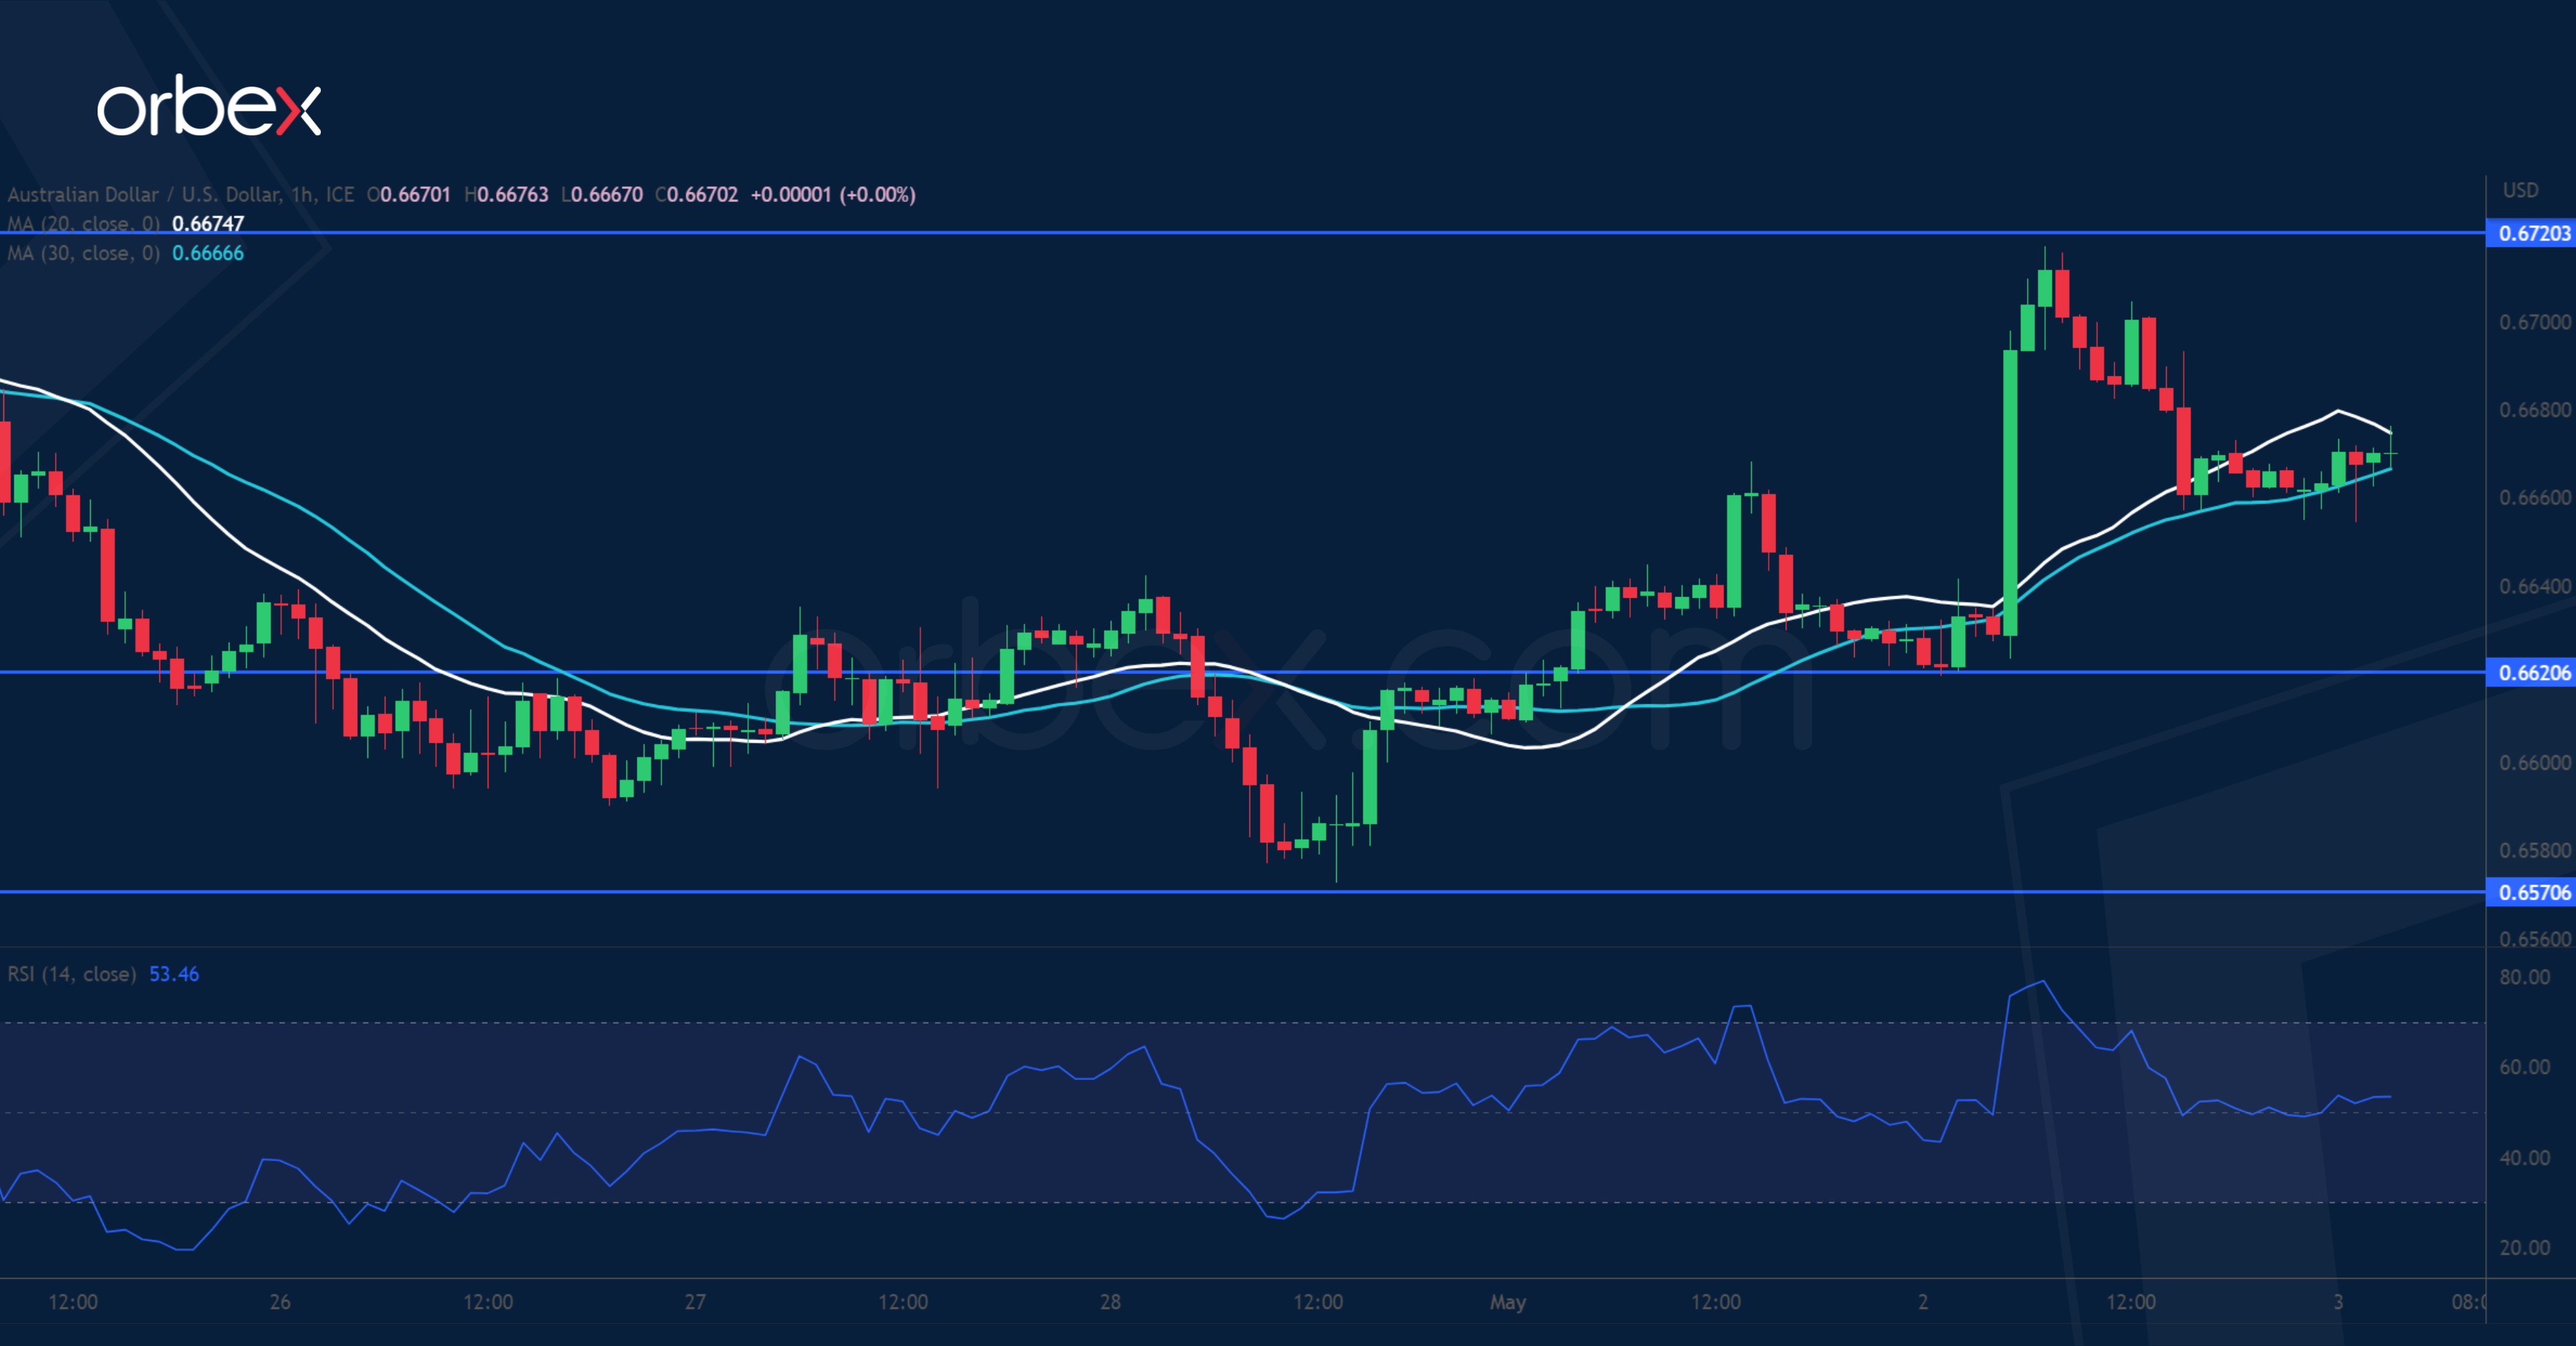
The Australian dollar soared after a hawkish RBA pressed on with a surprise 25 basis-point rate hike. The pair jumped above the first supply area of 0.6660 and might give the bulls a fighting chance after the selling pressure had seemingly taken over. The support-turned-resistance of 0.6720 is an important hurdle and its breach would pave the way for a more meaningful recovery above the recent peak at 0.6790. On the downside, 0.6620 is the immediate support and the double bottom at 0.6570 a critical floor.
NZD/USD rebounds higher
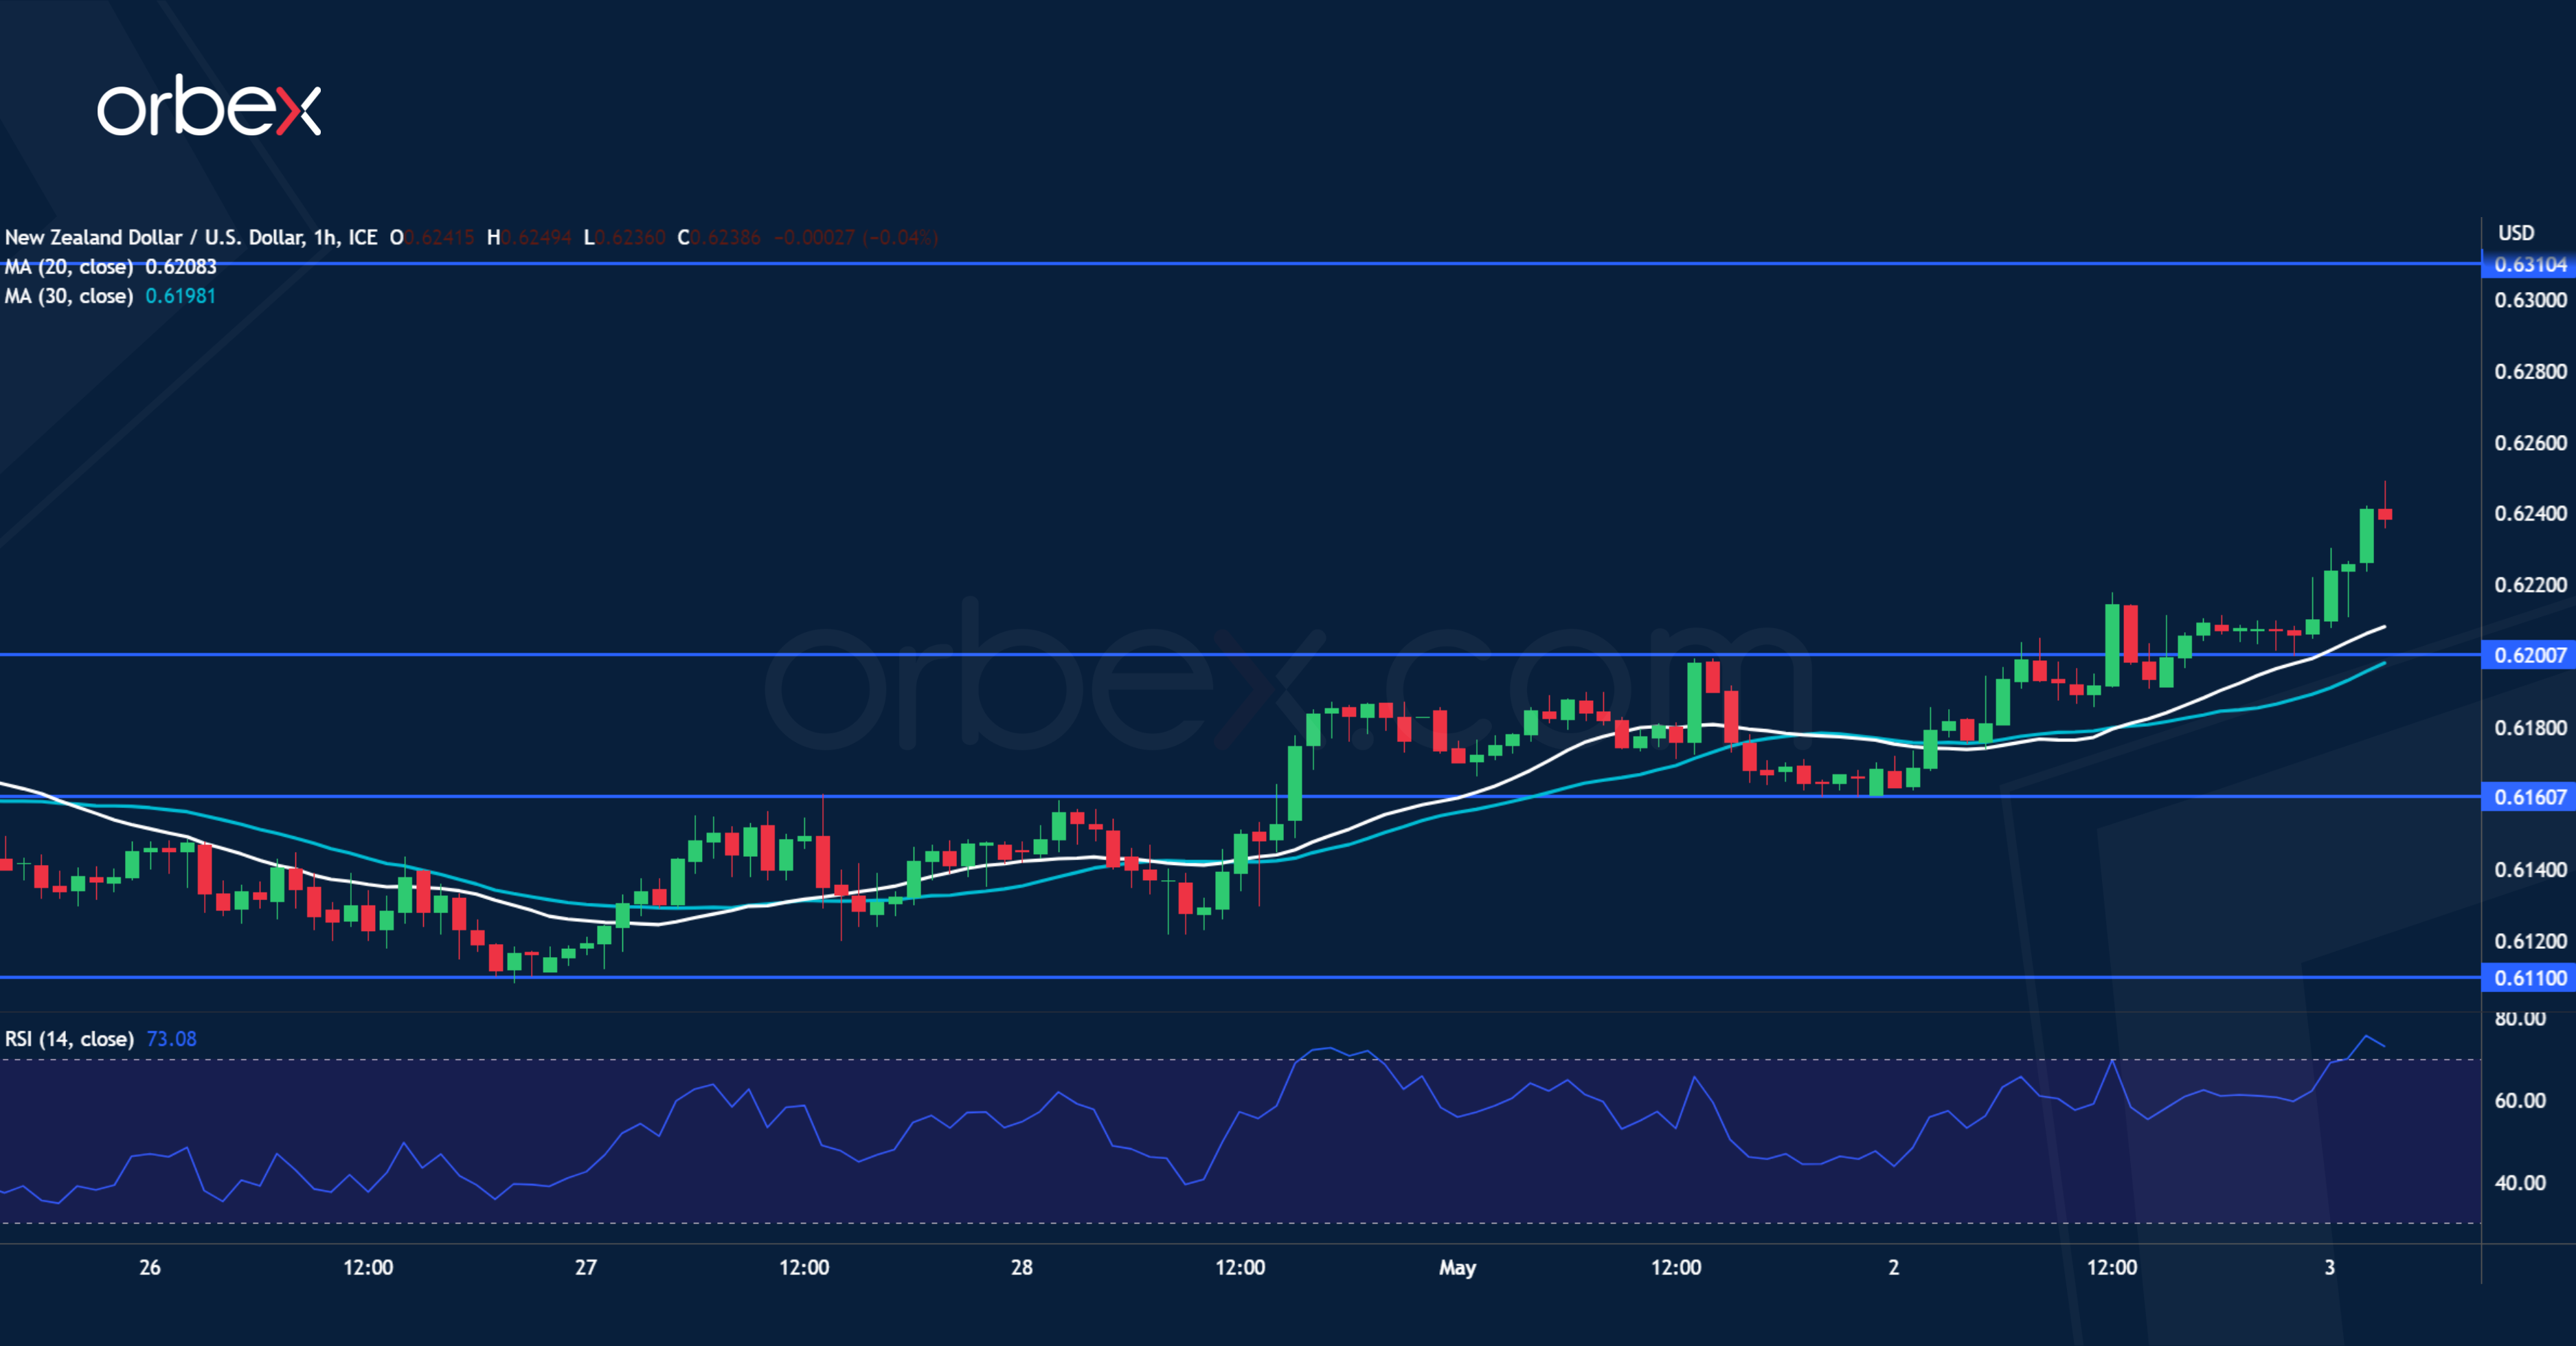
The New Zealand dollar jumped after the Q1 unemployment rate came out lower than expected. On the daily chart, the pair is striving to steer away from the danger zone near 0.6110 as a drop below this double bottom could trigger a new round of sell-off. A close above 0.6220 is another encouraging sign, prompting sellers to cover their shorts and turning 0.6200 in the area into a fresh support. The RSI’s overbought condition may cause a limited pullback then the daily resistance at 0.6310 is the next target.
UK 100 breaks support
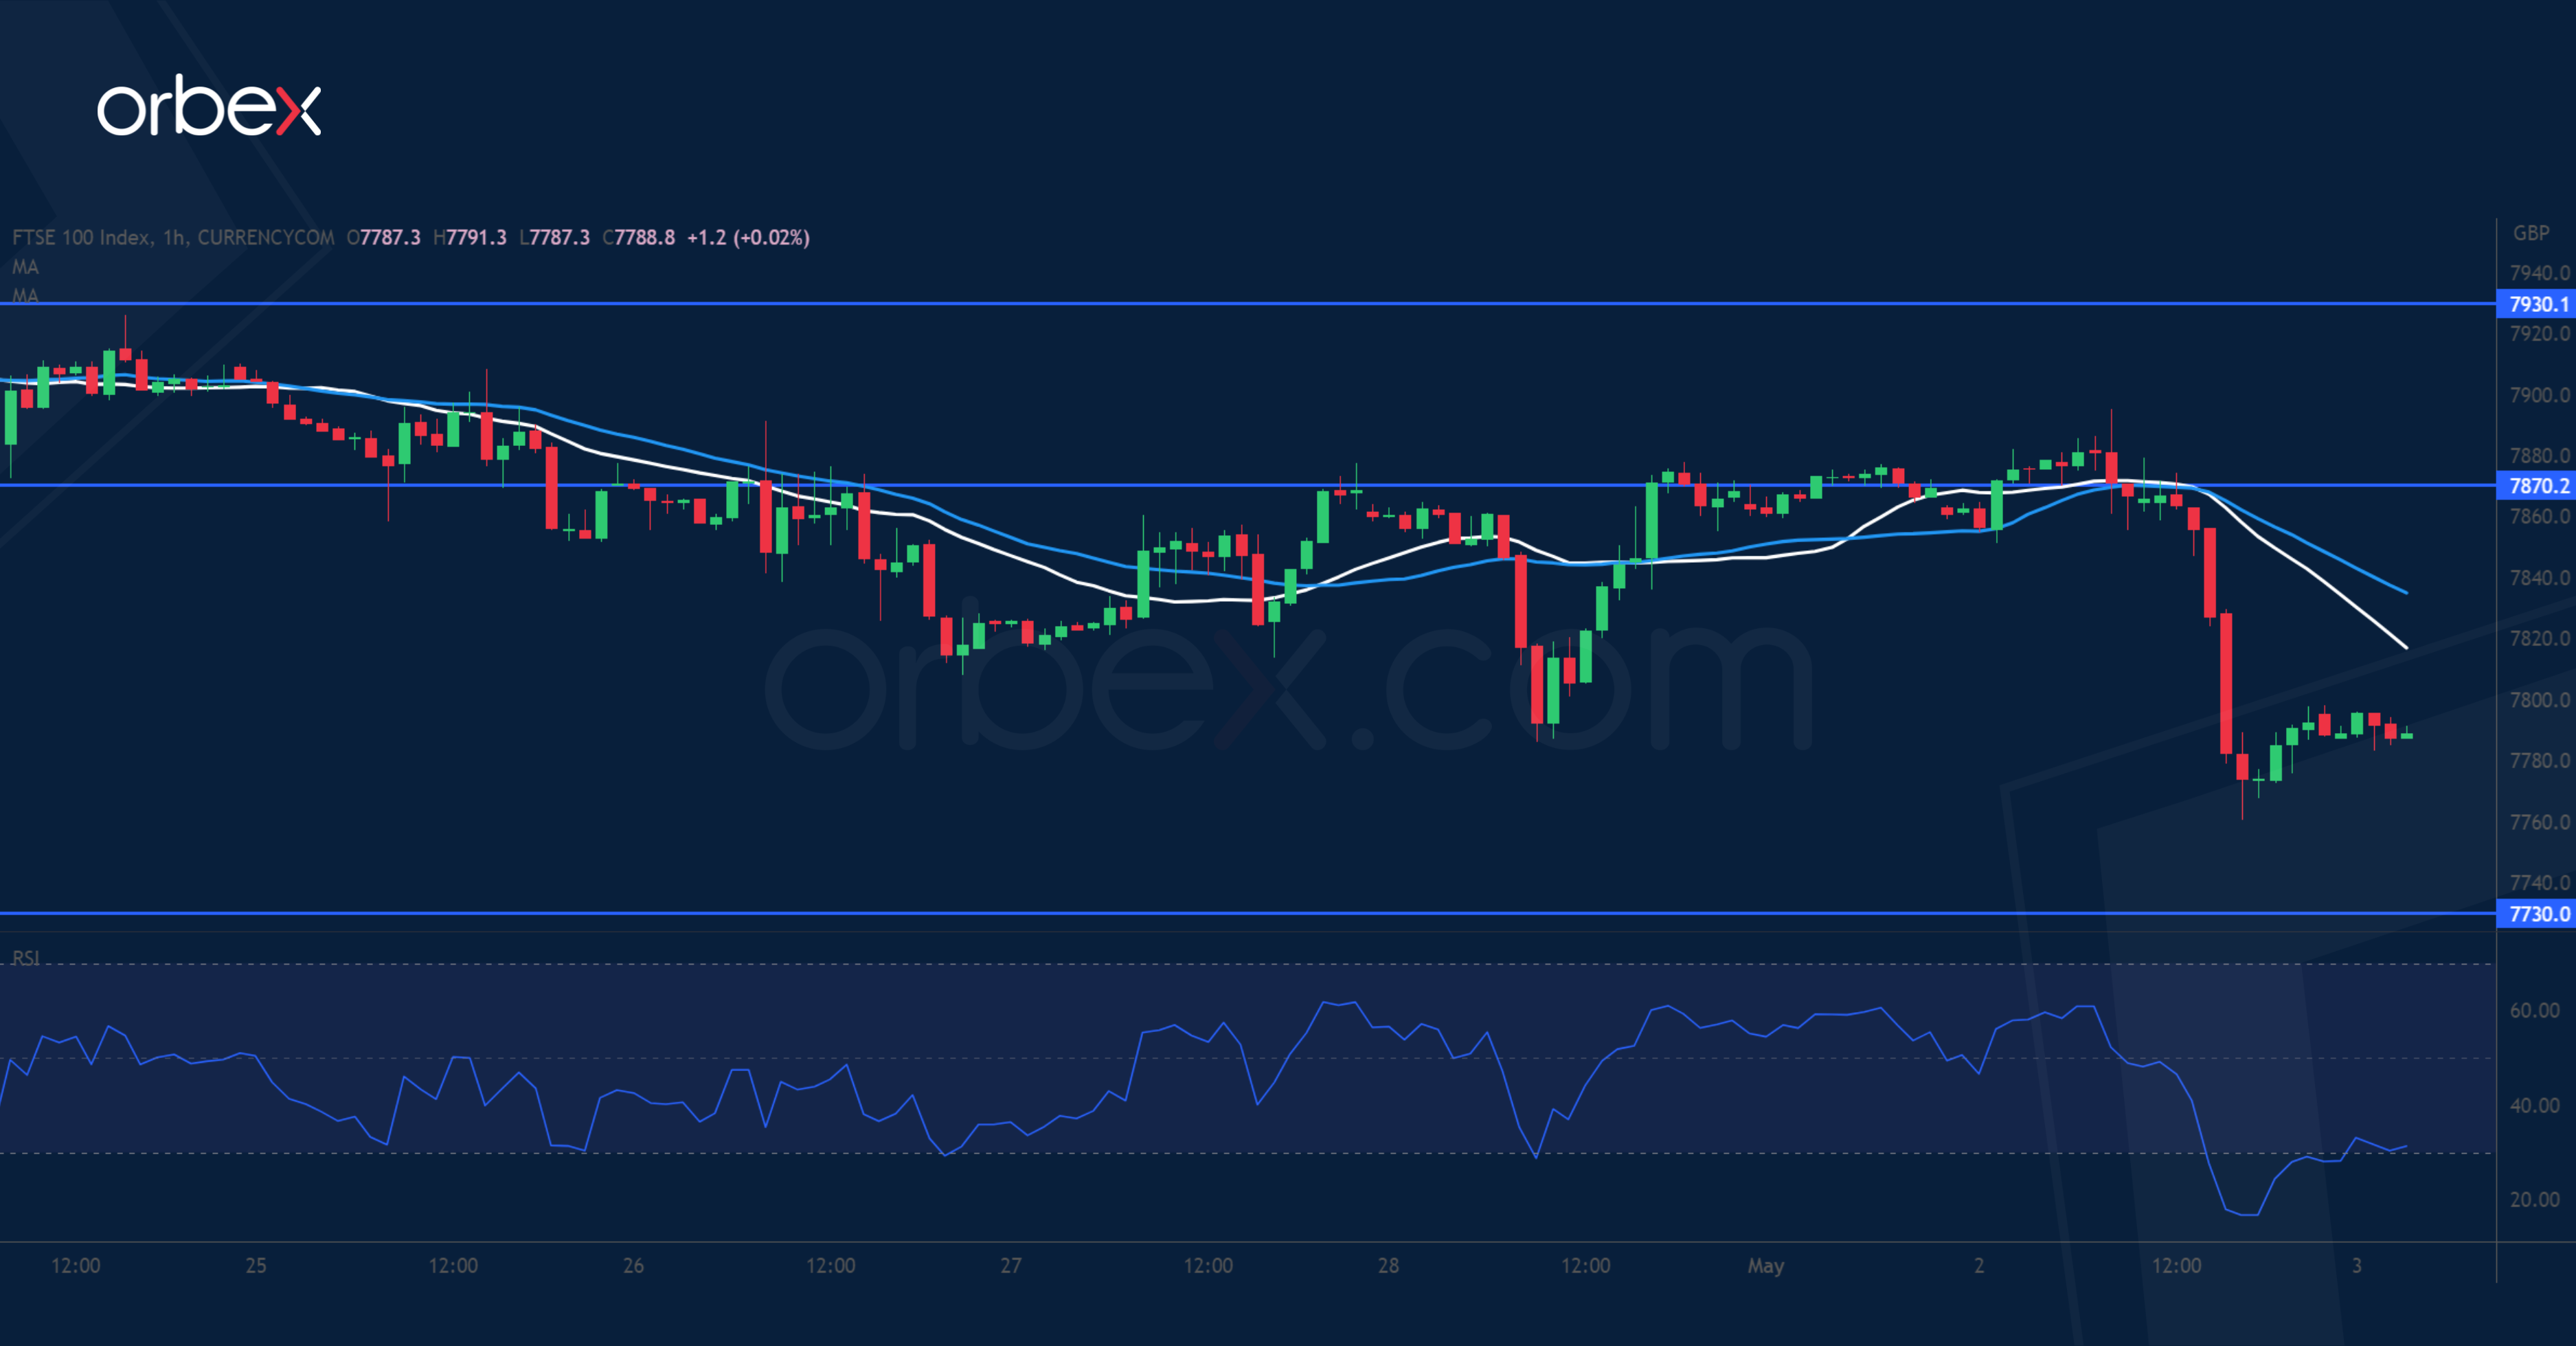
The FTSE 100 tumbled as energy stocks struggled amid subdued risk appetite. The bounce off March’s lows showed solid interest in keeping the bullish bias intact in the medium-term but could use some breathing room after reaching the supply zone 7930-7950. A decisive break below 7790 on the 20-day SMA suggests that a correction could be on its way and prompts more short-term buyers to bail out. 7730 is the next support as the RSI goes oversold. 7870 is the first hurdle to lift before the uptrend could carry on.
Fed to Hike Rates as US Bank Turmoil Persists
Banking relief after JP Morgan swallowed the First Republic Bank on Monday remained short-lived, as some regional bank stocks, like Valley National Bankcorp lost another 3%, Western Alliance Corporation another 15%, and PacWest Bancorp another 28%, even though it had said last week that the deposit outflows had slowed in March.
As such, SPDR’s US regional bank ETF was down by more than 6%.
It means that, no, the US regional banking crisis is hard to wane, high interest rates are truly being felt and the latter will likely have a sizeable impact on credit lending, hence on economic activity.
That’s why US politicians now urge Federal Reserve (Fed) Chair Jerome Powell to stop hiking the interest rates. Elizabeth Warren and Bernie Sanders have reportedly written a letter to warn the Fed that the bank turmoil and the cumulative rate hikes leave the US economy ‘more vulnerable to an overreaction from the Fed’.
So maybe - but just maybe, the Fed will take that into account when it is expected to announce an additional, and perhaps the final 25bp hike at today’s decision time.
The Fed has been warned that keeping the rates steady as inflation rose was a bad idea. It is now warned that keeping its feet on gas as economy gives signs of suffering is a bad idea.
On the data front, the job openings data released yesterday in the US showed that the job vacancies in the US fell for the 3rd month, to 9.6mio. Job quits fell to levels before pandemic, and number of layoffs increased to 1.8mio in March. Due today, the ADP data is expected to show that the US economy added around 150’000 new private jobs in March, in line with what was printed a month earlier.
Treasuries, Gold gain
Bank stress and soft economic data fueled safe haven demand, and the expectation that the Fed would not carry on with rate hikes from next meeting – or at least, it won’t say it would!
The US 2-year yield slipped below 4%, gold rallied to $2020 per ounce, as the S&P500 fell more than 1%. Even big bank – which amass the deposit inflows that leave the regional banks, failed to convince yesterday – except for HSBC which announced the same day that its profit tripled following the Silicon Valley Bank (SVB) collapse, and a $2bn share buyback.
PS: And you know who else is rubbing its hands with this banking stress… it’s Apple! It launched a high yielding savings account for Apple Card holders last month, in association with Goldman - an account that pays an annual yield of 4.15%. That’s much better than the banks paying less than half a percent, and even better than your 10-year treasuries that are yielding at around 3.5% these days – and it’s risk-free. So you bet, Apple amassed nearly $1bn deposits in just four days, especially as money flew out of the US regional banks to find safer harbours.
ECB will likely go 25bp, as well
In Europe, there is no bank stress comparable to the US, but the latest survey of bank lending published yesterday showed that credit conditions tightened substantially, and more than expected, in Q1. Net demand declined by the most since the global financial crisis, as potential clients have insufficient solvency, or loans got simply too expensive for them.
Good news is the core inflation in the Eurozone slowed in March, from 5.7% to 5.6%, although we saw a small uptick in headline inflation to 7%.
Consequently, tightening credit conditions and softer core inflation hint that the European Central Bank (ECB) will likely hike by a 25bp at this week’s meeting, rather than a 50bp hike.
But the Europeans won’t stop hiking rates this month, they will likely hike by another 25bp, or maybe two more into this summer to fight inflation.
Therefore, the EURUSD rebounds back above the 1.10 mark, as both Fed and ECB expectations softened yesterday, but the Fed expectations softened more due to the banking stress, and I remain convinced that price pullbacks in EURUSD are interesting opportunities to strengthen long positions for those targeting an advance to 1.15 in the medium run.
Elsewhere, US crude fell 5.50% yesterday as the revived bank stress in the US raised odds for slower growth, hence lower oil demand. The barrel of US crude fell to $71pb. And even an almost 4mio barrel fall in US inventories last week couldn’t cheer up investors.
Fed Meeting Looming Tonight
Markets
US regional banks including PacWest and Wester Alliance suffered heavy losses yesterday. Instead of putting the financial unrest to bed, the takeover of First Republic Bank on Monday redirected, be it with a day’s lag, market focus to the next weakest link(s). Broader US stock indices lost a little over 1%, led lower by financials and energy. They did finish off intraday lows though. Core bonds rallied with US Treasuries outperforming. US yields dropped between 9.6 and 18.6 bps, the front end outperforming. Disappointing JOLTS job openings (9590k, lowest in two years) supported UST’s in their ascent. German yields rallied more than 10 bps across the curve at the open, catching up with the US move on Monday. They eventually fell 3.5 (30-y) to 6.7 (2-y) bps as sentiment during US dealings deteriorated quickly. EMU headline inflation advanced 0.7% m/m to 7% y/y but core inflation (marginally) eased for a first time in nine months to 5.6%. The ECB’s Bank Lending Survey revealed a further substantial tightening of credit standards. Both the inflation numbers and the BLS serve as final, crucial input to the ECB meeting on Thursday. Lost interest rate support forced the dollar to give back earlier gains. EUR/USD fought its way back into the upward sloping trend channel. The pair finished the day close to but below 1.10. USD/JPY eased from 137.5 to 136.55. Sterling couldn’t ignore the risk-off this time. EUR/GBP jumped from 0.878 to 0.882.
Wall Street’s performance to some extend filters through in Asian dealings. Stocks mostly lose ground with South Korea underperforming. Japanese markets are closed for the remainder of the week. The otherwise calm session puts the focus on the economic calendar for later today. There are a few more US economic data, including the ADP job report (+148k consensus) and services ISM (expected at 51.8 from 51.2) scheduled for release. But with the Fed meeting looming tonight, we don’t think they’ll put a stamp on trading the way they usually do. Fed chair Powell is expected to raise rates by 25 bps to 5-5.25%, in line with the March dot plot, before most likely announcing a pause in the tightening cycle. The statement in all likelihood will keep the door for further tightening open. Optionality and flexibility are key. In the current mindset however, we doubt the market will interpret today’s rate increase as anything other than a dovish hike that marks the end, not a pause, of this cycle. This may in particular put downward pressure on yields at the front end of the curve, even as today’s hike is not yet fully discounted by US money markets. The idea of rate cuts in the second half of this year may gain more traction. Currently more than two 25 bps rate cuts are priced in. The US 2-y yield lost the 4% barrier again yesterday and it’s unlikely that it is going to recover that level post-Fed. First important support in the 10y yield is located at 3.24% (April YtD low). The US dollar faces additional losses. EUR/USD may test the current YtD intraday high of 1.1095. This level serves as an intermediate resistance level only, with the real, first reference located at 1.1274.
News and views
New Zealand’s statistical office published Q1 labour market data this morning. The number of people employed grew by 0.8% Q/Q (vs 0.5% expected) following an upwardly revised 0.5% Q/Q in Q4 2022. The employment rate (employed/working-age population) increased from 69.3% to 69.5%. The unemployment rate (unemployed/labour force) stabilized at 3.4% even as the participation rate (labour force/working-age population) increased from 71.7% to 72% (highest on record). Annual wage cost inflation measured by the labour cost index increased by 4.3% in the year to March 2023 quarter (up from 4.1% and highest since series began in 1992). Kiwi dollar swap rates buck the global trend this morning, rising between 4 bps (30-yr) and 9 bps (2-yr). NZ money markets now completely discount another 25 bps RBNZ rate hike (to 5.5%) at the May 24 policy meeting, with odds starting to shift in the direction of a final 25 bps move in summer months. The kiwi dollar enjoys the interest rate support, rising from around NZD/USD 0.62 to 0.6250 and leaving support at 0.6085/0.6112 more firmly behind.
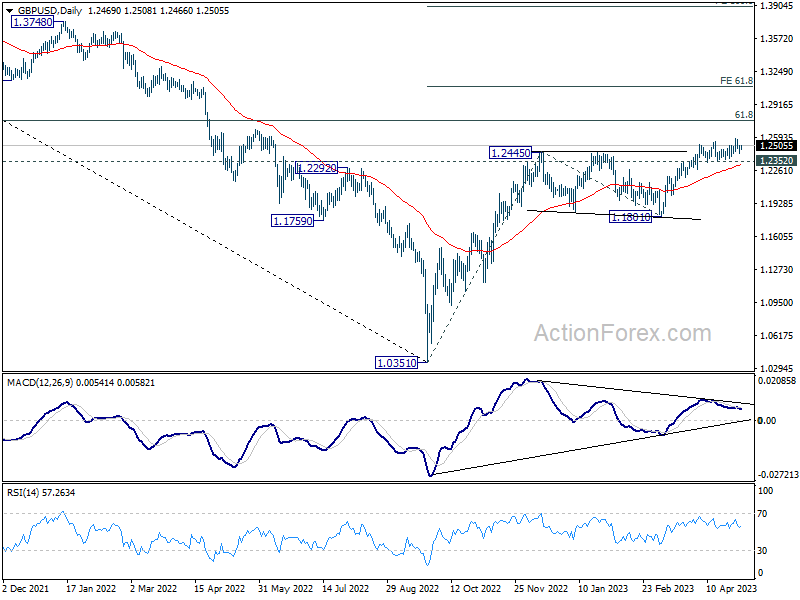
GBP/USD Technical Analysis
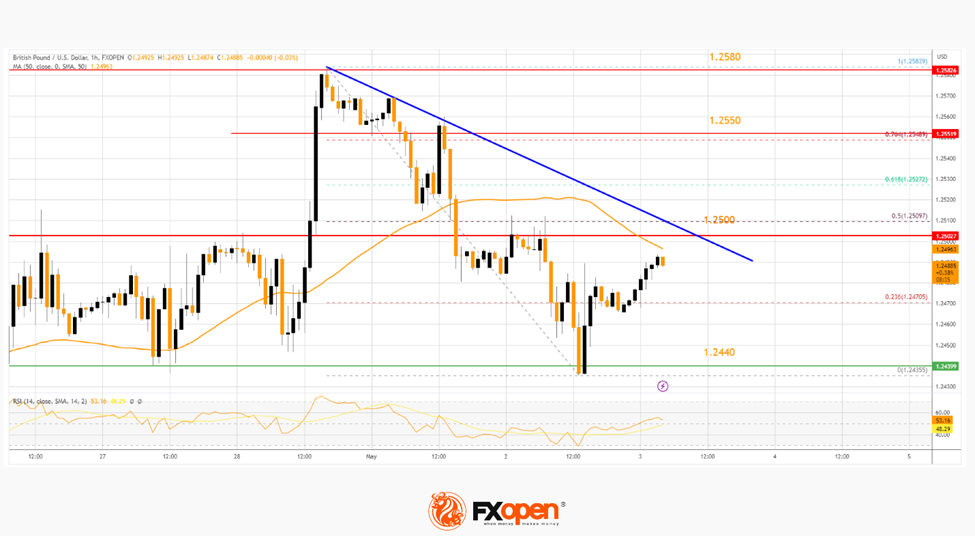
On the hourly chart of GBP/USD at FXOpen, the pair started a fresh decline from the 1.2580 zone. The British Pound declined steadily below the 1.2500 level against the US Dollar.
It tested the 1.2440 support and recently started an upside correction. The pair is now facing resistance near a key bearish trend line at 1.2500 and the 50-hour simple moving average. It is also close to the 50% Fib retracement level the downward move from the 1.2583 swing high to the 1.2435 low.
If there is a clear upside break above the 1.2500 resistance, the pair could rise steadily toward the 1.2550 level in the near term. The next major resistance sits near the 1.2580 level.
On the downside, the first major support is near the 1.2470 level. The main support is forming near the 1.2440 level. A break below the 1.2440 support could push the pair toward the 1.2350 support.
AUD/USD Daily Report
Daily Pivots: (S1) 0.6571; (P) 0.6617; (R1) 0.0.6667; More...
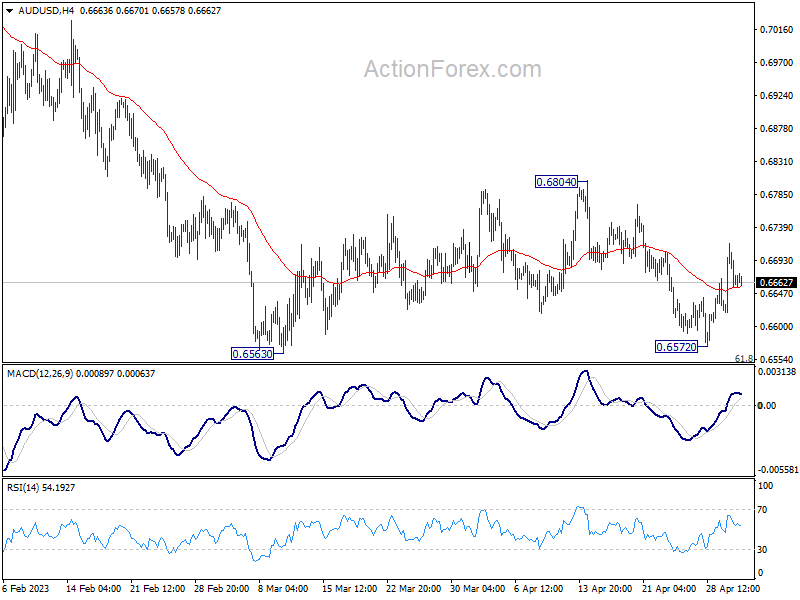
Intraday bias in AUD/USD remains mildly on the upside and further recovery might be seen. Still, outlook remains bearish as long as 0.6804 resistance holds, and down trend resumption through 0.6563 low is in favor at a later stage. Nevertheless, sustained break of 0.6804 should indicate completion of whole fall from 0.7156, and turn near term outlook bullish for retesting this high instead.
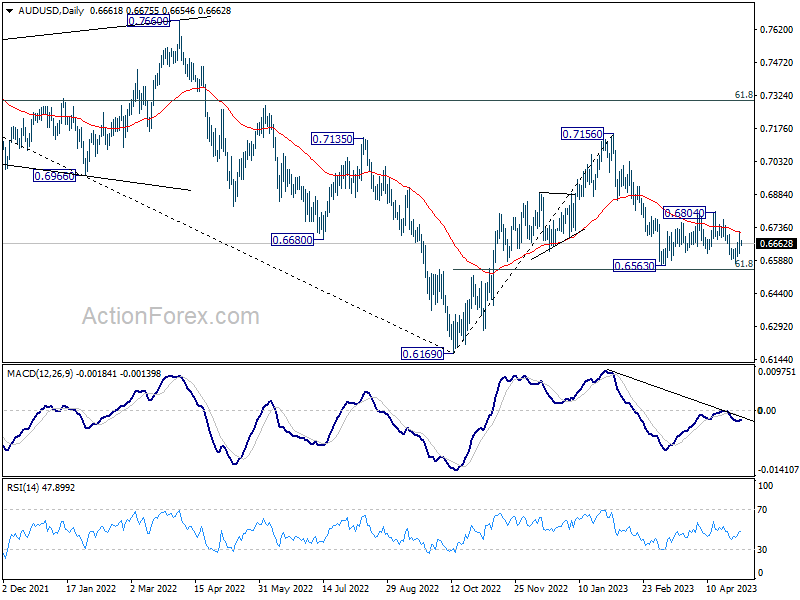
In the bigger picture, as long as 61.8% retracement of 0.6169 to 0.7156 at 0.6546 holds, the decline from 0.7156 is seen as a correction to rally from 0.6169 (2022 low) only. Another rise should still be seen through 0.7156 at a later stage. However, sustained break of 0.6546 will raise the chance of long term down trend resumption through 0.6169 low.
EUR/USD Daily Outlook
Daily Pivots: (S1) 1.0917; (P) 1.0958; (R1) 1.0983; More...
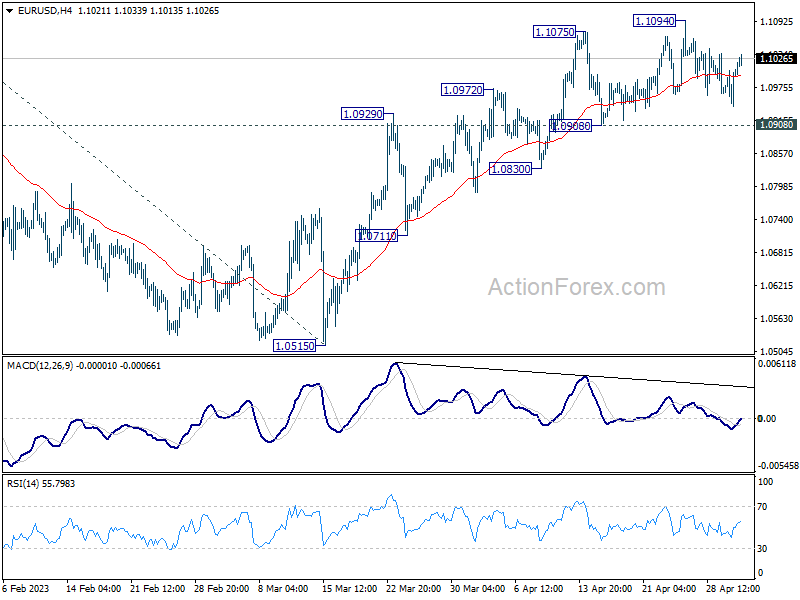
Outlook in EUR/USD is unchanged as consolidation from 1.1094 is extending. Intraday bias stays neutral and further rally is expected as long as 1.0908 support holds. Break of 1.1094 will resume larger up trend to 1.1273 fibonacci level. Break there will target 61.8% projection of 0.9534 to 1.1032 from 1.0515 at 1.1441 However, considering bearish divergence condition in 4H MACD, break of 1.0908 support will indicate short term topping and turn bias back to the downside.
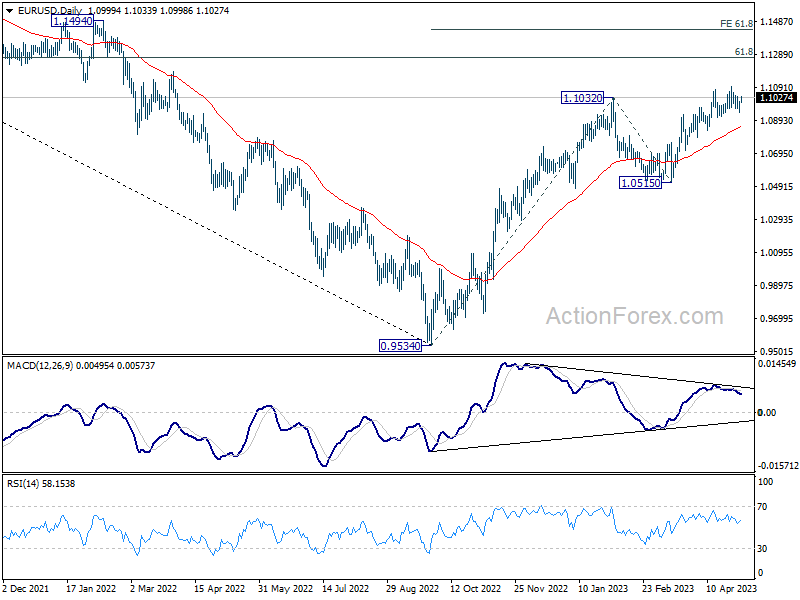
In the bigger picture, rise from 0.9534 (2022 low) is in progress for 61.8% retracement of 1.2348 (2021 high) to 0.9534 at 1.1273. Sustained break there will solidify the case of bullish trend reversal and target 1.2348 resistance next (2021 high). This will now remain the favored case as long as 1.0515 support holds, even in case of deeper pull back.
GBP/USD Daily Outlook
Daily Pivots: (S1) 1.2396; (P) 1.2432; (R1) 1.2472; More...
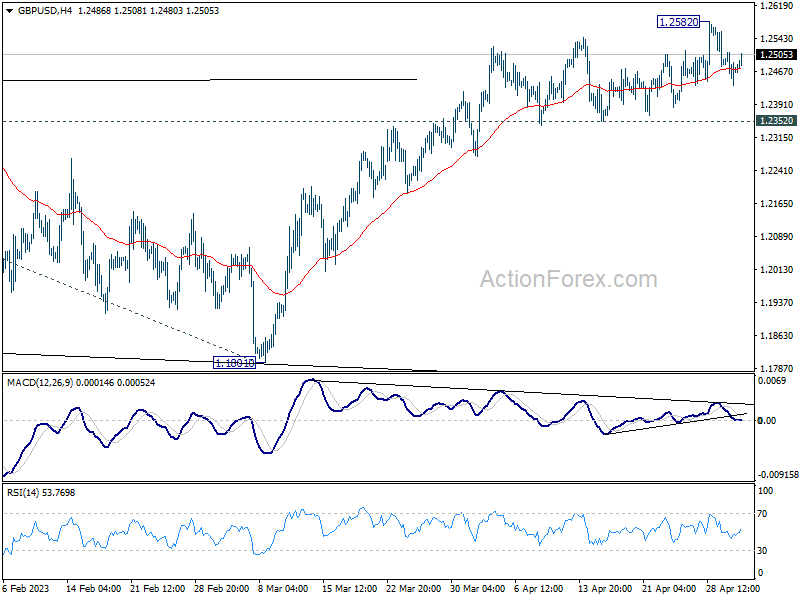
Outlook in GBP/USD is unchanged with consolidation from 1.2582 extending. Intraday bias neutral and further rise is expected as long as 1.2352 support holds. On the upside, above 1.2582 will target 1.2759 fibonacci level first. Firm break there will target 61.8% projection of 1.0351 to 1.2445 from 1.1801 at 1.3095. However, considering bearish divergence condition in 4H MACD, break of 1.2352 will confirm short term topping, and turn bias back to the downside for deeper pull back.
In the bigger picture, the rise from 1.0351 medium term term bottom (2022 low) is in progress for 61.8% retracement of 1.4248 (2021 high) to 1.0351 at 1.2759. Sustained break there will add to the case of long term bullish trend reversal. Further break of 61.8% projection of 1.0351 to 1.2445 from 1.1801 at 1.3095 could prompt upside acceleration to 100% projection at 1.3895. For now, this will remain the favored case as long as 1.1801 support holds, even in case of deep pull back.