

Sample Category Title
GBP/USD Mid-Day Outlook
Daily Pivots: (S1) 1.2396; (P) 1.2432; (R1) 1.2472; More...
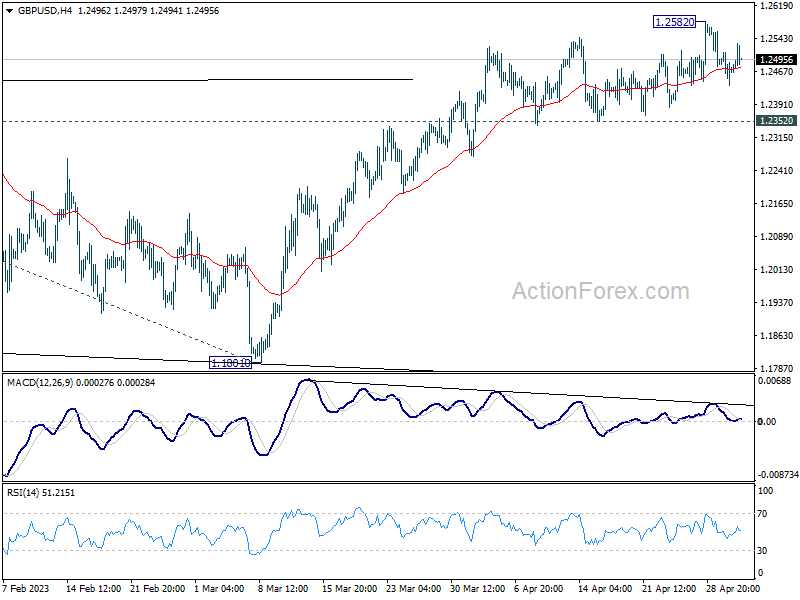
Intraday bias in GBP/USD remains neutral for the moment. Further rise is expected as long as 1.2352 support holds. On the upside, above 1.2582 will target 1.2759 fibonacci level first. Firm break there will target 61.8% projection of 1.0351 to 1.2445 from 1.1801 at 1.3095. However, considering bearish divergence condition in 4H MACD, break of 1.2352 will confirm short term topping, and turn bias back to the downside for deeper pull back.
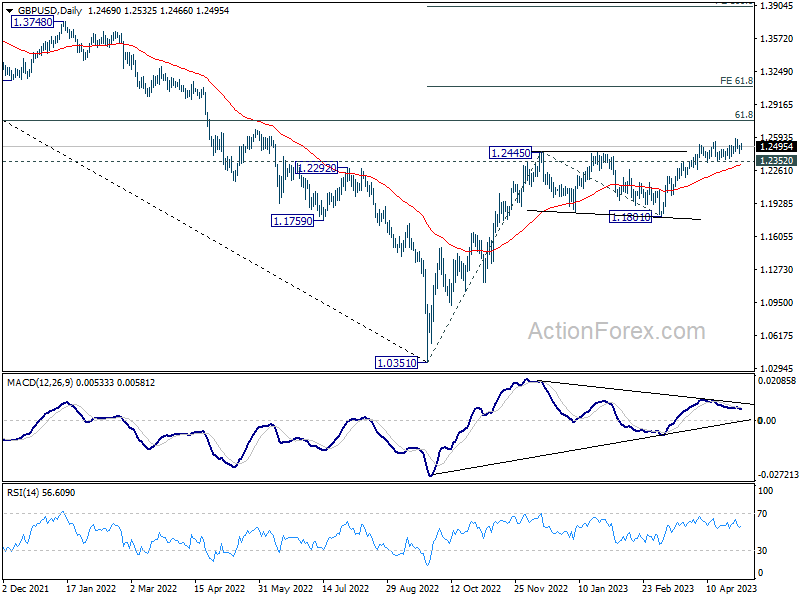
In the bigger picture, the rise from 1.0351 medium term term bottom (2022 low) is in progress for 61.8% retracement of 1.4248 (2021 high) to 1.0351 at 1.2759. Sustained break there will add to the case of long term bullish trend reversal. Further break of 61.8% projection of 1.0351 to 1.2445 from 1.1801 at 1.3095 could prompt upside acceleration to 100% projection at 1.3895. For now, this will remain the favored case as long as 1.1801 support holds, even in case of deep pull back.
EUR/USD Mid-Day Outlook
Daily Pivots: (S1) 1.0917; (P) 1.0958; (R1) 1.0983; More...
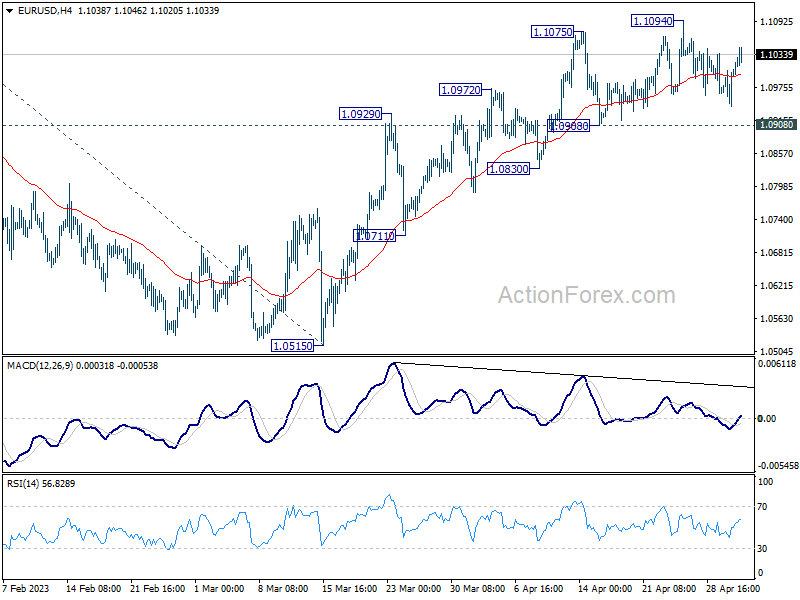
EUR/USD recovers mildly today but stays in range below 1.1094. Intraday bias remains neutral at this point. Further rally is expected as long as 1.0908 support holds. Break of 1.1094 will resume larger up trend to 1.1273 fibonacci level. Break there will target 61.8% projection of 0.9534 to 1.1032 from 1.0515 at 1.1441 However, considering bearish divergence condition in 4H MACD, break of 1.0908 support will indicate short term topping and turn bias back to the downside.
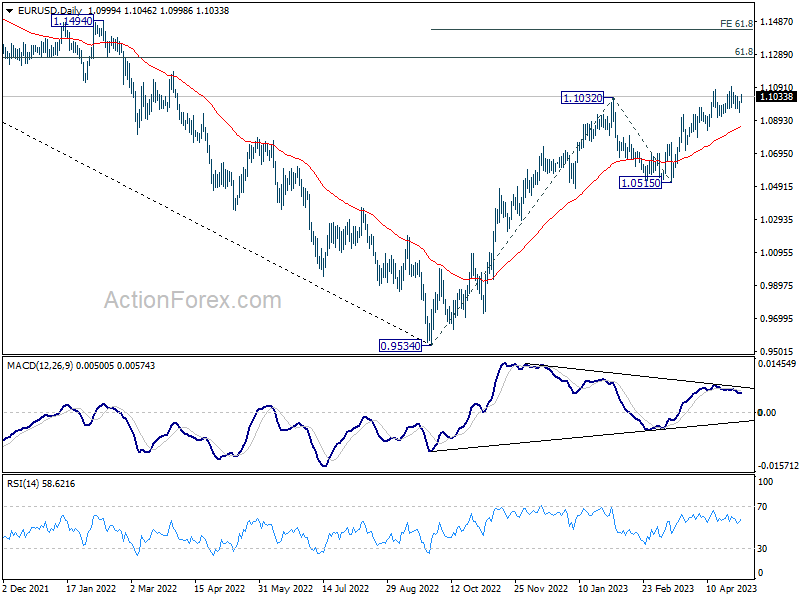
In the bigger picture, rise from 0.9534 (2022 low) is in progress for 61.8% retracement of 1.2348 (2021 high) to 0.9534 at 1.1273. Sustained break there will solidify the case of bullish trend reversal and target 1.2348 resistance next (2021 high). This will now remain the favored case as long as 1.0515 support holds, even in case of deeper pull back.
Dollar Soft Ahead of FOMC Rate Decision, Markets Await Powell’s Guidance on Pause
Dollar remains weak in early US session, despite strong ADP job data, seeing only modest gains the Australian and Canadian Dollars. However, the selloff remains contained, even against strong Yen and Swiss Franc. Traders are evidently holding their bets as they await FOMC rate decision. A 25bps hike to 5.00-5.25% is widely anticipated, and it is unlikely to surprise the market. The primary question is whether Chair Jerome Powell will explicitly indicate a pause following today's move.
Throughout the week, New Zealand Dollar has emerged as the strongest performer, buoyed by robust job data released earlier in Asian session. Australian Dollar follows closely, although its momentum has waned. Swiss Franc and Yen trail behind, reflecting some underlying risk-off sentiment. Meanwhile, Canadian Dollar is the weakest performer, followed by Sterling and Dollar. Overall, most currency pairs and crosses are trading within last week's range, with the exception of some Kiwi and Aussie pairs.
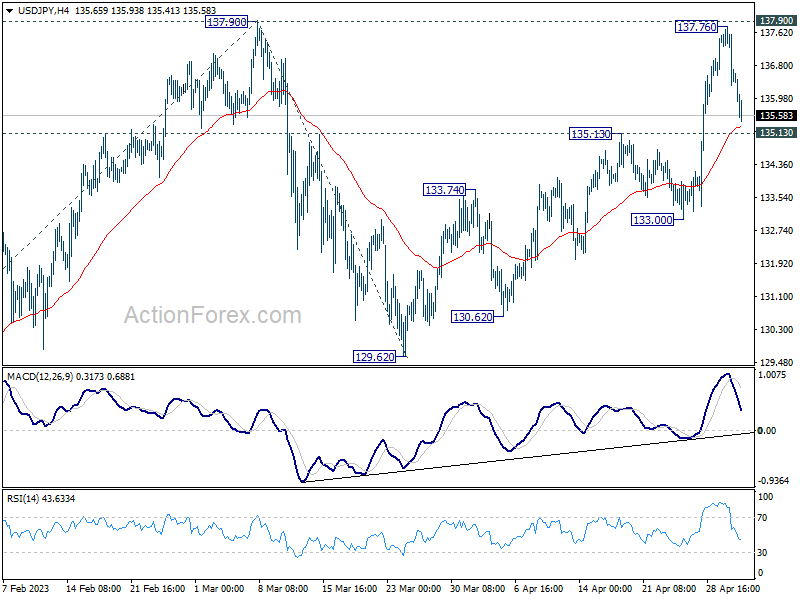
Technically, USD/JPY is quickly approaching 135.13 resistance turned support as the pull back from 137.76 extends. As long as this support holds, further rise is in favor through 137.90, sooner rather than later. However, firm break of 135.13 will argue that the pattern from 137.90 has started another falling leg, and risk deeper decline through 133.00 support towards 129.62.
In Europe, at the time of writing, FTSE is up 0.32%. DAX is up 0.74%. CAC is up 0.56%. Germany 10-year yield is down -0.0059 at 2.256. Earlier in Asia, Hong Kong HSI dropped -1.18%. Singapore Strait times dropped -0.61%. Japan and China were on holiday.
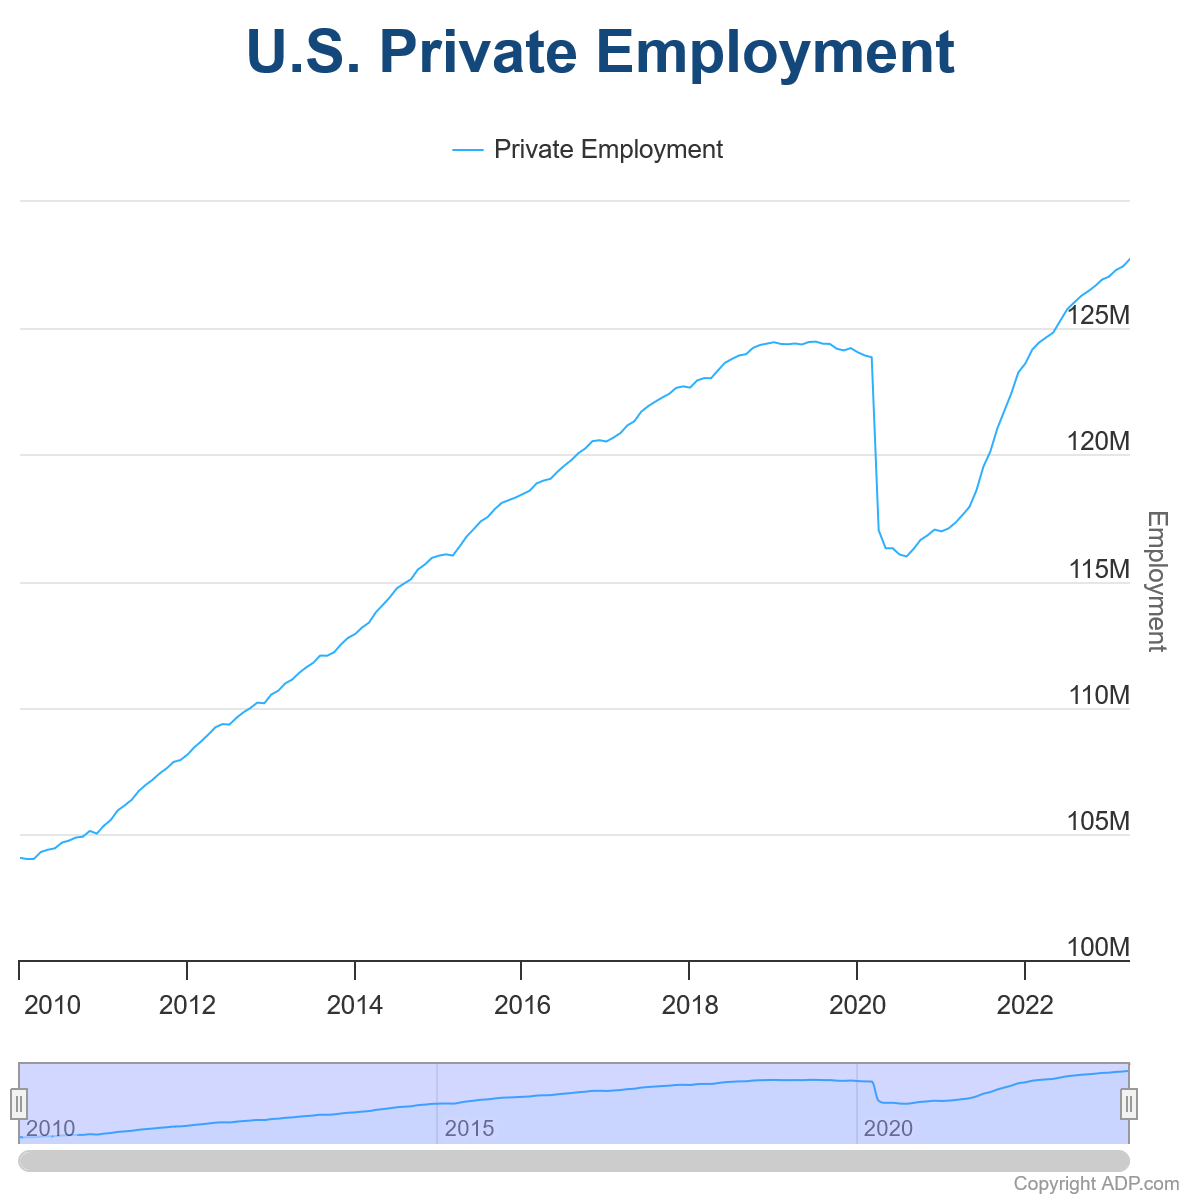
US ADP jobs grew 296k in Apr, pay growth slowed
US ADP private employment grew 296k in April, well above expectation of 150k. By sector, goods-producing jobs rose 67k. Service-providing jobs rose 229. By establishment size, small companies added 121k jobs, medium companies added 122k, large companies added 47k.
Median change in annual pay of job-stayers rose 6.7% yoy, slowed slightly from 6.9% yoy. Median change in annual pay of job-changers rose 13.2% yoy, slowed notably from 14.2% yoy.
"The slowdown in pay growth gives the clearest signal of what's going on in the labor market right now. Employers are hiring aggressively while holding pay gains in check as workers come off the sidelines. Our data also shows fewer people are switching jobs." Nela Richardson, Chief Economist, ADP, said.
Eurozone unemployment rate hits record low at 6.5%
Eurozone unemployment rate dipped to a new record low in March, falling from 6.6% to 6.5%, below the expected 6.6%. Meanwhile, the EU unemployment rate remained steady at 6.0%.
Eurostat estimates that 12.96m individuals in EU, including 11.01m in Eurozone, were unemployed in the month. This marks a decrease of -155k in EU and -121k in Eurozone compared to February. Furthermore, compared to March 2022, unemployment fell by -353k in EU and -365k in the Eurozone.
New Zealand employment growth exceeds expectations; unemployment rate remains low
New Zealand employment data for Q1 showcased a 0.8% qoq increase, surpassing expectation of 0.4% qoq growth. Unemployment rate remained steady at 3.4%, defying expectations of rise to 3.5% and staying close to record low of 3.2% made in Q1 2022. Additionally, employment rate climbed from 69.3% to 69.5%, while labor force participation rate rose from 71.8% to 72.0%. Both employment and participation rates reached their highest levels since records began in 1986.
All sector wage inflation was at 1.0%, 4.3% yoy. "Annual wage cost inflation is at its highest level since the series began in 1992, up from 4.1 percent in the year to the December 2022 quarter," business prices manager Bryan Downes said. "This aligns with other wage measures, like the unadjusted LCI and average hourly earnings, both of which also had the largest annual increases on record."
New Zealand's financial system well-positioned for higher interest rate environment
In May 2023 Financial Stability Report, RBNZ Governor Adrian Orr highlighted that the country's financial system is well-placed to handle the higher interest rate environment and international financial disruptions. Global inflation continues to persist at levels significantly above central banks' policy targets. Although central banks have recently slowed pace of tightening, the full impact of previous tightening measures remains to be seen.
Governor Orr explained that "to date there have been limited signs of distress in banks' lending portfolios, with only a small share of borrowers falling behind on their payments." This resilience, he said, reflects ongoing strength of the labor market and the ability of borrowers to adjust their spending or use previous savings and repayment buffers.
Australian retail sales exceed expectations, rising 0.4% mom in Mar
Australia's retail sales turnover increased by 0.4% mom to AUD 35.3m in March, surpassing expectations of 0.2% mom. Year-on-year, sales turnover was up by 5.4% compared to the same month a year ago.
Ben Dorber, Australian Bureau of Statistics Head of Retail Statistics, noted that while retail sales recorded a third consecutive rise in March, pull-back in spending on discretionary goods has kept monthly turnover at a similar level to six months ago.
Dorber also noted the importance of analyzing quarterly retail sales volumes, set to be released next week, in order to understand the impact of consumer prices on recent turnover growth, particularly as CPI data showed high inflation levels despite slower growth in March quarter.
EUR/USD Mid-Day Outlook
Daily Pivots: (S1) 1.0917; (P) 1.0958; (R1) 1.0983; More...
EUR/USD recovers mildly today but stays in range below 1.1094. Intraday bias remains neutral at this point. Further rally is expected as long as 1.0908 support holds. Break of 1.1094 will resume larger up trend to 1.1273 fibonacci level. Break there will target 61.8% projection of 0.9534 to 1.1032 from 1.0515 at 1.1441 However, considering bearish divergence condition in 4H MACD, break of 1.0908 support will indicate short term topping and turn bias back to the downside.
In the bigger picture, rise from 0.9534 (2022 low) is in progress for 61.8% retracement of 1.2348 (2021 high) to 0.9534 at 1.1273. Sustained break there will solidify the case of bullish trend reversal and target 1.2348 resistance next (2021 high). This will now remain the favored case as long as 1.0515 support holds, even in case of deeper pull back.
Economic Indicators Update
| GMT | Ccy | Events | Actual | Forecast | Previous | Revised |
|---|---|---|---|---|---|---|
| 22:45 | NZD | Employment Change Q1 | 0.80% | 0.40% | 0.20% | |
| 22:45 | NZD | Unemployment Rate Q1 | 3.40% | 3.50% | 3.40% | |
| 22:45 | NZD | Labour Cost Index Q/Q Q1 | 0.90% | 1.10% | 1.10% | |
| 01:30 | AUD | Retail Sales M/M Mar | 0.40% | 0.20% | 0.20% | |
| 08:00 | EUR | Italy Unemployment Rate Mar | 7.80% | 8.10% | 8.00% | 7.90% |
| 09:00 | EUR | Eurozone Unemployment Rate Mar | 6.50% | 6.60% | 6.60% | |
| 12:15 | USD | ADP Employment Change Apr | 296K | 150K | 145K | |
| 13:45 | USD | Services PMI Apr F | 53.7 | 53.7 | ||
| 14:00 | USD | ISM Services PMI Apr | 53.1 | 51.2 | ||
| 14:30 | USD | Crude Oil Inventories | -0.5M | -5.1M | ||
| 18:00 | USD | Fed Interest Rate Decision | 5.25% | 5.00% | ||
| 18:30 | USD | FOMC Press Conference |
US ADP jobs grew 296k in Apr, pay growth slowed
US ADP private employment grew 296k in April, well above expectation of 150k. By sector, goods-producing jobs rose 67k. Service-providing jobs rose 229. By establishment size, small companies added 121k jobs, medium companies added 122k, large companies added 47k.
Median change in annual pay of job-stayers rose 6.7% yoy, slowed slightly from 6.9% yoy. Median change in annual pay of job-changers rose 13.2% yoy, slowed notably from 14.2% yoy.
"The slowdown in pay growth gives the clearest signal of what's going on in the labor market right now. Employers are hiring aggressively while holding pay gains in check as workers come off the sidelines. Our data also shows fewer people are switching jobs." Nela Richardson, Chief Economist, ADP, said.
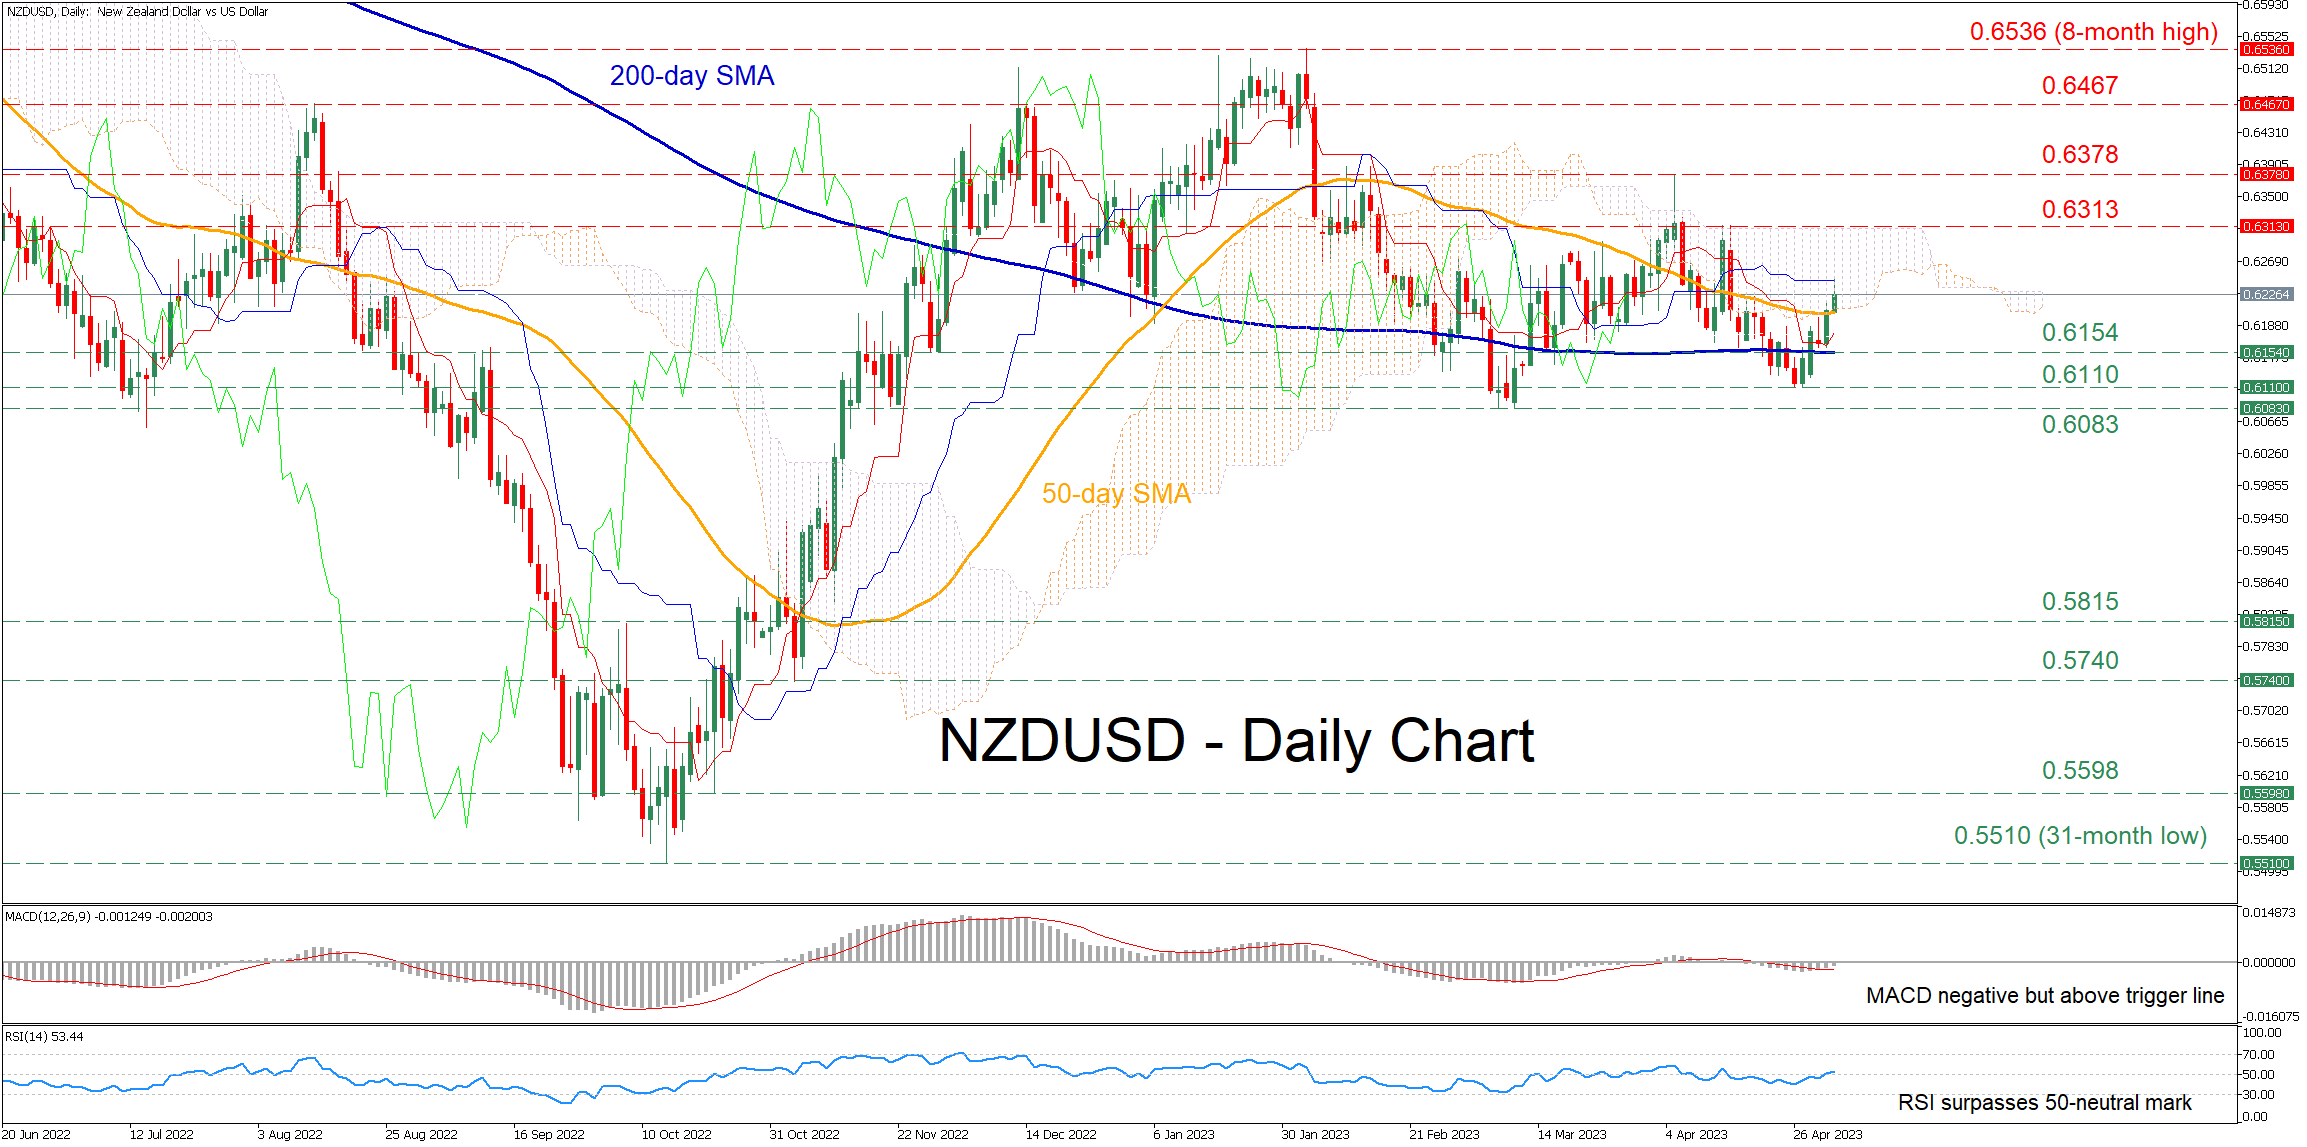
NZDUSD Slices Through 50-Day SMA as Rebound Extends
NZDUSD had been steadily gaining ground after its latest retreat came to a halt at 0.6154 in late April. Moreover, the pair has already claimed crucial levels, jumping above both its 50- and 200-day simple moving averages (SMAs), while also entering within the Ichimoku cloud.
The momentum indicators are reflecting a cautiously positive tone. Specifically, the MACD histogram has jumped above its trigger line but remains below zero, while the RSI surpassed its 50-neutral threshold.
Should buying pressures persist, the pair might edge higher to test the recent resistance region of 0.6313. Climbing above that zone, the price could extend its advance towards the April peak of 0.6378. A violation of that region could set the stage for the August high of 0.6467.
Alternatively, if the price reverses lower and falls below its 50-day SMA, the 200-day SMA at 0.6154 could act as the first line of defense. If that barricade fails, the spotlight could turn towards the April low of 0.6110 before the 2023 bottom of 0.6083 appears on the radar. Further declines might then cease at the 0.5815 hurdle.
Overall, NZDUSD’s short-term technical picture has improved drastically after the pair’s latest bounce-off the April low. Therefore, the rebound could resume in the case that the 50-day SMA caps any downside moves.
USD/CHF: Ending Diagonal Nears Completion Level
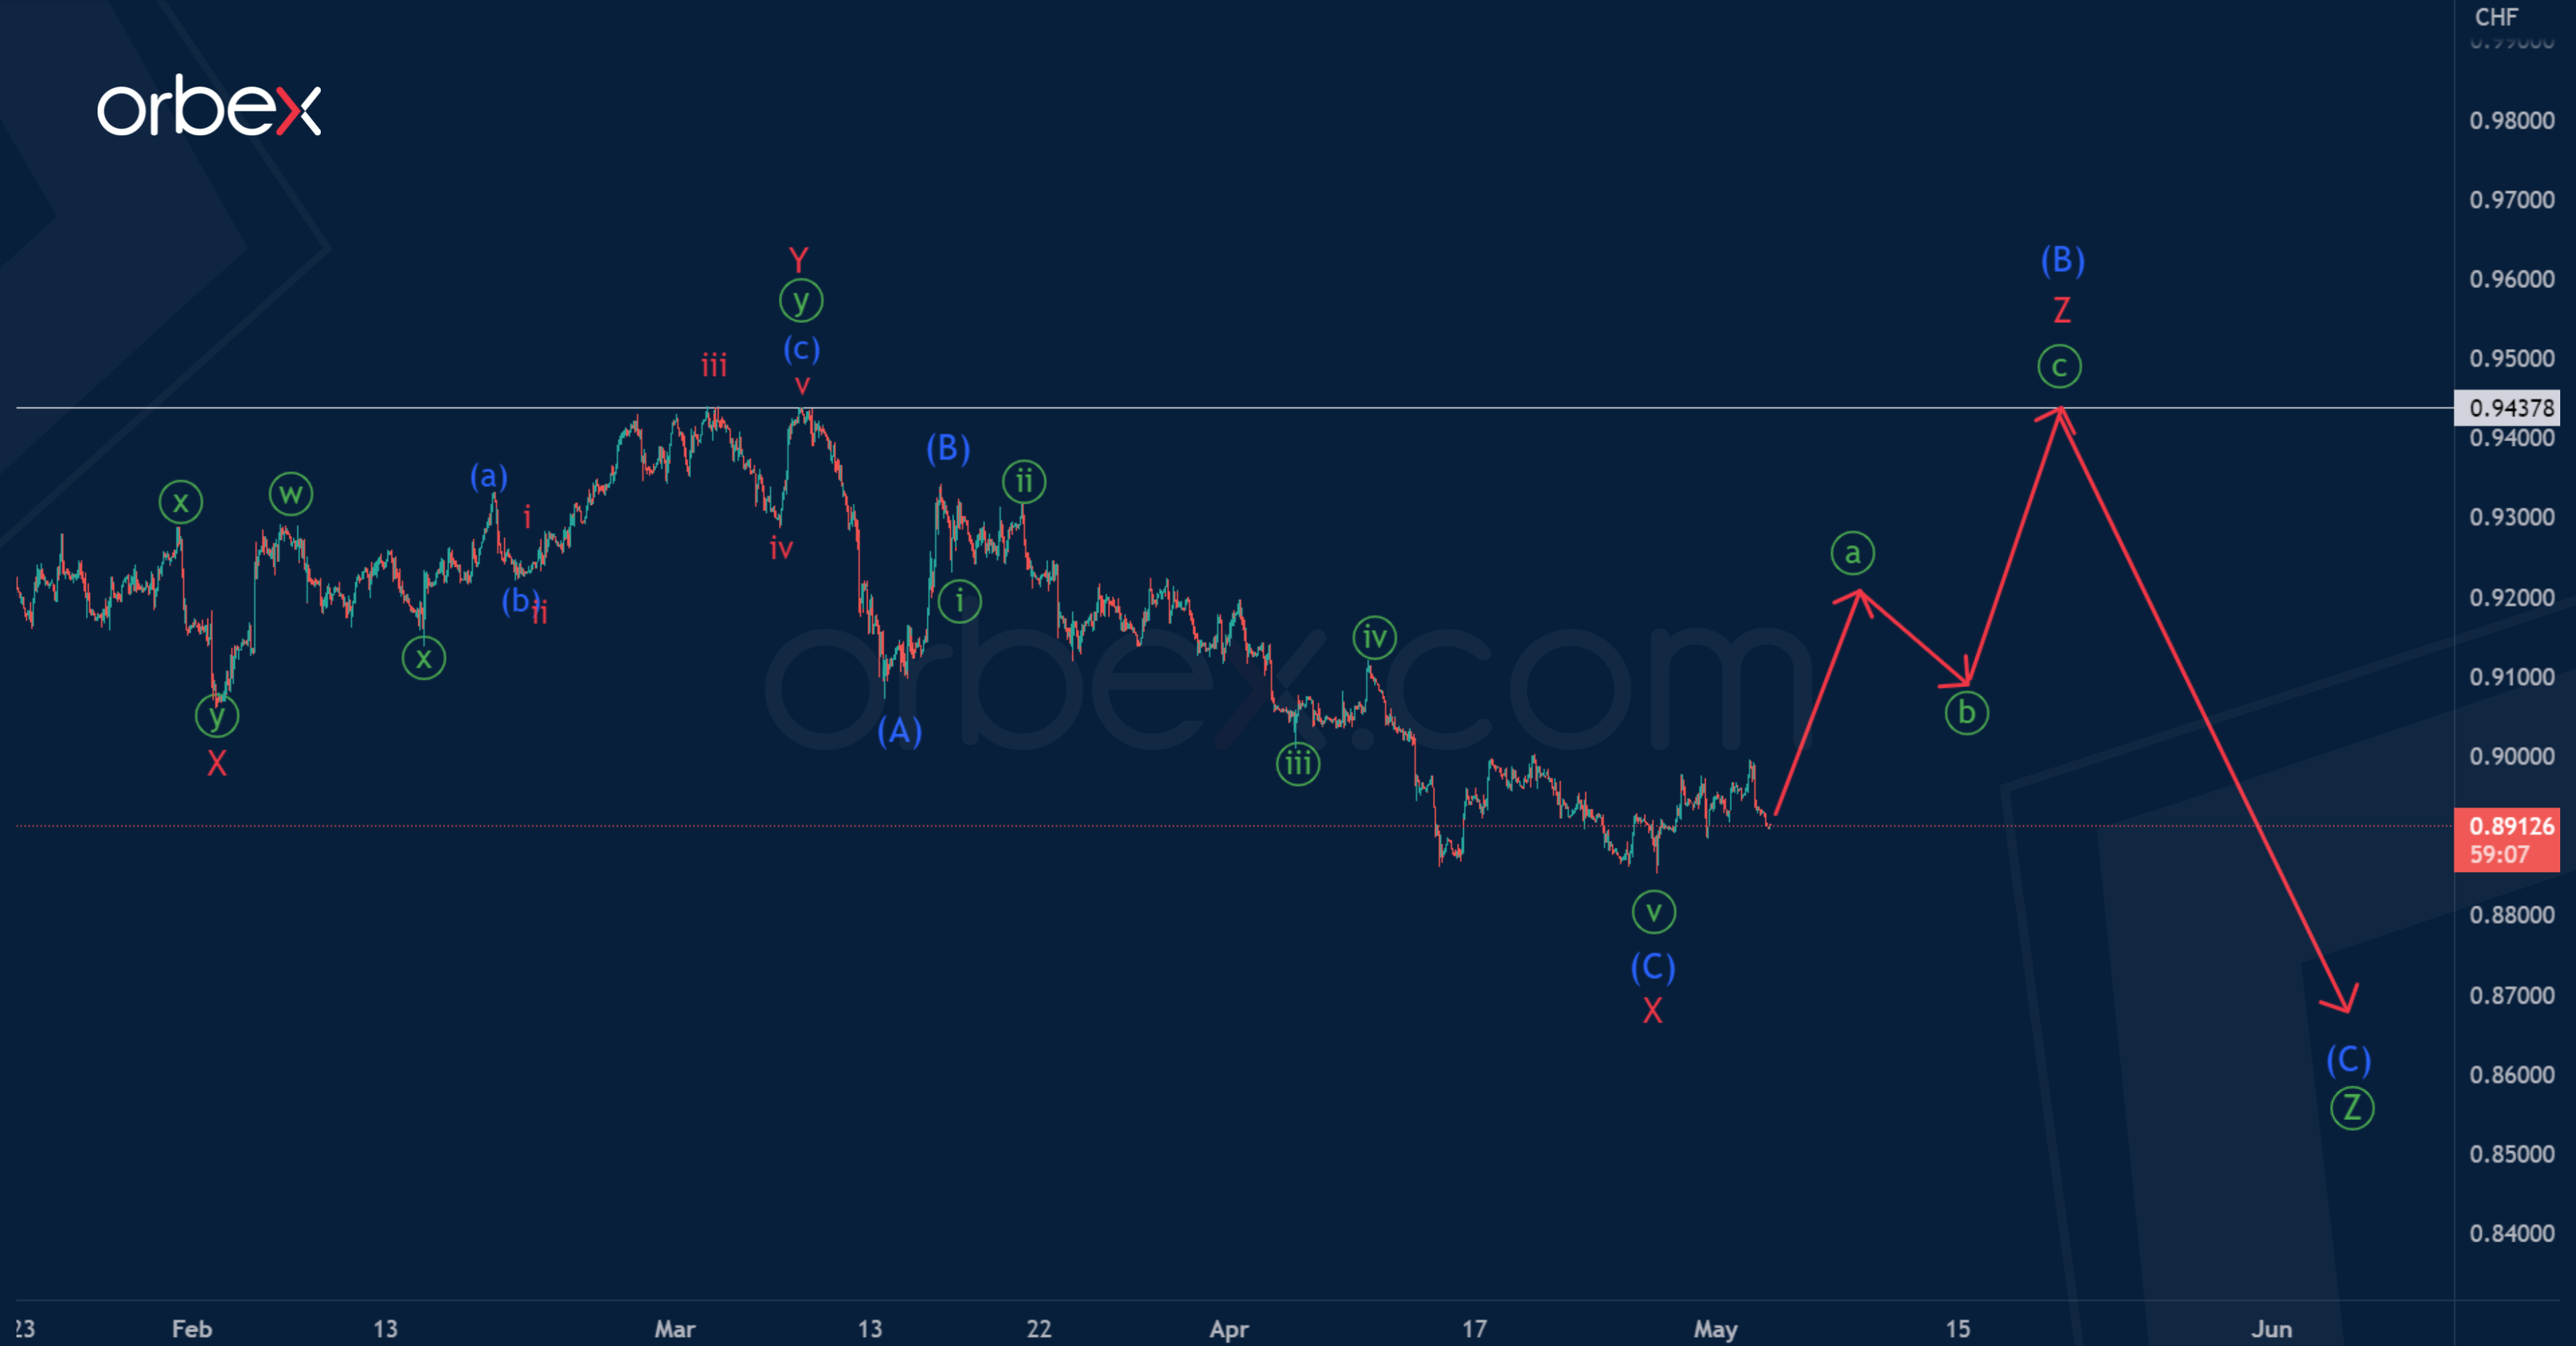
In the long term, the USDCHF seems to be forming a triple zigzag pattern. Only its final part, the wave, has not been completed.
The actionary leg is likely to end in the form of a standard intermediate zigzag (A)-(B)- (C). Wave (A) is a 5-wave bearish impulse, wave (B) has a horizontal internal structure of a double three W-X-Y.
Now the formation of the final intermediate wave (C) is taking place. Perhaps it will be at 76.4% of impulse (A), and will end near 0.872 in the form of an ending diagonal.
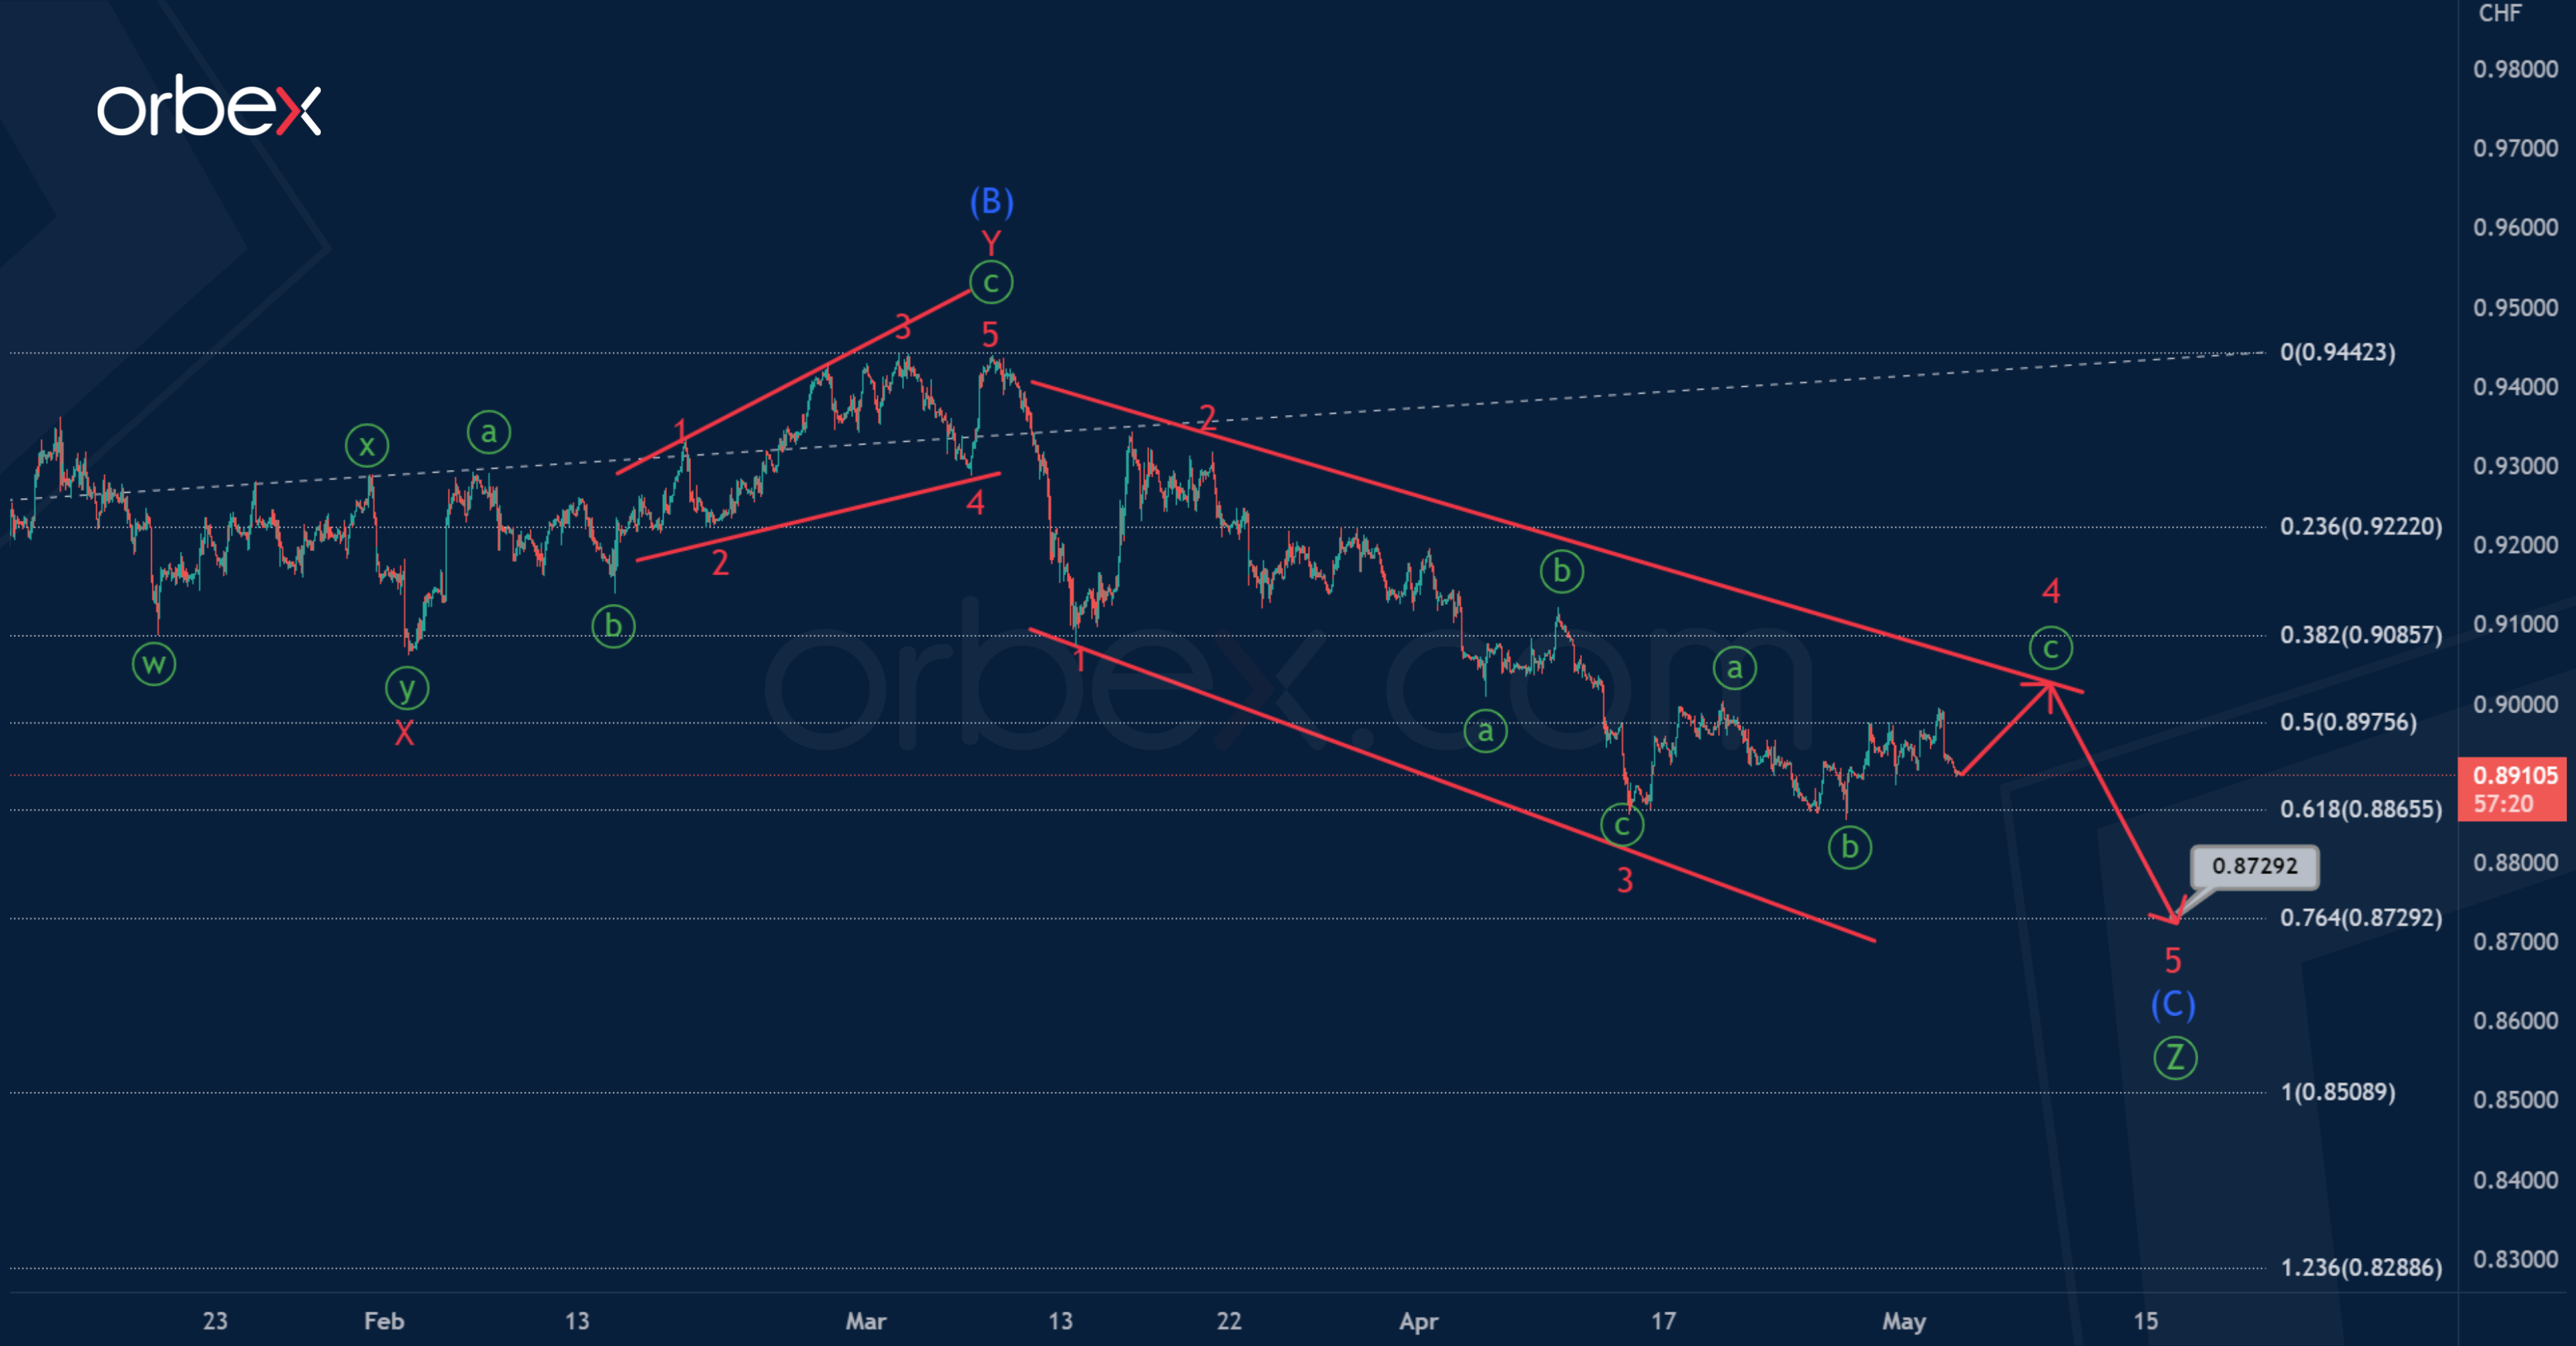
Let's consider an alternative scenario in which an intermediate correction is still being formed and may take the form of a triple three consisting of sub-waves W-X-Y-X-Z.
The minor sub-waves W-X-Y-X have been completed. In the near future, market participants can expect the development of a minor wave Z, which may take the form of a zigzag.
There is a chance that the bulls will send the market to the level of 0.943, that is, to the maximum of wave Y.
BTCUSD Analysis: Crypto Investors Reducing Risks
According to analysts from CoinShares, the outflow of capital from crypto assets over the past week amounted to more than $72 million. We are talking about funds such as Grayscale or Proshares, which allow institutional investors to invest in products related to cryptocurrencies.
There are two possible reasons for the outflow:
1→ Investors reduce risks as they fear the fall of BTC after today's Fed decision.
2→ Signs of weakness in demand around the key USD 30k level.
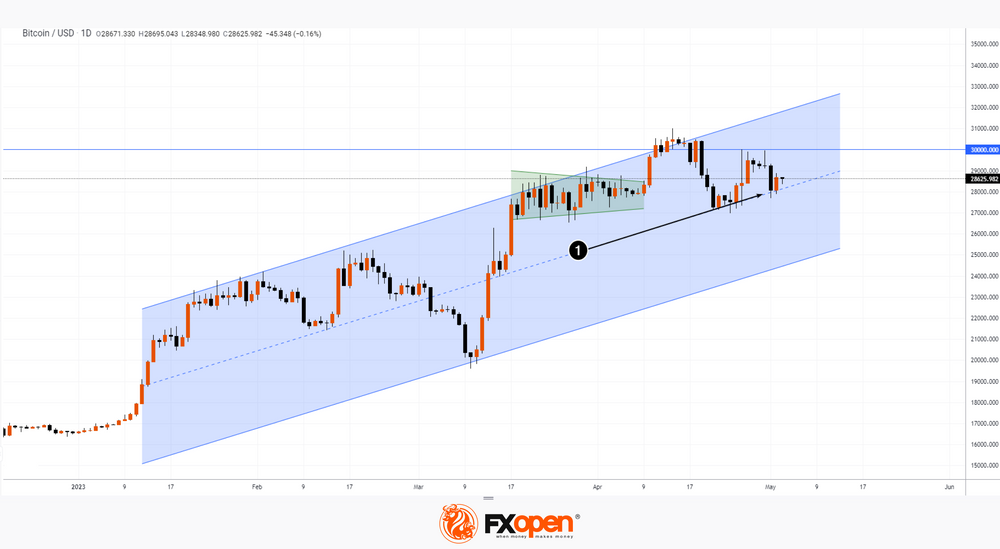
Note that the bulls failed to gain a foothold above this psychological mark in mid-April, and failed to exceed it at the end of April. Thus, the current quote returned to the area of supply and demand balance (shown in green), which was formed in mid-March. In other words, a price increase does not attract new buyers to the market.
So far, the BTCUSD price is supported by the median line (1) of the rising channel, but it can be broken by the bears if USD 30k continues to resist the rally that has been in place since the beginning of the year.
How Will ECB Meeting Affect EUR?
It's no longer news that Eurozone's headline inflation rate rose in April, exceeding the European Central Bank's target. Eurostat's preliminary data revealed that the headline inflation rate reached 7% last month, a 0.1% rise from 6.9% in March. In contrast, core inflation, which excludes food and energy prices, unexpectedly slowed to 5.6% in April. The latest figures come right after the ECB's policy decision on Thursday, 4th of May, with market players speculating on a possible 25 or 50 basis point increase. The higher headline inflation rate could lead to a 50 basis point hike, while the slower core price growth could push for a more dovish stance with a 25 basis point hike. Despite the consistent rate increases, inflation in the Eurozone remains above the ECB's target of 2%, and further tightening is required to defeat inflation, according to the IMF's Alfred Kammer.
EURUSD - H4 Timeframe
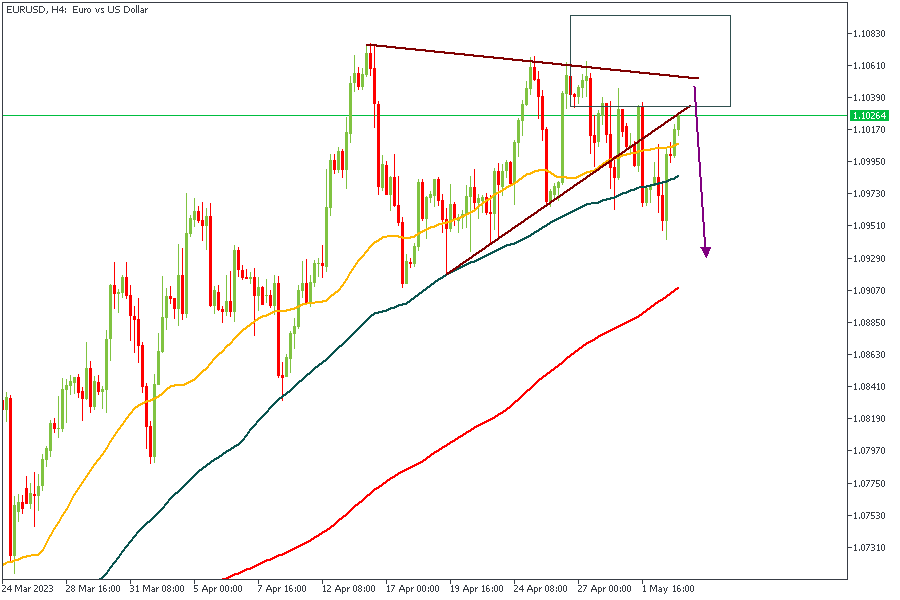
In line with my previous analysis here (https://fbs.com/analytics/articles/can-usd-reverse-in-april-37668), EURUSD remains somewhat stranded inside the weekly supply zone. The most encouraging indicator for a bearish move is the recent breakout of the wedge pattern. My confirmation for this sentiment is based on the trendline resistance, the rally-base-drop supply zone, and the 76% of the Fibonacci retracement tool.
Analysts’ Expectations:
- Direction: Bearish
- Target: 1.11011
- Invalidation: 1.09551
EURNZD - Daily Timeframe
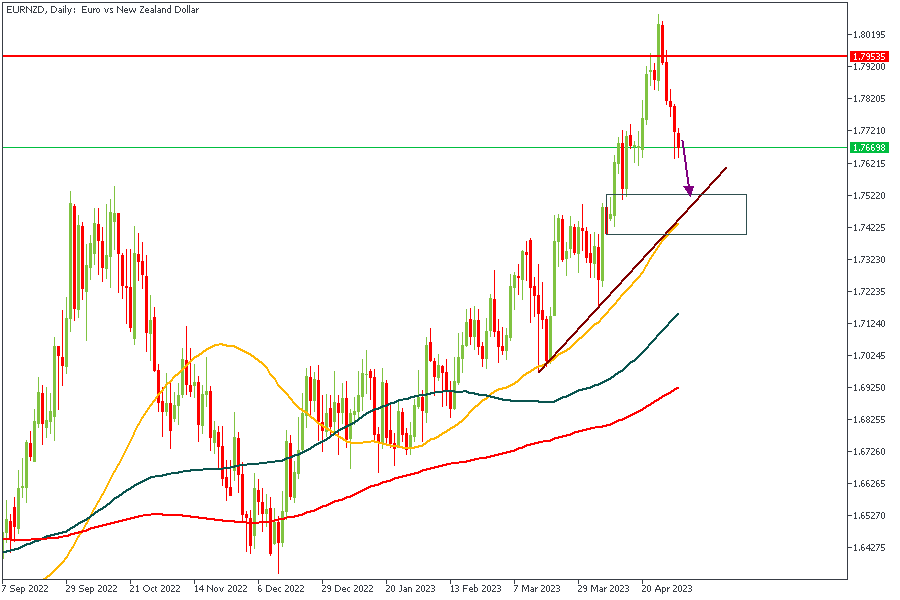
EURNZD had an eventful week at last month's close; a pin bar rejection candlestick formed inside a supply zone on the weekly timeframe. Because of this, I expect to see a continuation of the bearish rally from the marked supply area with an initial target of 1.75390.
Analysts’ Expectations:
- Direction: Bearish
- Target: 1.75390
- Invalidation: 1.80908
EURCAD - Daily Timeframe
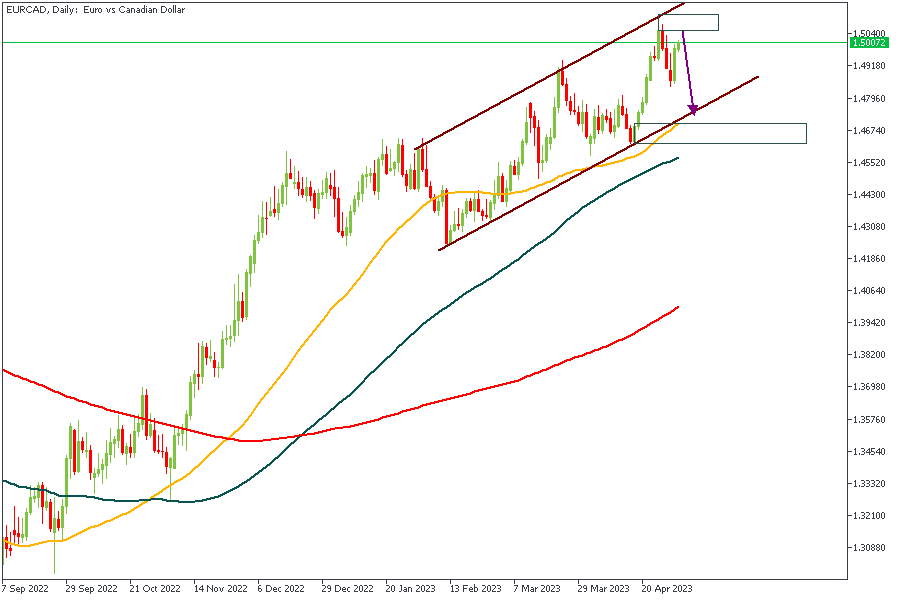
EURCAD is at a key supply zone on the weekly timeframe and has reacted with an initial rejection which closed off last week with a hammer pattern. Therefore, my sentiment is bearish on EURCAD, pending the ECB's decision, based on the resistance trendline of the consolidation channel, the rally-base-drop supply zone, and the weekly supply zone.
Analysts’ Expectations:
- Direction: Bearish
- Target: 1.48160
- Invalidation: 1.51209
CONCLUSION
The trading of CFDs comes at a risk. Thus, to succeed, you have to manage risks properly. To avoid costly mistakes while you look to trade these opportunities, be sure to do your due diligence and manage your risk appropriately.
How Will FOMC Meeting Affect the Markets?
It's been an exciting start to the week, and month, for the US Dollar, as it gained some bullish momentum on Monday thanks to a 0.5% rise in the US Dollar Index (DXY), propelled by a whopping 4% increase in the benchmark 10-year US Treasury bond yield. This surge saw the DXY reach a new high not seen since April 11, hitting 102.40. However, this didn't last long, as the DXY dropped to 102.00 after the bond yield fell sharply in the wake of the latest US data.All eyes are now on the upcoming Federal Reserve (Fed) two-day policy meeting, set to kick off on Tuesday, May 2, with policy decisions being announced on Wednesday. While many in the market are expecting the Fed to raise its policy rate by 25 basis points (bps) to the range of 5%-5.25%, the critical factor to watch will be the language used in the policy statement regarding a potential 'pause in tightening,' which could have a significant impact on the valuation of the USD. So, while we keep an eye on the Fed's decisions and statements, here are a few trade ideas.
US DOLLAR - H4 Timeframe
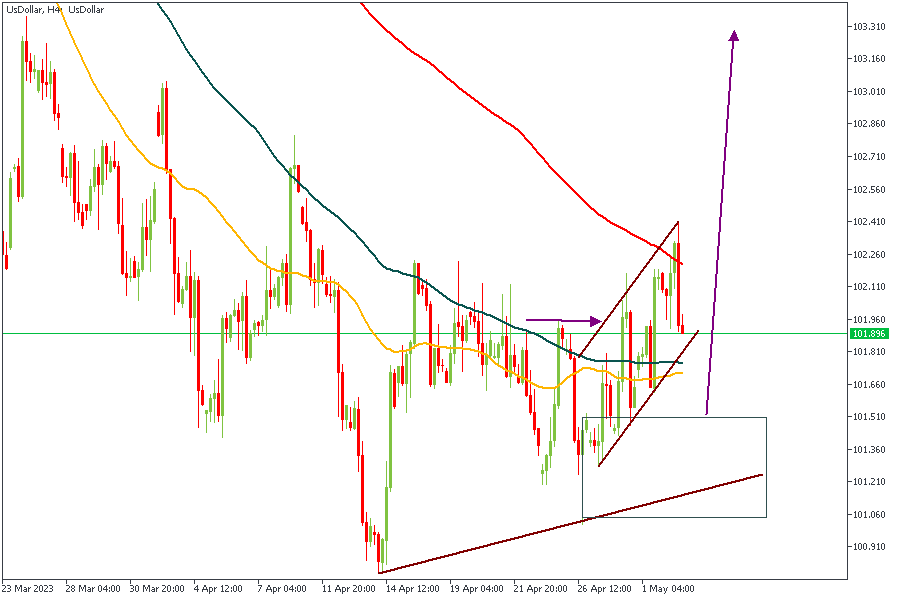
The US Dollar has undoubtedly been bleeding for a few weeks now with only a few occasional retracements - one of which occurred on Monday, as earlier mentioned. The important case here, however, is to consider whether or not the recent break of structure would be a ray of sunshine or a storm cloud. The price action confirmations supporting a likely bullish reversal include a trendline support, a market structure break, and a drop-base-rally demand zone. These are important because all of these are happening smack in the middle of a demand zone on a daily timeframe.
Analysts’ Expectations:
- Direction: Bullish
- Target: 102.162
- Invalidation: 100.765
GBPUSD - H4 Timeframe
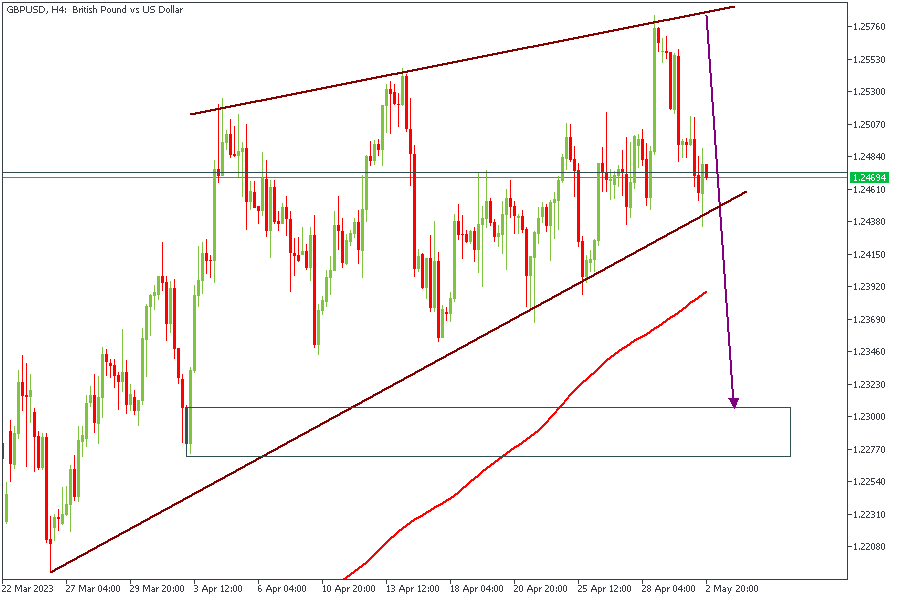
As I mentioned earlier, the weekly timeframe of GBPUSD retested a supply zone. On the 4-Hour timeframe, however, the price is consolidating within a wedge pattern and would likely turn bearish in a while. This sentiment is based on the price action confirmation from the trendline resistance - occurring inside the weekly supply zone and the 200-period moving average on the weekly timeframe.
Analysts’ Expectations:
- Direction: Bearish
- Target: 1.23982
- Invalidation: 1.25961
XAUUSD - H4 Timeframe
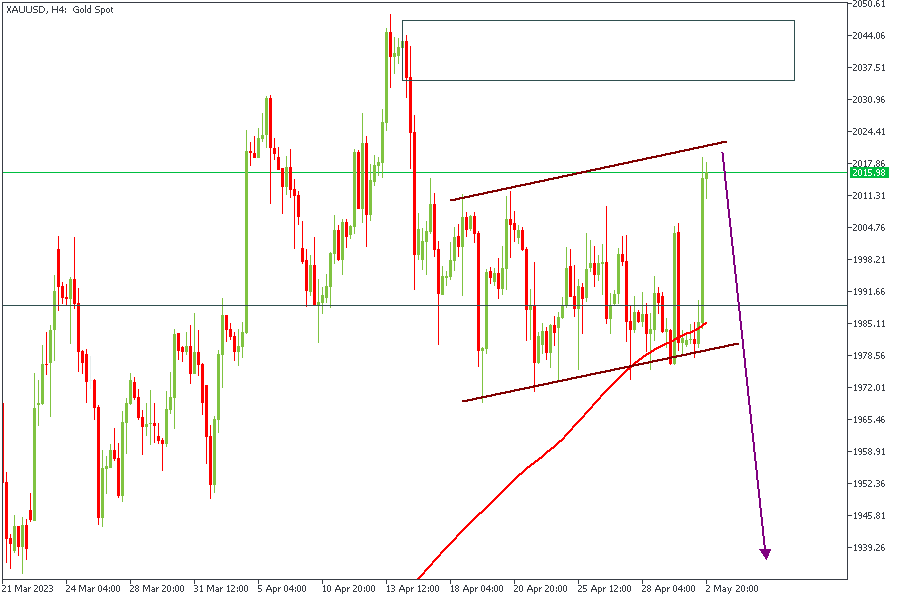
Gold typically presents a typical consolidation channel inside the weekly supply zone. There is also, however, a rally-base-drop supply zone at the most recent H4 high. My major sentiment remains bearish regardless, pending the Fed's decision. If the decision is positive for the Dollar, it'd be the final piece of the puzzle.
Analysts’ Expectations:
- Direction: Bearish
- Target: $2050.20
- Invalidation: $1987.50
US30 - H4 Timeframe
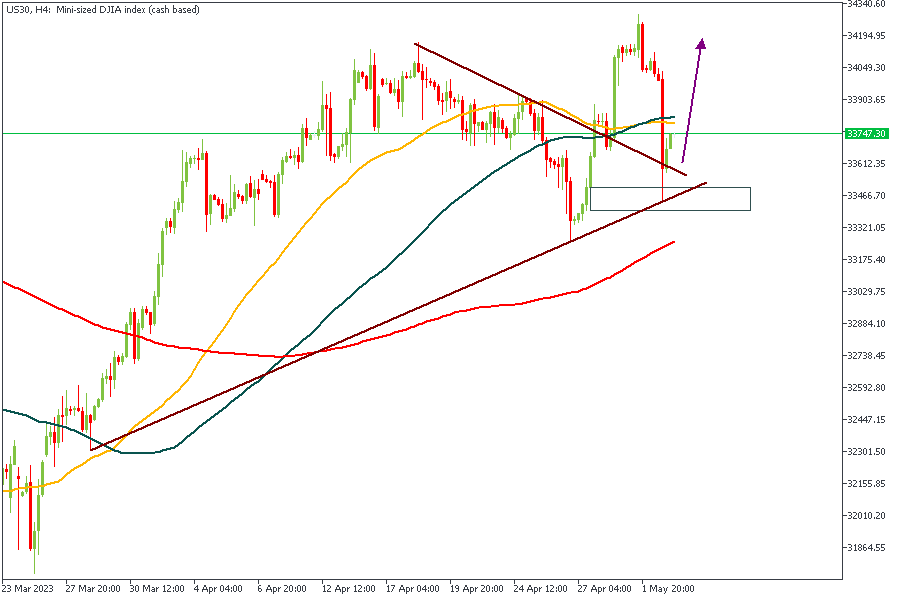
The US30 index has already kicked off in favor of the US Dollar. The onset of the bullish price action is the confluence of trendline support and the drop-base-rally demand zone. Should the interest rate decision be raised as projected, the ensuing strength for the Dollar is expected to push US30 toward the 34145 region.
Analysts’ Expectations:
- Direction: Bullish
- Target: $34023.33
- Invalidation: $33405.50
CONCLUSION
The trading of CFDs comes at a risk. Thus, to succeed, you have to manage risks properly. To avoid costly mistakes while you look to trade these opportunities, be sure to do your due diligence and manage your risk appropriately.
Bitcoin Sticks to Bull Trend on Banks’Woes
Market picture
Over the past 24 hours, the crypto market capitalisation rose 1.4% to $1.18 trillion.
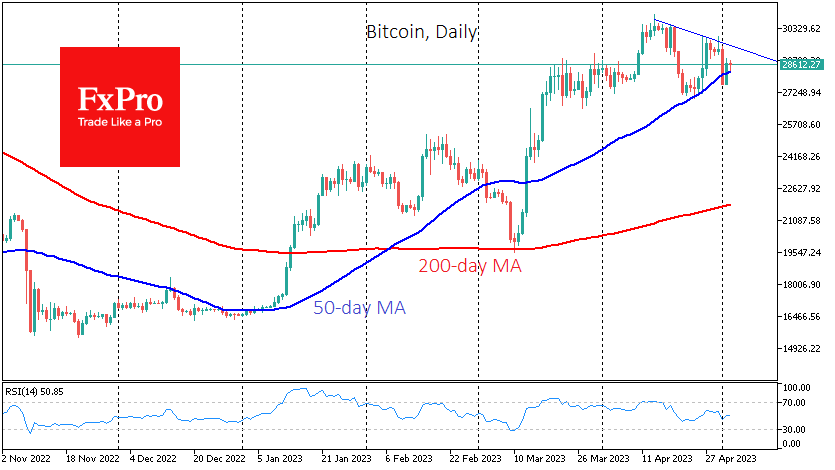
On Tuesday, Bitcoin recovered to $28.6K, over half of the previous day’s decline. Cryptocurrencies and gold gained momentum on the re-emerging woes of regional banks. This time it was PacWest Bancorp, Western Alliance and Metropolitan. However, we also note that the price stabilised before this news, suggesting that the selling momentum has subsided.
Bitcoin has steadily moved back above its 50-day moving average, proving that the break below was false. The upcoming Fed rate decision promises to increase volatility later in the day. A consolidation above $29.3K (the start of the sell-off) or a break below $28.2K (the 50-day moving average) could signal that the market has decided on a direction for the next few days or weeks.
News Background
According to CoinShares, investments in crypto funds fell by $72 million last week, continuing outflows for the second week. Bitcoin investments decreased by $46 million and Ethereum by $19 million (the largest outflow since September 2022).
Bitcoin transaction volume reached an all-time high established in December 2017 amid a surge in activity related to the Ordinals project, enabling the NFTs issuance on the BTC blockchain.
The main factor behind the suspension of the Bitcoin rally was the sell orders of “new investors” near $30K, Glassnode noted. Unconfirmed rumours of sales by Mt. Gox customers, the US government, and the revival of “old” BTC only added to the volatility.
MicroStrategy posted a net profit of $461.2 million for the first quarter. The company increased its position in digital gold from 7,500 BTC to 140,000 BTC. “The conviction in our bitcoin strategy remains strong,” the press release said.