Sample Category Title
Dollar Index: Dollar Holds in Red ahead of Fed Policy Decision
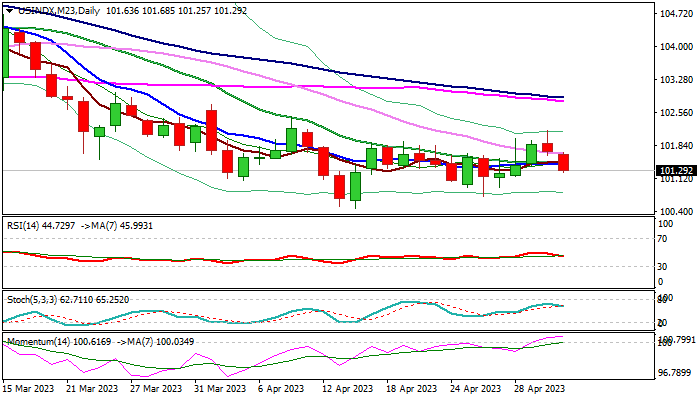
The dollar index remains in defensive for the second straight day as markets await Fed’s decision at the end of two day policy meeting.
The central bank is widely expected to deliver another 25 basis points rate hike, but markets focus on the signals about Fed’s next steps, in light of the current situation, as a number of factors contribute to decision whether to continue policy tightening or to signal a pause, probably until the end of the year.
Inflation in the US continues to ease from its recent peak, but is still too high, while underlying inflation picked up again in March, adding to worries that the worst may not be behind us and keeping pressure on Fed to extend its tightening campaign.
The economy was hit by strong rise in borrowing cost and slowed the activity, but analysts think that the slowdown was not fast enough to push inflation towards 2% target
Conversely, recent weak US economic data, growing tensions in the banking sector and worries that the government could run out of cash after June 1 without further rise in debt ceiling, add to argument that the Fed should be very cautious in making its decision while pressured by two opposite forces.
Technical picture on daily chart is weakening as the price fell below converged daily Tenkan-sen / Kijun-sen which remain in bearish setup, RSI declined below neutrality zone, but still strong bullish momentum partially counters negative signals.
Fresh extension lower on Wednesday marked more than 50% retracement of 100.45/102.17 ascend, adding to weak near-term outlook, along with prospect for the third consecutive failure to register weekly close above 101.73 Fibo barrier (23.6% retracement of 105.85/100.45 bear-leg).
Today’s close below Fibo 50% level at 101.31 would add to negative near-term outlook and increase risk of renewed attack at key supports at 100.66/45 (lows of Feb 2/Apr 14).
Alternatively, bounce and close above 101.60 zone (daily Kijun-sen / Asian session high) would ease downside pressure, though extension above Monday’s peak (102.17) is still needed to bring bulls fully in play.
The dollar would react negatively in a widely expected scenario on 25 bps hike today and signal of a pause in tightening cycle, while more hawkish Fed’s stance would offer fresh support to the greenback.
Res: 101.44; 101.60; 101.76; 101.99.
Sup: 101.11; 100.86; 100.66; 100.45.
Eurozone unemployment rate hits record low at 6.5%
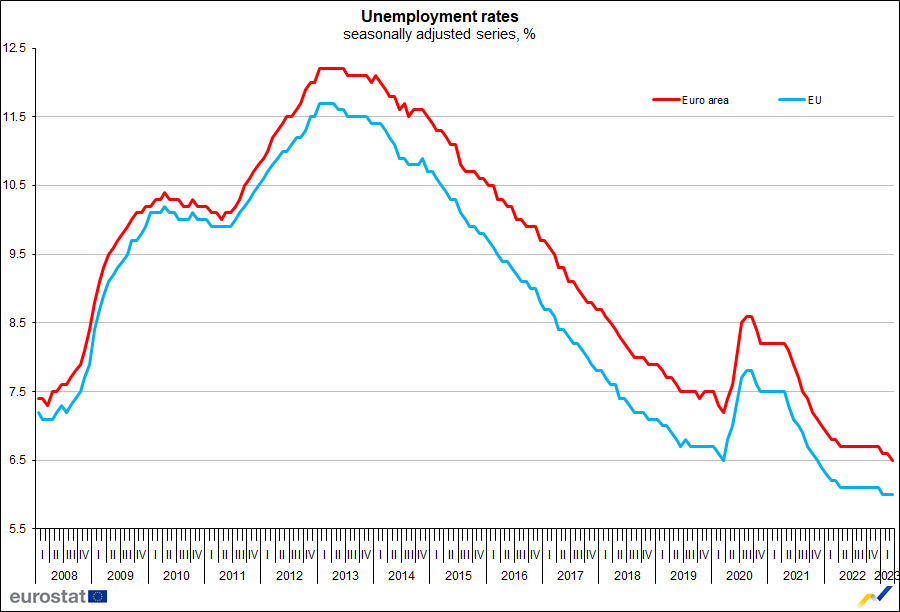
Eurozone unemployment rate dipped to a new record low in March, falling from 6.6% to 6.5%, below the expected 6.6%. Meanwhile, the EU unemployment rate remained steady at 6.0%.
Eurostat estimates that 12.96m individuals in EU, including 11.01m in Eurozone, were unemployed in the month. This marks a decrease of -155k in EU and -121k in Eurozone compared to February. Furthermore, compared to March 2022, unemployment fell by -353k in EU and -365k in the Eurozone.
Has Gold Regained its Luster?
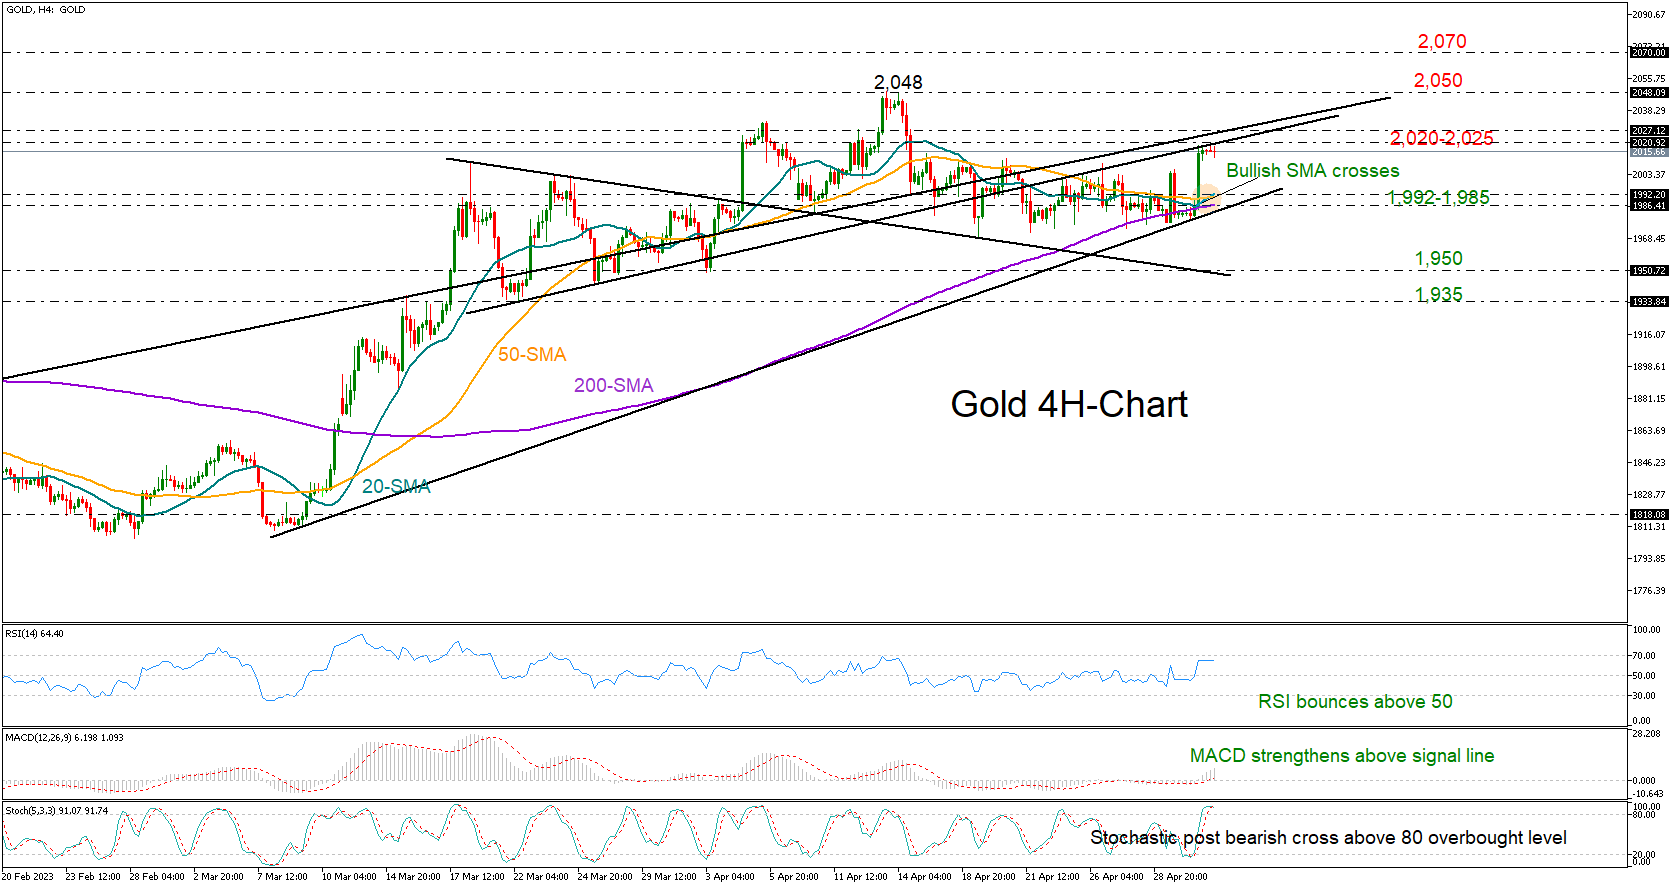
Gold spiked back above 2,000 during Tuesday’s early US trading hours but it immediately faltered near the 2,020 level as the bulls got trapped below key trendlines ahead of the FOMC policy announcement.
The support-turned-resistance trendline drawn from March 22 and the longer-term upward-sloping line coming from November 29 have been keeping the bulls busy within the 2,020-2,025 region over the past couple of hours. Therefore, although the latest turnup in the price sent the RSI and the MACD into the bullish area, the precious metal will need to jump above that border to crawl up to the key 2,050 resistance zone. Slightly higher, the price will retest the record high of 2,070 before meeting the 2,100 psychological level.
Encouragingly, the 20-period simple moving average (SMA) is set to post a double bullish cross with the 50- and 200-period SMAs, increasing optimism for a positive trend continuation.
Nevertheless, if the price fails to close above 2,025, it may reverse lower to seek support within the 1,992-1,985 zone. This is where the simple moving averages (SMAs) on the four-hour chart and the tentative ascending trendline from March 8 are located. Should the bears breach that base, the sell-off may worsen towards the 1,950 area, while lower, some consolidation may emerge around 1,935.
In brief, gold’s latest pickup lost impetus near a key resistance zone, bringing some caution back into play. Buyers may stay patient until the yellow metal closes above 2,025.
JP225 Index Just Below 16-month High
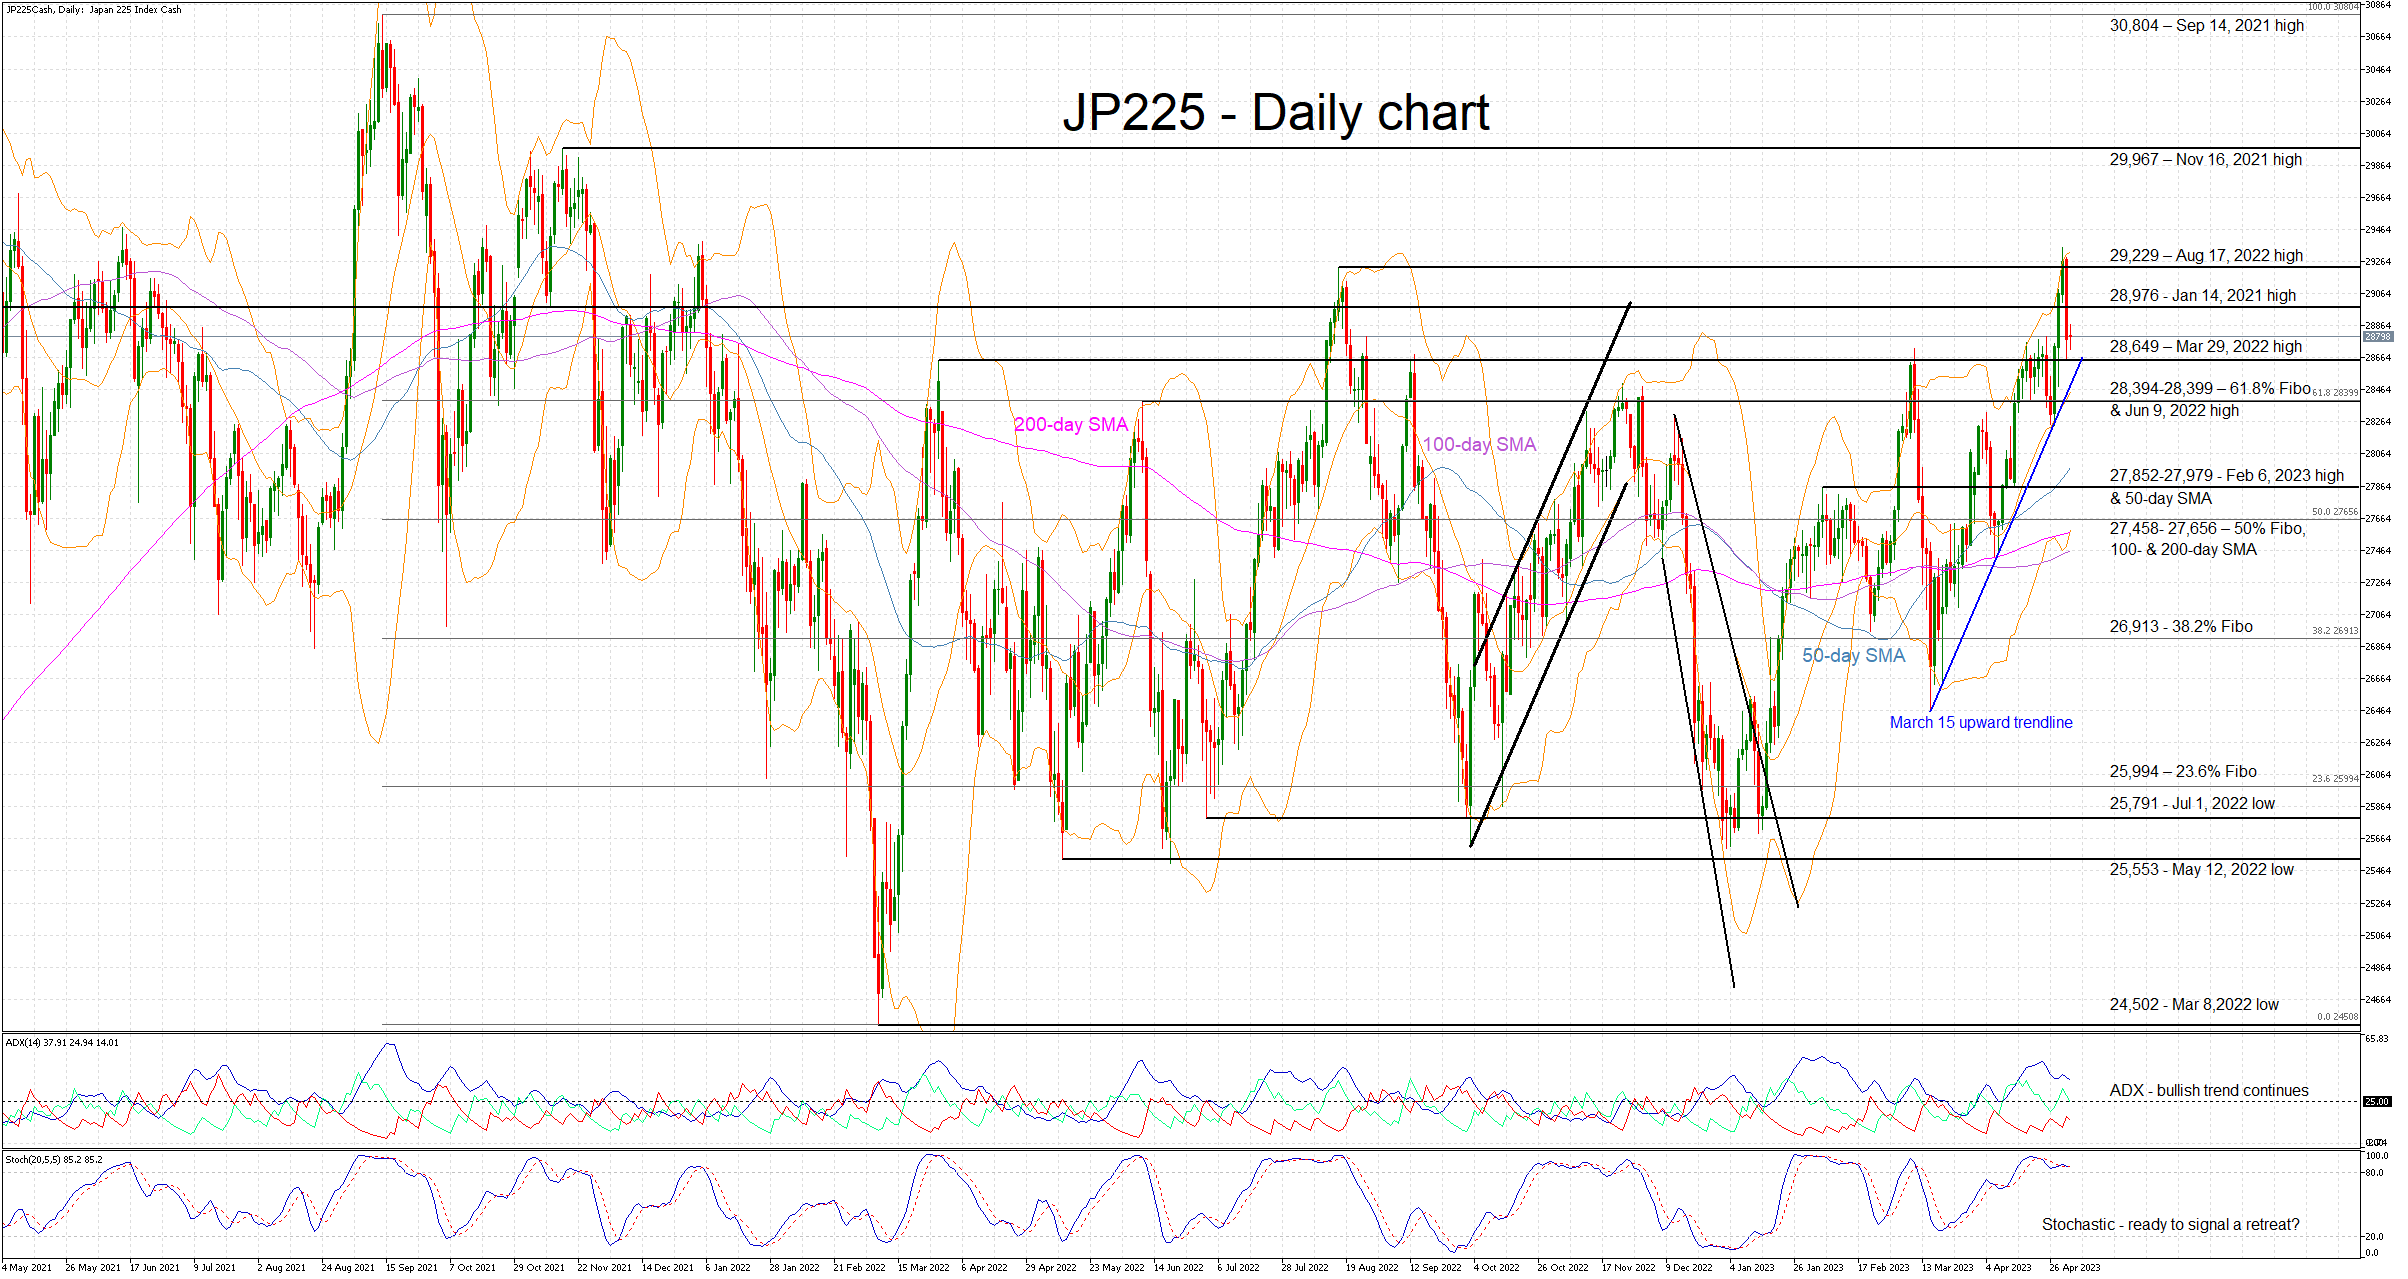
The JP225 cash index is edging higher today, but remains just below the May 1, 2023 print of 29,352, which is the highest traded level since January 5, 2022. The bulls are trying to push the index again towards the recent higher high, but the overall technical picture is less clear at the moment, increasing the possibility of a stronger pullback.
While the Average Directional Movement Index (ADX) is still signaling a strong bullish trend, the stochastic oscillator conveys a more mixed message. It remains inside its overbought (OB) area, where it can stay for an extended period of time, but it appears to be toppy. A potential break below the OB territory will most likely drag the JP225 index considerably lower.
Should this be the case, a retest of both the March 29, 2022 high at 28,649 and the March 15, 2023 upward sloping trendline will come first. The busy 28,394-28,399 area, defined by the 61.8% Fibonacci retracement level of the September 14, 2021 – March 8, 2022 downtrend and the June 9, 2022 high, would then come into play.
If the bulls decide to ignore the mixed technical signs, they will most likely have another go at the crucial 29,229 level provided that they overcome the January 14, 2021 high at 28,976. The path appears to be clear then until the 29,967 level set by the November 16, 2021 high.
To conclude, JP225 index bulls seem to be aiming for another retest of the recent highs, but hasty moves could cause a stronger reaction from the bears and quickly unwind the bulls’ hard-earned gains.
EURJPY Storms to Fresh 14½-Year High
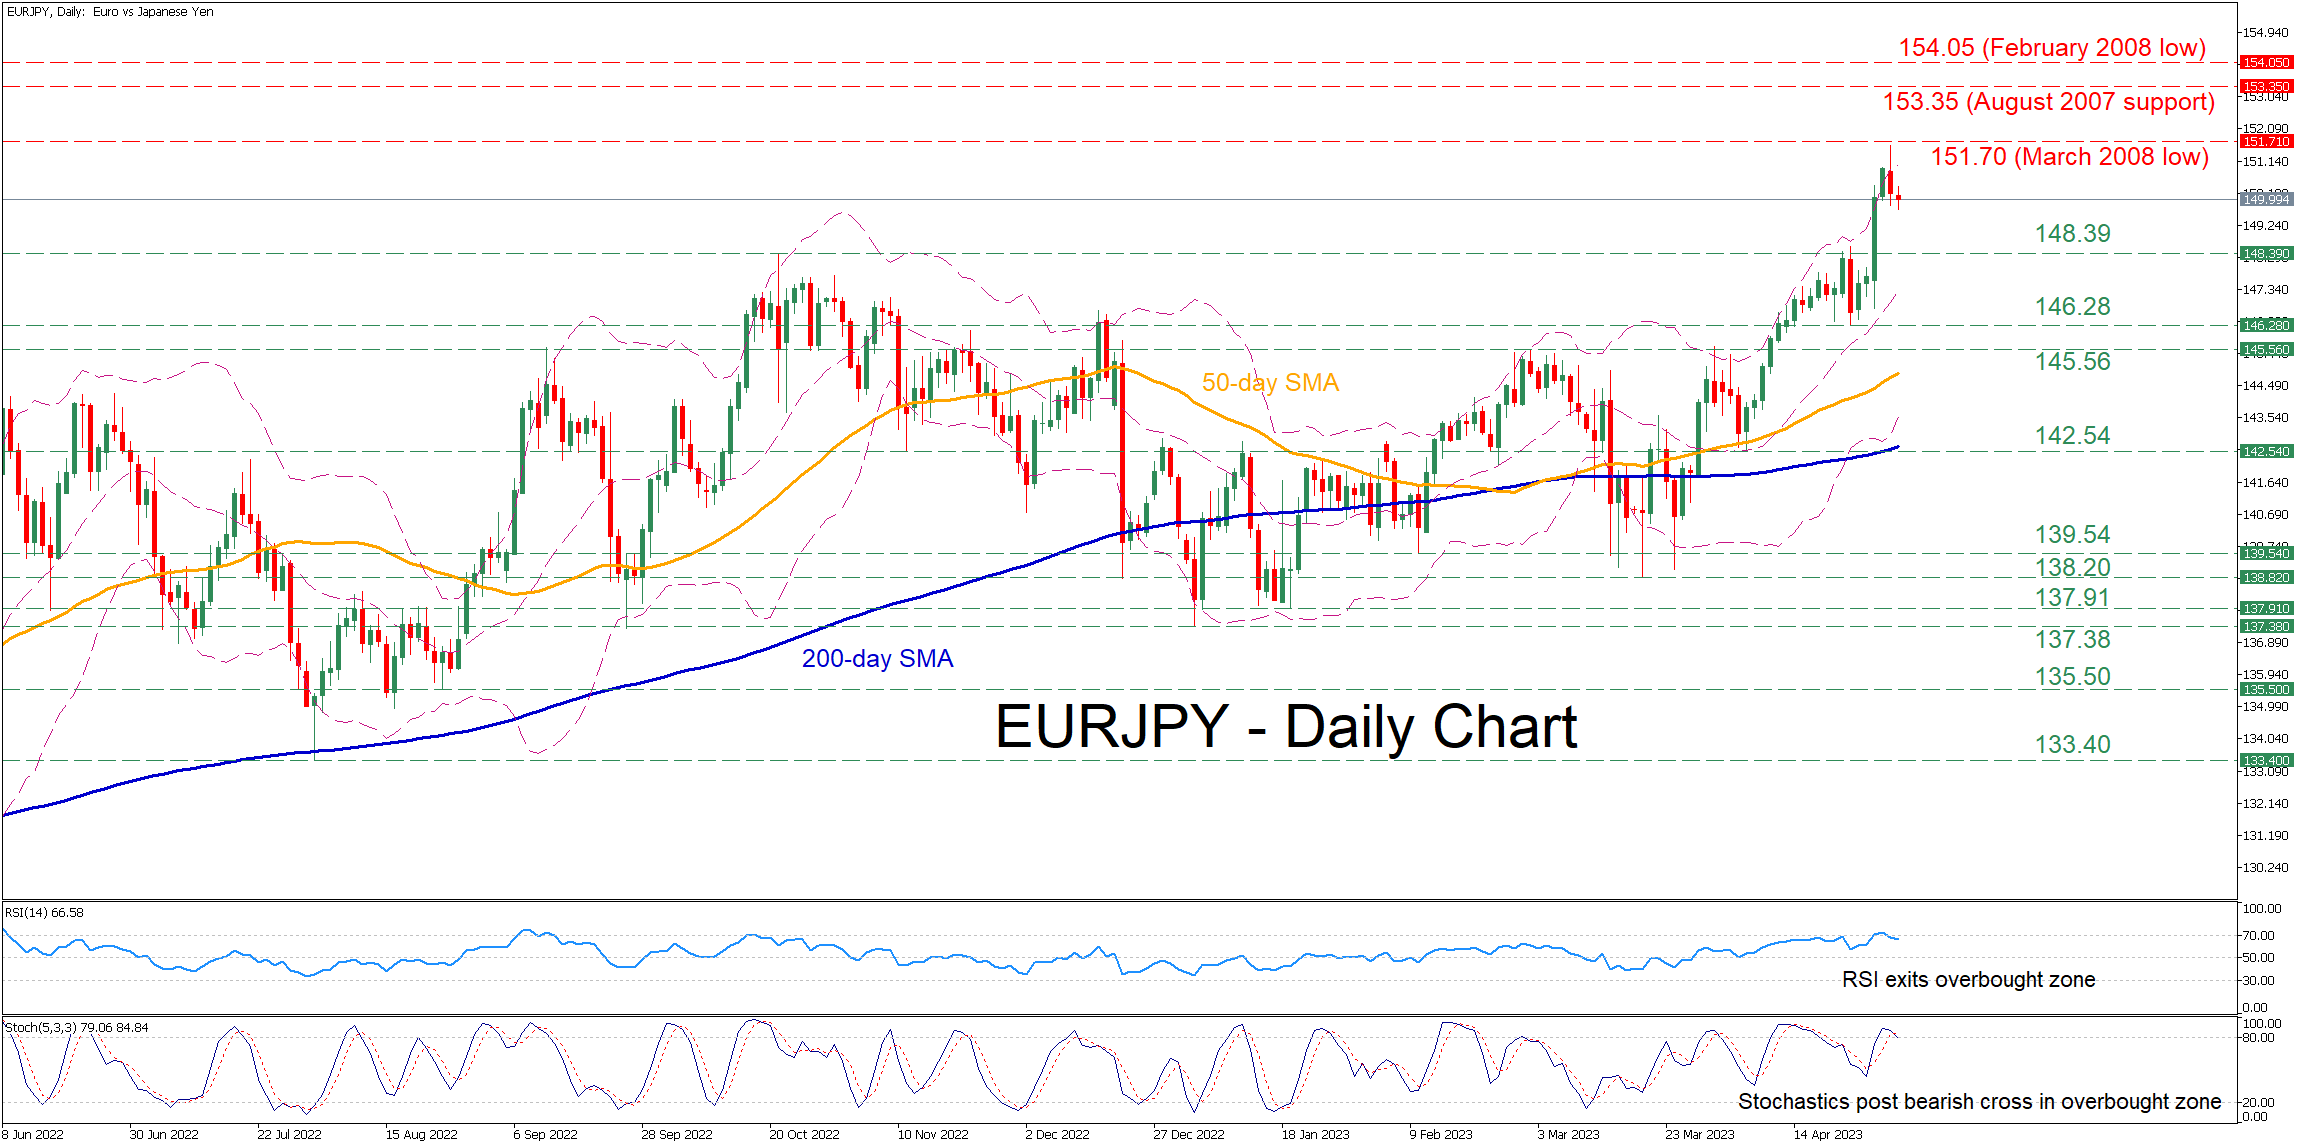
EURJPY has been in a steep uptrend since early April, generating a structure of consecutive multi-year highs. In the previous daily session, the pair posted a fresh 14½-year peak of 151.60 before paring some gains.
The momentum indicators currently suggest that a downside correction may be on the cards. Specifically, both the RSI and the stochastic oscillator declined below their overbought territories, hinting that the recent rally had been overstretched.
To the downside, bearish actions could send the price to test the October 2022 high of 148.39, which could act as support in the future. If that barricade fails, the bears could aim for 146.28 before the 145.56 hurdle gets tested. Even lower, the 142.54 support region, which overlaps with the 200-day simple moving average (SMA), may curb further declines.
On the flipside, if bullish pressures persist, the March 2008 low of 151.70 could serve as initial resistance. Piercing through that zone, the pair could ascend towards the August 2007 support of 153.35. A violation of that territory could set the stage for the February 2008 low of 154.05.
Overall, EURJPY has staged a massive rally posting consecutive higher highs. Nevertheless, short-term oscillators are indicating some weakness in the price action, opening the door for a moderate pullback.
WTI Oil: Oil Price Extends Weakness After 5.5% Drop on Tuesday
Oil price extends weakness after 5.5% drop on Tuesday, driven by demand worries and expected interest rate hikes.
Crude prices remain in red in early Wednesday and hit new lowest since Mar 27, keeping negative sentiment on growing concerns over darkening macroeconomic outlook and its impact on oil demand.
Markets also focus on two key events – Fed and ECB policy meetings, due today (Fed) and on Thursday (ECB).
Both central banks are expected to raise interest rates and investors will be looking for signals about Fed’s future policy path, as signs of further rise in borrowing cost would add to negative impact on economic growth and hurt demand, as economic outlook was also weighed by the crisis in the banking sector.
Unexpected drop in China’s manufacturing activity also contributes to demand woes, as China is world’s top oil importer and the largest energy consumer.
On the other hand, OPEC oil output fell in April and expected to drop further in May, when the latest OPEC measure for production cuts take effect, with US stockpiles falling for the third consecutive week.
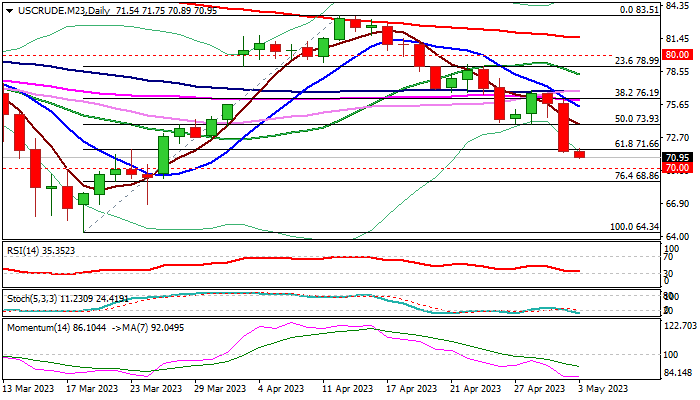
Oil price fell by 5.5% on Tuesday (the biggest daily loss in 2023) and generated fresh negative signal on close below pivotal Fibo support at $71.66 (61.8% retracement of $64.34/$83.51).
Bears pressure support at $70.89 (daily Ichimoku cloud base), the last obstacle en-route to psychological $70 support and $68.86 (Fibo 76.4% retracement) where stronger headwinds could be expected, as oversold daily studies.
Potential upticks should be capped by daily cloud top ($73.49) to keep bears intact.
Res: 71.66; 72.48; 73.49; 74.00.
Sup: 70.89; 70.00; 68.86; 66.81.
GBP/JPY Daily Outlook
Daily Pivots: (S1) 168.49; (P) 169.38; (R1) 170.86; More...
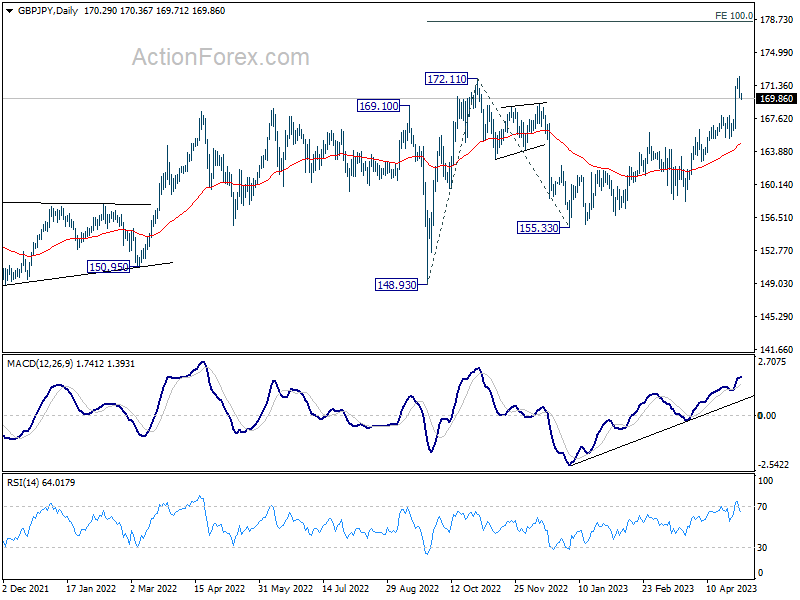
Intraday bias in GBP/JPY is turned neutral with current retreat. Some consolidations would be seen but downside should be contained by 165.40 support. Break of 172.30 will resume larger up trend to 100% projection of 148.93 to 172.11 from 155.33 at 178.51.
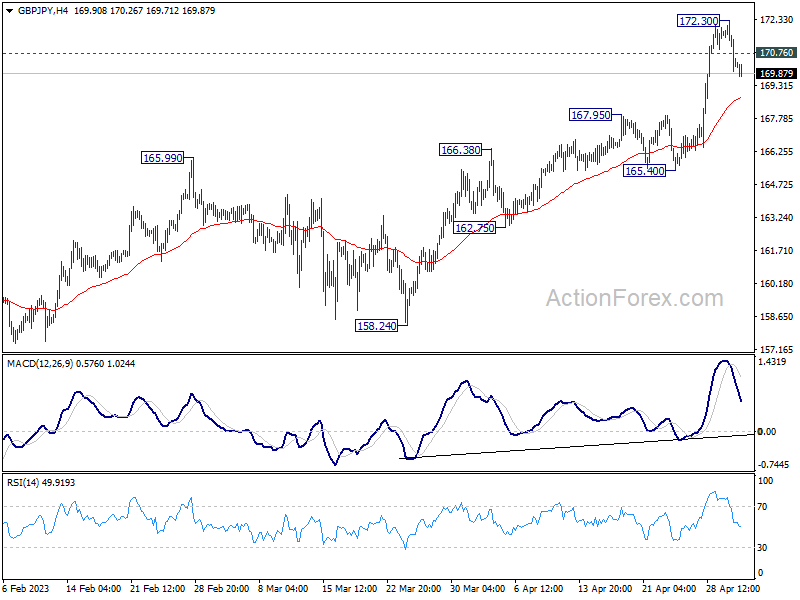
In the bigger picture, based on current momentum, up trend from 123.94 (2020 low) is likely ready to resume. Next target is 161.8% projection of 122.75 (2016 low) to 156.59 (2018 high) from 123.94 at 178.69. This will now remain the favored case as long as 165.40 support holds, in case of retreat.
EUR/JPY Daily Outlook
Daily Pivots: (S1) 148.78; (P) 149.51; (R1) 150.57; More....
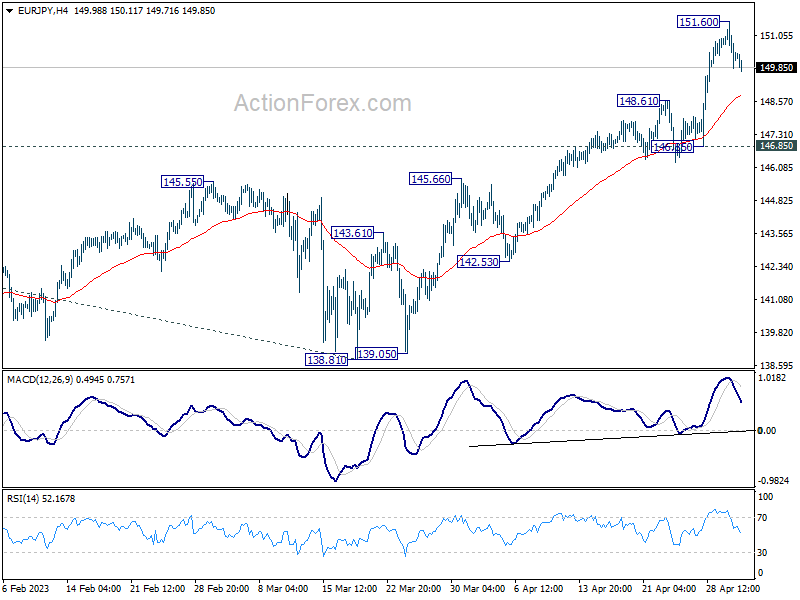
Intraday bias in EUR/JPY is turned neutral with current retreat. Some consolidations could be seen, but downside should be contained by 146.85 support to bring another rally. Break of 151.60 will resume larger up trend to 153.64 projection level.
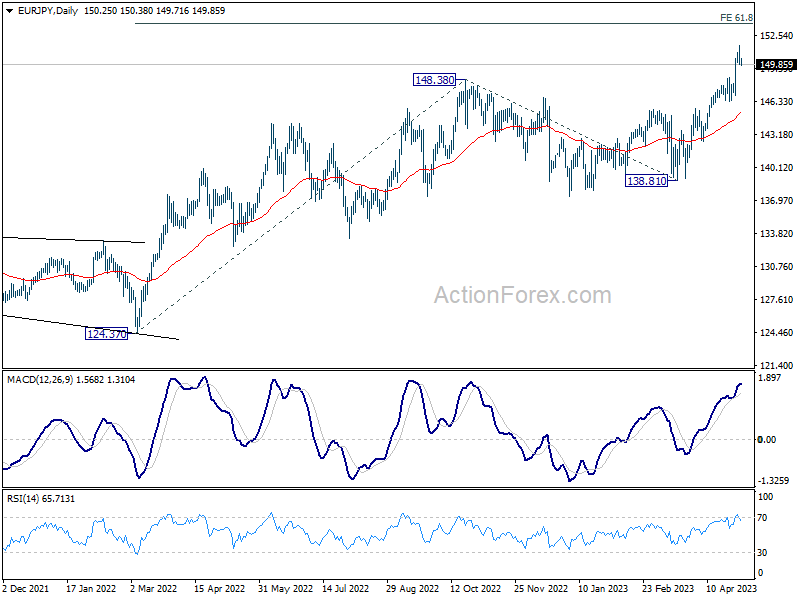
In the bigger picture, current development indicates that rise from 114.42 (2020 low) is in progress. Next target is 61.8% projection of 124.37 to 148.38 from 138.81 at 153.64. Sustained break there will pave the way to 100% projection at 162.82. For now, medium term outlook will remain bullish as long as 138.81 support holds, even in case of deep pull back.
EUR/GBP Daily Outlook
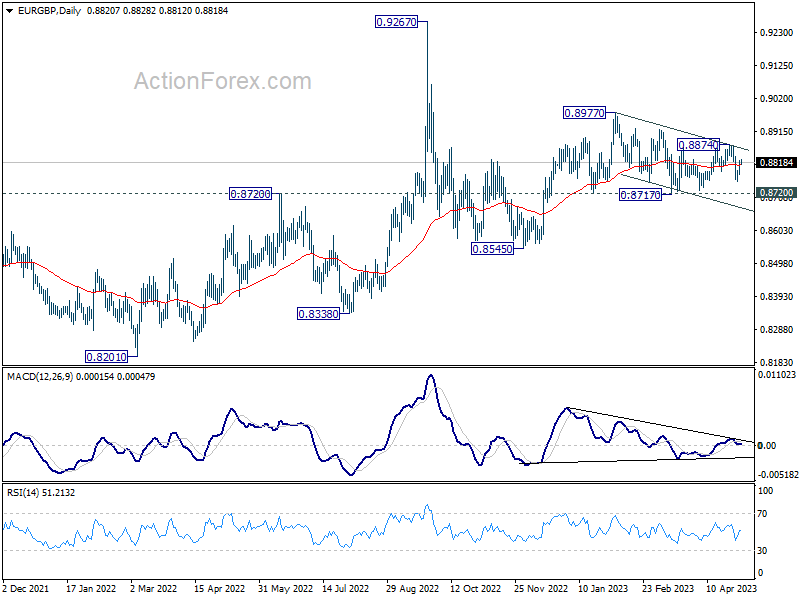
Daily Pivots: (S1) 0.8761; (P) 0.8791; (R1) 0.8808; More...
Outlook in EUR/GBP remains mixed and intraday bias stays neutral. On the downside, decisive break of 0.8717 support will resume whole choppy decline from 0.8977. On the upside, break of 0.8874 will resume the rebound from 0.8717 instead.
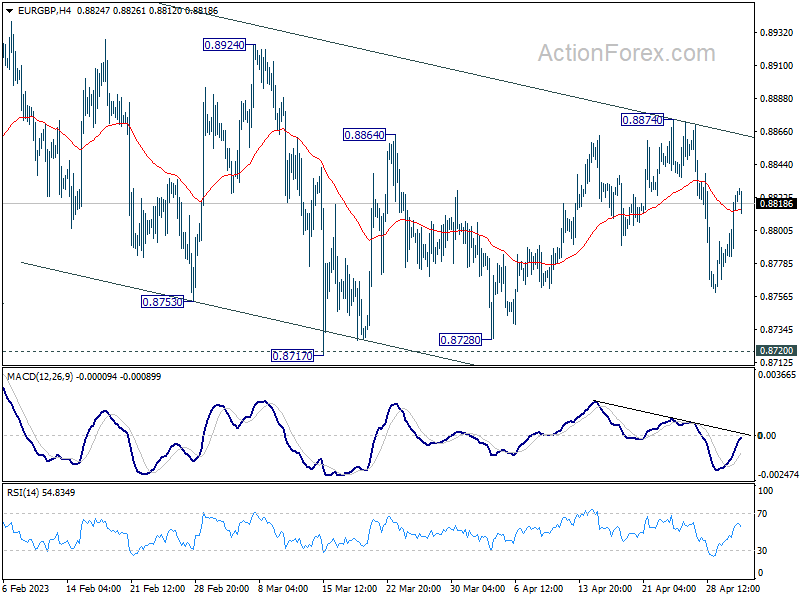
In the bigger picture, outlook remains rather mixed for now, except that price actions from 0.9267 (2022 high) are part of the long term range pattern from 0.9499 (2020 high). With 0.8720 support intact, rise from 0.8545 is in favor to continue through 0.8977. However, firm break of 0.8720 will argue that such rebound has completed, and open up deeper fall through this support level.
EUR/AUD Daily Outlook
Daily Pivots: (S1) 1.6257; (P) 1.6382; (R1) 1.6483; More...
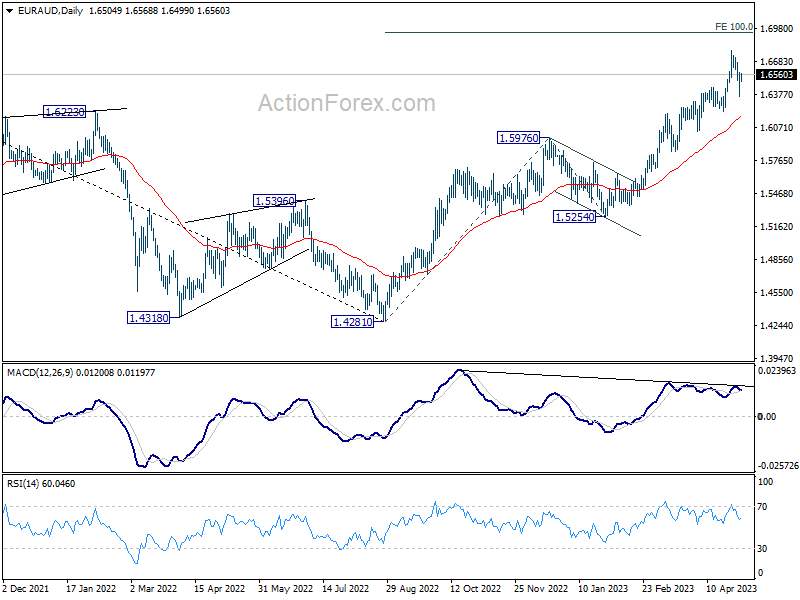
Intraday bias in EUR/AUD is turned neutral at it recovered after hitting near term channel support. Overall further rally is expected as long as 1.6219 support holds. Break of 1.6785 will resume larger up trend to 100% projection of 1.4281 to 1.5976 from 1.5254 at 1.6949. However, firm break of 1.6219 will argue that larger correction is on the way.
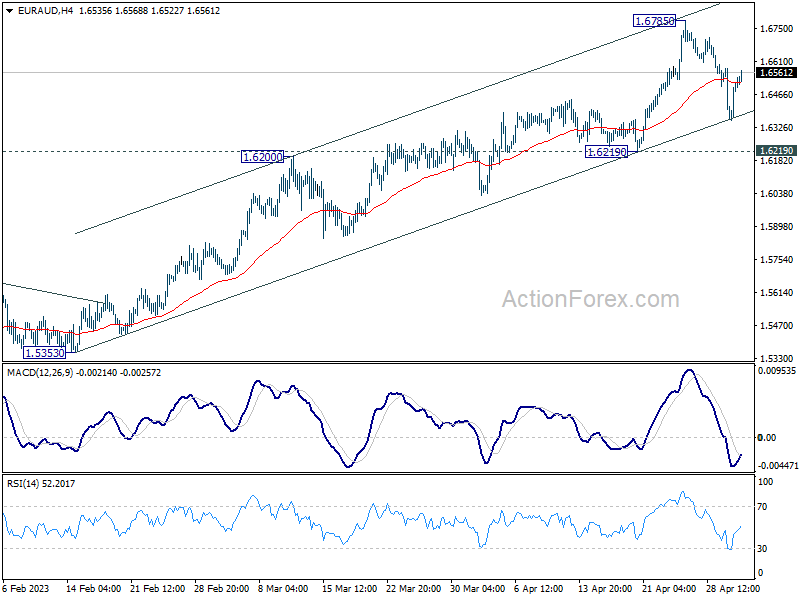
In the bigger picture, the solid break of 1.6434 resistance argues that whole down trend from 1.9799 (2020 high) has completed at 1.4281 (2022 low). Further rise should be seen to 61.8% retracement of 1.9799 to 1.4281 at 1.7691 next. For now, outlook will stay bullish as long as 1.5976 resistance turned support holds, even in case of deep pull back.