

Sample Category Title
GBP/USD Daily Outlook
Daily Pivots: (S1) 1.2396; (P) 1.2432; (R1) 1.2472; More...
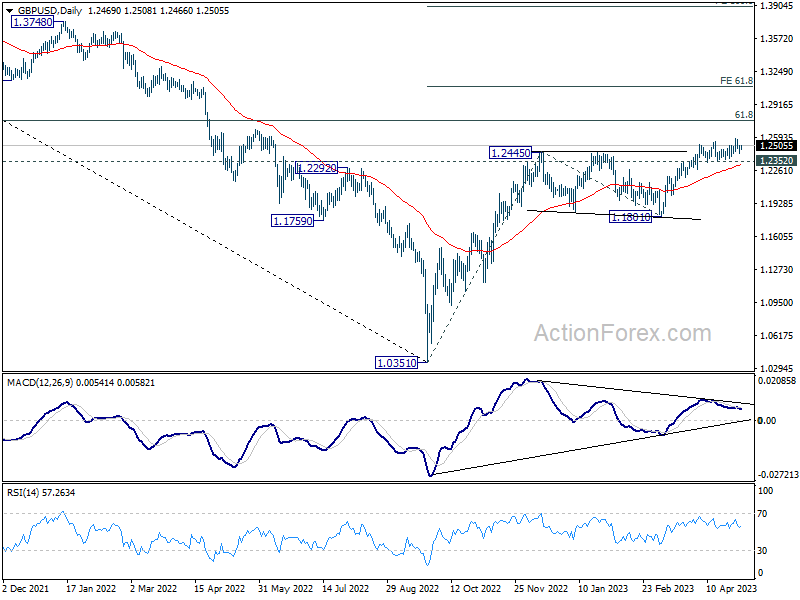
Outlook in GBP/USD is unchanged with consolidation from 1.2582 extending. Intraday bias neutral and further rise is expected as long as 1.2352 support holds. On the upside, above 1.2582 will target 1.2759 fibonacci level first. Firm break there will target 61.8% projection of 1.0351 to 1.2445 from 1.1801 at 1.3095. However, considering bearish divergence condition in 4H MACD, break of 1.2352 will confirm short term topping, and turn bias back to the downside for deeper pull back.
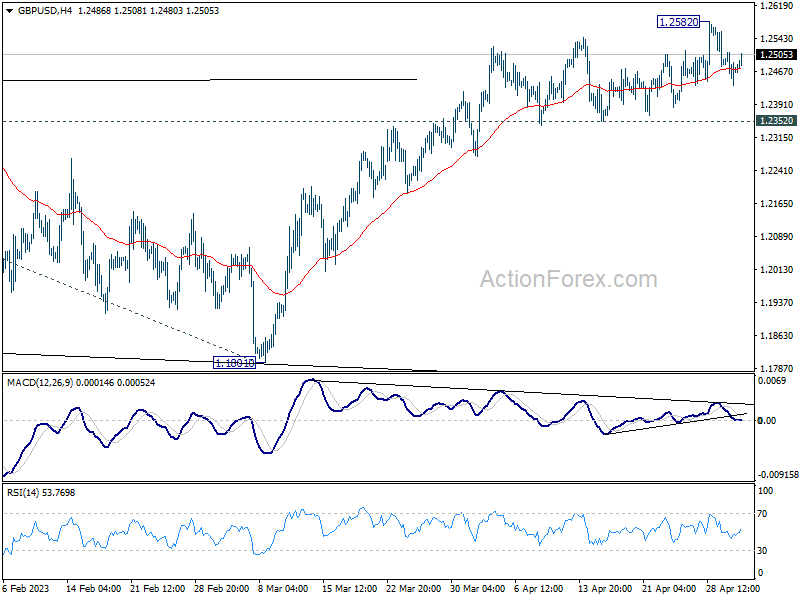
In the bigger picture, the rise from 1.0351 medium term term bottom (2022 low) is in progress for 61.8% retracement of 1.4248 (2021 high) to 1.0351 at 1.2759. Sustained break there will add to the case of long term bullish trend reversal. Further break of 61.8% projection of 1.0351 to 1.2445 from 1.1801 at 1.3095 could prompt upside acceleration to 100% projection at 1.3895. For now, this will remain the favored case as long as 1.1801 support holds, even in case of deep pull back.
USD/CHF Daily Outlook
Daily Pivots: (S1) 0.8880; (P) 0.8906; (R1) 0.8951; More...
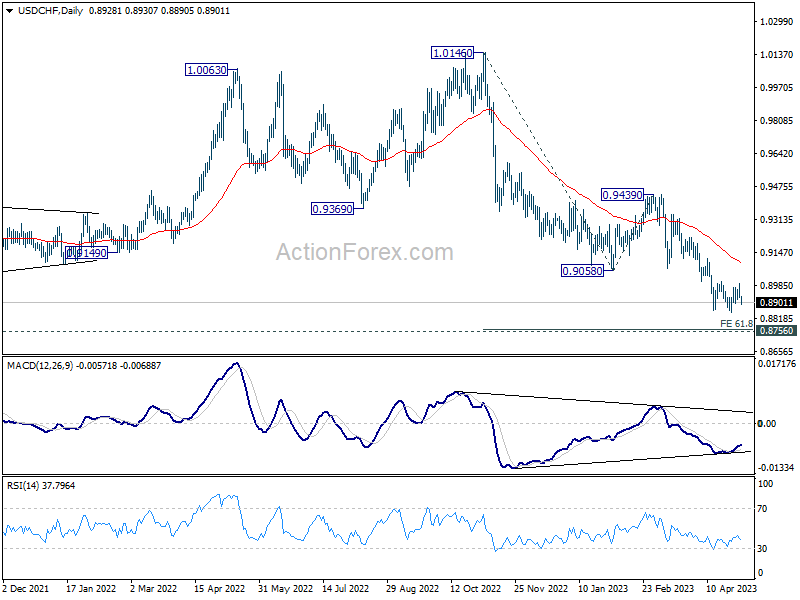
No change in USD/CHF's outlook as sideway trading continues. On the upside, decisive break of 0.9001 resistance should confirm short term bottoming at 0.8850. Intraday bias will be back on the upside 55 D EMA (now at 0.9094). Sustained break there will be a strong sign of bullish reversal. On the downside, break of 0.8850 will resume larger fall from 1.0146, to 61.8% projection of 1.0146 to 0.9058 from 0.9439 at 0.8767, which is close to 0.8756 long term support. Strong support is expected there to bring rebound, at least on first attempt.
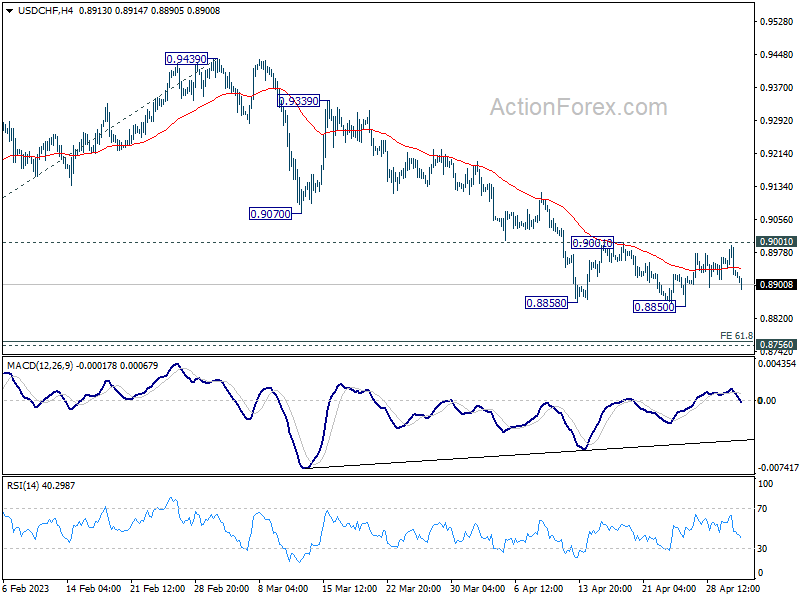
In the bigger picture, fall from 1.1046 (2022 high) is in progress for 0.8756 support (2021 low). But overall, this fall is still seen as a leg in the long term range pattern from 1.0342 (2016 high). So, downside should be contained by 0.8756 to bring reversal. Sustained break of 0.9058 support turned resistance will be the first sign of medium term bottoming. However, decisive break of 0.8756 will carry larger bearish implications.
Is USDJPY Creating a Double Top Formation?
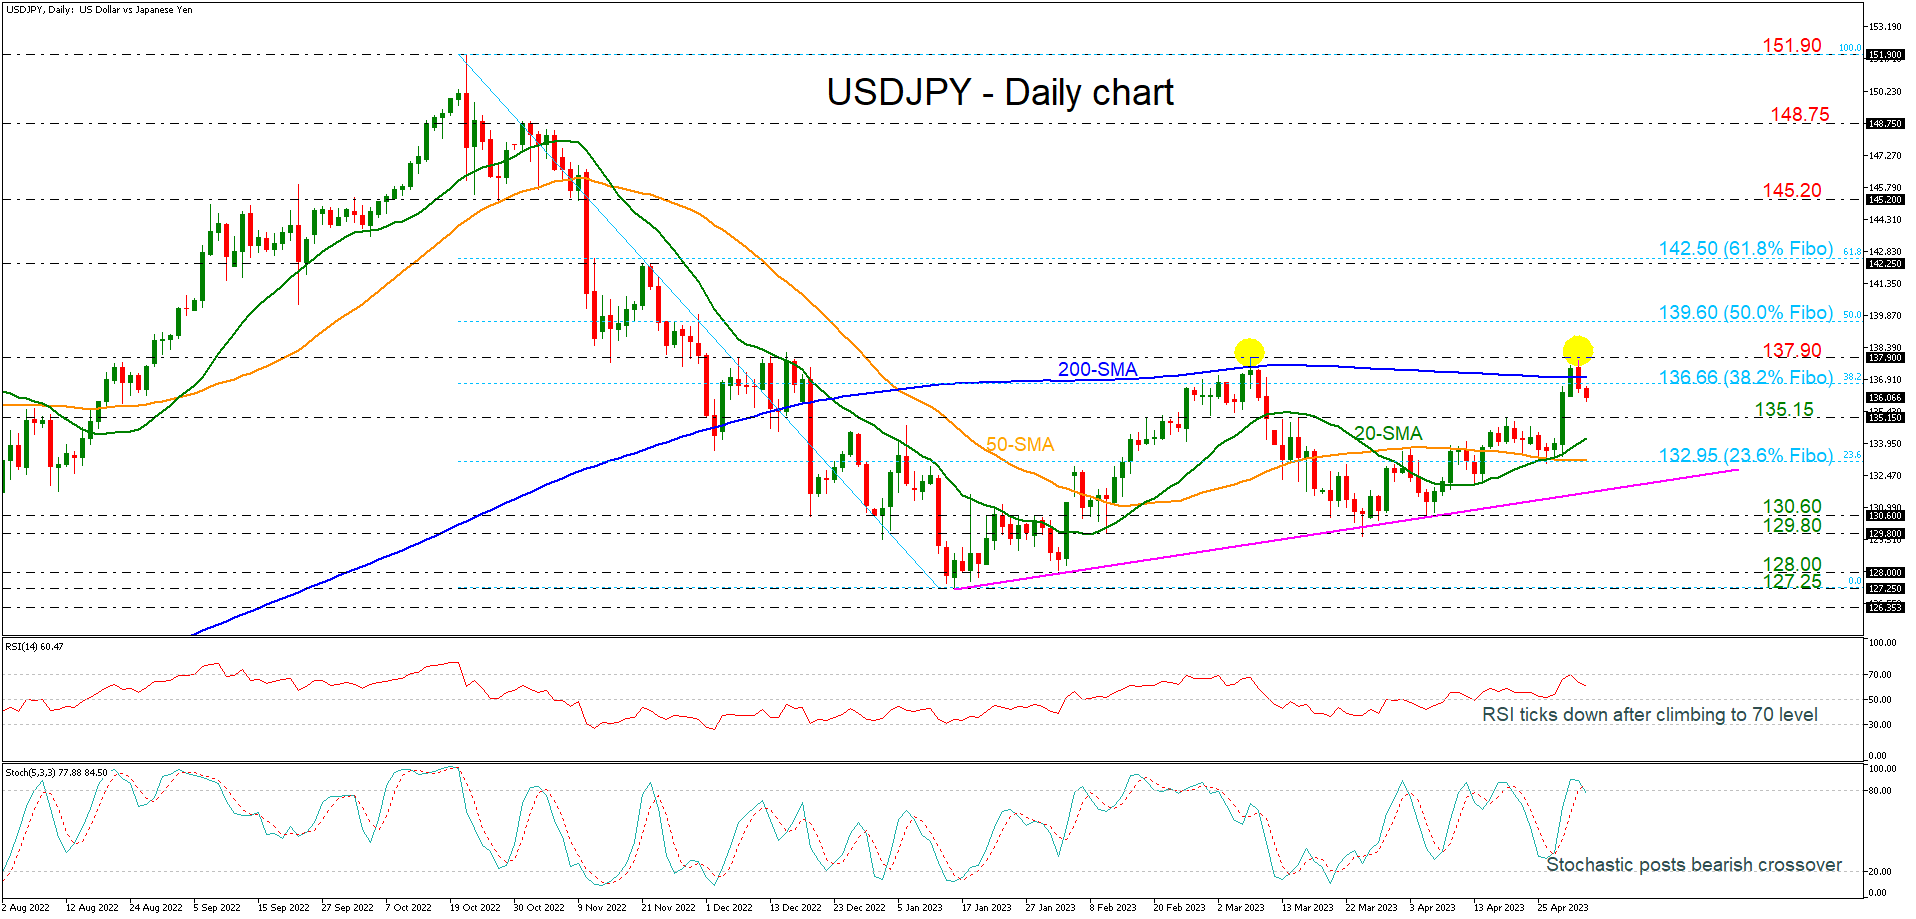
USDJPY plunged below the 200-day simple moving average (SMA) once again after the climb towards the 137.90 resistance level, which is acting both as a significant resistance level and a possible double top pattern is in progress. The pullback below the 38.2% Fibonacci retracement level of the down leg from 151.90 to 127.25 at 136.66 is indicating the start of a consolidation area in the medium-term timeframe.
Technically, the RSI has found strong resistance near the 70 level and dropped lower again, while the stochastic oscillator posted a bearish crossover within its %K and %D lines in the overbought region, suggesting that more losses could come.
More declining movement could meet the 135.15 support ahead of the 20- and the 50-day SMAs at 134.20 and 132.95 respectively, which overlaps with the 23.6% Fibonacci of 132.95. Slightly lower, the uptrend line at 132.14 may halt bearish actions; however, steeper losses could change the outlook to neutral, hitting 130.60.
Otherwise, any successful attempts above the 137.90 barrier could open the way for a rally until the 50.0% Fibonacci of 139.60 and the 142.25 hurdle. Marginally higher, the 61.8% Fibonacci of 142.50 could be the next target.
All in all, USDJPY may give the green light for the start of a double top formation after the touch of the 137.90 level. Only a jump above the aforementioned mark could switch the outlook back to a bullish one.
Fed to Deliver Last Hike Amid New Bank Turmoil
Market movers today
Today's main event is the FOMC meeting where we expect the Fed to deliver their final 25bp hike, which would send the Federal Funds target range to 5.00-5.25%. Going into the meeting, we will also get ADP employment report and ISM services index for April, see Fed preview: One more hike - Cuts still far away, 27 April. This afternoon we also get ADP employment in the US.
Otherwise, markets continue to digest the latest news regarding US banking sector turmoil and JPMorgan's takeover of the First Republic Bank. Pressure remains on medium-sized regional US banks, while banks' exposure to real estate is raising growing concerns globally, and market sentiment remains sensitive to headlines.
The 60 second overview
Banks jitters resume: The calm in markets after the takeover of First Republic Bank in the US did not last long. Yesterday other regional banks saw big losses with PacWest Bancorp and Western Alliance Bancorp closing down 28% and 16%, respectively. It is unclear what triggered the declines but sentiment in the banking sector is fragile after we saw the third regional bank takeover over the weekend. The jitters caused a new decline in overall risk sentiment sending stocks and bond yields lower.
US debt ceiling: Uncertainty over the US debt ceiling adds to the anxiety in markets currently. Yesterday, Biden invited congressional leaders for a meeting on 9 May after Treasury Secretary on Monday stated the debt ceiling might need to be raised by as early as 1 June.
US JOLTS: Data on US job openings for March released yesterday showed a bigger-than-expected decline to 9590k (consensus 9736k, previous 9974k). It adds to the picture of a cooling US labour market as also suggested by the rise in jobless claims and job cuts lately. Today we get ADP employment before turning to the non-farm payrolls on Friday.
Euro inflation and credit data: Yesterday we got the final batch of Euro area data ahead of tomorrow's ECB meeting. The flash inflation for April came in broadly in line with expectations of 7% headline and 5.6% core. The underlying inflation pressures show that services inflation continues to rise while goods inflation is easing. We still expect a 50bp rate hike on Thursday. A resilient European economy, strong labour markets and wage growth is in our view not compatible with the speed of convergence to 2% being sufficiently fast with only a 25bp hike as to us the rate hike in May will also be implicit forward guidance for the July meeting and hence the financial conditions prevailing. Markets are pricing 28bp.
The loan growth data and the credit standards reported a deterioration from previous releases. While the recent banking turmoil did not appear to have added to the tightening of credit standards, the transmission monetary policy is taking effect with deteriorating loan demand.
Oil prices lower: Oil prices dropped sharply yesterday as risk sentiment soured. We attribute the decline to concerns about the outlook for demand amid ongoing monetary tightening coupled with US selling strategic reserves. We see limited further downside from current level as US would likely halt further selling of reserves and might even contemplate buying again. OPEC+ would likely consider further output cuts as well. We still expect Brent to trade in the USD80-90/bbl range the rest of the year.
Equities: Global equities fell yesterday in a broad-based risk-off mode and volatility increased. Based on headline reading one could be tempted to believe banks were the worst performers in a strong defensive rotation. However, that was not the case as the energy sector fell 4% after another drop in the oil price. Consumer discretionary outperformed although the US regional banks came on heavy selling pressure. The flight to safety was more visible through styles where min vol and quality outperformed. In US Dow -1.1%, S&P 500 -1.2%, Nasdaq -1.1% and Russell 2000 -2.1%. Asian markets are lower this morning though loses are limited. Trading volumes are low as the markets in both mainland China and Japan are closed. US and European futures are higher this morning.
FI: US treasury yields declined substantially yesterday after the uncertainty surrounding the US regional banks once again escalated. US 2-year and 10-year yields dropped around 15bp as the market added to the pricing of Fed cuts in the second half of this year and in 2024.
FX: Oil currencies were the big underperformers in yesterday's session with both NOK and CAD posting decent losses. EUR/NOK has now moved close to the 11.90 threshold. EUR/USD fluctuated through the session but remains around the 1.10 level while EUR/SEK had edged somewhat higher. EUR/GBP moved above 0.88 on the risk-off sentiment while USD/JPY came down to 136.50 on the decline in US yields.
USD/JPY Daily Outlook
Daily Pivots: (S1) 135.43; (P) 136.00; (R1) 136.88; More...
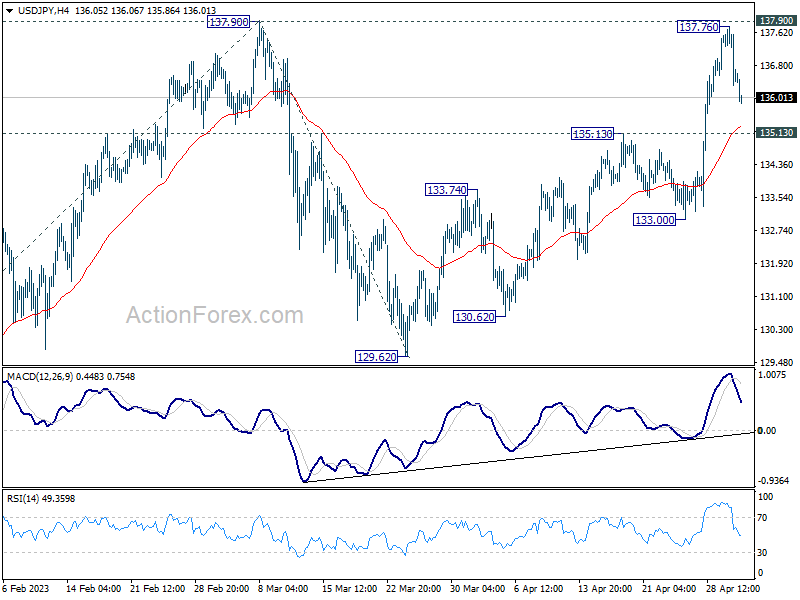
With current retreat, a temporary top is formed in USD/JPY at 137.76, ahead of 137.90 resistance. Intraday bias is turned neutral for some consolidations first. Further rally will remain in favor as long as 135.13 resistance turned support holds. Decisive break of 137.90 will resume whole rebound from 127.20, and target 100% projection of 127.20 to 137.90 from 129.62 at 140.32. However, firm break of 135.13 will turn bias back to the downside for 133.00 support and below.
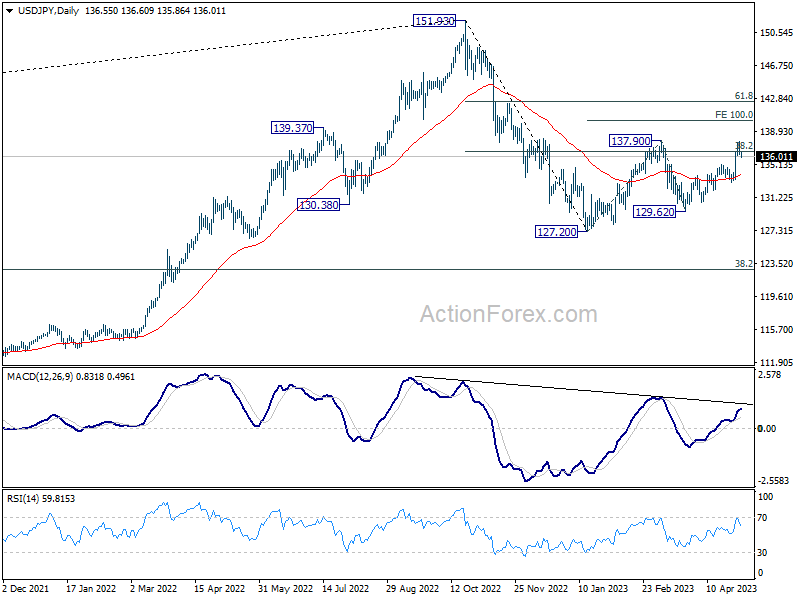
In the bigger picture, price actions from 151.93 high are currently seen as a corrective pattern to the long term up trend. The first leg should have completed at 127.20. Rebound from there is seen as the second leg. Sustained break of 31.8% retracement of 151.93 to 127.20 at 136.34 will bring stronger rebound to 61.8% retracement at 142.48. Meanwhile, break of 129.62 will argue that the third leg is starting through 127.20 low.
Dollar Weakens as Markets Anticipate Last Fed Rate Hike; Yen Gains Amid Cautious Sentiment
Dollar weakens broadly in today's Asian session as markets await what could be the last Fed rate hike in the current cycle. Risk sentiment is on the downside, with stock selloff carrying over from the US to Asia. Despite this, the greenback sees no apparent support. Conversely, Yen benefits from cautious sentiment a decline in benchmark treasury yields. Oversold condition is also helping the Japanese currency slightly.
Commodity currencies show mixed performance, with notable strength seen in New Zealand Dollar. Solid employment and wage data support another RBNZ hike later this month. Australian Dollar continues to reverse yesterday's gains following the surprising RBA hike, while Canadian Dollar remains sluggish due to falling oil prices. European majors are also mixed, with eyes on tomorrow's ECB rate decision.
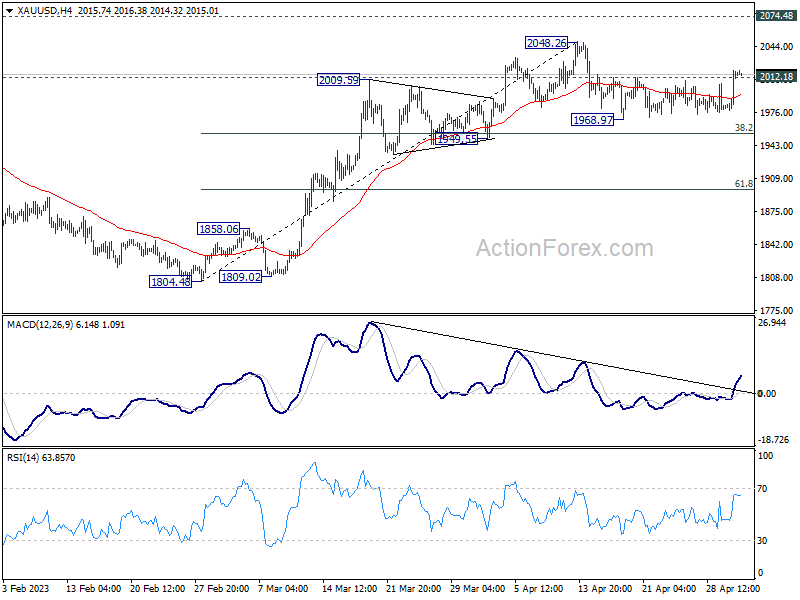
In technical terms, Gold broke 2012.18 resistance level overnight due to risk aversion, contrary to our expectations. This development suggests that pullback from 2048.26 may have already completed after defending 38.2% retracement of 1,804.48 to 2,048.26 well. Stronger rally back to 2,048.26 is now favored, with a break there resuming larger rally towards 2074.48 record high. If realized, this could also coincide with upside breakout in EUR/USD through 1.1094.
In Asia, at the time of writing, Hong Kong HSI is down -1.84%. Singapore Strait Times is down -0.81%. Japan and China are on holiday. Overnight, DOW dropped -1.08%. S&P 500 dropped -1.16%. NASDAQ dropped -1.08%. 10-year yield dropped -0.135 to 3.439.
NZD/USD jumps as strong job data supports another RBNZ hike
New Zealand Dollar surges broadly today, as strong job growth data together with record annual wages growth basically seal the deal for another RBNZ rate hike on May 24.
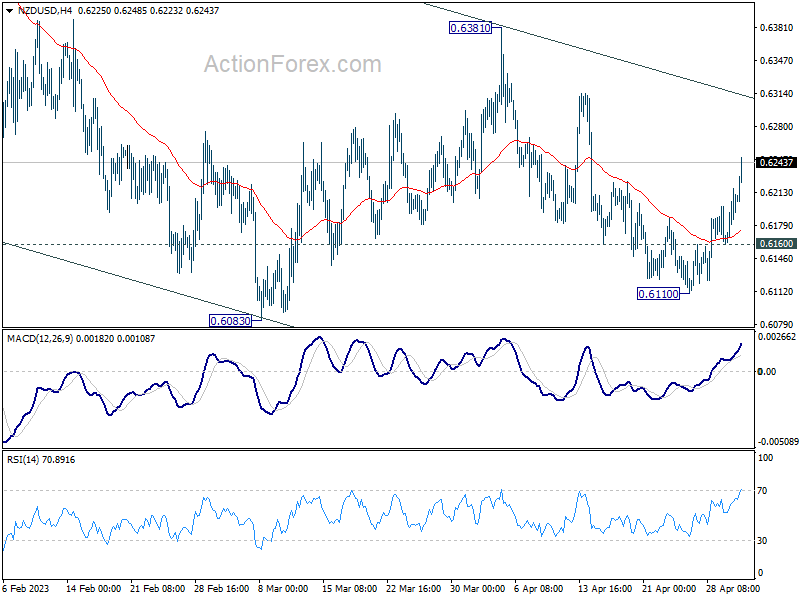
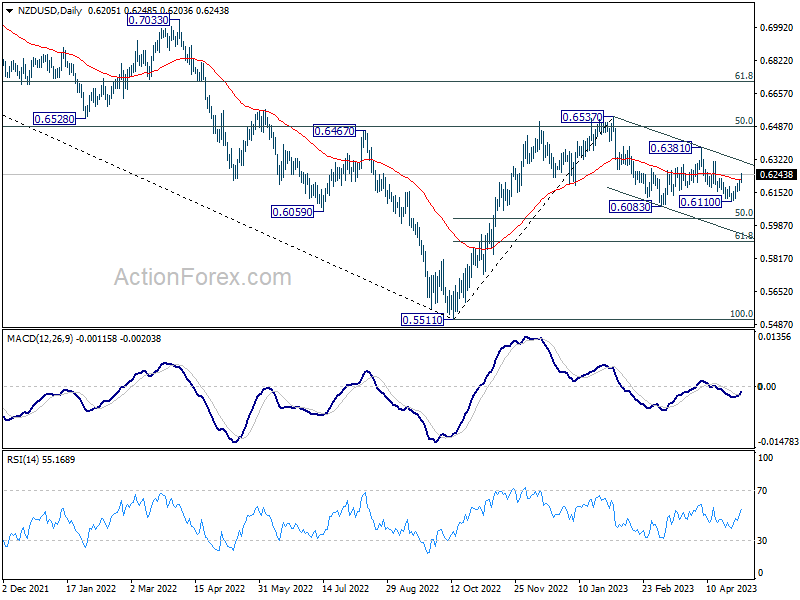
Technically, NZD/USD's fall from 0.6381 should have completed at 0.6110 already, and further rise is now in favor back towards this resistance. The favored case is that current rise is merely the third leg of the sideway pattern from 0.6083. Outlook remains bearish as long as 0.6381 resistance holds, for resumption of the corrective decline from 0.6537 at a later stage. Break of 0.6160 minor support should bring deeper fall through 0.6083.
Nevertheless, firm break of 0.6381 will argue that the correction from 0.6537 has completed, and the whole rally from 0.5511 might then be ready to resume through 0.6537 high.
New Zealand employment growth exceeds expectations; unemployment rate remains low
New Zealand employment data for Q1 showcased a 0.8% qoq increase, surpassing expectation of 0.4% qoq growth. Unemployment rate remained steady at 3.4%, defying expectations of rise to 3.5% and staying close to record low of 3.2% made in Q1 2022. Additionally, employment rate climbed from 69.3% to 69.5%, while labor force participation rate rose from 71.8% to 72.0%. Both employment and participation rates reached their highest levels since records began in 1986.
All sector wage inflation was at 1.0%, 4.3% yoy. "Annual wage cost inflation is at its highest level since the series began in 1992, up from 4.1 percent in the year to the December 2022 quarter," business prices manager Bryan Downes said. "This aligns with other wage measures, like the unadjusted LCI and average hourly earnings, both of which also had the largest annual increases on record."
New Zealand's financial system well-positioned for higher interest rate environment
In May 2023 Financial Stability Report, RBNZ Governor Adrian Orr highlighted that the country's financial system is well-placed to handle the higher interest rate environment and international financial disruptions. Global inflation continues to persist at levels significantly above central banks' policy targets. Although central banks have recently slowed pace of tightening, the full impact of previous tightening measures remains to be seen.
Governor Orr explained that "to date there have been limited signs of distress in banks' lending portfolios, with only a small share of borrowers falling behind on their payments." This resilience, he said, reflects ongoing strength of the labor market and the ability of borrowers to adjust their spending or use previous savings and repayment buffers.
Australian retail sales exceed expectations, rising 0.4% mom in Mar
Australia's retail sales turnover increased by 0.4% mom to AUD 35.3m in March, surpassing expectations of 0.2% mom. Year-on-year, sales turnover was up by 5.4% compared to the same month a year ago.
Ben Dorber, Australian Bureau of Statistics Head of Retail Statistics, noted that while retail sales recorded a third consecutive rise in March, pull-back in spending on discretionary goods has kept monthly turnover at a similar level to six months ago.
Dorber also noted the importance of analyzing quarterly retail sales volumes, set to be released next week, in order to understand the impact of consumer prices on recent turnover growth, particularly as CPI data showed high inflation levels despite slower growth in March quarter.
Fed to hike 25bps today, but pause afterwards?
Fed is widely anticipated to deliver another 25bps rate hike today, bringing federal funds rate target to 5.00-5.25%. Despite ongoing concerns over regional banks in the US, Fed appears unconcerned about overall financial stability. Service prices remain sticky, even as inflation appears to be declining.
With market pricing in near 90% chance of the 25 bps move, surprises seem unlikely. However, after this increase, fed fund futures indicate an almost 100% chance of no change in June, with the path beyond that trending downward. Fed Chair Jerome Powell may stay non-committal in the post-meeting press conference, and point to June's new economic projections for guidance. But a more explicit pause signal could boost risk markets.
Here are some readings on FOMC:
- Fed Hike, Then What?
- Will the Fed Hike Rates for the Last Time?
- Fed Preview: One More Hike – Cuts Still Far Away
- April Flashlight for the FOMC Blackout Period: Is the Tightening Cycle Coming to an End?
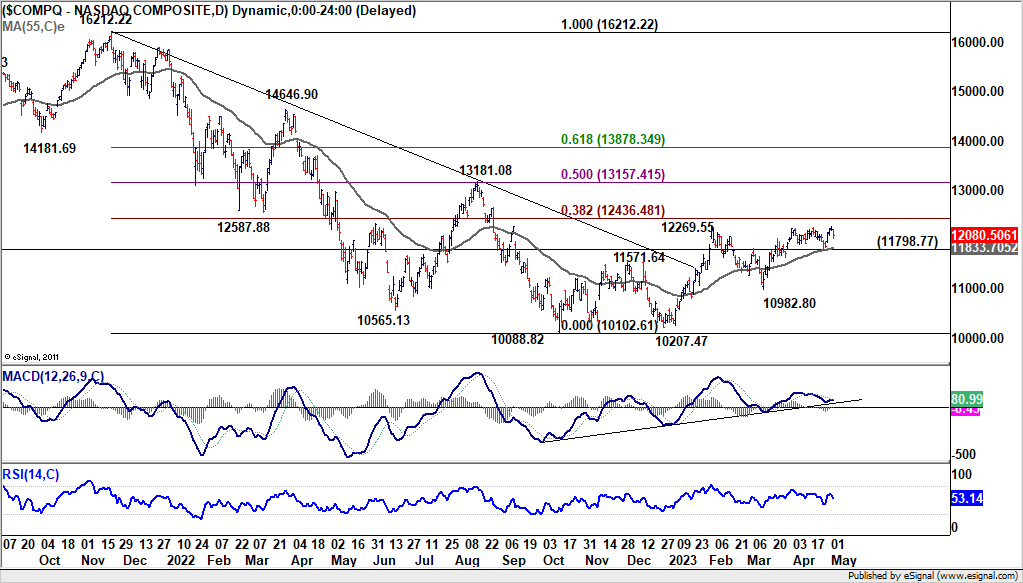
As for US stocks, despite initial selloff yesterday, major indexes recovered some ground and close down around -1% only. NASDAQ is still struggling to break through 12269.55 resistance. But near term bias will remain on the upside as long as 11798.77 support holds. The real test lies in 38.2% retracement of 16212.22 to 10102.61 at 12436.48. Decisive break there will be a solid bullish sign that should push for at least a test on 13181.08 cluster resistance. Nevertheless, firm break of 11798.77 support could prompt near term reversal, and steeper selloff back to 10982.80 support and possibly below.
On the data front
Eurozone unemployment rate will be a main feature in European session. US will release ADP employment and ISM services.
USD/JPY Daily Outlook
Daily Pivots: (S1) 135.43; (P) 136.00; (R1) 136.88; More...
With current retreat, a temporary top is formed in USD/JPY at 137.76, ahead of 137.90 resistance. Intraday bias is turned neutral for some consolidations first. Further rally will remain in favor as long as 135.13 resistance turned support holds. Decisive break of 137.90 will resume whole rebound from 127.20, and target 100% projection of 127.20 to 137.90 from 129.62 at 140.32. However, firm break of 135.13 will turn bias back to the downside for 133.00 support and below.
In the bigger picture, price actions from 151.93 high are currently seen as a corrective pattern to the long term up trend. The first leg should have completed at 127.20. Rebound from there is seen as the second leg. Sustained break of 31.8% retracement of 151.93 to 127.20 at 136.34 will bring stronger rebound to 61.8% retracement at 142.48. Meanwhile, break of 129.62 will argue that the third leg is starting through 127.20 low.
Economic Indicators Update
| GMT | Ccy | Events | Actual | Forecast | Previous | Revised |
|---|---|---|---|---|---|---|
| 22:45 | NZD | Employment Change Q1 | 0.80% | 0.40% | 0.20% | |
| 22:45 | NZD | Unemployment Rate Q1 | 3.40% | 3.50% | 3.40% | |
| 22:45 | NZD | Labour Cost Index Q/Q Q1 | 0.90% | 1.10% | 1.10% | |
| 01:30 | AUD | Retail Sales M/M Mar | 0.40% | 0.20% | 0.20% | |
| 08:00 | EUR | Italy Unemployment Rate Mar | 8.10% | 8.00% | ||
| 09:00 | EUR | Eurozone Unemployment Rate Mar | 6.60% | 6.60% | ||
| 12:15 | USD | ADP Employment Change Apr | 150K | 145K | ||
| 13:45 | USD | Services PMI Apr F | 53.7 | 53.7 | ||
| 14:00 | USD | ISM Services PMI Apr | 53.1 | 51.2 | ||
| 14:30 | USD | Crude Oil Inventories | -0.5M | -5.1M | ||
| 18:00 | USD | Fed Interest Rate Decision | 5.25% | 5.00% | ||
| 18:30 | USD | FOMC Press Conference |
A Risky Lopsided US Stock Market Performance
- The year-to-date performance of the S&P 500 has been heavily skewed by the top 8 market cap stocks (FAANG + MNT).
- US regional bank fear persists despite the takeover of First Republic Bank by JPMorgan Chase.
- Markets are looking out for clues on the timing of the first Fed rate cut in today’s post-FOMC.
The combined top 8 US stocks (in terms of market capitalization) in the S&P 500 under the FAANG + MNT group; (Meta/Facebook, Apple, Amazon, Netflix, Alphabet/Google, Microsoft, NVIDIA, Tesla) that contributed close to 102% of the 2023 year-to-date return of the S&P 500 as of 28 April.
These observations suggest the average return of the remaining 492 stocks in the S&P 500 is negative which indicates a weak market breadth condition.
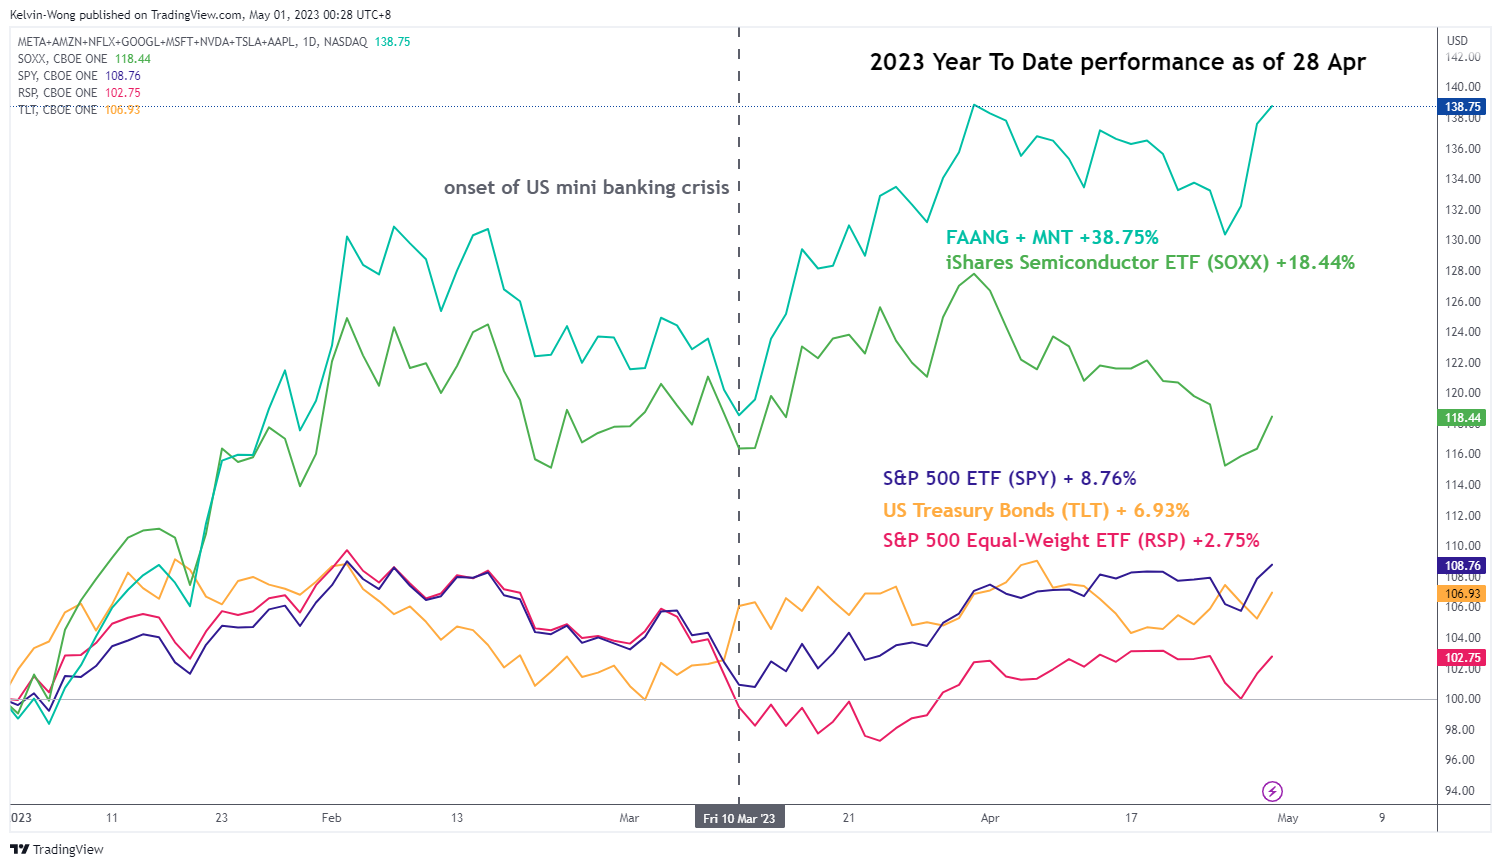
Fig 1: Year-to-date performance of FAANG +MNT & key US stock indices as of 28 Apr 2023 (Source: TradingView , click to enlarge chart)
2023 YTD Performance as of 28 Apr
- FAANG + MNT (equal weight) = +38.75%
- FAANG + MNT (respective market cap weight in S&P 500) = +8.93%
- S&P 500 ETF (SPY) = +8.76%
- S&P 500 Equal Weight ETF (RSP) = +2.75%
- iShares US Semiconductor ETF (SOXX) = +18.44%
- US Treasury Bonds ETF (TLT) = +6.93%
The lopsided return from FAANG + MNT became more pronounced after the onset of the US mini-banking crisis in mid-March.
The main narrative that supports this long-duration risky asset play is an imminent Fed pivot to start a fresh interest rate cut cycle in July or September 2023 to alleviate the balance sheet stress of the regional banks from the assets side (mark-to-market losses of Treasury bonds, commercial real estate loans) as well as negate the flight of deposits flows (liabilities side) to higher-interest yielding money market funds where it has triggered a self-reinforcing fear feedback loop of a bank run.
Also, if a fresh interest rate cut cycle is being brought forward to the second half of 2023, it can kickstart a faster revival of loosening financial conditions to boost the earnings potential and demand (via potential share buybacks) of the FAANG + MNT group.
Guidance from the Fed so far has been reluctant to kickstart an interest rate cut cycle in 2023 due to the fear of elevated sticky inflation and entrenched inflationary expectations from consumers and businesses.
The evidence of sticky inflation and stagflation risk in the US can be seen in the latest ISM Manufacturing PMI report for April. The ISM Prices Index subcomponent that tracks prices of raw materials paid by manufacturers has increased to 53.2% from 49.2% in March, reversing its prior decreasing rate of change.
There is still fear in the US banking system
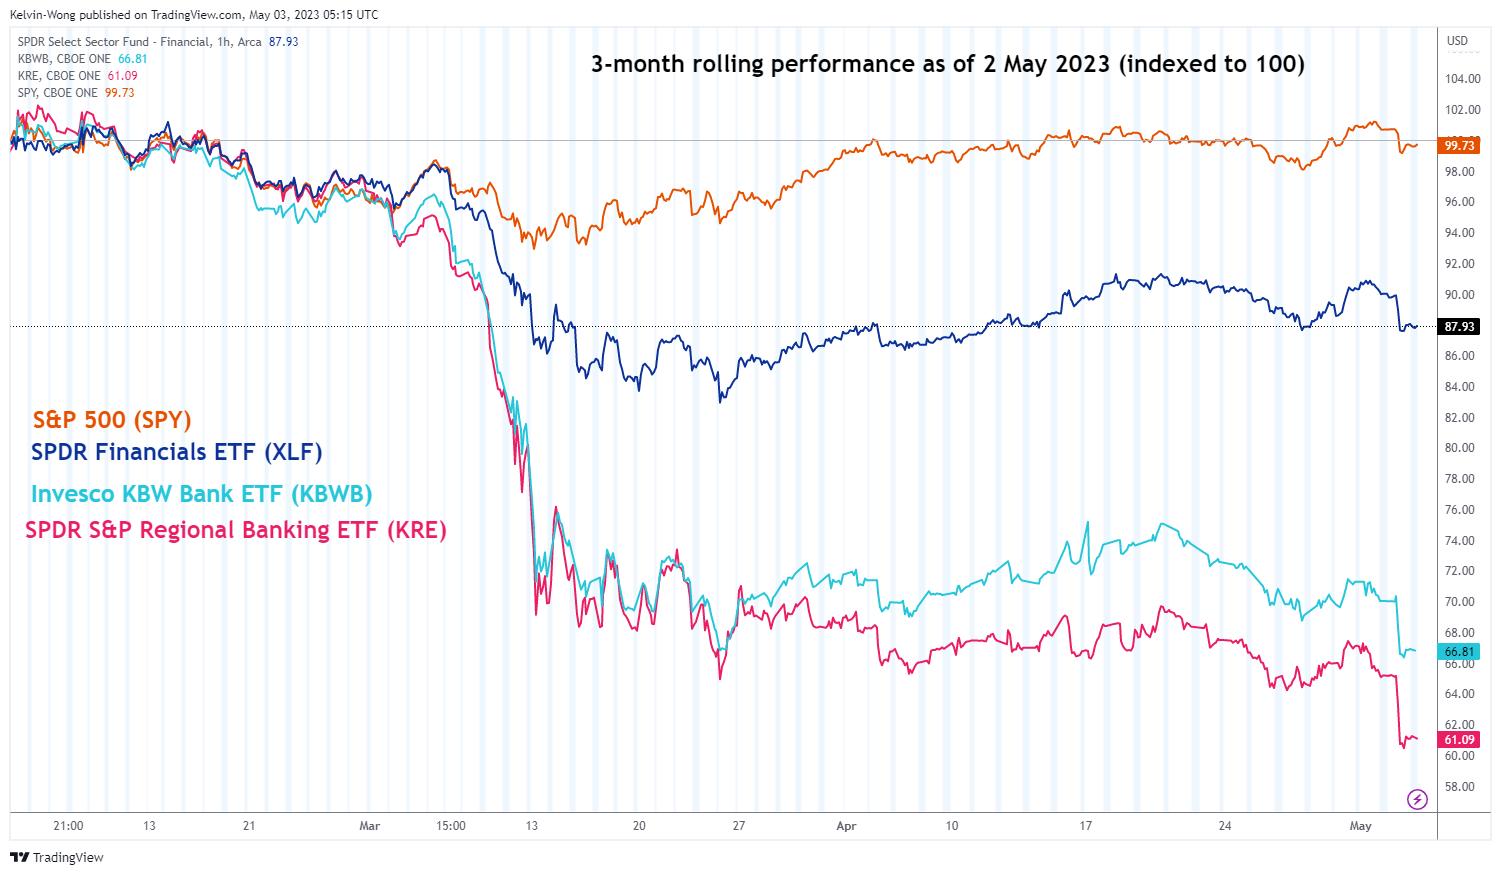
Fig 2: 3-month rolling performance of US banks ETFs as of 2 May 2023 (Source: TradingView , click to enlarge chart)
Despite the takeover of the embattled regional First Republic Bank by JPMorgan Chase in a US government-led deal on late Sunday to fill a hole in the troubled lender’s balance sheet, the share prices of other US regional banks have continued to plunge since the start of this trading week.
The share price of the SPDR S&P Regional Banking ETF (KRE) has dropped by -9% since Monday, 1 May, and -38% on a 3-month rolling basis which implies that market participants are not assured by the latest rescue efforts on First Republic Bank and the balance sheet stress as mentioned earlier on the other US regional banks persist.
Perhaps, the continuation of the plunge seen in the share prices of regional banks by negative animal spirits is issuing a challenge to the Fed to abandon its inflationary targeting regime for now and pivot towards an interest rate cycle as soon as possible to stamp out deflationary growth concerns triggered a credit crunch and heightened systemic risk
Will the Fed throw in the towel to abandon inflation targeting?
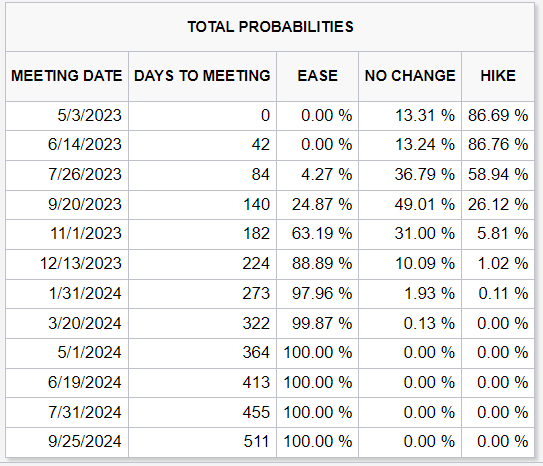
Fig 2: Probability of future Fed funds rate hike or cut implied by 30-day Fed Funds futures data as of 2 May 2023
(Source: CME FedWatch tool, click to enlarge chart)
The market has almost fully priced in a further interest rate hike of 25 basis points to bring the Fed funds rate to 5.00%-5.25% and that should be the terminal rate, the last hike in the current tightening cycle based on the CME FedWatch Tool derived from the pricing of the 30-day Fed Funds futures data.
The golden question now is, will the Fed hold the Fed funds rate at this level for a longer period or will there be a first-rate cut coming in July or September this year?
Today’s Federal Open Market Committee (FOMC) monetary policy decision outcome does not come with an updated “dot-plot” where Fed officials submit their latest forecasts for the level of the Fed funds rate from 2023 to 2025.
Hence, the accompanying monetary policy statement and Fed Chair Powell’s post-FOMC press conference may offer clues and clarity on the signal and guidance to determine the willingness of the Fed to switch gears to a more accommodative stance.
If we take a leaf from a past statement issued on the 21 March 2007 FOMC meeting; “future policy adjustments will depend on the evolution of the outlook for both inflation and economic growth, as implied by incoming information.”– that will be an example of the Fed that is prepping for a fresh interest rate cut cycle.
US SPX 500 Technical Analysis – Trapped below 4,215 key range resistance
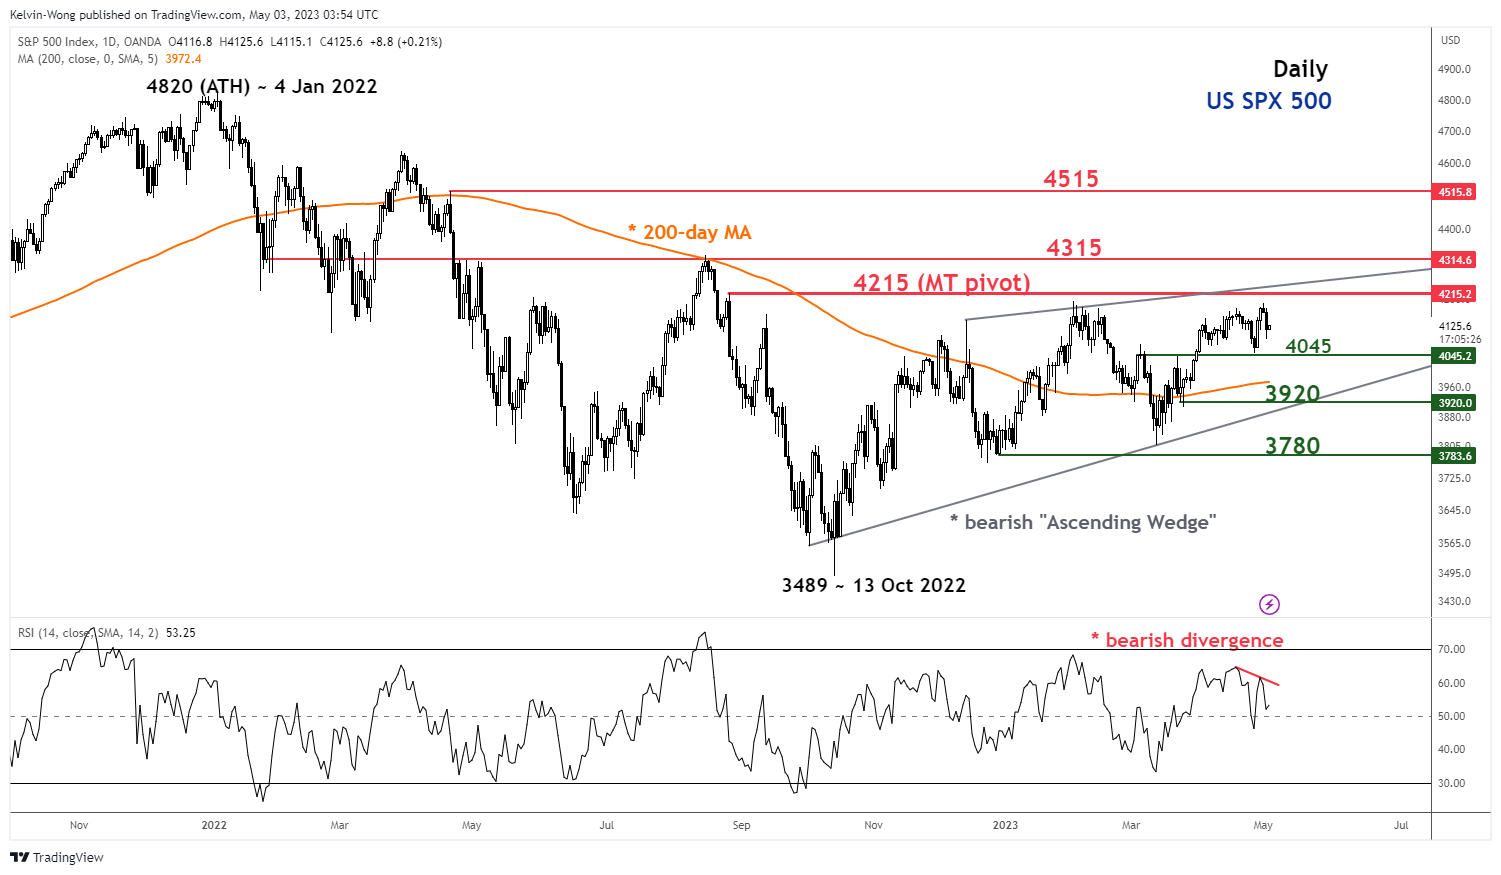
Fig 3: US SPX 500 trend as of 3 May 2023 (Source: TradingView, click to enlarge chart)
Since its minor up move of 10% from its 13 May 2023 low of 3,806 to its recent high of 4,189 printed on 1 May 2021, the US SPX 500 Index (a proxy for the S&P 500 futures) has failed to make any breakthrough above the 4,215 key medium0-term pivotal range resistance for the 3rd time; previous attempts were on 2 February 2023 and 13 December 2022.
In addition, medium-term upside momentum has turned lackluster as indicated by the recent bearish divergence observation seen on the daily RSI oscillator with the price actions of the Index that has continued to evolve into an impending potential bearish reversal “Ascending Wedge” configuration in place since the 3,489 medium-term swing low of 13 October 2022.
A break below 4,045 immediate support may expose the next support at 3,920 in the first step. On the other hand, a clearance with a daily close above 4,215 negates the bearish tone to see the next resistance coming in at 4,315.
Technical Outlook and Review
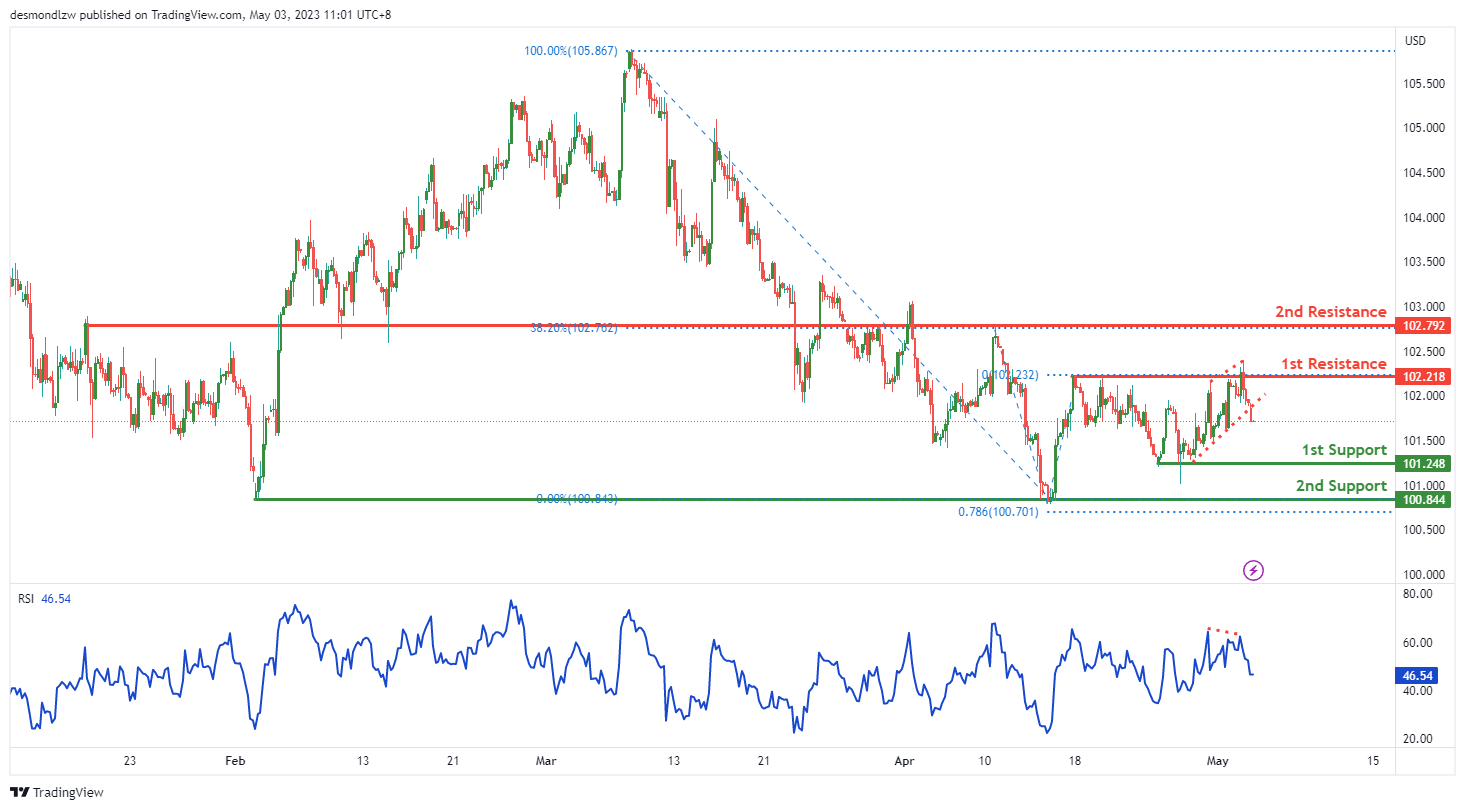
DXY:
The DXY chart is currently showing strong bearish momentum with high confidence, triggered by a break below an ascending support line. The price is expected to potentially continue its bearish trend towards the 1st support level at 101.24, which is a multi-swing low support level.
If the price were to break below the 1st support level, the next support level to watch would be the 2nd support at 100.84. This level is also a multi-swing low support level and coincides with a 78.60% Fibonacci projection, making it a strong level of support.
On the resistance side, the 1st resistance level is at 102.21. This level is a swing high resistance, and if the price were to break above it, it could potentially lead to a bullish reversal towards the 2nd resistance level at 102.79, which is an overlap resistance level.
Additionally, the RSI is displaying bearish divergence versus price, indicating that a rapid decline in price is likely.
EUR/USD:
The EUR/USD chart currently has a bearish momentum with the potential for a bearish reaction off the 1st resistance level and a subsequent drop to the 1st support level. The 1st support level is located at 1.0946, which is a multi-swing low support level and has held up as a strong support level in the past. Additionally, the 2nd support level is located at 1.0911, which is an overlap support level and adds further confluence to the support zone.
On the resistance side, the 1st resistance level is at 1.1037, which is an overlap resistance level and coincides with a 61.80% Fibonacci retracement. This level has also been tested multiple times in the past and has held up as a strong resistance level for the EUR/USD chart. If the price were to break above this resistance level, it could potentially rise towards the 2nd resistance level at 1.1098. This level is a swing high resistance level and has also held up as a strong resistance level in the past.
It’s worth noting that the overall momentum of the chart is currently bearish, indicating a potential for further price drops. Furthermore, if the price were to break below the 1st support level, it could potentially drop to the 2nd support level at 1.0911. Conversely, if the price were to break above the 1st resistance level, it could potentially trigger a bullish acceleration towards the 2nd resistance level at 1.1098.

GBP/USD:
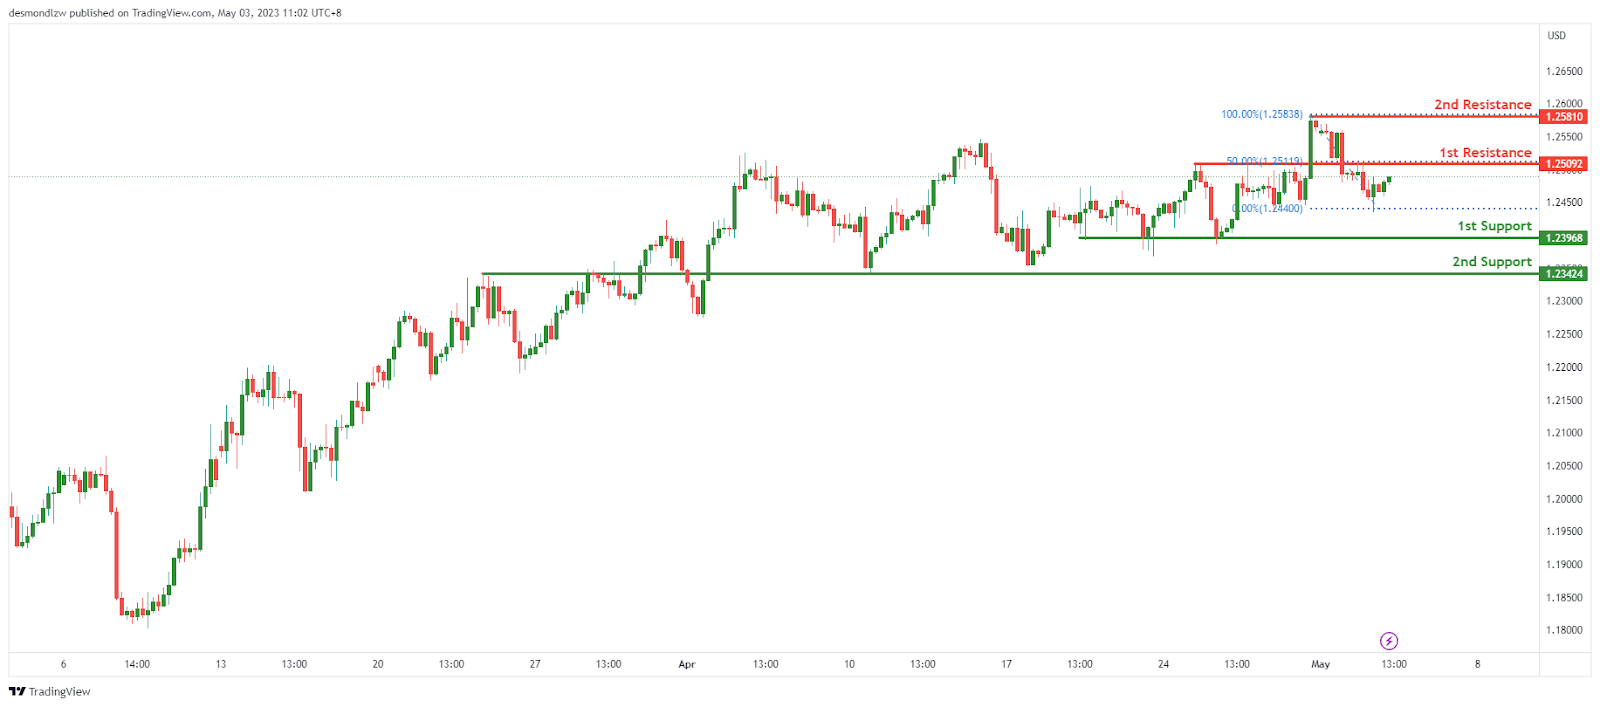
The GBP/USD chart shows a bearish overall momentum, with the potential for a bearish reaction off the 1st resistance level and a drop towards the 1st support level.
The 1st support level is at 1.2396, which is a multi-swing low support level. This level has held as support in the past, making it a significant level to watch.
If the price were to break below the 1st support level, the next support level to watch would be the 2nd support level at 1.2342. This level is also an overlap support level, adding further confluence to its significance.
On the resistance side, the 1st resistance level is at 1.2509. This level is an overlap resistance level and coincides with a 50% Fibonacci retracement, making it a strong level of resistance to watch.
If the price were to break above the 1st resistance level, it could potentially rise towards the 2nd resistance level at 1.2581. This level is a swing high resistance level and has held up as a strong resistance level in the past.
It is important to note that the overall momentum of the GBP/USD chart is bearish, which suggests that the potential for a bearish reaction off the 1st resistance level and a drop towards the 1st support level is more likely.
USD/CHF:
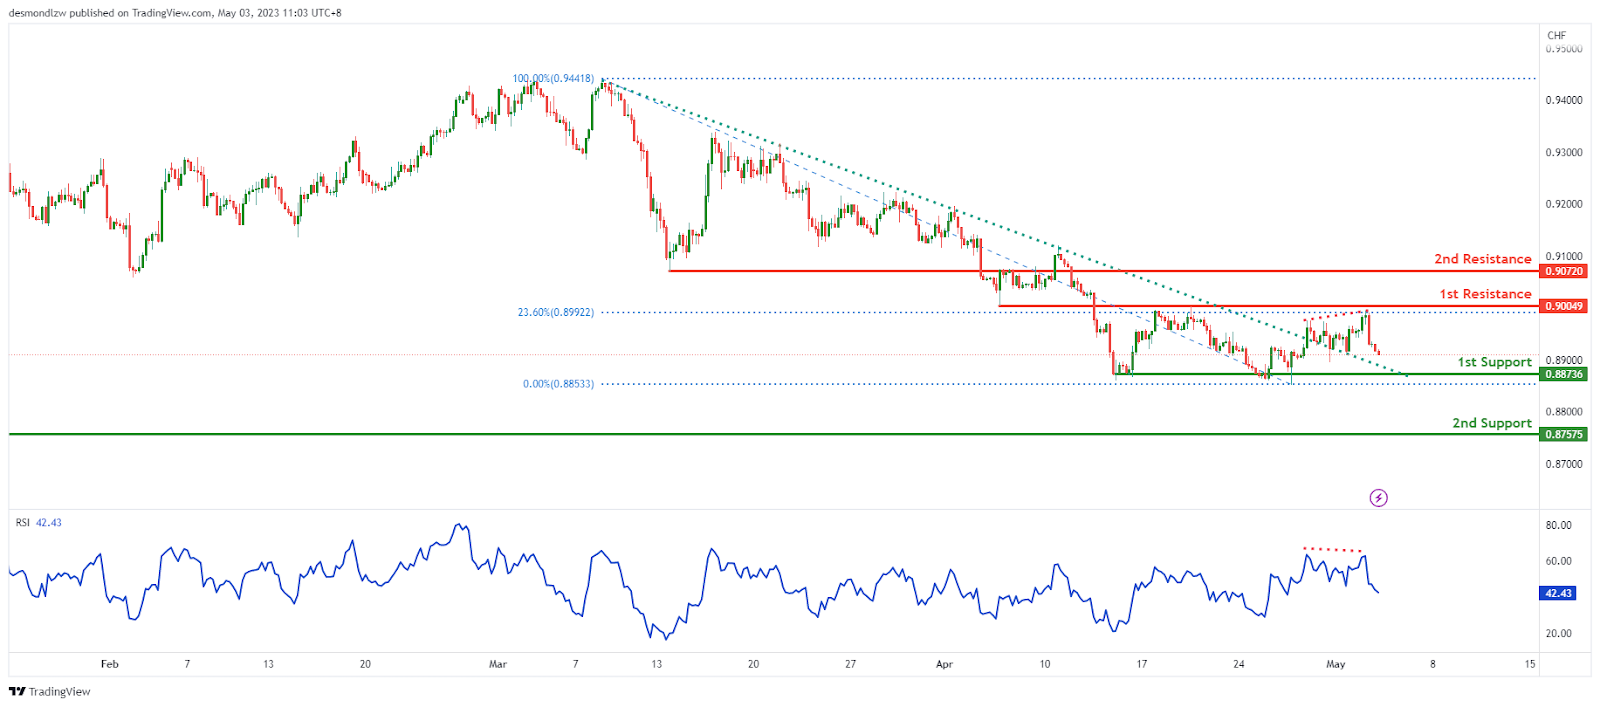
The USD/CHF chart currently displays a strong bearish momentum overall, with the potential for a continuation towards the 1st support. The 1st support level is at 0.8936, a multi-swing low support level that has held as support in the past. If the price were to break below this level, it could potentially drop to the 2nd support level at 0.8757, a swing low support level that is a significant level to watch.
On the resistance side, the 1st resistance level is at 0.9004, an overlap resistance level that coincides with a 23.60% Fibonacci retracement. If the price were to break above this level, it could potentially rise towards the 2nd resistance level at 0.9072, which is a pullback resistance level and an important level to watch.
Additionally, RSI is displaying bearish divergence versus price, suggesting that there could potentially be a rapid decline in price.
USD/JPY:
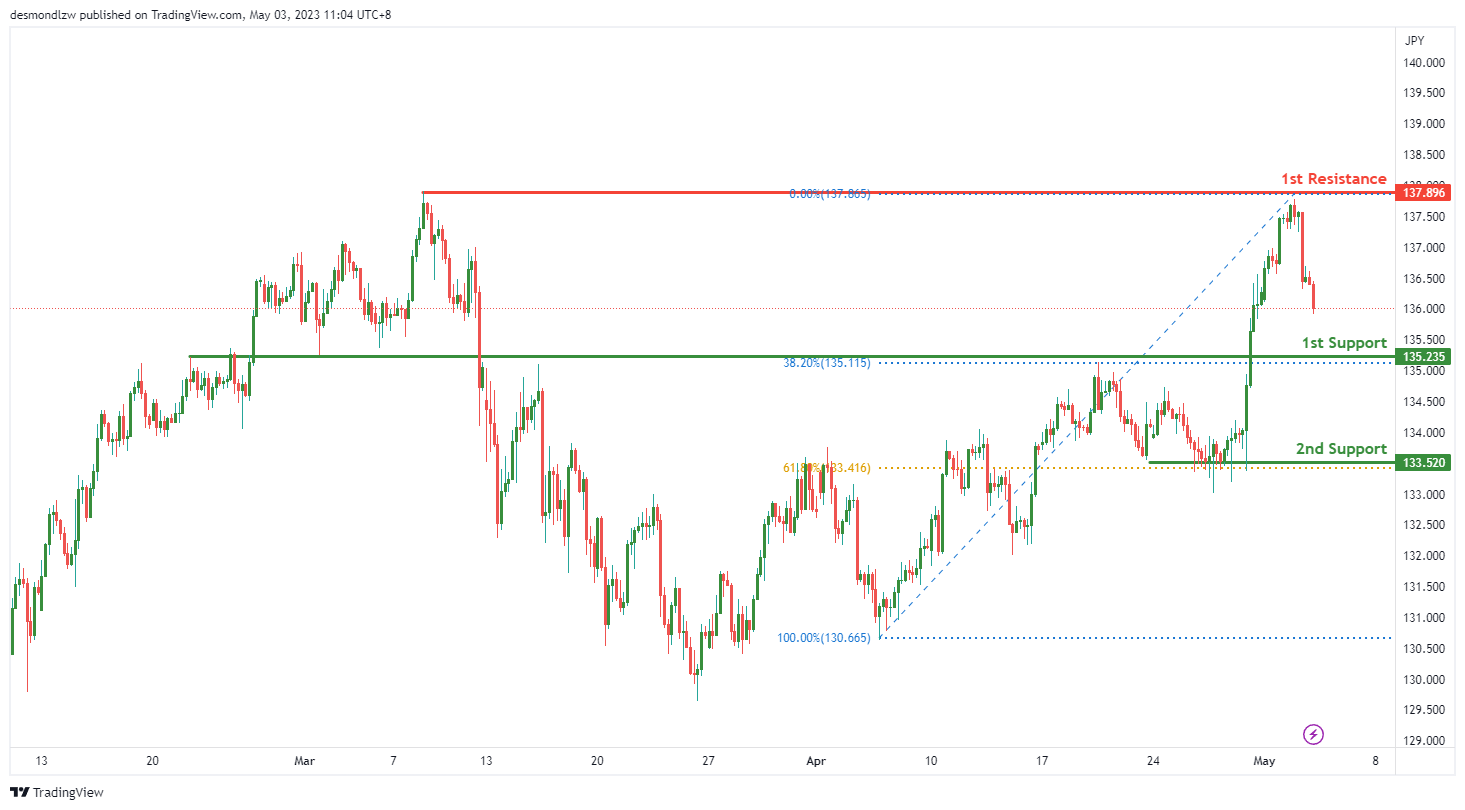
The USD/JPY chart is currently showing bearish momentum overall. There is a potential for a bearish continuation towards the 1st support level for the USD/JPY pair. The 1st support level is at 135.23 and is a pullback support level, with a 38.20% Fibonacci retracement lining up with it.
If the price were to break below this support level, it could potentially drop to the 2nd support level at 133.52. This level is a multi-swing low support level and coincides with a 61.80% Fibonacci retracement, making it a strong level of support.
On the resistance side, the 1st resistance level is at 137.89, which is a multi-swing high resistance level. It has held up as a strong resistance level for the USD/JPY chart.
AUD/USD:
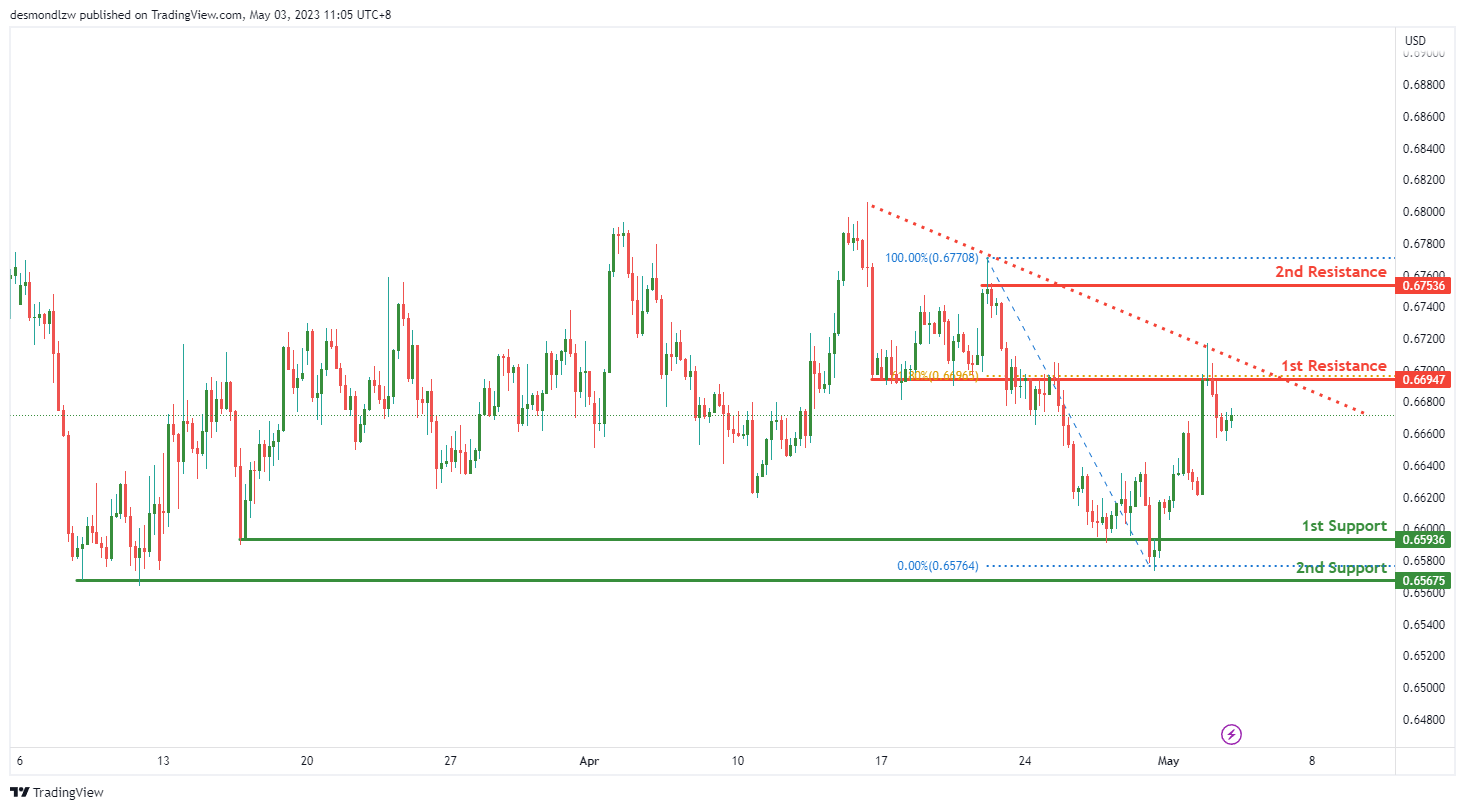
The AUD/USD chart currently shows a strong bearish momentum, as the price is below a major descending trend line, indicating that further downside movement may be expected. There is a potential for a bearish continuation towards the first support level at 0.6593, which is a pullback support level that coincides with a 61.80% Fibonacci retracement, making it a significant level to watch. If the price were to break below this level, the next support to watch would be the second support at 0.6567, which is also a multi-swing low support level.
On the resistance side, the first resistance level is at 0.6694, which is an overlap resistance level. If the price were to break above this level, it could potentially move towards the second resistance level at 0.6753, which is a swing high resistance level.
NZD/USD:
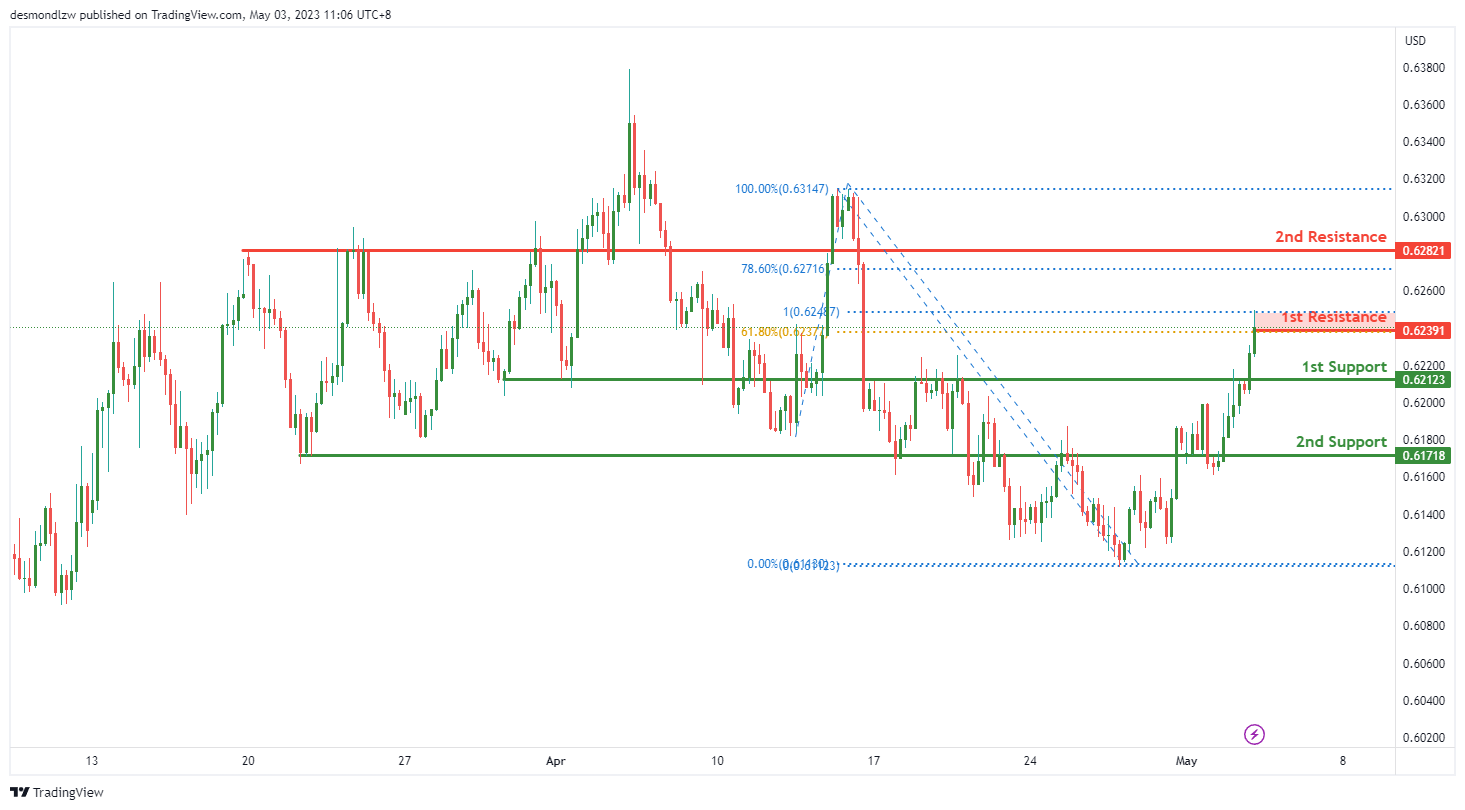
The NZD/USD chart shows strong bearish momentum and is currently testing a key resistance level at 0.6239 that lines up with the Fibonacci confluence of 61.8% Fibonacci retracement and 100% Fibonacci projection. If the price reacts bearishly off this level, it could potentially drop towards the 1st support at 0.6212, which is a pullback support level. If the price breaks through the 1st support level, it may continue its bearish movement towards the 2nd support level at 0.6171, which is also a pullback support level.
On the other hand, if the price manages to break through the 1st resistance level at 0.6239, it may continue its bullish movement towards the 2nd resistance level at 0.6282, which is a pullback resistance level and coincides with the 78.60% Fibonacci retracement. However, given the overall bearish momentum of the chart, this scenario seems less likely.
In summary, the NZD/USD chart is displaying bearish momentum, and there is potential for a bearish reaction off the 1st resistance level at 0.6239, with the 1st support level at 0.6212 being the potential target. The 2nd support level at 0.6171 could also act as a support level if the price breaks through the 1st support level. On the upside, the 1st and 2nd resistance levels at 0.6239 and 0.6282, respectively, may act as resistance levels if the price manages to break through the 1st resistance level.
USD/CAD:
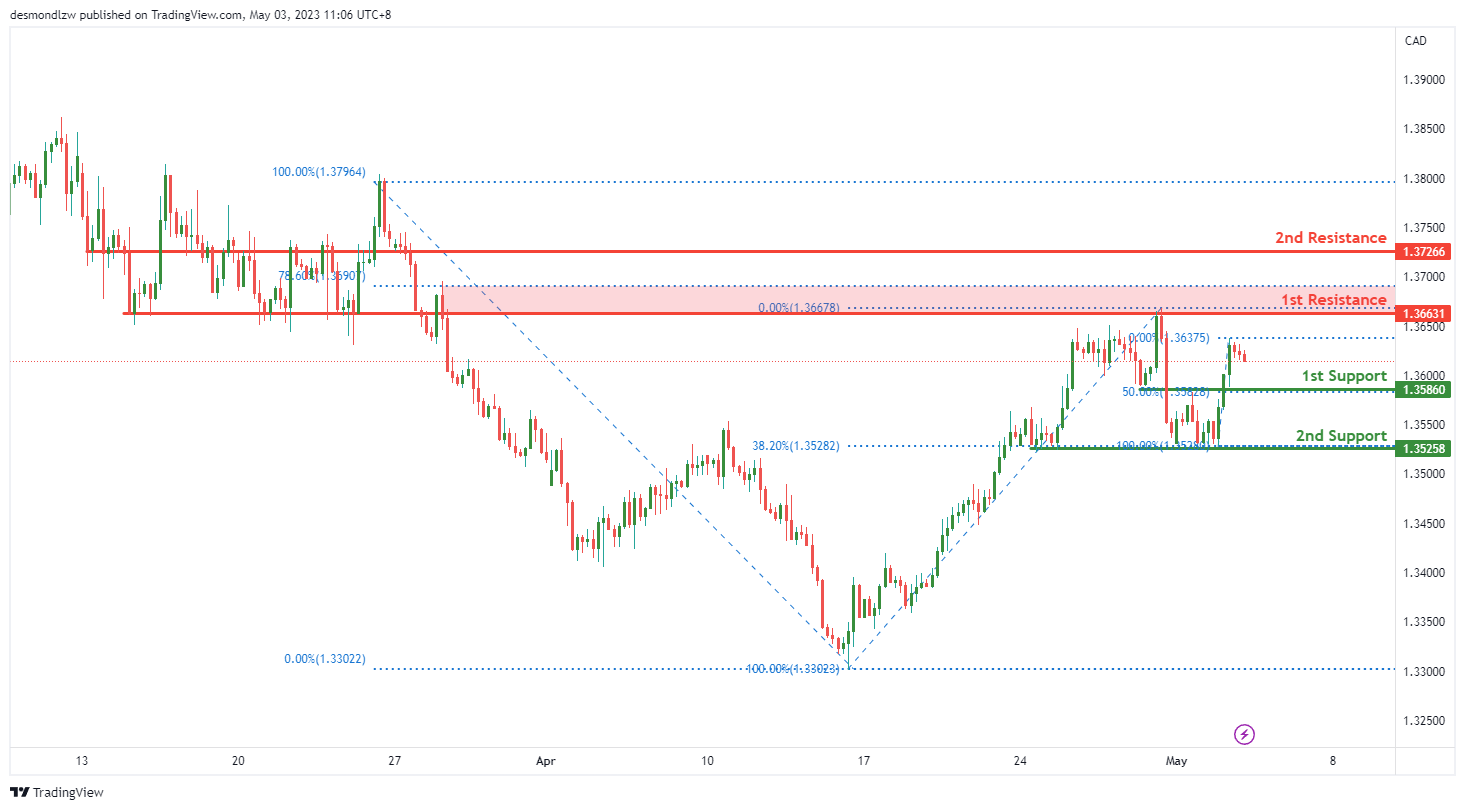
The USD/CAD chart, the overall momentum is currently bullish. Price may potentially make a bullish bounce off the first support level at 1.3586, which is an overlap support level and coincides with the 50% Fibonacci retracement. The second support level at 1.3525 is also a good support level as it is a multi-swing low support level and lines up with the 38.20% Fibonacci retracement.
On the other hand, the first resistance level at 1.3663 is a good level to watch as it is an overlap resistance level and coincides with the 78.60% Fibonacci retracement. If price manages to break through this level, it could potentially head towards the second resistance level at 1.3726, which is a pullback resistance level.
DJ30:
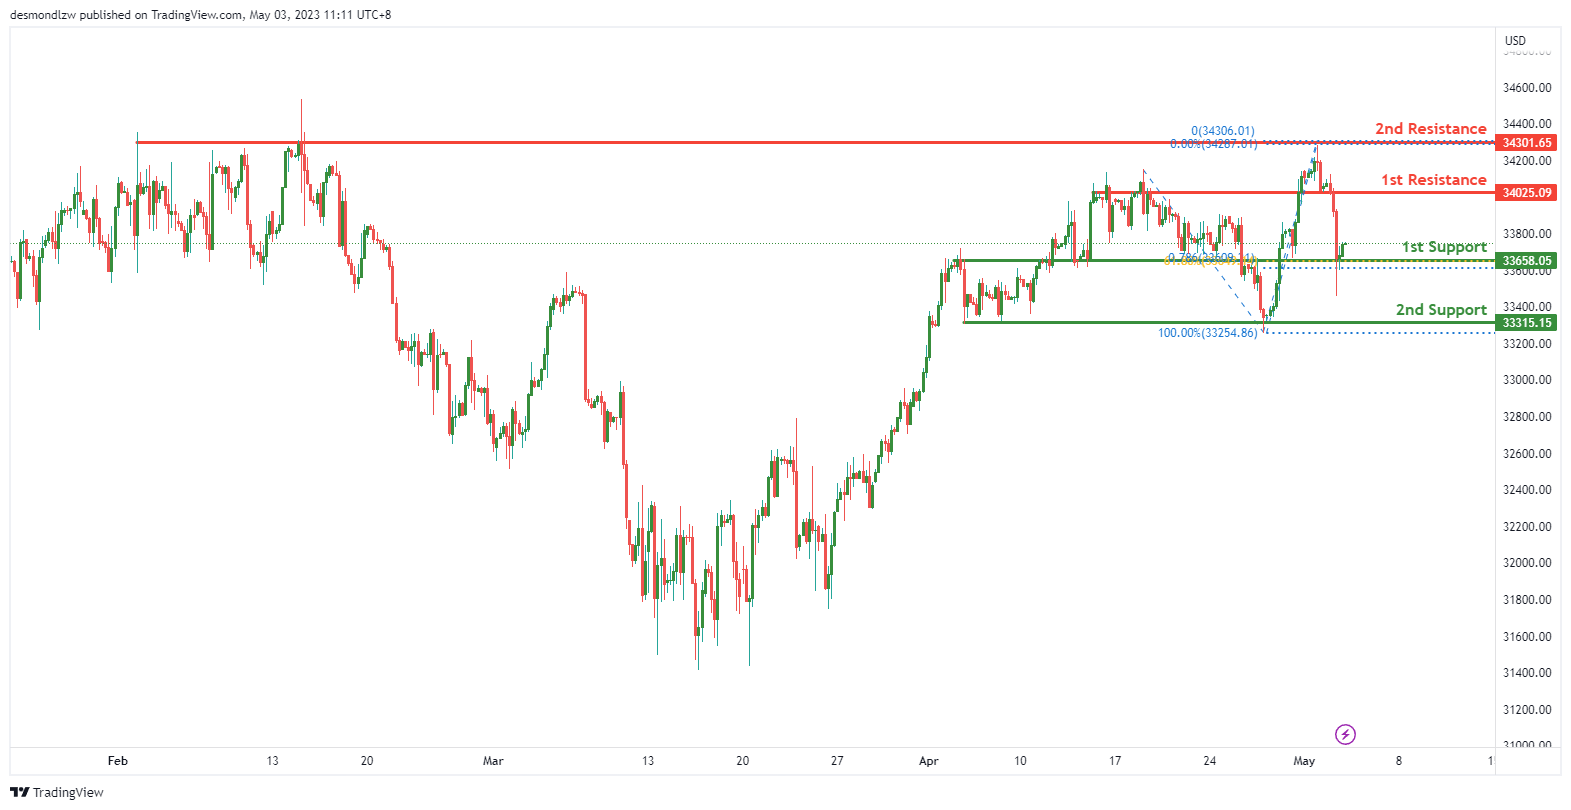
The DJ30 chart is currently displaying bullish momentum, and there is potential for a bullish bounce off the 1st support level at 33658.05, which is an overlap support and also coincides with the 61.80% Fibonacci retracement. If the price manages to bounce from this level, it may head towards the 1st resistance at 34025.09, which is a pullback resistance level.
If the price continues its bullish movement, it may potentially break through the 1st resistance and head towards the 2nd resistance level at 34301.65, which is a multi-swing high resistance level. However, if the price fails to bounce from the 1st support level, it may potentially drop towards the 2nd support level at 33315.15, which is a multi-swing low support level.
GER30:
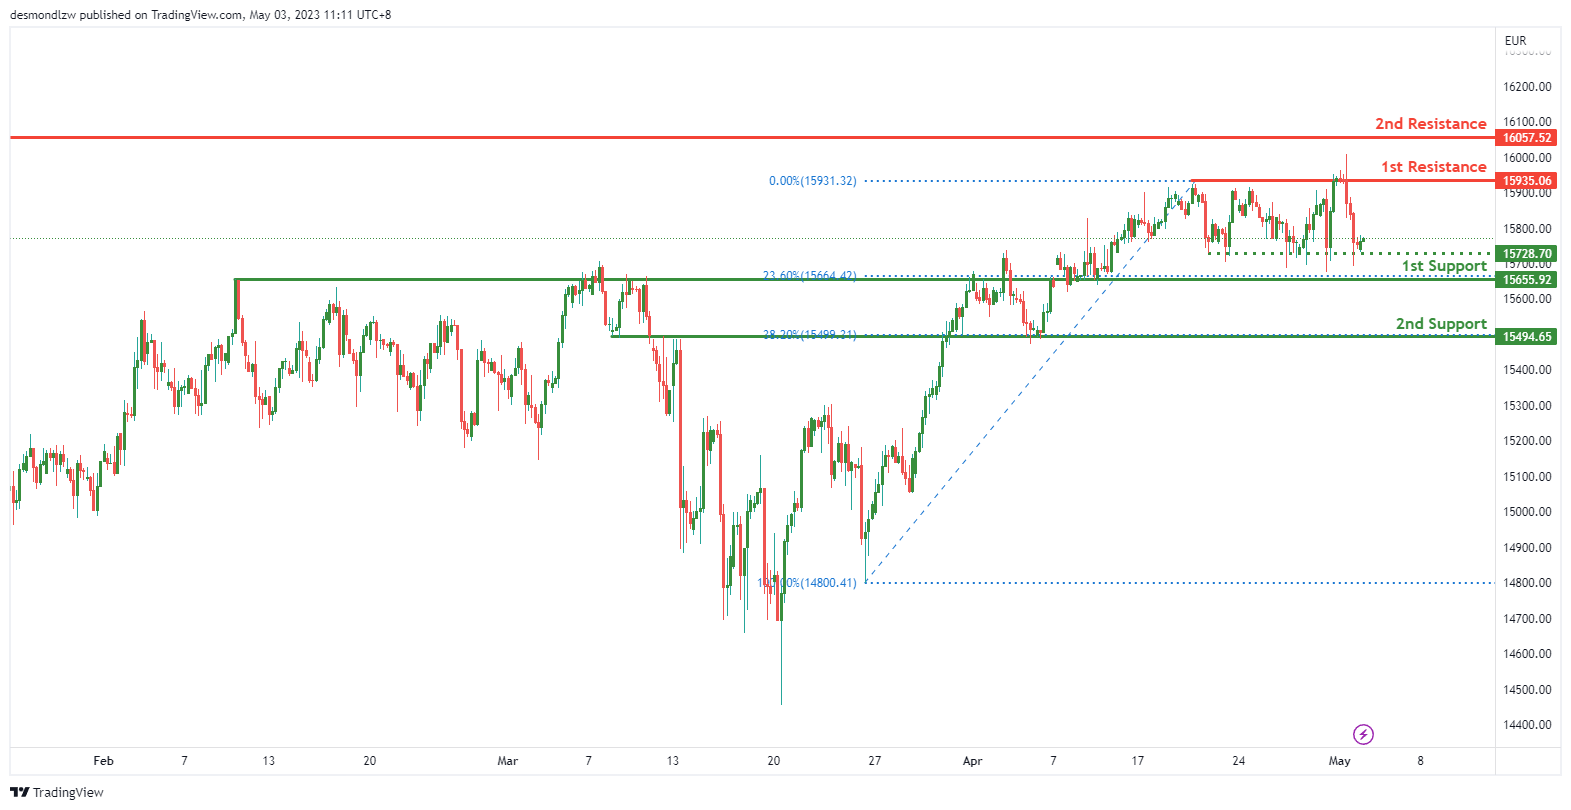
The GER30 chart is displaying bullish momentum, and price could potentially make a bullish bounce off the 1st support level at 15655.92, which is an overlap support level and coincides with the 23.60% Fibonacci retracement. If the price bounces from this level, it may head towards the 1st resistance level at 15935.06, which is a multi-swing high resistance level.
In the event that the price breaks through the 1st support level, it may drop towards the 2nd support level at 15494.65, which is also an overlap support level and coincides with the 38.20% Fibonacci retracement.
Additionally, there is an intermediate support level at 15728.70, which is a multi-swing low support level. This level may act as support if the price breaks through the 1st support level.
On the upside, the 2nd resistance level at 16057.52 may act as a resistance level if the price manages to break through the 1st resistance level.
BTC/USD:
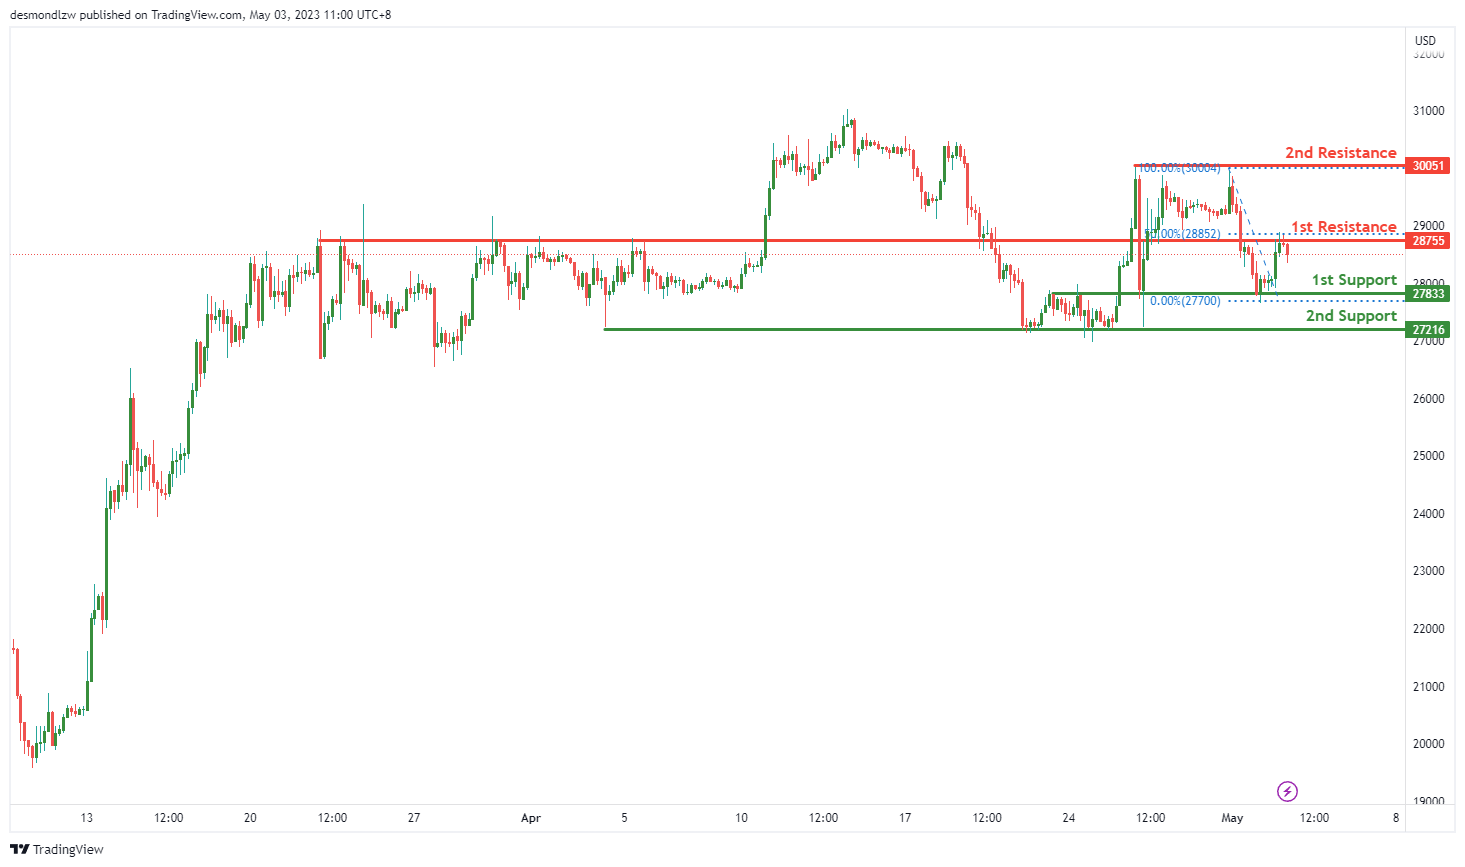
The BTC/USD chart shows a strong bearish momentum, and it’s currently testing a key resistance level at 28755 that lines up with the 50% Fibonacci retracement and is also an overlap resistance level. If the price reacts bearishly off this level, it could potentially drop towards the 1st support at 27833, which is an overlap support level. If the price breaks through the 1st support level, it may continue its bearish movement towards the 2nd support level at 27216, which is also a multi-swing low support level.
On the other hand, if the price manages to break through the 1st resistance level at 28755, it may continue its bullish movement towards the 2nd resistance level at 30051, which is a multi-swing high resistance level. However, given the overall bearish momentum of the chart, this scenario seems less likely.
In summary, the BTC/USD chart is displaying bearish momentum and there is potential for a bearish reaction off the 1st resistance level at 28755, with the 1st support level at 27833 being the potential target. The 2nd support level at 27216 could also act as a support level if the price breaks through the 1st support level. On the upside, the 1st and 2nd resistance levels at 28755 and 30051, respectively, may act as resistance levels if the price manages to break through the 1st resistance level.
US500
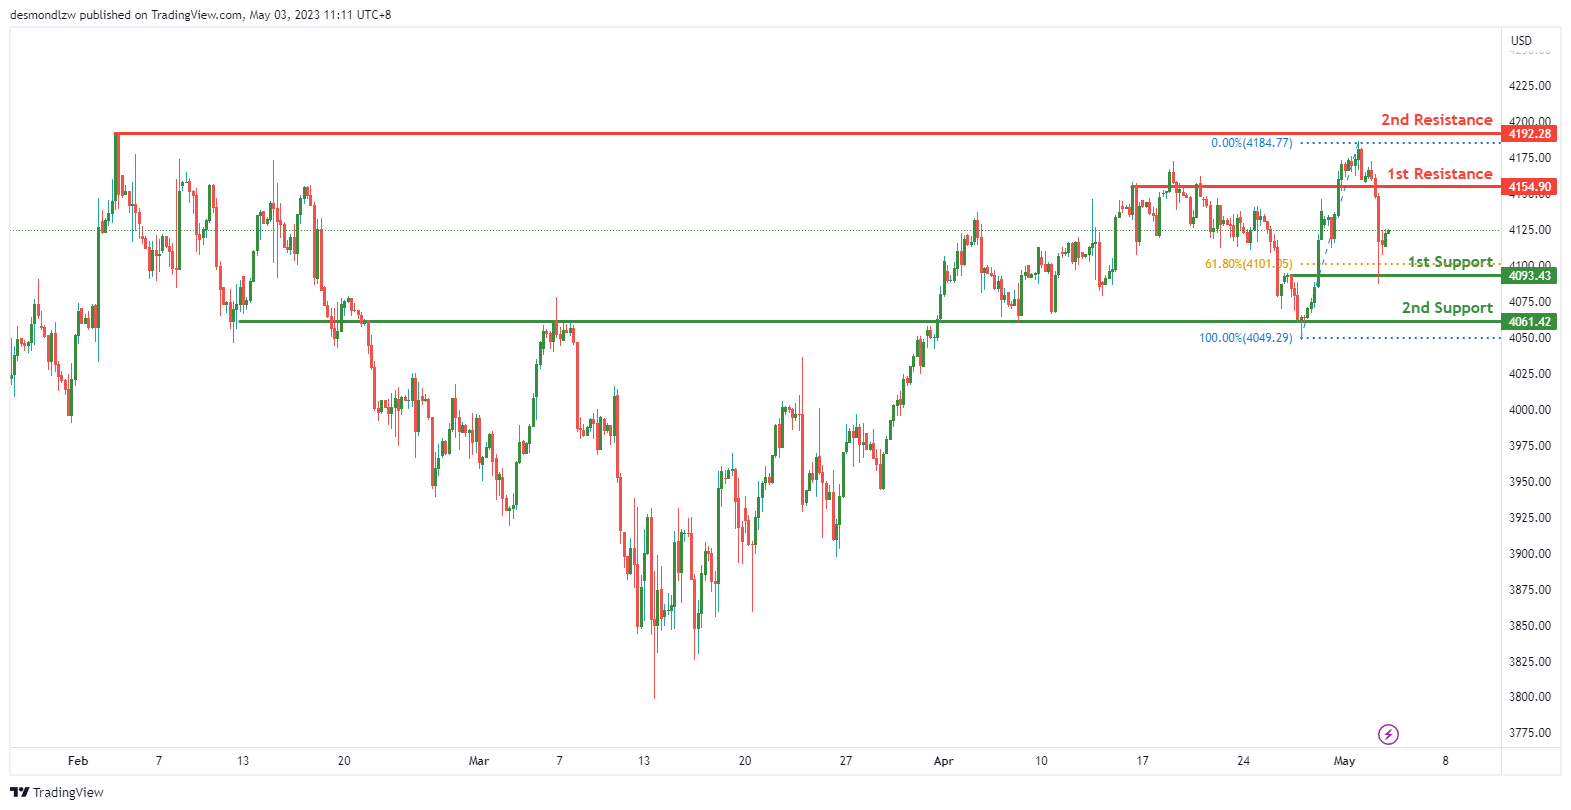
The US500 chart is displaying bullish momentum, with potential for a bullish continuation towards the 1st resistance level at 4145.90. The 1st support level at 4093.43 is a strong overlap support level and also lines up with the 61.80% Fibonacci retracement. If price were to bounce from this level, it could continue its bullish movement towards the 1st resistance level. The 2nd support level at 4061.42 is also an overlap support level.
On the upside, the 1st resistance level at 4145.90 is a pullback resistance level, and if price manages to break through it, it may continue towards the 2nd resistance level at 4192.28, which is a multi-swing high resistance level.
Overall, the US500 chart is displaying bullish momentum, and the potential for a bullish continuation towards the 1st resistance level at 4145.90. The 1st support level at 4093.43 and 2nd support level at 4061.42 may act as support levels if the price drops. The 1st and 2nd resistance levels at 4145.90 and 4192.28, respectively, may act as resistance levels if the price manages to break through the 1st resistance level.
ETH/USD:
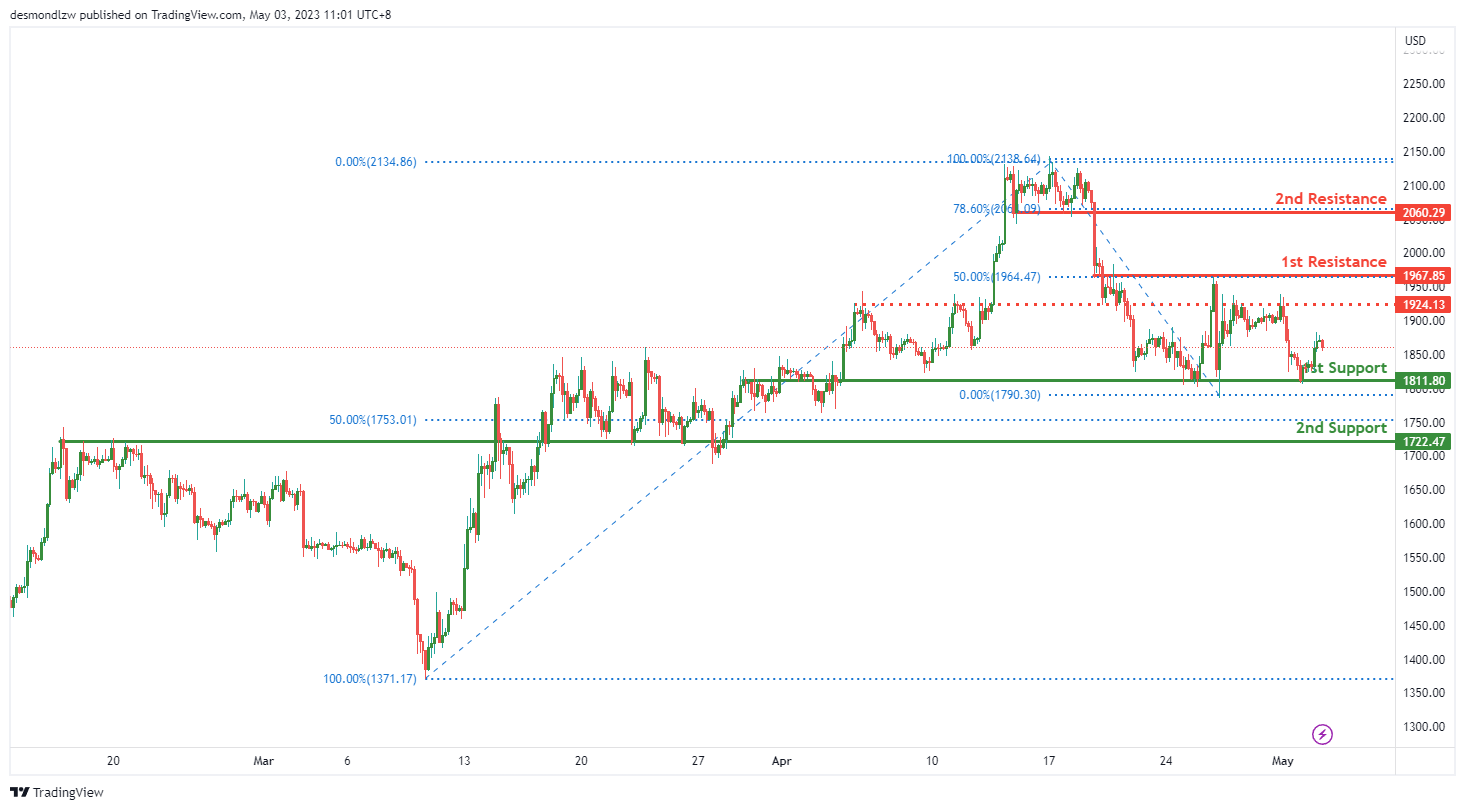
The ETH/USD chart is displaying bearish momentum, with potential for a bearish continuation towards the 1st support level at 1811.80. The 1st support level is a strong overlap support level, which may act as a support level if price were to drop further. The 2nd support level at 1722.47 is also an overlap support level and lines up with the 50% Fibonacci retracement level.
On the upside, the 1st resistance level at 1967.85 is also an overlap resistance level and lines up with the 50% Fibonacci retracement level. If the price manages to break through this level, it could potentially rise towards the 2nd resistance level at 2060.29, which is a pullback resistance level and coincides with the 78.60% Fibonacci retracement level. There is also an intermediate resistance level at 1924.13 which is also an overlap resistance level.
Overall, the ETH/USD chart is displaying bearish momentum, with potential for a bearish continuation towards the 1st support level at 1811.80. The 1st and 2nd support levels at 1811.80 and 1722.47 respectively, may act as support levels if the price drops. The 1st and 2nd resistance levels at 1967.85 and 2060.29, respectively, may act as resistance levels if the price manages to break through the 1st resistance level.
WTI/USD:
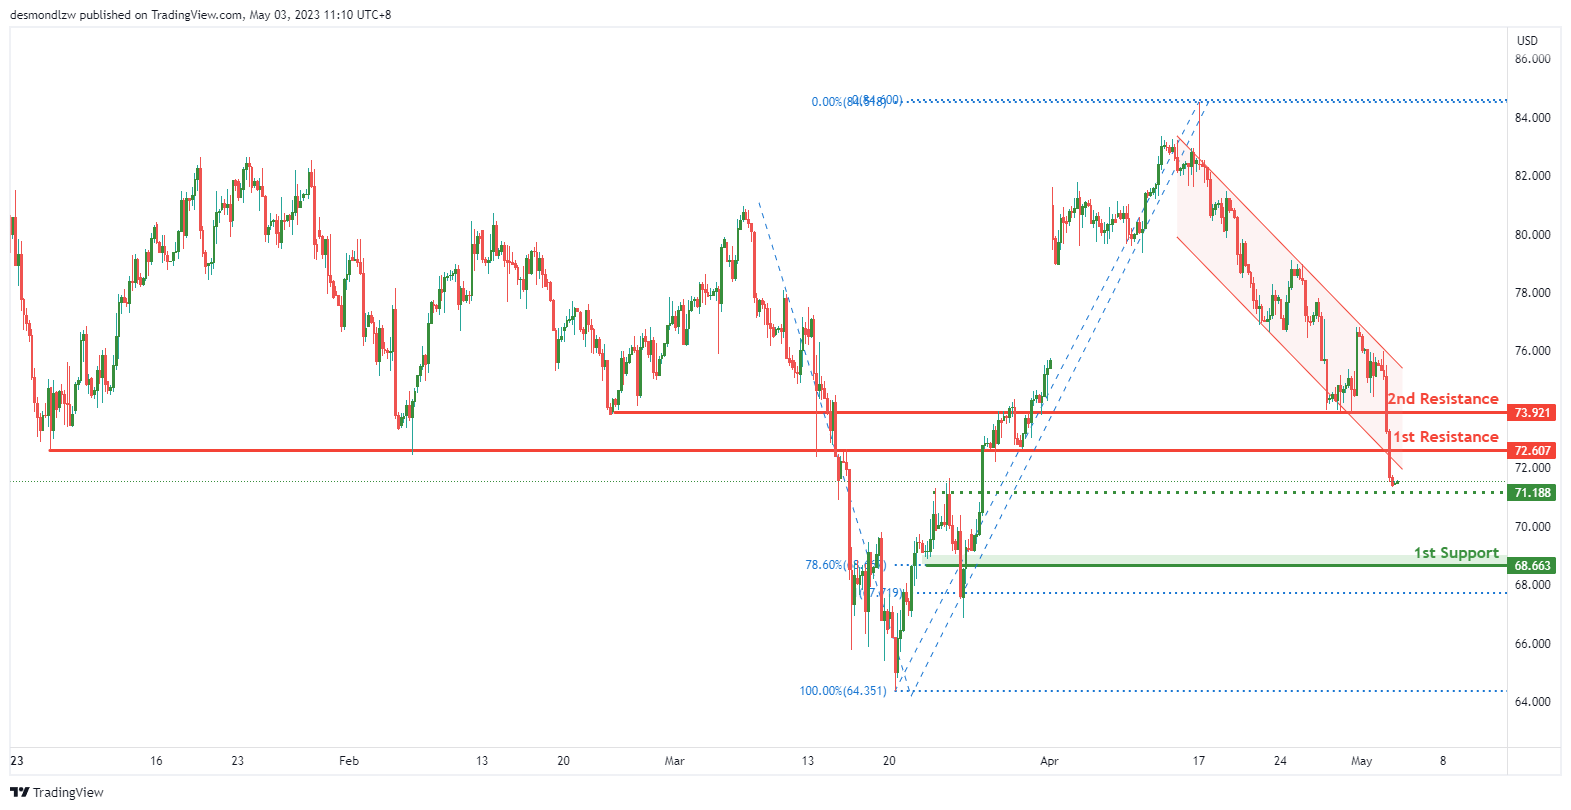
The WTI chart is currently showing a bearish momentum, with potential for a continuation towards the 1st support level at 68.66. This support level is a pullback support and also lines up with the 78.60% Fibonacci retracement, making it a strong level of support. The intermediate support level at 71.18 is also a pullback support level that could act as support if the price were to drop further.
On the upside, the 1st resistance level at 72.60 is an overlap resistance level, and if the price were to rise, it may encounter resistance at this level. The 2nd resistance level at 73.92 is also an overlap resistance level.
Overall, the WTI chart is showing bearish momentum, and the potential for a continuation towards the 1st support level at 68.66. The 1st and intermediate support levels at 68.66 and 71.18, respectively, may act as support levels if the price drops further. The 1st and 2nd resistance levels at 72.60 and 73.92, respectively, may act as resistance levels if the price manages to rise.
XAU/USD (GOLD):
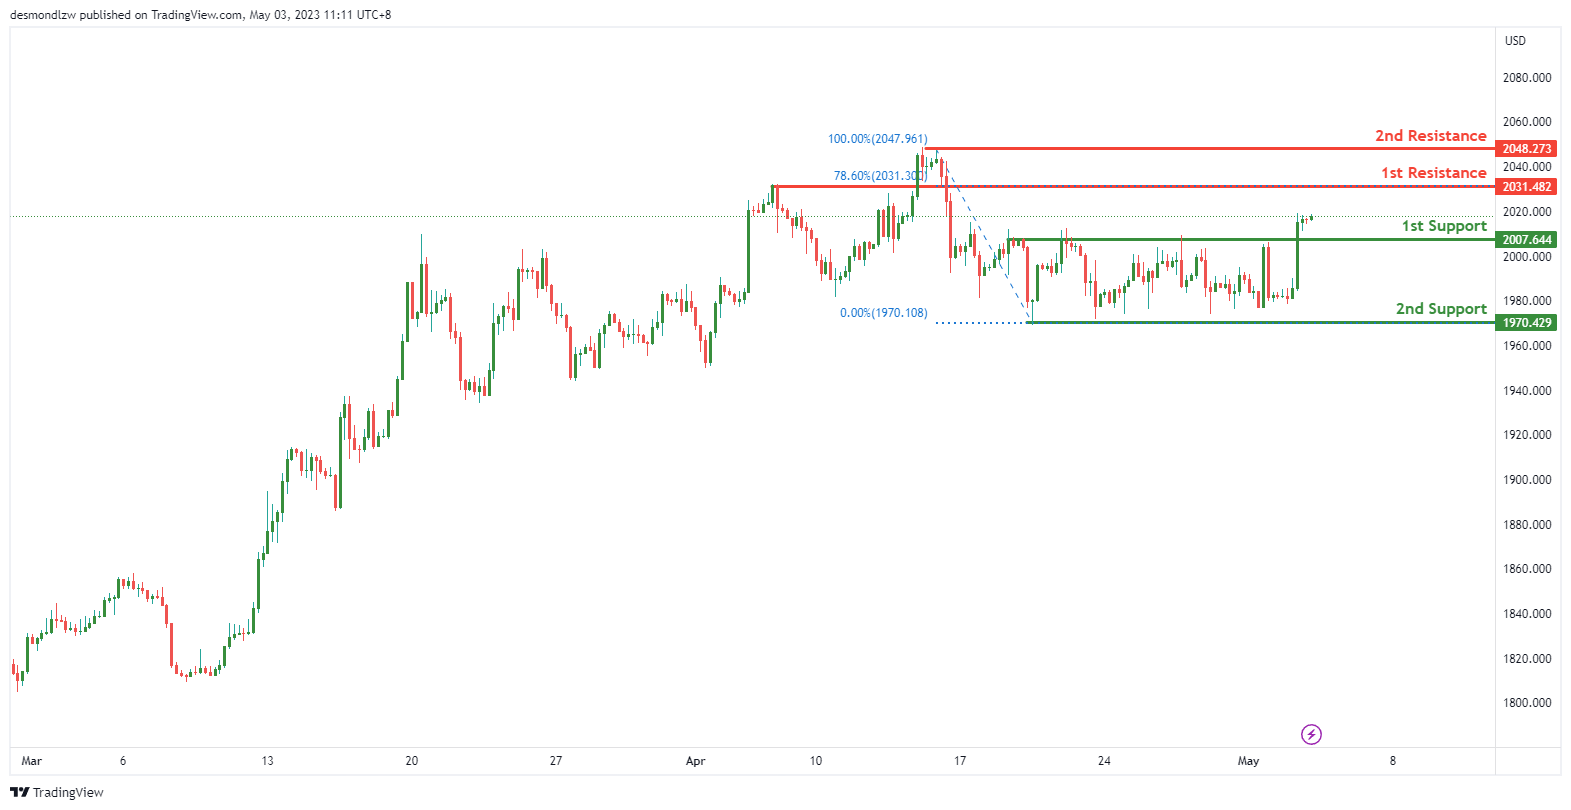
The XAU/USD chart is displaying bullish momentum, indicating the potential for a bullish continuation towards the 1st resistance level at 2031.48. The 1st support level at 2007.64 serves as a strong pullback support level, which could initiate a bullish movement towards the 1st resistance level, should the price bounce off it. The 2nd support level at 1970.42 is also a multi-swing low support level, which further reinforces its potential to act as a support level.
On the upside, the 1st resistance level at 2031.48 serves as a pullback resistance level, which could cause a reversal in bullish momentum if the price fails to break through it. If the price manages to break through, it could continue towards the 2nd resistance level at 2048.27, which is a swing high resistance level.
In summary, the XAU/USD chart is displaying bullish momentum with the potential for a bullish continuation towards the 1st resistance level at 2031.48. The 1st and 2nd support levels at 2007.64 and 1970.42, respectively, could act as support levels if the price drops. The 1st and 2nd resistance levels at 2031.48 and 2048.27, respectively, may act as resistance levels if the price manages to break through the 1st resistance level.
Ethereum (ETHUSD) Has Scope to Correct Further from Elliott Wave Perspective
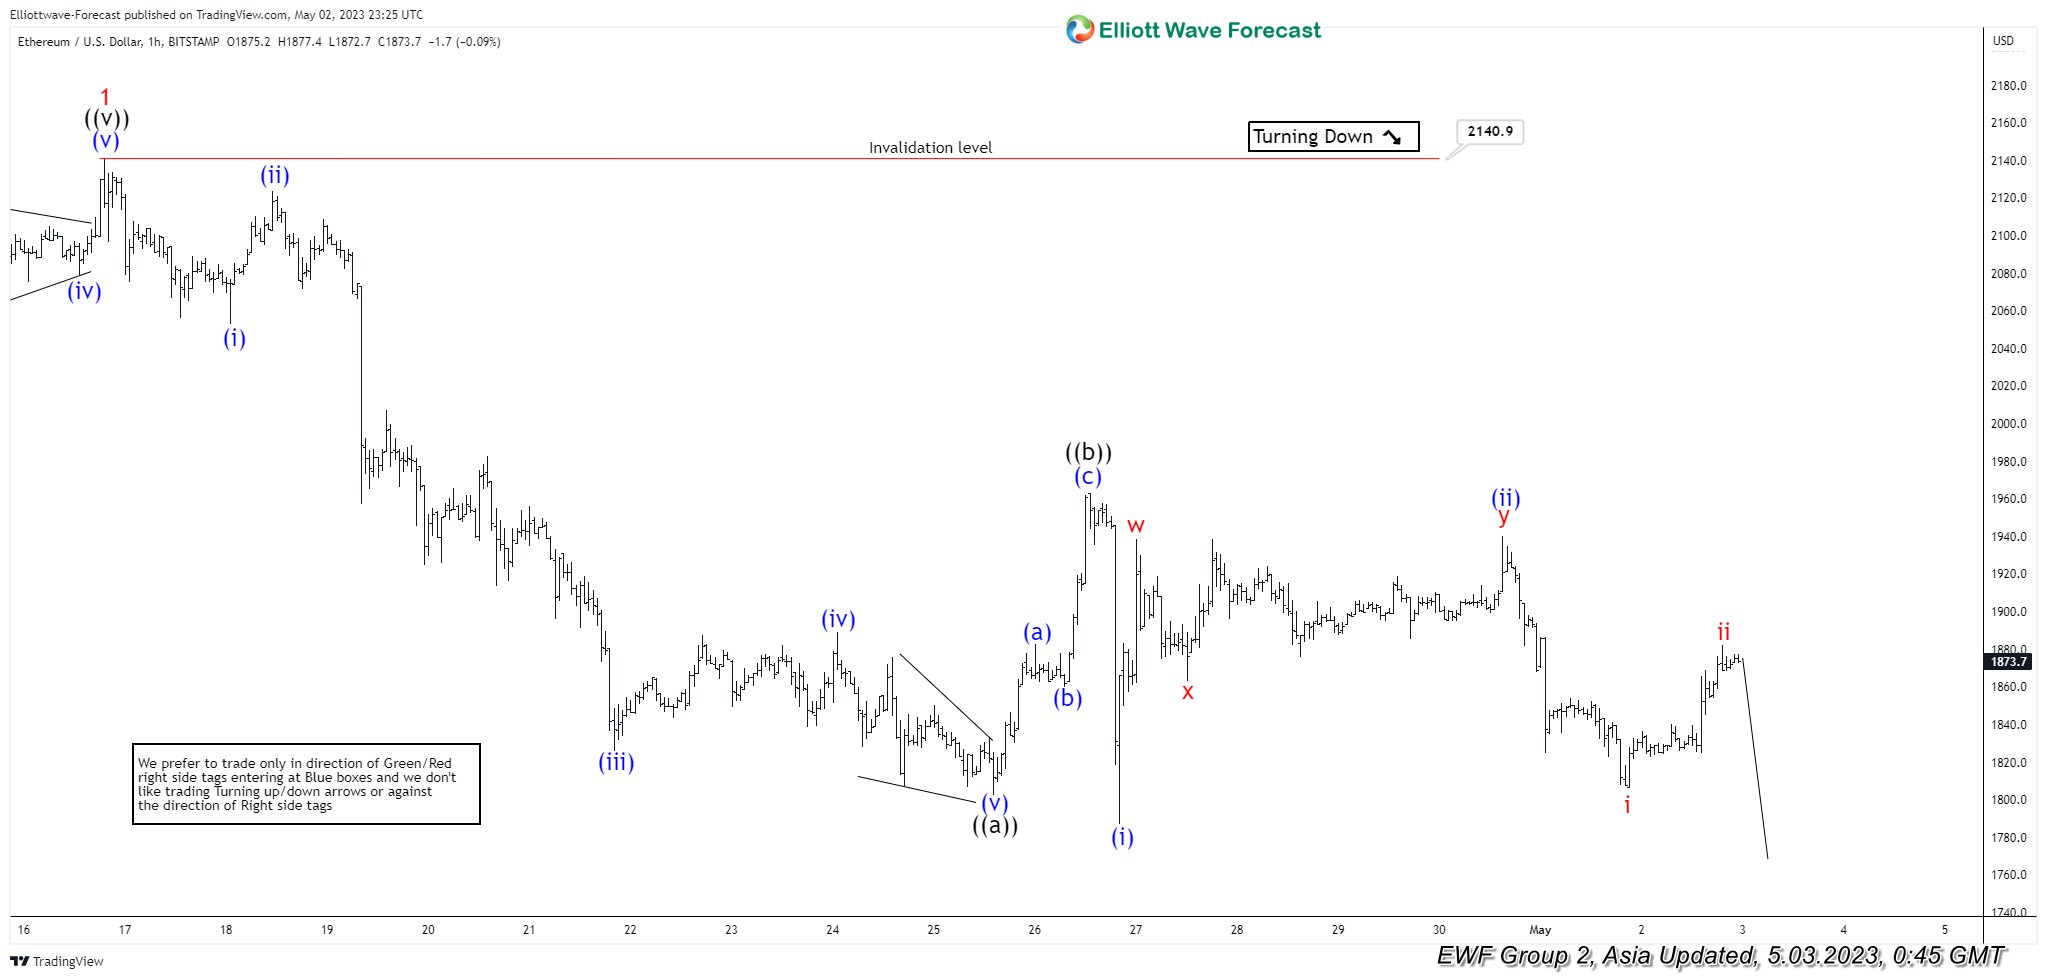
Ethereum (ETHUSD) ended cycle from 3.10.2023 low with wave 1 at 2140.9 as the 1 hour chart below shows. The crypto-currency is now correcting cycle from 3.10.2023 low in wave 2. Internal subdivision of the pullback is unfolding as a zigzag Elliott Wave structure. Down from wave 1, wave (i) ended at 2053.1 and wave (ii) rally ended at 2123.6 The crypto extended lower in wave (iii) towards 1826 and wave (iv) ended at 1889.1. Final leg wave (v) lower ended at 1802.6 which completed wave ((a)). Ethereum then corrected in wave ((b)) towards 1963.2 with internal subdivision as another zigzag in lesser degree.
Up from wave ((a)), wave (a) ended at 1863.9 and pullback in wave (b) ended at 1859.7. Rally in wave (c) higher ended at 1963.2 which completed wave ((b)). The crypto has turned lower and broken below wave ((a)) at 1802.6. This confirms that the next leg lower wave ((c)) has started. Down from wave ((b)), wave (i) ended at 1787 and rally in wave (ii) ended at 1940. The crypto extends lower again in wave (iii). Down from wave (ii), wave i ended at 1806.1 and rally in wave ii ended at 1882.1. Near term, as far as pivot at 2140.9 high stays intact, expect rally to fail in 3, 7, 11 swing for further downside.
Ethereum 1 Hour Elliott Wave Chart
ETHUSD Elliott Wave Video
https://www.youtube.com/watch?v=9oChJmAVZVY
Gold Price Aims Fresh Rally To $2,050, Oil Price Dives
Key Highlights
- Gold price is forming a support base above the $1,975 zone.
- It broke a key contracting triangle with resistance near $1,995 on the 4-hour chart.
- USD/JPY corrected lower after trading as high as 137.77.
- Crude oil prices gained bearish momentum and declined below $75.
Gold Price Technical Analysis
Gold price remained stable near the $1,975 zone against the US Dollar. The price formed a base above $1,980 and recently started a decent increase.
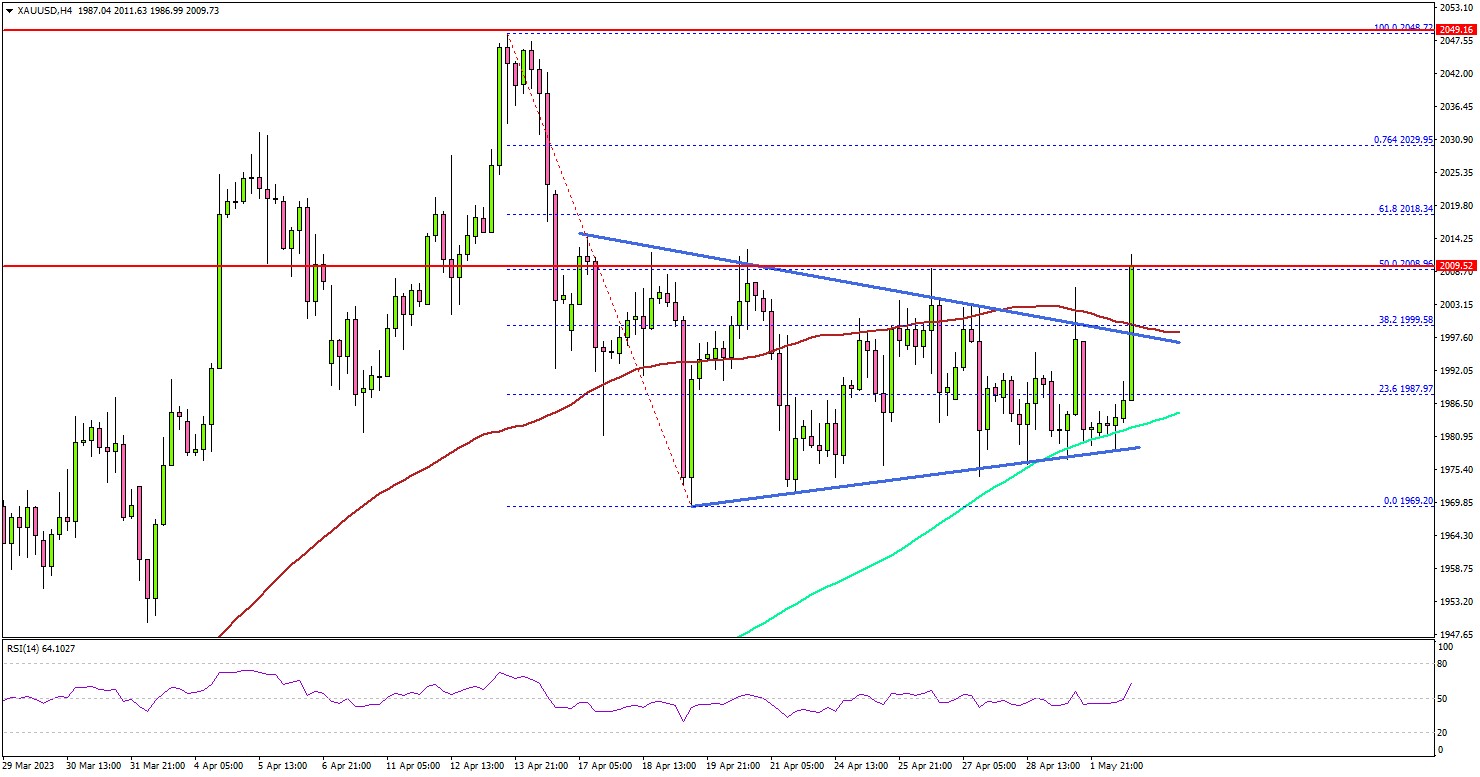
The 4-hour chart of XAU/USD indicates that the price remained well-bid above the 200 Simple Moving Average (green, 4 hours). The price gained strength after it broke the $1,992 resistance.
It even cleared a key contracting triangle with resistance near $1,995 on the same chart and the 100 Simple Moving Average (red, 4 hours). Immediate resistance near the $2,010 level.
The next major resistance is near the $2,020 level. Any more gains might send the price toward the $2,050 resistance level. Intermediate resistance might be at $2,035.
If there is no move above $2,020, the price might resume its decline. The main support seems to be forming near the $1,980 level and the 200 Simple Moving Average (green, 4 hours).
A close below the 200 Simple Moving Average (green, 4 hours) could spark more bearish moves. In the stated case, the price may perhaps decline toward the $1,950 level.
Looking at crude oil prices, there was a sharp decline below the $75 support and it seems like the bears are not done yet.
Economic Releases to Watch Today
- UK Consumer Price Index for March 2023 (YoY) – Forecast +9.8%, versus +10.4% previous.
- UK Core Consumer Price Index for March 2023 (YoY) – Forecast +6.0%, versus +6.2% previous.
- Euro Zone CPI for March 2023 (YoY) - Forecast +6.9%, versus +6.9% previous.
- Euro Zone CPI for March 2023 (MoM) - Forecast +0.9%, versus +0.9% previous.