Sample Category Title
Forex and Cryptocurrency Forecast
EUR/USD: Awaiting Fed and ECB Meetings
The main factor determining the dynamics of the US Dollar Index (DXY) and, consequently, the EUR/USD pair last week was… silence. If recently, the speeches of Federal Reserve representatives were almost the most important market guide, then a silence regime has been in effect since April 21. Leading up to the press conference by Fed Chairman Jerome Powell following the FOMC's May meeting, all officials are instructed to maintain silence. Only a few days remain until the FOMC (Federal Open Market Committee) meeting, where a decision regarding the regulator's future monetary policy will be made, scheduled for May 2/3. Furthermore, on Thursday, May 4, there will be a meeting of the European Central Bank, where an interest rate decision will also be made. In general, the upcoming five-day period promises to be, at the very least, not dull.
Of course, macroeconomic data and events from both sides of the Atlantic caused certain fluctuations in EUR/USD last week. However, the final result was close to zero: if on Friday, May 21, the last chord sounded at the 1.0988 mark, then on Friday, May 28, it was placed not far away: at the 1.1015 level.
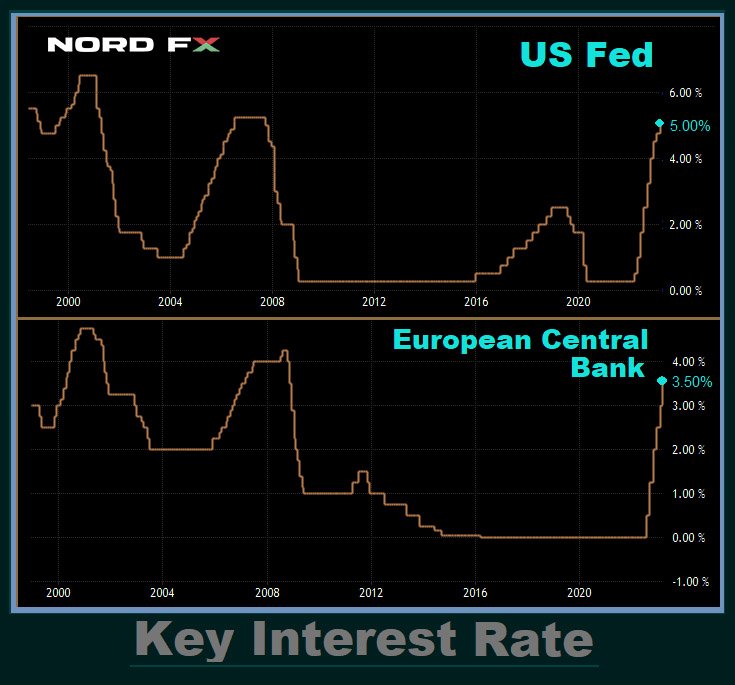
One event worth highlighting was the publication of the First Republic Bank (FRC) report, which ranks among the top 30 US banks by market capitalization. It was this report that led to the dollar's decline and the pair's surge by more than 100 points on Wednesday, April 26.
It seemed that the banking crisis caused by the tightening of the Federal Reserve's monetary policy (QT) was beginning to fade... US Treasury Secretary Janet Yellen even assured the public of the resilience of the banking sector. But then... a new flare-up called First Republic Bank (FRC). To prevent its bankruptcy and support its liquidity in Q1 2023, a consortium of banks transferred $30 billion in uninsured deposits to FRC. Another $70 billion in the form of credit was provided by JPMorgan. However, this was not enough: the bank's clients began to scatter, and FRC shares collapsed by 45% in two days and by 95% since the beginning of the year. In March alone, clients withdrew $100 billion from the bank. Thus, First Republic Bank has a very high chance of becoming number 4 in the lineup of bankrupted major US banks. And if the Fed does not stop its QT cycle, there is a very high probability that numbers 5, 6, 7, and so on will appear on this list.
However, as we have already detailed in our previous review, at the meeting on May 2/3, the key rate will be raised by only 25 basis points (FedWatch from CME estimates the probability of this at 72%). After that, the US Central bank is likely to take a pause. As stated by the President of the Federal Reserve Bank of Atlanta, Raphael Bostic, "one more increase should be enough for us to step back and see how our policy is reflected in the economy." It should be noted that the 25 bp rate hike has long been factored into market quotations. Therefore, immediately after the news about FRC and the surge to 1.1095, EUR/USD returned to a comfortable state for itself.
At the time of writing the review, on Friday evening, April 28, analysts' opinions were divided as follows: 35% of them expect the dollar to weaken and the pair to rise, 50% expect it to strengthen, and the remaining 15% have taken a neutral position. As for technical analysis, among oscillators on D1, 85% are coloured green, 15% are neutral-grey, among trend indicators, 90% are green, and 10% have changed to red. The nearest support for the pair is located in the area of 1.0985-1.1000, followed by 1.0925-1.0955, 1.0865-1.0885, 1.0740-1.0760, 1.0675-1.0710, 1.0620, and 1.0490-1.0530. Bulls will encounter resistance in the area of 1.1050-1.1070, then 1.1110, 1.1230, 1.1280, and 1.1355-1.1390.
In addition to the aforementioned FOMC and ECB meetings, we can expect a substantial amount of economic data next week. On Monday, May 1, the ISM Manufacturing PMI for the US will be published. The next day, the value of a similar index, but for Germany, will become known. Also, on Tuesday, May 2, we will learn about the inflation situation in the Eurozone, as the Consumer Price Index (CPI) will be released. Furthermore, on May 2, 3, 4, and 5, we will get a flurry of US labour market data. Important indicators such as the unemployment rate and the number of new non-farm jobs in the US (NFP) are among these, they will traditionally be published on the first Friday of the month, May 5.
GBP/USD: BoE vs. Fed: Who Will Win the Battle of Interest Rates?
The Bank of England (BoE) meeting will take place a week after the Fed's meeting, on Thursday, May 11. Most experts believe that the cycle of interest rate hikes for the pound is not yet over, which supports the British currency.
Recent data on inflation for March contribute to these forecasts. The Consumer Price Index (CPI) in annual terms once again reached a double-digit figure, 10.1%, which is higher than the forecast of 9.8%. To bring this indicator below the psychologically important mark of 10.0%, the BoE is highly likely to continue following the Fed's example. Market participants expect the regulator to raise the interest rate by 50 basis points on May 11: from 4.25% to 4.75%. No more effective ways to curb inflation have been devised so far. And if it continues to remain so high, it will harm both the consumer market and the overall UK economy.
Since the beginning of April, we have observed a sideways trend. However, GBP/USD finished the past five-day period at the 1.2566 mark, unexpectedly breaking the upper boundary of the channel. Perhaps the reason for the jump was the closing of trading positions at the end of the month. Currently, 75% of experts are in favor of the dollar, and only 25% side with the British pound. Among oscillators on D1, the balance of power is as follows: 85% vote in favor of the green (with a third of them being in the overbought zone), and the remaining 15% have turned neutral-grey. Trend indicators are 100% on the green side. Support levels and zones for the pair are 1.2450-1.2480, 1.2390-1.2400, 1.2330, 1.2275, 1.2200, 1.2145, 1.2075-1.2085, 1.2000-1.2025, 1.1960, 1.1900-1.1920, and 1.1800-1.1840. As the pair moves north, it will encounter resistance at the levels of 1.2510-1.2540, 1.2575-1.2610, 1.2700, 1.2820, and 1.2940.
Regarding important statistics on the state of the UK economy for the upcoming week, on Tuesday, May 2, the Manufacturing Purchasing Managers' Index (PMI) will be published. Then, on May 4, we will learn the value of the PMI for the services sector as well as the composite business activity indicator for the UK as a whole. Traders should also be aware that there will be a bank holiday in the country on Monday, May 1.
USD/JPY: Bank of Japan - Heading for Softer Ultra-Soft Policy
Forecasting the interest rate of the Bank of Japan (BoJ) is quite simple and very, very boring. As a reminder, it is currently at a negative level of -0.1% and was last changed on January 29 of the distant 2016, when it was lowered by 20 basis points. This time around, at its meeting on Friday, April 28, the regulator left it unchanged at the same -0.1%.
But that's not all. Many market participants were expecting that with the arrival of the new Central bank governor, Kazuo Ueda, the regulator would eventually change course towards tightening. However, contrary to these expectations, during his first press conference following his first meeting on April 28, Ueda stated, "We will continue to ease monetary policy without hesitation if necessary." One might wonder how much softer it could get, but it turns out that the current -0.1% is not the limit.
The result of the BoJ governor's words can be seen on the chart: in just a few hours, USD/JPY soared from 133.30 to 136.55, weakening the yen by 325 points. Of course, it's still far from the October 2022 peak, but a rise to the 137.50 level no longer seems entirely unrealistic.
The pair ended the past week at the level of 136.30. Regarding its near-term prospects, analysts' opinions are distributed as follows: currently, only 25% of experts vote for the pair's further growth, 65% point in the opposite direction, expecting the yen to strengthen, and 10% simply shrug. Among the oscillators on D1, 85% point upward (a third of them are in the overbought zone), while the remaining 15% remain neutral. Trend indicators show 90% looking north, and 10% pointing south. The nearest support level is in the 136.00 area. Next are the levels and zones at 135.60, 134.75-135.15, 132.80-133.00, 132.00-132.40, 131.25, 130.50-130.60, 129.65, 128.00-128.15, and 127.20. Resistance levels and zones are at 137.50 and 137.90-138.00, 139.05, and 140.60.
Regarding events characterizing the state of the Japanese economy, none are expected in the coming week. Moreover, the country is looking forward to a series of holidays: May 3 is Constitution Day, May 4 - Greenery Day, and May 5 is Children's Day. As a result, the dynamics of USD/JPY will depend entirely on what is happening on the other side of the Pacific Ocean, in the United States.
CRYPTOCURRENCIES: Awaiting the 2024 Halving
BTC/USD continued to decline on Monday, April 24 and, after breaking the support at $27,000, fell to $26,933. Market participants were already prepared to see bitcoin go even lower at the strong support level of $26,500. However, it unexpectedly soared to $30,020 on April 26. The main cryptocurrency was saved, as it has been many times before and will be many times again, by a weakened dollar. The cause of the shock was the problems of First Republic Bank, which followed a series of bankruptcies of crypto-friendly banks, as discussed above.
The correlation between the crypto and banking industries arises thanks to the following chain of events: 1) Tightening of the Federal Reserve's monetary policy hits banks, lowering their asset prices, reducing demand for their services, and causing customers to flee. 2) This situation creates serious difficulties for some banks and leads to the bankruptcy of others. 3) This can force the Fed to pause its cycle of raising interest rates or even lower them. Additionally, the regulator may restart the printing press to support bank liquidity. 4) Low rates and a flow of new cheap money lead to a decrease in the value of the dollar and allow investors to direct these funds into risky assets such as stocks and cryptocurrencies, which leads to an increase in their quotes. We have already seen this during the COVID-19 pandemic and may see it again in the near future.
According to former Goldman Sachs top manager and macro-investor Raoul Pal, the Federal Reserve (Fed) is likely to have finished its saga of raising interest rates. He has also predicted an upcoming recession that will force the regulator to "change course" and support the markets by printing money. In that case, he believes that risky assets are in for an "inevitable liquidity wave." This capital influx will "enlighten" the crypto industry with new innovations, and the number of people using digital assets will increase from the current 300 million to over 1 billion.
According to experts from the British bank Standard Chartered, bitcoin has benefited from its status as a "brand refuge" for savings at the beginning of 2023, and the current situation indicates the end of the "crypto winter". Standard Chartered believes that recent turmoil in the banking sector, stabilization of risky assets due to the end of the Fed's interest rate hike cycle, and increased profitability in the crypto mining industry will contribute to BTC's further growth. In addition, the adoption of the first EU framework for regulating crypto markets by the European Parliament could also support the leading cryptocurrency. The upcoming halving event will also impact BTC's growth, with bitcoin potentially reaching $100,000 by the end of 2024.
It should be noted that the topic of halving is becoming more and more prevalent. The Bitcoin Archive press service reminds us that it is less than a year away, with the procedure scheduled for April 6, 2024, as of April 24, 2023. However, this date is not final and may change, as it has in the past.
Some market participants believe that this event will be crucial for the future price of the flagship cryptocurrency. They believe that cycles for cryptocurrencies are consistent, and BTC quotes will reach new record highs a year or a year and a half after halving, as happened in previous cycles. Others argue that the market situation has changed. Bitcoin has become a mass phenomenon, and now "other laws and rules apply to the cryptocurrency", so other factors will become decisive, not just the halving of mining rewards.
It is worth noting that the second group of specialists includes Bloomberg Intelligence analyst Jamie Coutts, who predicts that the price of bitcoin will rise to $50,000 before April 2024. "The price of bitcoin bottoms out when there are 12-18 months left until the halving. The structure of the current cycle is similar to previous ones. However, many factors have changed: the network has become significantly more resilient, and bitcoin has never experienced a prolonged economic downturn," Coutts said. If his forecast is correct, the asset will appreciate by about 220% from the low reached last November before the halving.
The expert and trader known as Doctor Profit reminded of his previous statement that the bottom for bitcoin was reached at the level of $15,400, and it is unlikely that we will see another drop to this level. The dump in November 2022 was a complete capitulation, including for bitcoin miners, some of whom were forced to sell their coins and equipment at a loss. According to Doctor Profit, BTC is currently in an accumulation phase, neither in a bull nor in a bear market. At the same time, the specialist has advised traders to closely monitor the correlation between the Chinese stock market and bitcoin, believing that China will lift the ban on cryptocurrencies and legalize them, which will have a very positive long-term effect on their price.
Another analyst under the nickname DonAlt also excludes a drop in BTC/USD to the lows of November 2022. At the same time, he allows for a correction down to $20,000, which, in his opinion, will be a good level to replenish the reserves of the main cryptocurrency.
It's been a while since we quoted the popular analyst under the nickname PlanB, known for his Stock-to-Flow (S2F) model. He continues to assert that the predictions he makes based on this model continue to come true. "Before the halving, we can expect $32,000 for bitcoin, then $60,000. Then [after the halving] $100,000 will become the minimum, and the maximum rate could reach $1 million. But on average, after the next halving, the BTC rate should reach $542,000," wrote PlanB. At the same time, the analyst emphasized that the behaviour of the crypto market fully corresponds to S2F, so its critics are simply unfounded.
It is worth noting that PlanB is not alone in his super-optimistic predictions for the price of bitcoin, which legendary Warren Buffett called "rat poison squared." Robert Kiyosaki, the author of the popular book Rich Dad Poor Dad, believes that the value of the flagship cryptocurrency will rise to $500,000 by 2025. And at Ark Invest, looking a decade ahead, they named a figure of $1 million per coin.
As of the evening of Friday, April 28, BTC/USD is trading at $29,345. The total market capitalization of the crypto market is $1.205 trillion ($1.153 trillion a week ago). The Crypto Fear & Greed Index has increased from 50 to 64 points over the past seven days, moving from Neutral to the Greed zone.
Slightly Easing Price Pressures
Market movers today
A busy week of data releases and central banks kicks off in a quiet fashion. Today we are curious to see whether the US ISM manufacturing index for April reflects similar strength as the PMIs earlier.
Early on Tuesday morning, we expect the RBA to keep monetary policy unchanged in line with market and consensus expectations. We also get euro area flash HICP tomorrow.
On Wednesday, all eyes turn to the Fed, where we look for final 25bp hike. The April jobs report will be out on Friday.
Thursday will bring the ECB meeting, and there we stick to our call for a 50bp hike although risks are tilted towards a smaller hike, particularly if tomorrow's bank lending survey disappoints.
The 60 second overview
Euro area macro: The German economy just avoided technical recession with unchanged GDP in Q1 supported by lower energy prices and stronger export growth. Challenging times still lies ahead, though, as real income losses and rising interest rates continue to weigh on consumers. Inflation figures out of several euro area countries, including Germany and France, point to a slight uptick in euro area inflation tomorrow, with core inflation slightly lower. On balance, it is good news to ECB, that underlying price pressures are not surging further, however core inflation remains way too high.
Bank of Japan: Governor Ueda came out on the dovish side at the BoJ press conference on Friday, basically eliminating the risk of a quick pull-back from the yield curve control before a policy review, which could take up to 1½ years. JPY also weakened significantly on the back of the policy announcement and then again after the press conference.
Trade: The global trade bellwether, South Korea, saw a continued annual decline in exports of 14.2% in April, particularly driven by weak sales to China. Semiconductor exports were down 41.0%, indicating a continued global manufacturing struggle.
US: Real PCE consumption and Core PCE inflation came in slightly above expectations on Friday, and the Q1 Employment Cost Index was also slightly higher than expected. Wages increased 1.2% q/q, which is still clearly too fast. Core service prices eased to 0.3% m/m SA (from 0.43%), which was not a surprise after the CPI data released earlier. This did not change the outlook for the FOMC meeting Wednesday.
Equities: Global equities higher on Friday in relative quiet sessions. There were a lot of macro data, earnings results and yet another US bank on the brink of failing. Hence, one could easily find reasons for a volatile session but that did not happen. However, it does not come as a complete surprise to see First Republic in trouble and the same could be said about the outcome of the sum of data released on Friday. Investors are still light on risk and as data come in fairly good the pain trade is still up for equities. In US, Dow +0.8%, S&P 500 +0.8%, Nasdaq +0.7% and Russell 2000 +1.0%. Some Asian markets are closed this morning, but Japan is leading the open markets higher despite some disappointing PMI data from China this morning. Most of European markets are closed today. US futures are marginally higher.
FI: It is going to be an eventful week with the Federal Reserve meeting on Wednesday and ECB meeting on Thursday. We expect that the Federal Reserve will tighten monetary policy by 25bp and this will be the last hike during this cycle. ECB is expected to hike by 50bp, but it is going to be a fairly close call between 25bp and 50bp. ECB is expected to continue to tighten monetary policy as we expect that ECB will go to 4% for the policy rate.
FX: Friday's session was dominated by JPY weakness following a soft Bank of Japan message. Also the NOK had a poor session following the fiscal FX transaction announcement from Norges Bank albeit a rise in oil limited the decline. EUR/USD continues to trade north of 1.10 while EUR/SEK has fallen back to the 11.30 mark.
Credit: The last trading day of the month was a relatively quiet one with iTraxx Main 1bp tighter at 83bp while iTraxx Xover was 6bp tighter at 435bp. First Republic Bank's outstanding 4.374% bond maturing in 2046 declined markedly as the fate of the bank remains uncertain. To what extent it is possible to contain the problems of First Republic Bank is likely to be decisive for the overall market sentiment in the coming weeks.
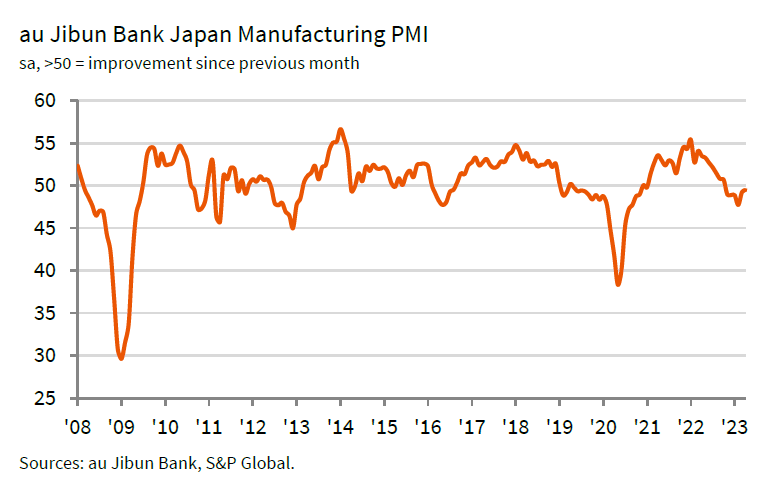
Japan’s PMI manufacturing finalized at 49.5, sector remains in contraction
Japan's PMI Manufacturing for April was finalized at 49.5, marginally above March's 49.2, marking the sixth consecutive month of contraction in the sector. Jibun Bank noted that new order volumes displayed further signs of stabilization, while output charges experienced their strongest rise in five months. Additionally, input delivery times only lengthened slightly.
Usamah Bhatti, an economist at S&P Global Market Intelligence, commented that the Japanese manufacturing sector remained in contraction territory at the start of Q2 2023. However, the rate of deterioration eased to the softest in the current six-month sequence, primarily due to the slowest reduction in new order inflows since July of last year.
Bhatti further observed that firms reported supply chains continued on the path to normalization, with the softest lengthening in delivery times in the current 39-month sequence. Inflationary pressures remained historically high, but manufacturers signaled that input prices rose at the softest pace since August 2021. To protect profit margins, firms increasingly passed higher cost burdens onto customers, resulting in charge inflation accelerating to a five-month high.
China’s manufacturing PMI contracts for first time this year
Released over the weekend, China's official PMI Manufacturing declined from 51.9 in March to 49.2 in April, falling short of expectation of 51.4. This drop also brought the reading below the 50-mark, signaling the first contraction in manufacturing activity this year.
A significant contributor to the decline in the headline indicator was the new orders sub-index, which dipped to 48.8 from 53.6, suggesting a decrease in market demand. Additionally, new export orders decreased to 47.6 from 50.4, reaching a three-month low.
Senior NBS statistician Zhao Qinghe attributed the contraction in April to a lack of market demand and the high-base effect resulting from the rapid manufacturing recovery in the first quarter. The chemical fiber, ferrous metal mining, and processing sectors have experienced slowed production due to weak market demand, while the special equipment and electrical and mechanical equipment sectors continue to expand, according to a separate NBS statement.
PMI Services index also fell, dropping from 58.2 to 56.4, below the expected 57.0, but it remains the second-highest reading this year. The composite PMI, encompassing both manufacturing and non-manufacturing activity, declined to 54.4 from 57.0.
Is The Elliott Wave Principle Objective or Subjective?
The Elliott Wave Principle is generally considered to be a subjective tool for technical analysis. This is because the interpretation of the wave patterns and counts relies on the experience and analysis of the price movements.
The Principle involves identifying repetitive patterns in price movements and using those patterns to make predictions about future price action. However, while there are guidelines and rules that can be used to identify this patterns, there is not a unique approach and different traders can come up with different wave counts and interpretations of a same chart.
Is there a way to change that subjective to objective?
There are methods that traders can use to try to make their wave counts more objective. Here are some approaches:
- Use clear and consistent guidelines. One way to make the wave counts more objective is to use clear and consistent guidelines for identifying the waves. For example, traders can use specific rules for wave length, wave amplitude, and wave duration, which can help to reduce subjectivity.
- Validate the wave counts with multiple indicators. Another way to make wave counts more objective is to validate them with multiple indicators. This can include technical indicators such as moving averages, relative strength index, stochastic, etc. which can help to confirm the direction and strength of the trend.
- Use a systematic approach. To make wave counts more objective, traders can use a systematic approach to analyzing the charts. This can include breaking down the chart into smaller time frames and looking for patterns and trends that are consistent across multiple time frames. To determinate sequences, cycles, market dynamics, correlations, etc., also is a good support to make a objective count.
- Backtest the wave counts. Another way to make wave counts more objective is to backtest them on historical data. This can help to identify which wave counts have been most accurate in the past and can give traders a better idea of which wave patterns to look for in the future.
While these approaches can help to make the Elliott Wave Principle more objective, it is important to remember that there is always a degree of subjectivity in technical analysis. Most technical analysis tools involve some degree of subjectivity. Ultimately, it is up to the individual trader to use their judgment and experience to interpret the charts and make trading decisions.
How is the must common way to trade using The Elliott Wave Principle?
The most common way to trade using the Elliott Wave Principle is to identify and trade with the trend, which is determined by the direction of the wave patterns.
Traders who use Elliott Wave typically start by identifying the major trend in the market by looking for larger timeframes. They then look for corrective waves that move against the trend. These corrections can be used as potential entry points for trades in the direction of the trend. We have created the Rigth Side System to trade in favor of the trend.
For example, This is the gold weekly chart updated from April 15th. XAUUSD is bullish and traders may look for corrective waves that move downward, such as ABC or WXY corrections. Once the correction is over, traders may enter a long position with the expectation that the trend resumes. In the chart, we can see how gold reacted higher from the blue box. The market completed a double correction structure as wave IV and rally in favor of the trend. We have developed the blue box area where we expect a trend continuation or a contrarian reaction of the market.
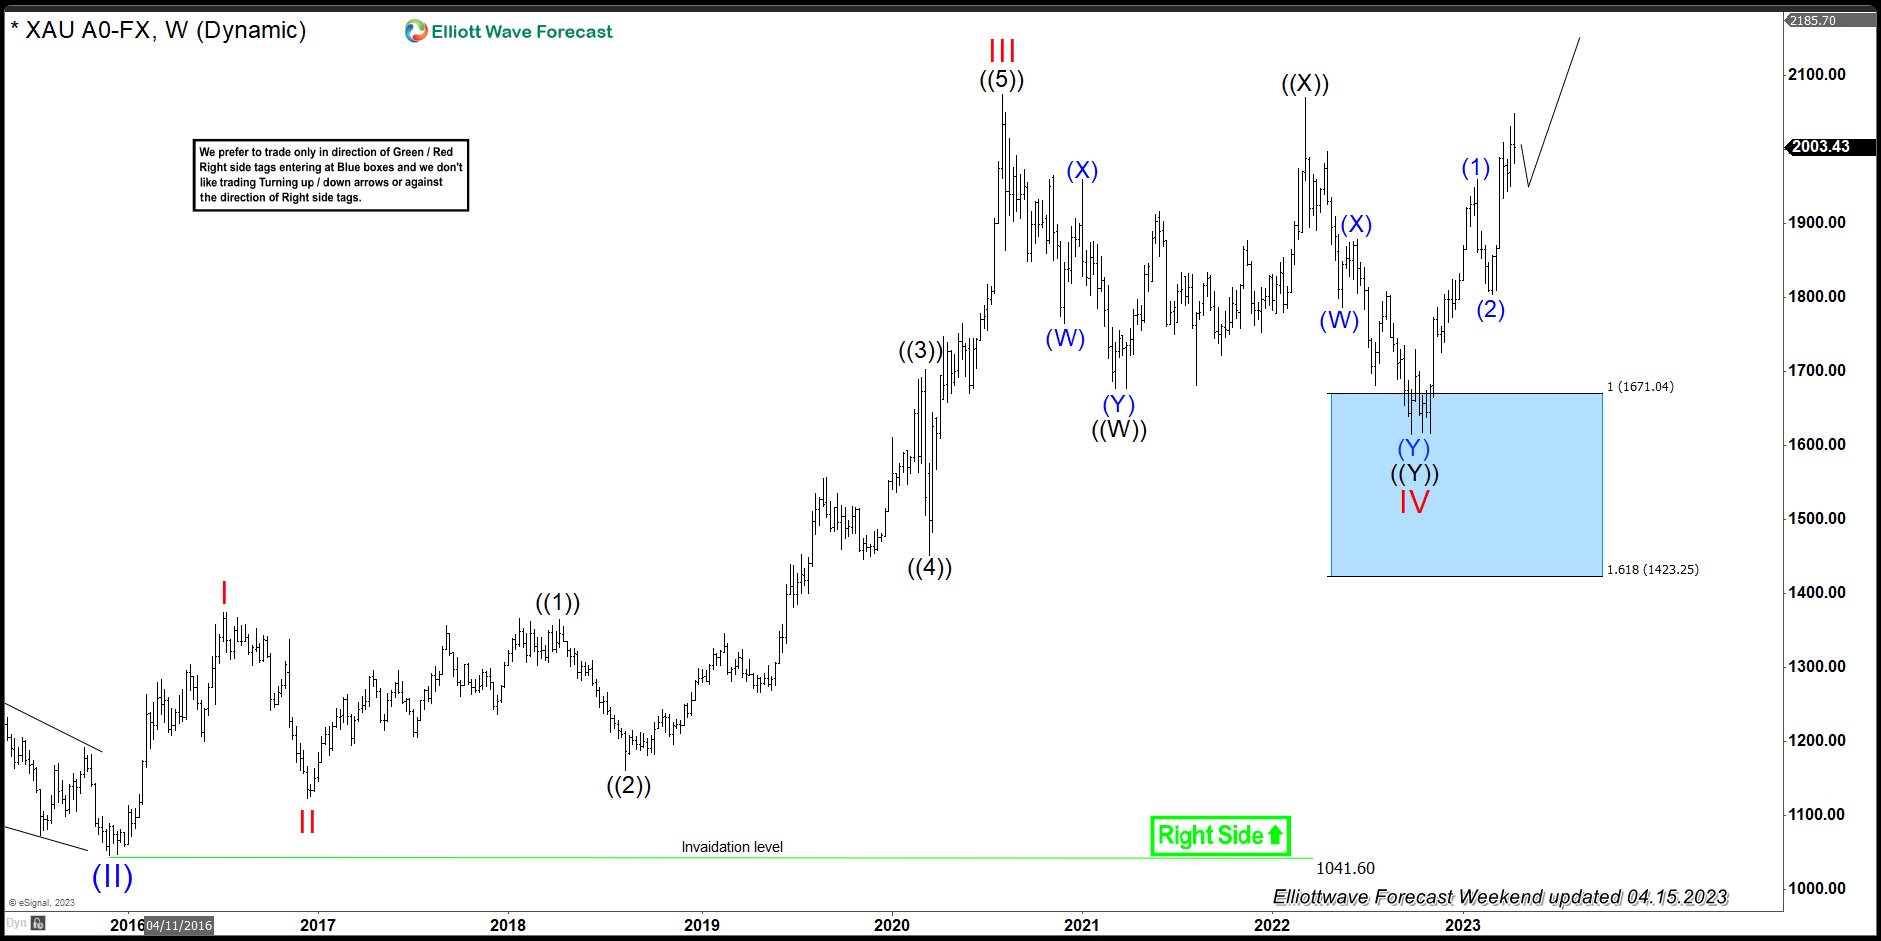
Traders may also use other technical indicators, such as support, resistance, invalidation levels and Fibonacci tools. These will help to confirm their Elliott Wave counts and to identify potential entry and exit points for trades. Traders who use this approach often have their own unique methods and strategies. They can take time and experience to become proficient in its use.
EUR/USD Faces Major Breakout Resistance at 1.1075
Key Highlights
- EUR/USD is facing strong resistance near 1.1075.
- A major bullish trend line is forming with support near 1.0990 on the 4-hour chart.
- GBP/USD surged above the 1.2500 and 1.2520 resistance levels.
- The US ISM Manufacturing PMI could rise from 46.3 to 46.6 in April 2023.
EUR/USD Technical Analysis
The Euro made another attempt to clear the 1.1075 resistance against the US Dollar. However, EUR/USD struggled to stay above 1.1075 and corrected gains.
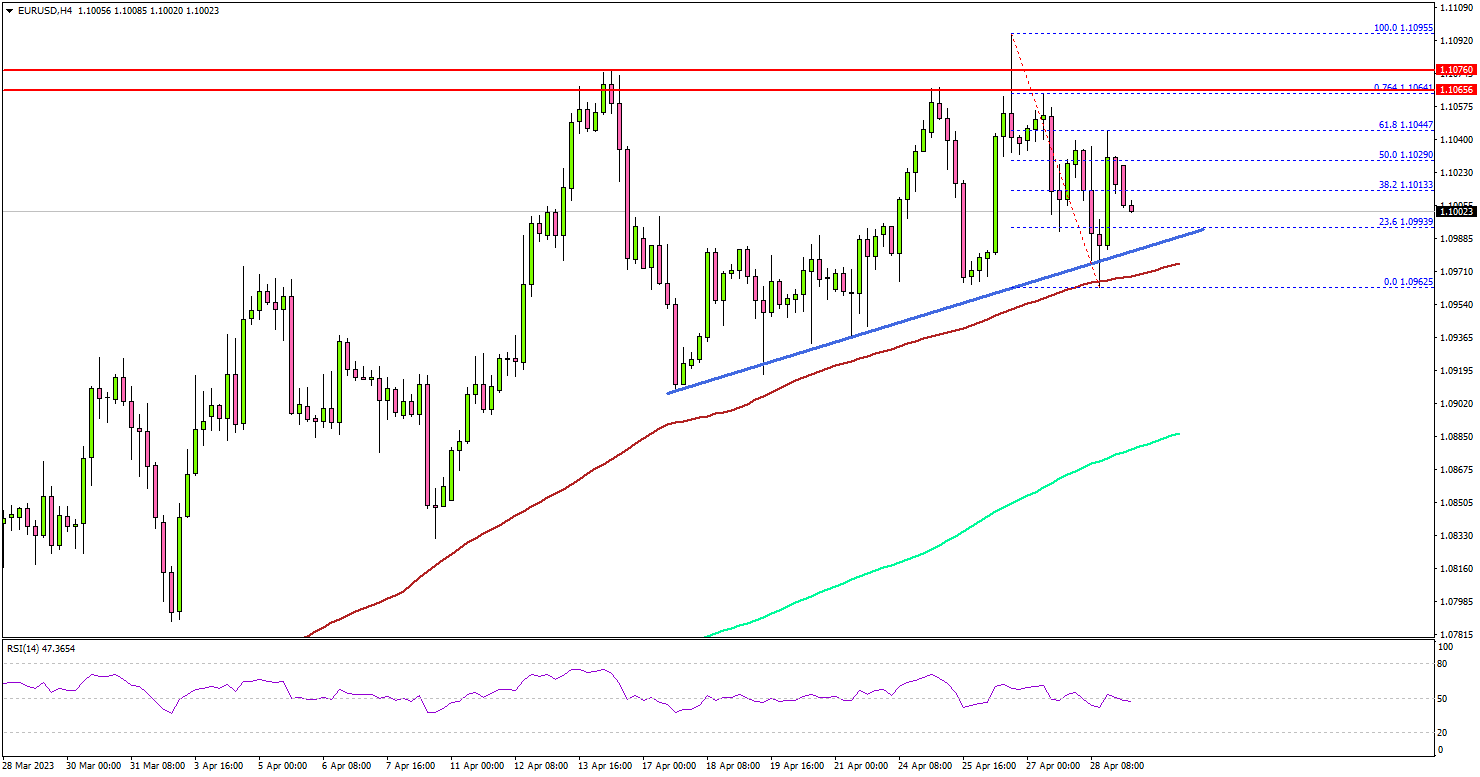
Looking at the 4-hour chart, the pair traded as high as 1.1095 before it corrected lower. There was a move below the 1.1020 support but the pair remained stable above the 100 simple moving average (red, 4 hours) and the 200 simple moving average (green, 4 hours).
The pair is now consolidating near the 1.1020 zone. Immediate resistance on the upside is near the 1.1050 level. The main breakout resistance is still near the 1.1075 level.
A clear upside break and close above the 1.1075 resistance might start a strong increase. The next key resistance is near the 1.1120 zone. Any more gains might send the pair toward 1.1200.
On the downside, there is major support near 1.1000 and the 100 simple moving average (red, 4 hours). There is also a major bullish trend line forming with support near 1.0990 on the same chart.
The next major support sits near the 1.0965 level, below which the pair might accelerate lower. In the stated case, EUR/USD could visit the 1.0920 support zone.
Looking at GBP/USD, the pair gained bullish momentum and was able to trade to a new multi-week high above the 1.2540 resistance.
Economic Releases
- US ISM Manufacturing PMI for April 2023 – Forecast 46.6, versus 46.3 previous.
Nikkei 225 index Wave Analysis
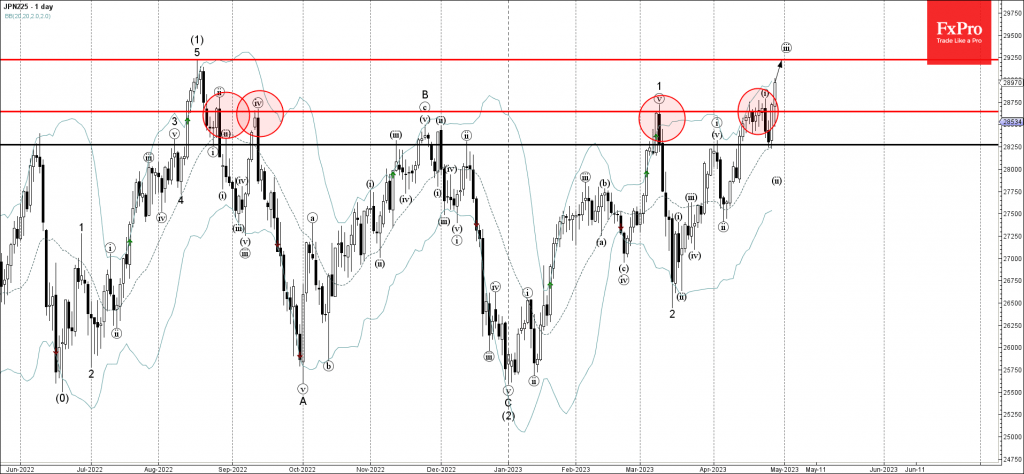
Nikkei 225 broke resistance level 28645.00
Likely to rise to resistance level 29250.00
Nikkei 225 index rising sharply after the price broke above the resistance level 28645.00 (which has been reversing the price from the end of August).
The breakout of the resistance level 28645.00 continues the active short-term impulse wave (iii), which belongs to the higher impulse waves 3 and (3).
Nikkei 225 index can be expected to rise further toward the next resistance level 29250.00 (target price for the completion of the active impulse wave (iii)).
EURGBP Wave Analysis
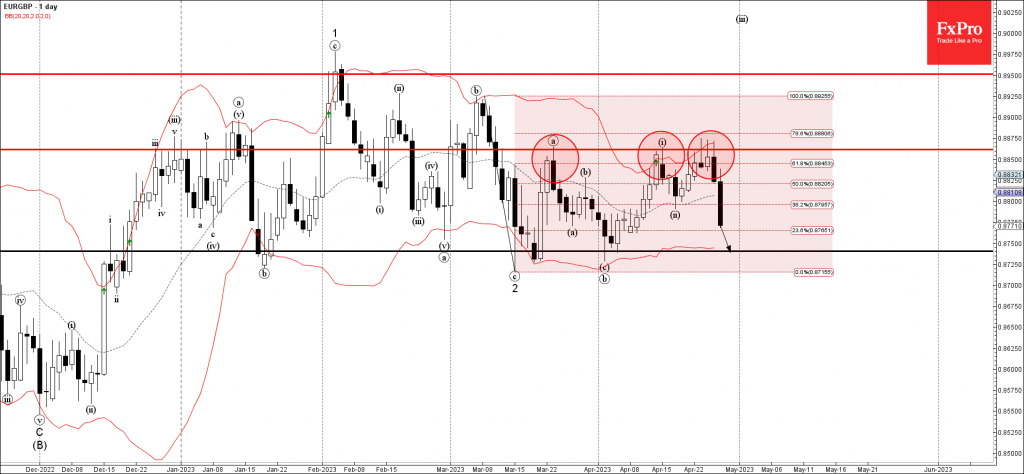
- EURGBP under bearish pressure
- Likely to fall to support level 0.8740
EURGBP falling strongly after the price reversed down from the key resistance level 0.8860 (which has been reversing the price from March) standing near the upper daily Bollinger Band.
The downward reversal from the resistance level 0.8860 created the daily candlesticks reversal pattern Bearish Engulfing.
EURGBP can be expected to fall further toward the next support level 0.8740 (which has been reversing the price from January).
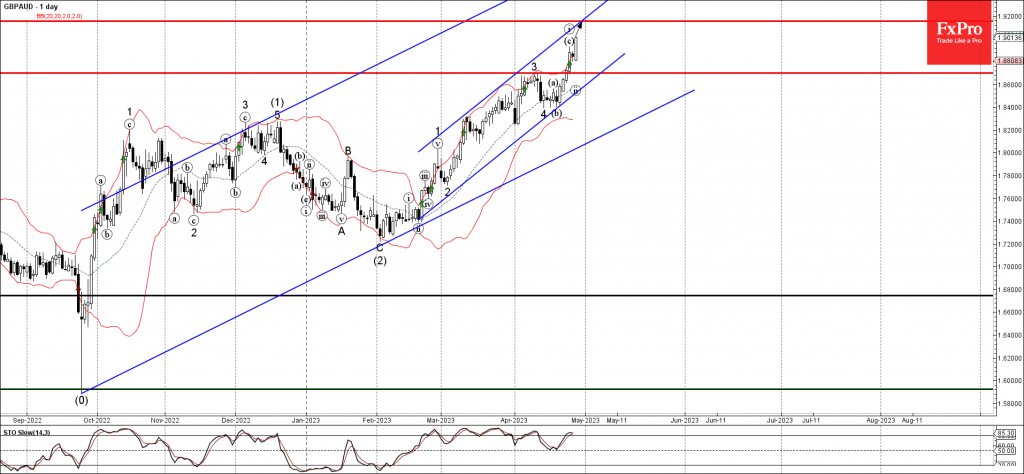
GBPAUD Wave Analysis
- GBPAUD under bullish pressure
- Likely to rise to resistance level 1.9200
GBPAUD under the bullish pressure after the price broke the resistance level 1.8700 (which stopped the previous impulse wave 3 at the start of April).
The breakout of the resistance level 1.8700 accelerated the active minor impulse wave 5 from the middle of this month.
Given the prevailing daily uptrend, GBPAUD can be expected to rise further toward the next resistance level 1.9200 (intersecting with the daily up channel from February).