

Sample Category Title
USD/JPY Daily Outlook
Daily Pivots: (S1) 131.94; (P) 132.66; (R1) 133.31; More...
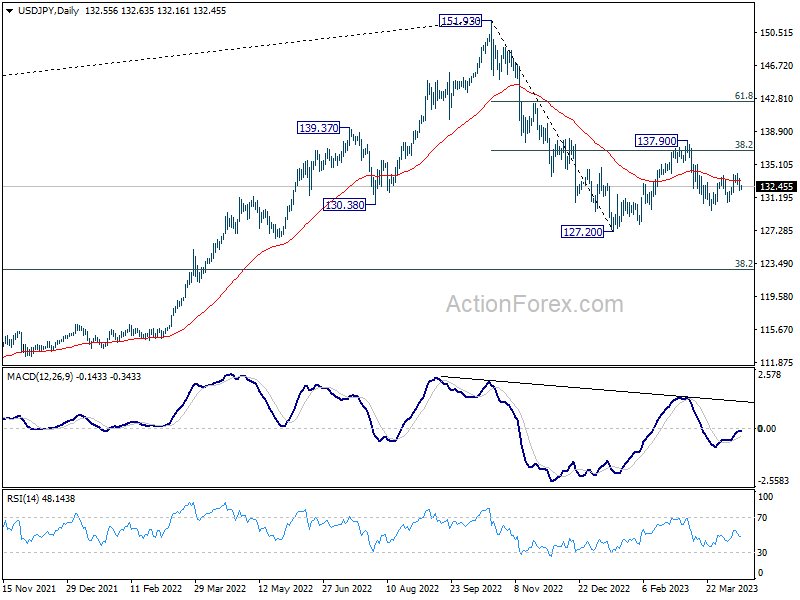
No change in USD/JPY's outlook as range trading continues. Intraday bias remains neutral for the moment. On the upside, break of 134.04 will resume the rebound from 129.62 towards 137.90 resistance again. On the downside, break of 130.62 should resume the fall from 137.90 through 129.62 to retest 127.20 low.
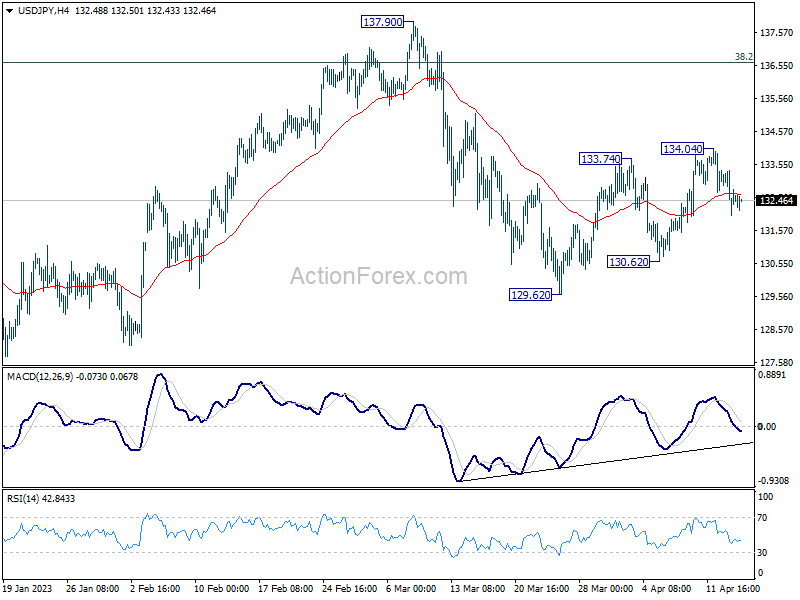
In the bigger picture, corrective pattern from 127.20 might be extending. But after all, down trend from 151.93 is expected to resume at a later stage. Break of 127.20 will resume this down trend and target 61.8% projection of 151.93 to 127.20 from 137.90 at 122.61. This will now be the favored case as long as 137.90 resistance holds.
AUD/USD Daily Report
Daily Pivots: (S1) 0.6713; (P) 0.6755; (R1) 0.6825; More...
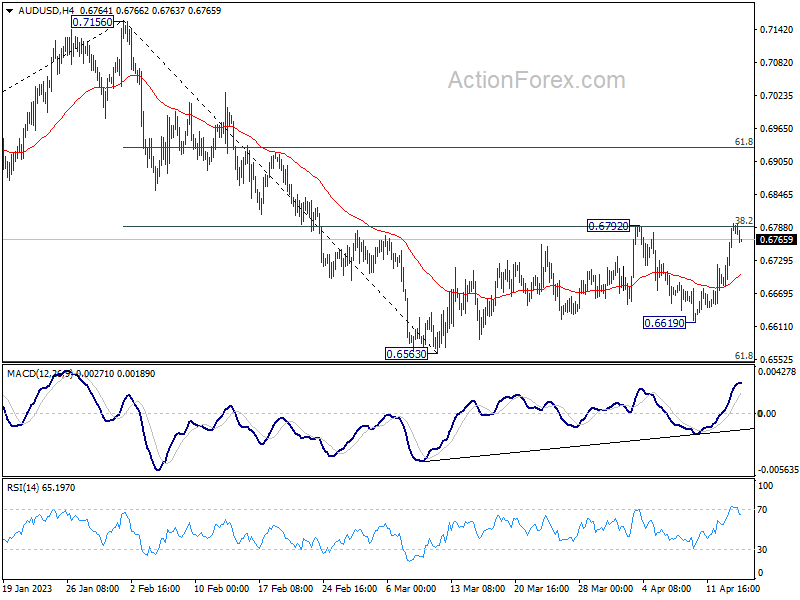
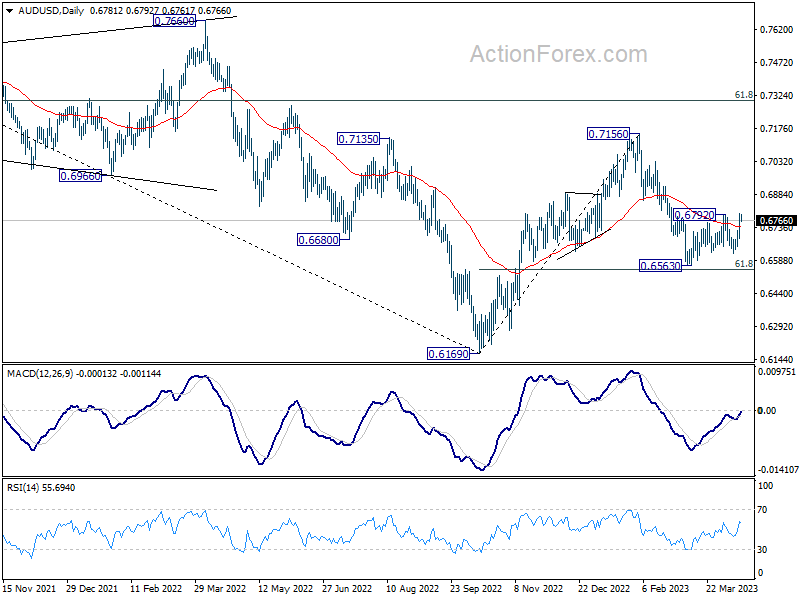
Immediate focus is now on 0.6792 resistance in AUD/USD. Decisive break there will resume the whole rebound from 0.6563 and target 0.7156 to 61.8% projection of 0.7156 to 0.6563 at 0.6929. Nevertheless, rejection by 0.6792 will maintain near term bearishness for another fall through 0.6563, to resume whole decline from 0.7156.
In the bigger picture, as long as 61.8% retracement of 0.6169 to 0.7156 at 0.6546 holds, the decline from 0.7156 is seen as a correction to rally from 0.6169 (2022 low) only. Another rise should still be seen through 0.7156 at a later stage. However, sustained break of 0.6546 will raise the chance of long term down trend resumption through 0.6169 low.
BTCUSD Elliott Wave: Forecasting The Rally From Intraday Equal Legs Area
Hello fellow traders. In this technical article we’re going to take a quick look at the Elliott Wave charts of Bitcoin BTCUSD . As our members know, BTCUSD is showing impulsive bullish structure in the cycle 15431 low. We have been calling for the rally in the cryptocurrency after 3 waves pull back. Our team recommended members to avoid selling Bitcoin , while keep favoring the long side. In the further text we are going to explain the Elliott Wave Forecast.
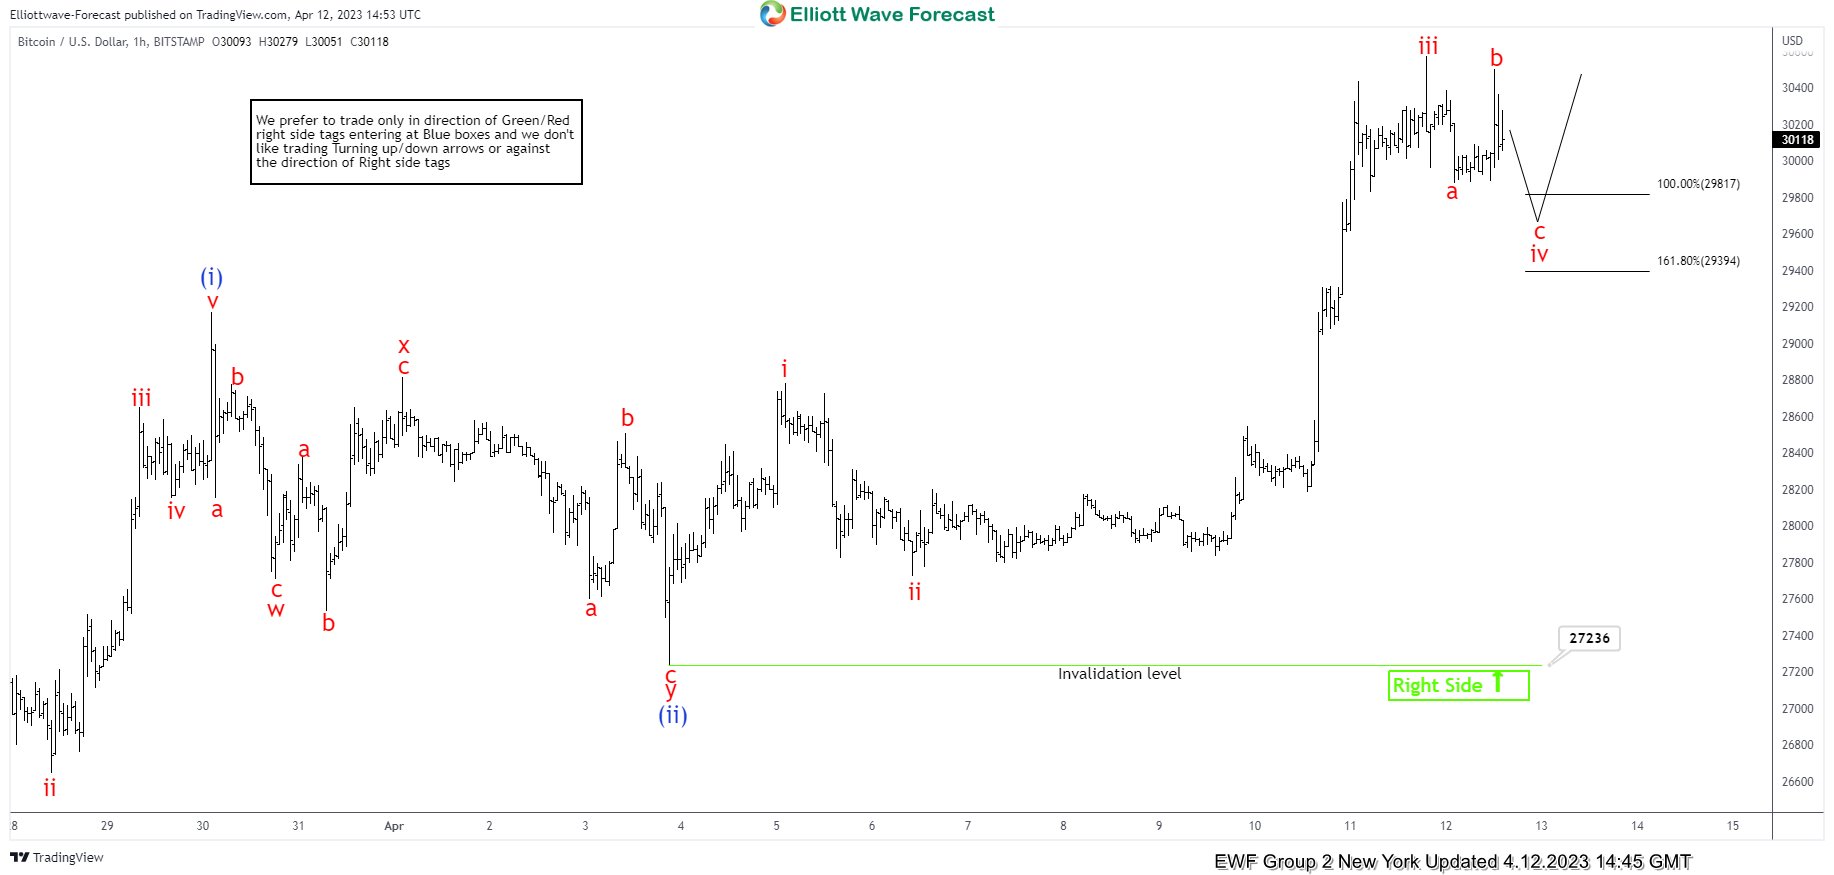
Bitcoin ( BTCUSD ) Elliott Wave 1 Hour Chart 4.12.2023
Cycle from the 27236 low looks impulsive, however as of right now we see only 3 waves up. We assume wave iv red pull back is still in progress. Once correction completes BTCUSD should ideally see another leg up to complete the proposed short term cycle as 5 waves. At the moment structure of the pull back looks incomplete. We are calling for another leg down toward 29817-29394 ( buyers area). We don’t recommend selling it and prefer the long side. The crypto is expected to find buyers in 3,7,11 swings. We expect to see at least 3 waves bounce from that zone or further rally toward new highs ideally.
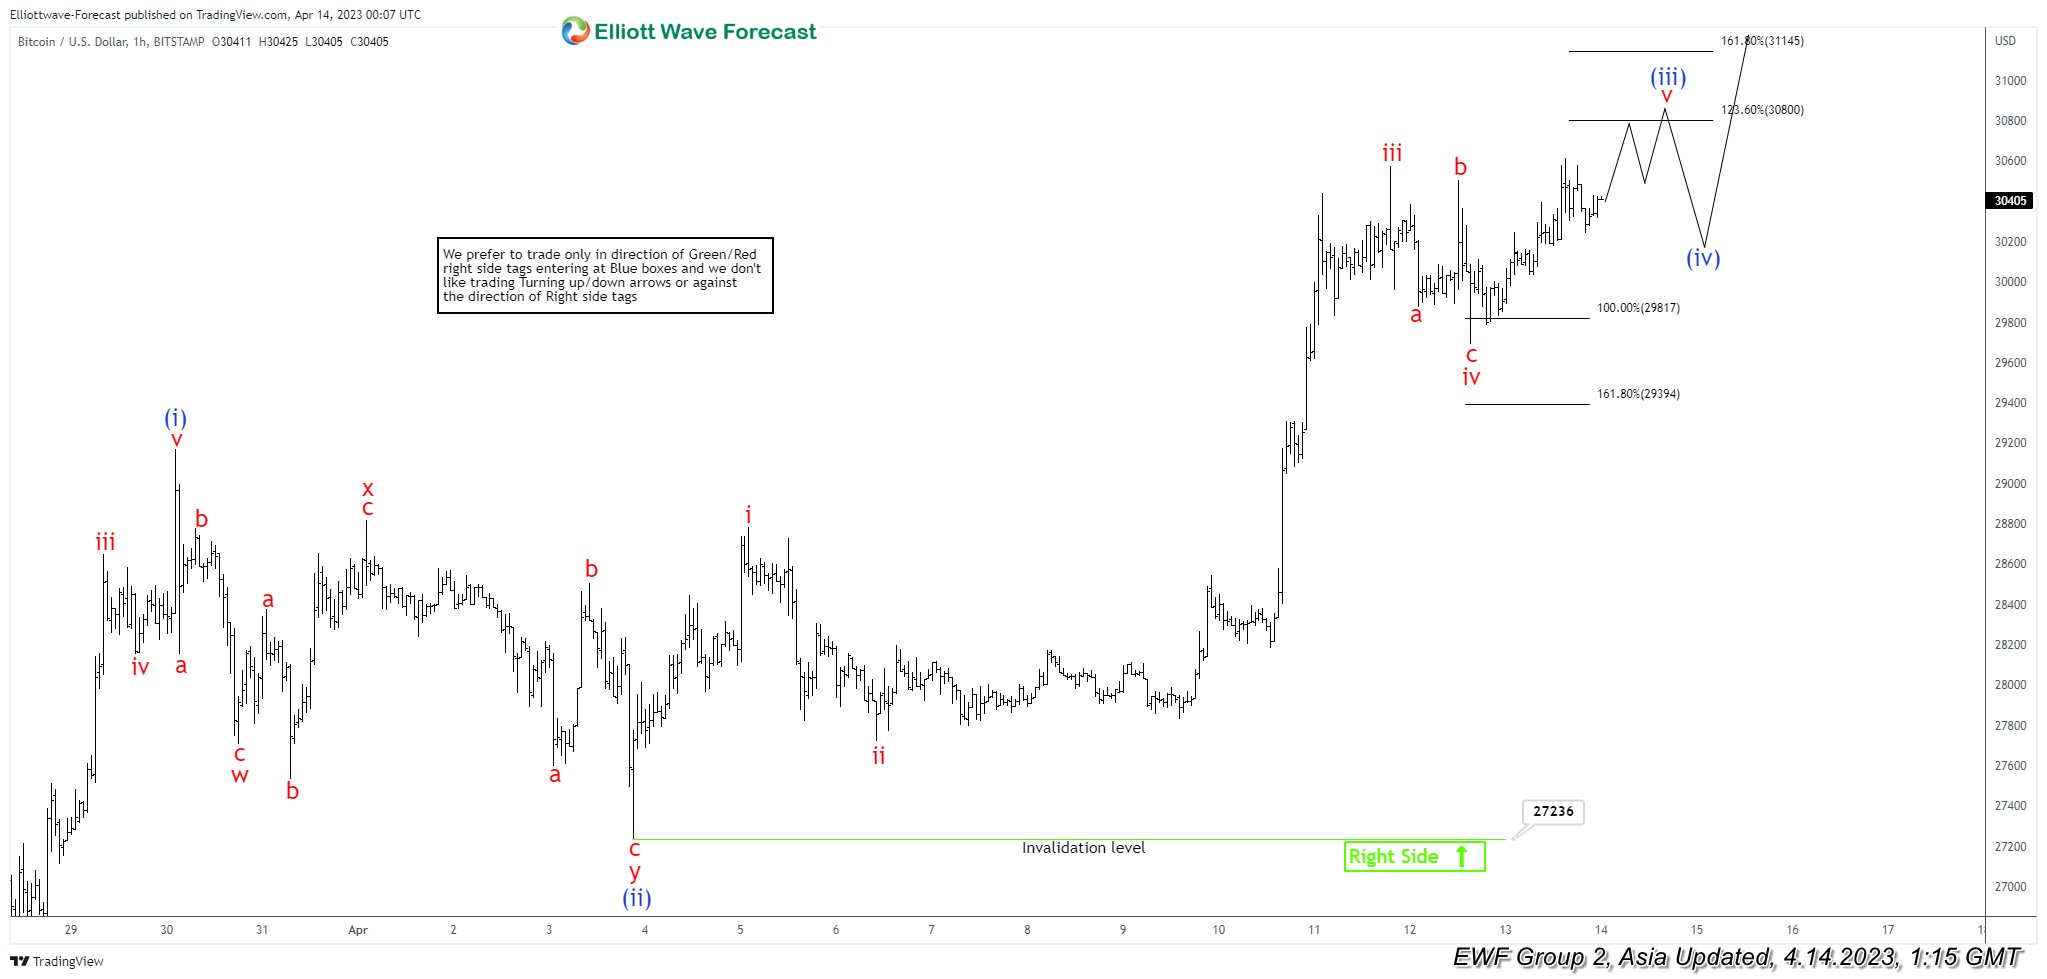
Bitcoin ( BTCUSD ) Elliott Wave 1 Hour Chart 4.14.2023
BTCUSD made the decline toward marked equal legs area : 29817-29394. Bitcoin found buyers and we are getting good reaction from there. It broke previous peak already, confirming v red of (iii) blue is in progress toward 30800-31145 area.
USD/JPY: Increased Downside Risk Under Daily Cloud
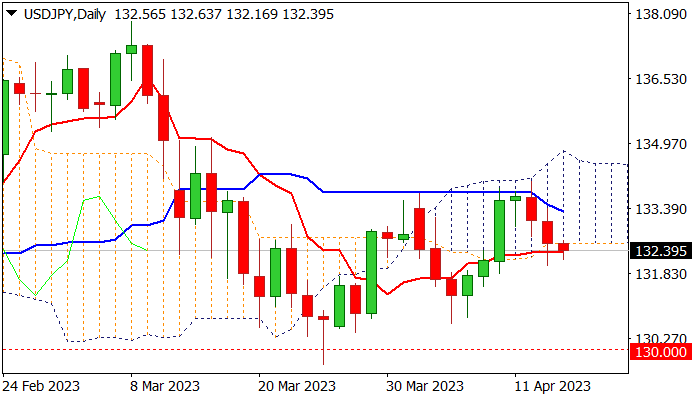
Near-term action holds in red for the third consecutive day, as bears regained control after a triple upside rejection at daily Ichimoku cloud top.
Today’s extension below daily cloud base (132.56) and daily Tenkan-sen (132.33) adds to downside risk, with close below these levels needed to confirm scenario.
South-heading indicators on daily chart and weekly momentum about to break into negative territory, contribute to negative near-term outlook, along with long upper shadow on weekly candle which also points to increased pressure.
Fundamentals are also negative for the dollar, as weaker than expected recent economic data suggest that the Fed may take a breather in hiking rates and also warn that economy may enter a mild recession.
Sustained break below daily cloud base would increase risk of retest of pivotal support at 130.62 (Apr 5 trough), loss of which will signal a double top at 133.80 zone and open way for acceleration through key supports at 130.00/129.64 (psychological / Mar 24 spike low).
Caution on repeated failure to clear daily cloud base which would sideline immediate downside risk but keep bears in play while the action stays below daily Kijun-sen (133.31).
Lift above 133.80 platform and daily cloud top will be a game changer.
Res: 133.06; 133.31; 133.80; 134.78.
Sup: 132.01; 131.30; 130.62; 130.00.
GBPJPY Storms to Fresh 3-Month High
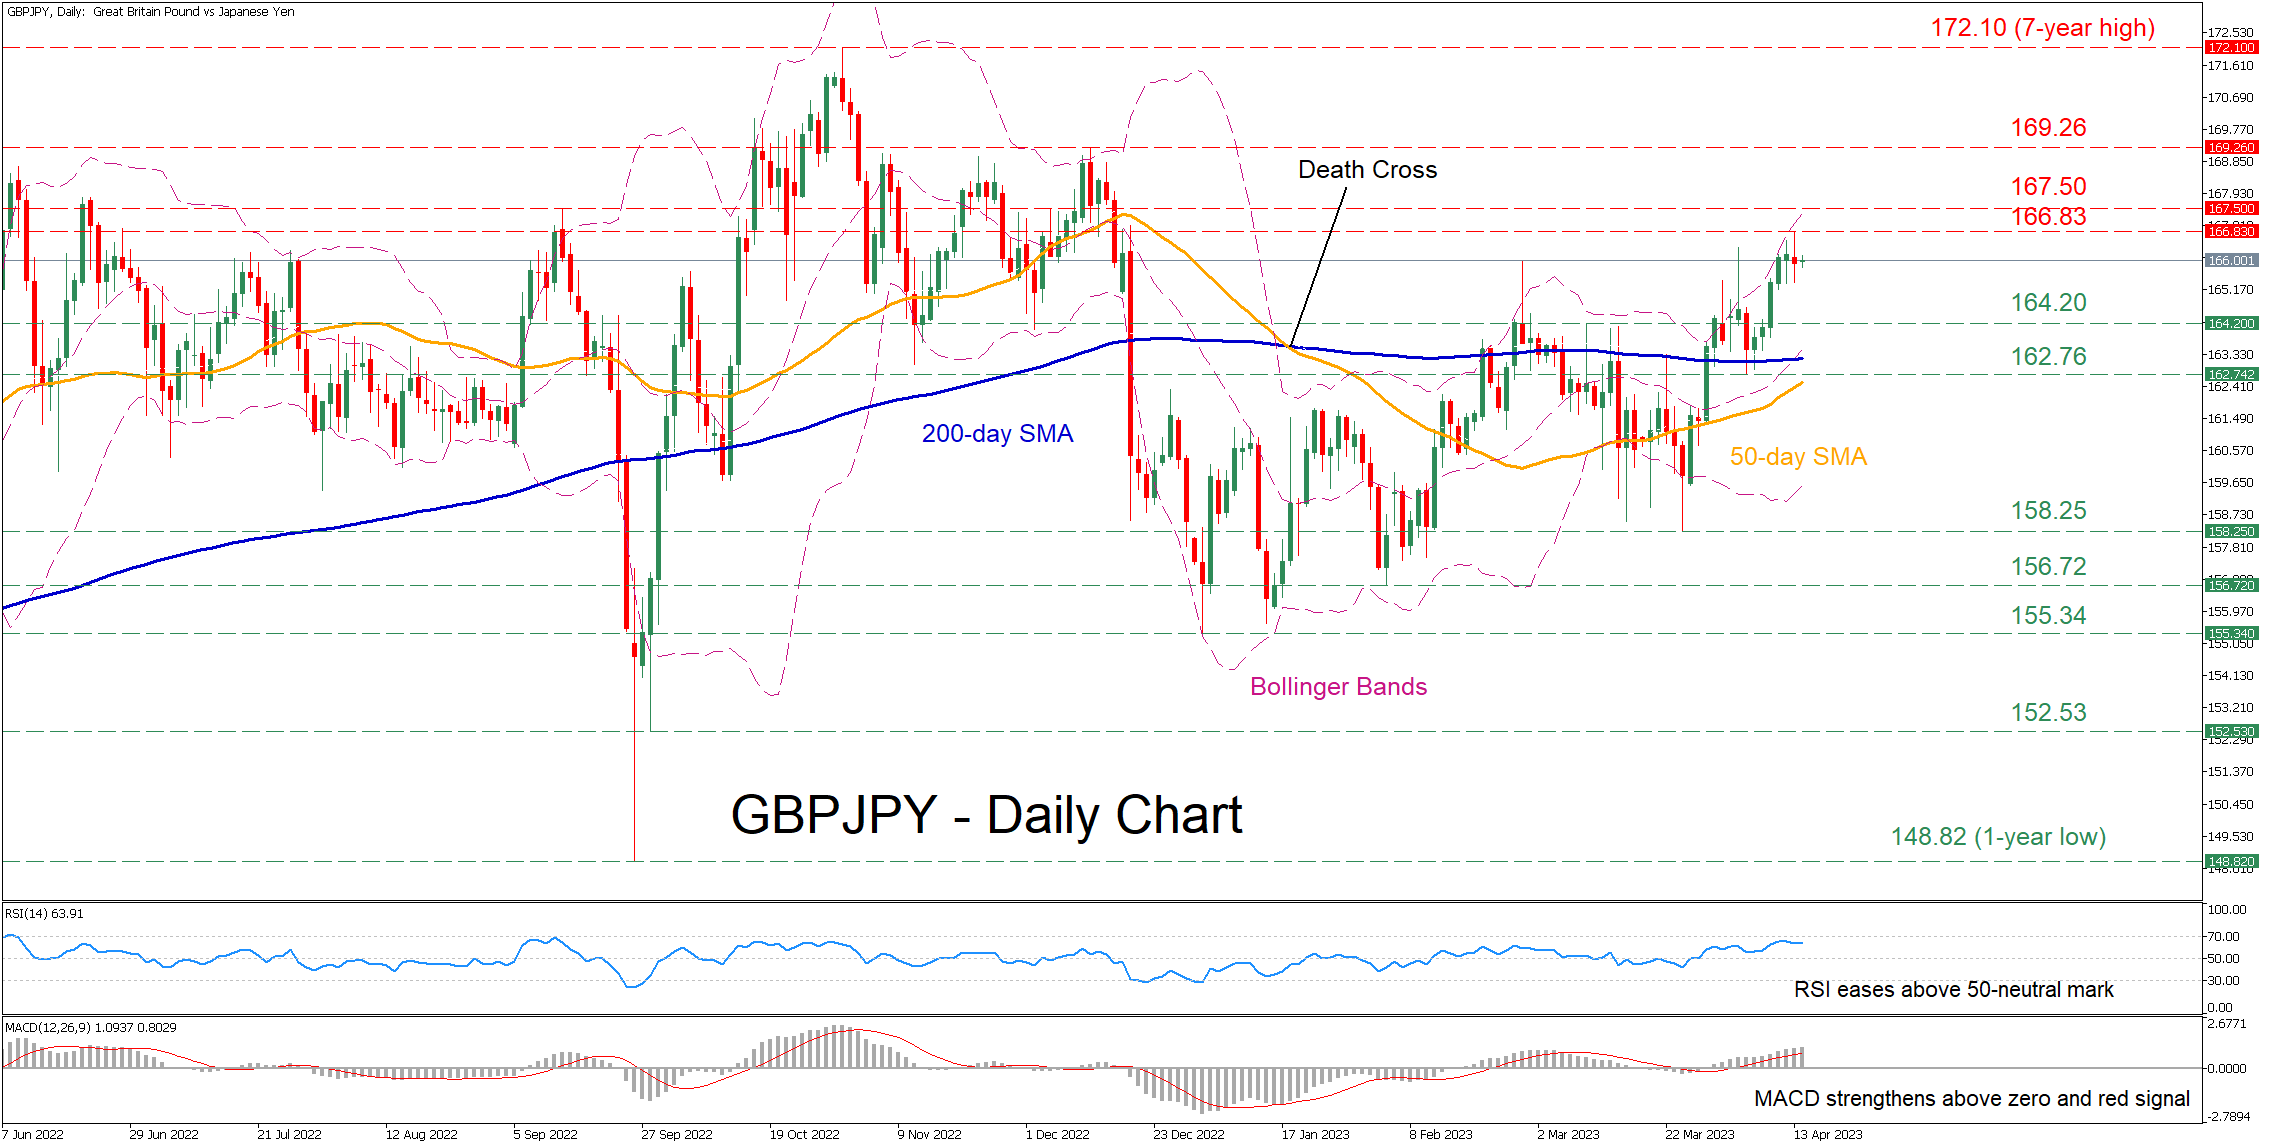
GBPJPY has been edging higher in the short term, posting a fresh three-month high of 167.50 on Thursday. Moreover, the ascending 50-day simple moving average (SMA) is positively closing the gap with the 200-day SMA, where a potential golden cross may help the pair extend its advance.
The momentum indicators are endorsing a bullish near-term bias. Specifically, the RSI has flatlined above its 50-neutral mark, while the MACD histogram is strengthening above both zero and its red signal line. However, the pair is currently trading near its upper Bollinger band, hinting that this recent rally might have reached overbought conditions.
If buying pressures persist, the bulls could initially attempt to propel the price above the recent three-month high of 166.83. Surpassing that zone, the pair could ascend towards the September peak of 167.50 or higher to challenge the December resistance zone of 169.26. A violation of the latter might open the door for the seven-year high of 172.10.
On the flipside, if the positive momentum fades and the price reverses lower, the 164.20 region, which previously served as resistance, could now act as support. Should that floor collapse, the price could test the April support of 162.76 before the March bottom of 158.25 appears on the radar. Further declines could then cease at the 156.72 hurdle.
In brief, GBPJPY has been exhibiting some strength lately, jumping to its highest levels since December 2022. Moving forward, the pair is likely to adopt a sideways pattern until the completion of a golden cross between its SMAs enables it to move even higher.
Ether Accelerates After the Hard Fork
Market Picture
The cryptocurrency’s market capitalisation rose 4.3% in the last 24 hours, hitting $1.29 trillion. Ether’s rally is successfully pulling most of the market with it.
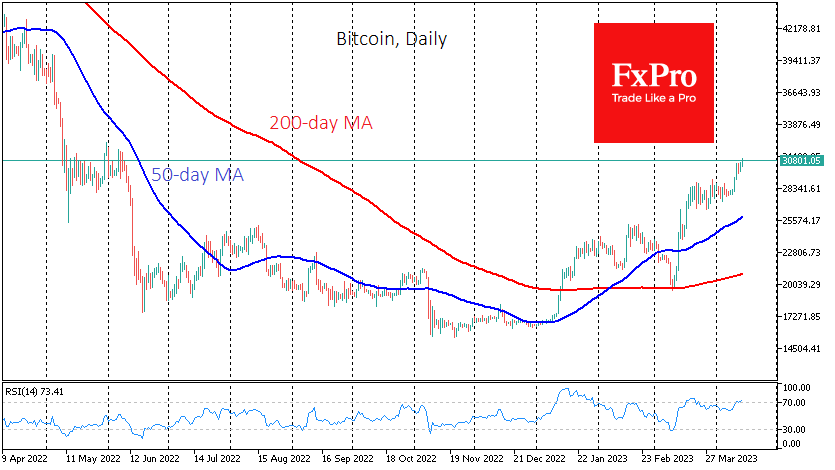
Bitcoin is up 2.4% overnight, underperforming the market but revisiting last June’s highs near $30.8K.
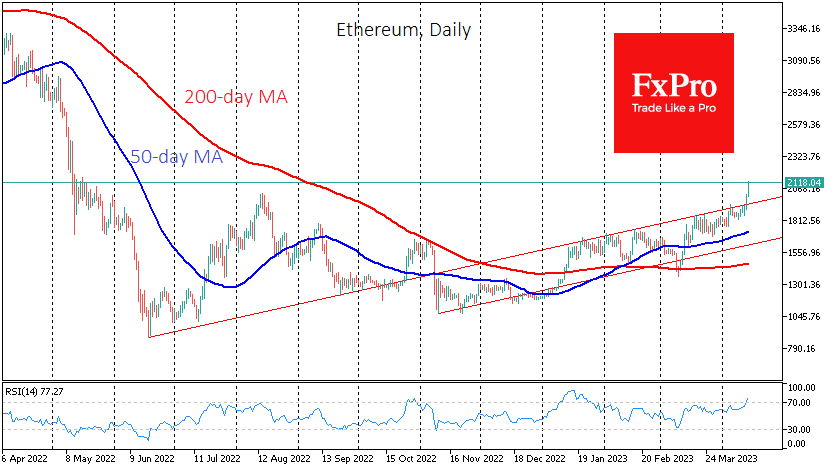
Ethereum is up more than 10% overnight, trading above $2100. This is its highest level since last May. The successful activation of the Shapella hard fork triggered the rally. The update was activated on the night of the 12th at 22:30 GMT, allowing withdrawal from the stacking. Contrary to fears, this did not pressure the ETH exchange rate but accelerated the upward trend in December.
According to Nansen, complete withdrawals are available for 7,948 validators with a total of 284,622 ETH (more than $546 million) in their balances. The total assets in the stack exceed 18 million ETH. However, 56% of the validators’ addresses need the 0x01 prefix required to unlock assets.
News background
Attorney John Deaton, who defends the interests of XRP cryptocurrency owners, believes that after the Ethereum network switches to the PoS consensus algorithm, officials may recognise ETH as security.
Web3 attorney Jess Hynes said that the SEC would continue to tighten regulation of cryptocurrencies in the US. In his opinion, such measures are still necessary to protect investors.
Warren Buffett, the famous investor and head of Berkshire Hathaway, once again criticised Bitcoin, calling it an asset with no intrinsic value and suitable for gamblers.
Elliott Wave Analysis: Lower Inflation Boosts Stocks and EUR/USD Upside Potential
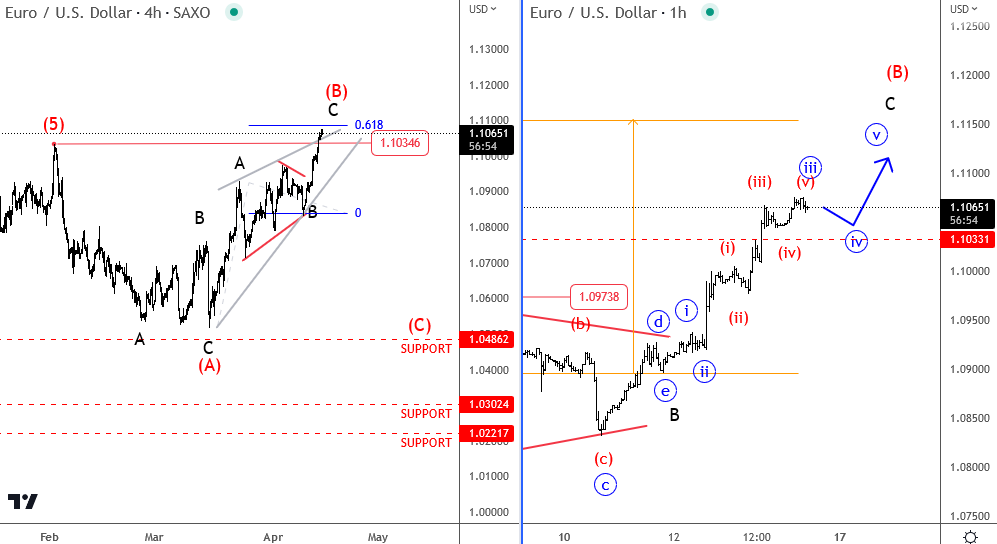
PPI figures fell in the US as reported yesterday so lower inflation helped stocks to found buyers while USD is coming down. However, US yields are not that volatile yet, mostly just sideways. But as long as stocks are up, USD can be headed even lower, especially vs the EUR where higher rates can still be needed to bring down inflation. Looking at the EURUSD pair, we see it trading at new 2023 highs. possibly still in C wave but with room for more upside to complete a five wave rise from 1.090, possibly near 1.11-1.1150 area. Any drop back below 1.0973 can be an indication for a temporary top.
DAX is bullish, but approaching to fifth wave resistance
Gold Price Inches Higher While WTI Crude Oil Aims Fresh Increase
Gold price is rising and trading above the $2,030 resistance. WTI is consolidating and might aim for a fresh increase above $83.25.
Important Takeaways for Gold and Oil
- Gold price started a fresh increase above the $2,020 resistance against the US Dollar.
- A key bullish trend line is forming with support near $2,030 on the hourly chart of gold at FXOpen.
- Crude oil price also gained pace and was able to climb above the $82.00 resistance.
- There is a key contracting triangle forming with support near $82.00 on the hourly chart of XTI/USD at FXOpen.
Gold Price Technical Analysis
On the hourly chart of gold at FXOpen, the price formed a base above the $1,990 support zone against the US Dollar. The price started a decent increase and was able to clear the $2,000 resistance zone.
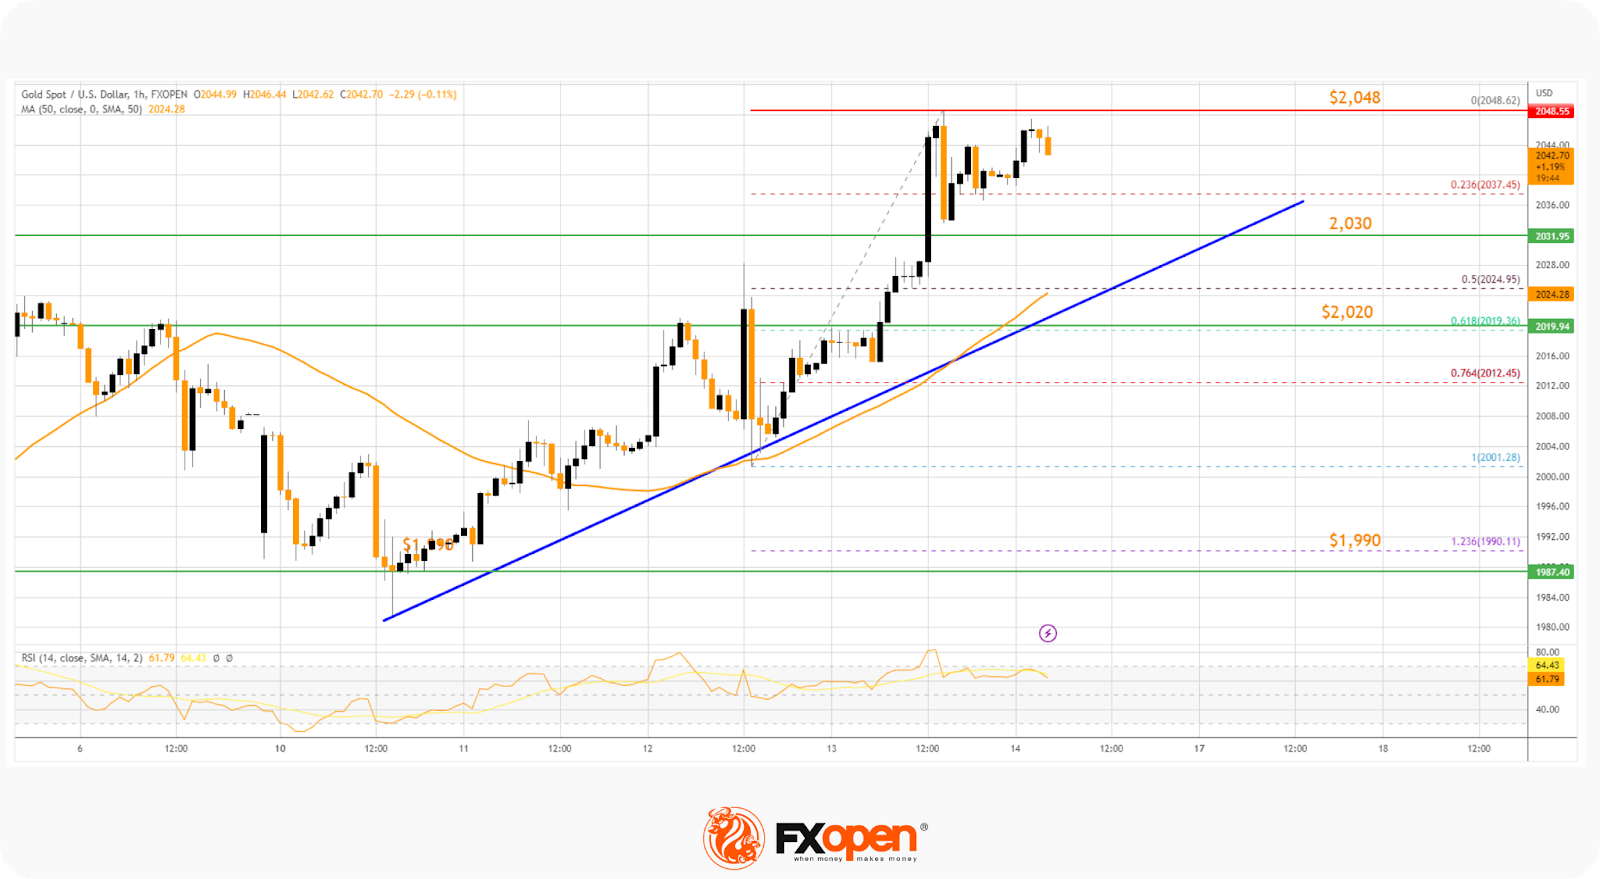
The upward move gained pace above the $2,020 and $2,030 resistance levels. Finally, the bears appeared near $2,050. A high is formed at $2,048, and the price is now consolidating gains.
Initial support on the downside is near the 23.6% Fib retracement level of the recent increase from the $2,001 swing low to the $2,048 high. The first major support is forming near a key bullish trend line at $2,030.
If there is a downside break below the trend line, the price might slide toward the 50-hour simple moving average at $2,025. The next major support is near the 61.8% Fib retracement level of the recent increase from the $2,001 swing low to the $2,048 high at $2,020.
On the upside, the bulls are facing resistance near $2,048. An upside break above the $2,048 resistance could send the price toward $2,060. Any more gains may perhaps set the pace for an increase toward the $2,080 level.
Oil Price Technical Analysis
On the hourly chart of XTI/USD at FXOpen, the price gained pace above the $81.00 resistance zone against the US Dollar. The price climbed above the $82.00 resistance to move into a positive zone.
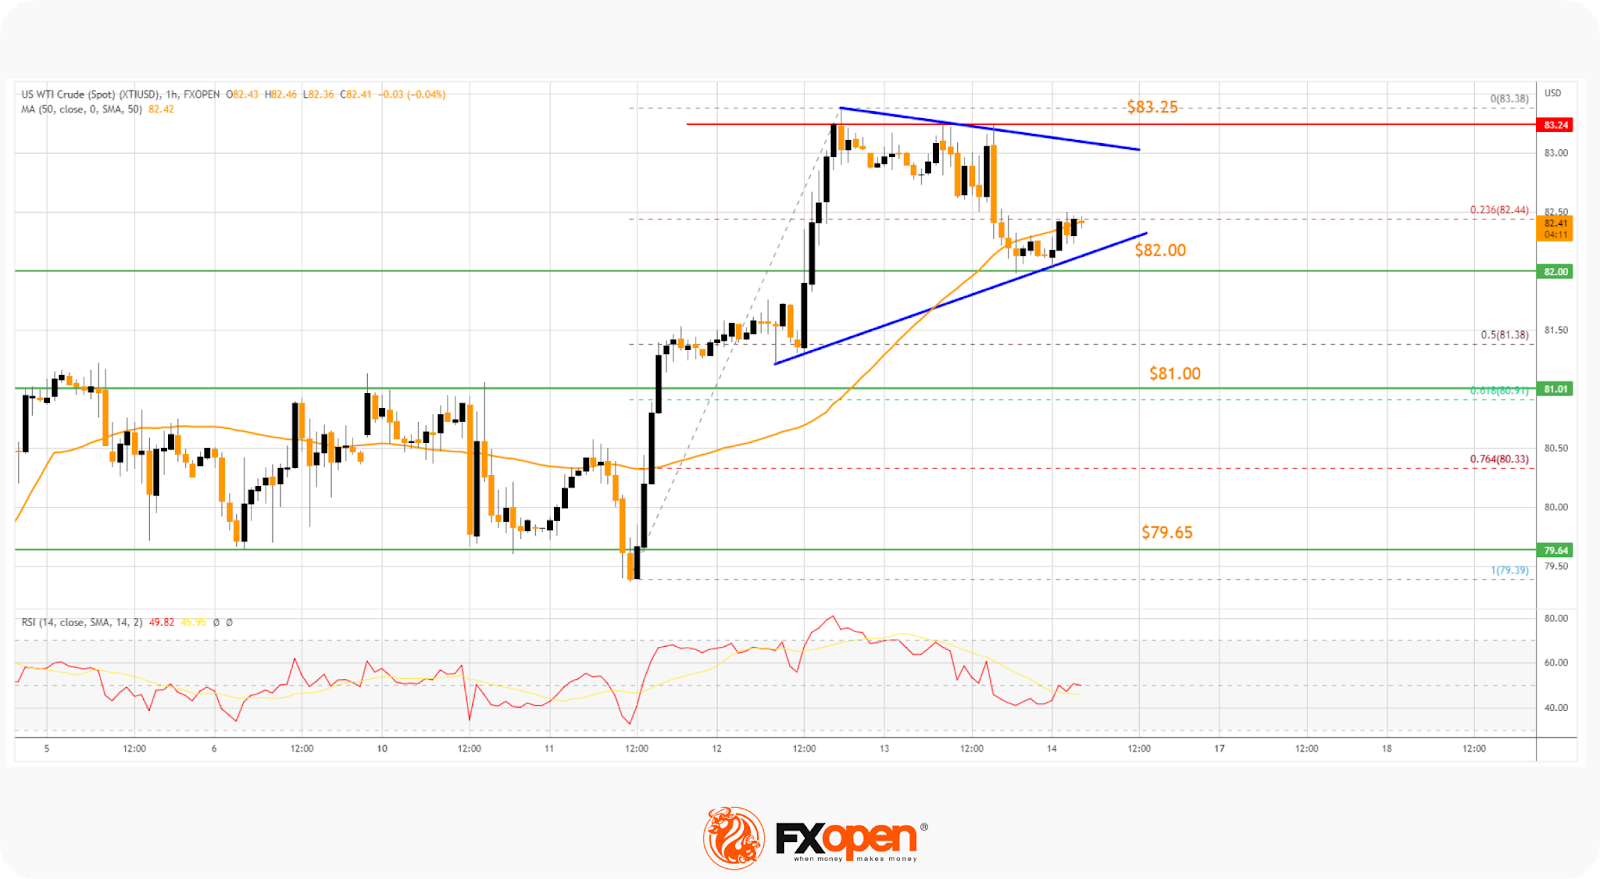
A high was formed near $83.83 before the price corrected lower. There was a move below the 23.6% Fib retracement level of the upward move from the $79.39 swing low to the $83.38 high. However, the bulls were active near the $82.00 support.
The price is now trading near the 50-hour simple moving average at $82.45. There is also a key contracting triangle forming with support near $82.00.
On the upside, resistance is seen near the triangle’s upper trend line at $83.00. The first major resistance is near the $83.25 level, above which the price might accelerate higher toward $84.20 or even $85.00. Any more gains might send the price toward the $86.50 level in the coming sessions.
On the downside, support is near the $82.00 level. The next major support is near the 61.8% Fib retracement level of the upward move from the $79.39 swing low to the $83.38 high at $81.00.
If there is a downside break, the price might decline toward $79.65. Any more losses may perhaps open the doors for a move toward the $75.00 support zone.
EUR/USD Technical Analysis
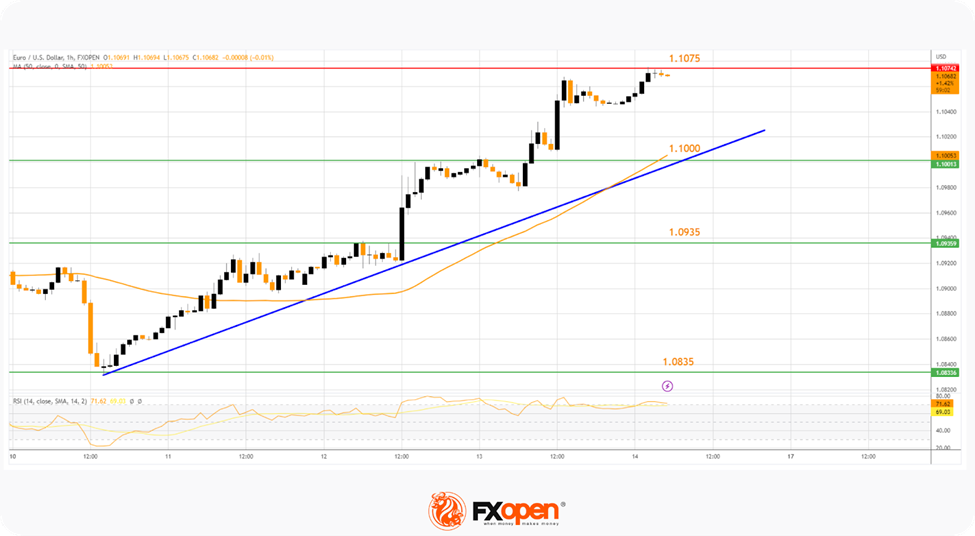
On the hourly chart at FXOpen, the Euro started a fresh increase from the 1.0835 support zone against the US Dollar. The EUR/USD pair climbed above the 1.0935 resistance to move into a bullish zone.
The pair settled above the 50-hour simple moving average at 1.1000. It is now showing positive signs and consolidating in a tight range. On the upside, immediate resistance is near the 1.1075 level.
The next major resistance is near the 1.1120 level. A break above the 1.1120 resistance zone could spark another strong increase. In the stated case, it could rise toward the 1.1200 resistance.
Conversely, the pair might start a downside correction from 1.1075. Initial support is near 1.1000, coinciding with the 50-hour simple moving average and a connecting bullish trend line. Any more losses might send the pair towards 1.0935 in the near term.
Cliff Notes: Constructive Developments for the Consumer
Key insights from the week that was.
Developments in Australia and the US this week were supportive of our views for the RBA and the FOMC.
The Westpac-MI Consumer Sentiment survey delivered a positive update on confidence. The RBA’s decision to leave the cash rate unchanged in April proved to be a major support, resulting in the headline index surging 9.4% in the month, up from 78.5 to 85.8. This is also highlighted not only by the upswing across the survey’s housing sub-indexes – confidence among mortgage holders up 12.2%; the ‘time to buy a dwelling’ index up 8.2%; and house price expectations up 16.7% – but also by the broader recovery in household’s expectations around the near-term economic outlook and family finances. While these developments certainly mark a clear improvement from the deeply pessimistic reads observed over February and March – a situation that was only comparable to the major economic dislocations in the 1980s-90s – at 85.8, the headline index is still characterised as being in weak territory.
As discussed by Chief Economist Bill Evans, survey evidence from prior tightening cycles suggests that upon more convincing evidence that the RBA Board will pause policy for a sustained period, there is greater scope for Consumer Sentiment to return towards more normal levels. For now, consumers remain circumspect around whether the RBA’s April pause will last; a view which we share, as we continue to forecast one final 25bp rate hike at the May Board meeting.
The March labour force survey is also consistent with our view, delivering an upside surprise. The lift in the participation rate (up 0.9ppt to 66.74%) saw the labour force grow by 51.4k, broadly matching the gain in employment of 53.0k. The labour market remains extremely tight, with the unemployment rate surprising to the low side for a second consecutive month, unchanged at a near-50 year low of 3.5%. The employment-to-population ratio rose to a near-record high of 64.4%. Overall, the update confirmed that businesses’ appetite for new workers remains robust, and with continued gains in labour supply growth – as also evinced by the underlying strength in overseas arrivals – labour force outcomes have been able to remain sound and above expectations at this stage of the cycle.
Before moving offshore, a quick note on businesses. The latest NAB business survey provided further evidence of: an economy operating at a high level of capacity; an economic slowdown over the past half year; and a fragile and pessimistic mood amongst businesses. The business conditions index declined once again, falling by 1pt to +16 in March, well down from around +24 last September and reflective of the loss of momentum within the Australian economy as a consequence of high inflation and rapid interest rate rises. Having lifted 3pts to a still subdued -1, the business confidence index may receive some further reprieve from the RBA’s decision to pause in the April survey; however, the greater concern for businesses is the downbeat outlook for domestic demand and the fragile and volatile global economy.
Turning to the US, two key data reports were released this week. Non-farm payrolls data indicated that 236k jobs were created in March (219k net of revisions to the prior two months), providing a benign read on the health of the labour market – strong enough to limit concern over imminent recession, soft enough to ward off concern over additional inflation pressures. While household employment rose by a much larger 577k in March, this outsized gain only partly offsets the persistent relative weakness in household employment versus payrolls over the past year. Also notable was that the participation rate continues to rise, the increase in the labour force offsetting 480k of the 577k jobs created in the month. Offering further support to the idea that labour demand and supply are now close to balanced, hourly earnings rose by a modest 0.3% in the month, and weekly hours worked edged down by another 0.1hrs to be 0.3hrs lower than a year ago. It is also worth emphasising that the ISMs are pointing to a continued downtrend in job creation which, given the uncertainties around the banking system, is likely to gather pace over the coming months.
On the March CPI report, core inflation (excluding food and energy) was in line with expectations, the 0.4% monthly gain nudging the annual rate slightly higher to 5.6%. The main reason for the ‘stickiness’ in the core measure is due to shelter inflation, which is being held up by the cost of short-term accommodation (2.7%). For the policy outlook, this is not a concern as all leading indicators of rents point to an abrupt deceleration ahead. The remaining detail was also constructive. Other segments of core services – besides shelter – is showing promising signs, with annual inflation across transportation, medical care and recreation all continuing to decelerate. Positively for households, energy prices posted a larger-than-expected decline of 3.5% and grocery prices fell by 0.3%, resulting in headline inflation coming in below expectations at 0.1% in the month.
For the FOMC, these updates provide a balanced look into the progress on inflation and underlying pressures within the economy. We continue to believe that the prudent path for policy is to allow inflation to continue its deceleration without raising the risk of materially weaker growth. With the fed funds rate already at a heavily contractionary 4.875%, policy should remain on hold over 2023 before interest rates can be brought back near neutral over 2024 and 2025, allowing growth to slowly accelerate back towards trend.