Sample Category Title
LTCUSD: Wave ((iv)) Found Buyers At Equal Legs Area
Hello Traders in this article we will go through LTCUSD. Litecoin has been trading higher within a cycle from 03.11.2023. After it completed wave ((iii)) higher from that cycle within it’s wave ((iv)) pullback it found buyers within equal legs area.
Here at Elliott Wave Forecast we have developed a system that allow us to spot areas of the market in which we can expect a reaction in favor of the current trend or minimum a 3 waves reaction. This way we are able to enter the market with a defined risk and entry, alongside with a target area.
In the case of Litecoin we had completed the first leg lower in (a) and connector bounce in (b) of ((iv)) and we were able then to project the area of (c) of ((iv)). This is what we call equal legs area. From there we expect buyers to enter for wave ((v)) higher or produce a minimum of 3 waves reaction higher at least. Let’s have a look on LTCUSD 1 hour cycle from 03.28.2023.
LTCUSD 1 hour London update 03.28.2023
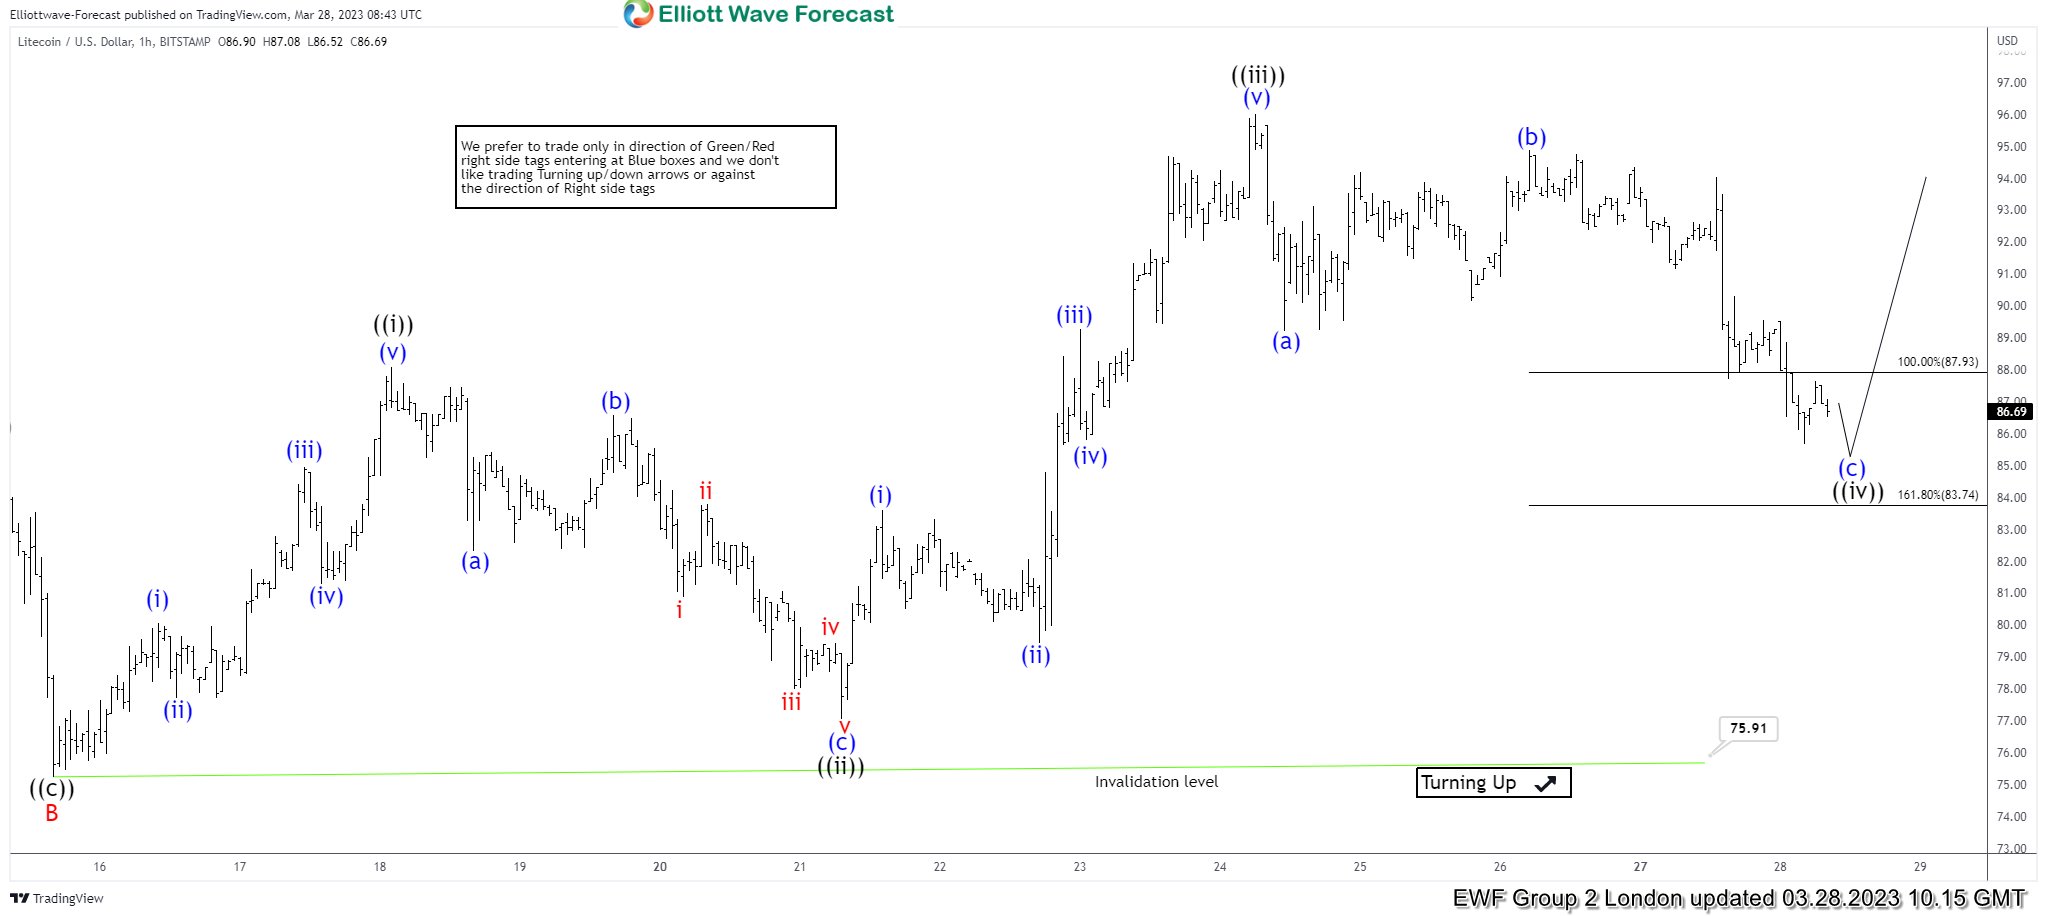
As we can see it has entered the equal legs area 87.93 – 83.74 within wave (c) of ((iv)). From that area we expected a reaction higher within wave ((v)) or minimum 3 waves reaction higher.
Let’s fast forward now to the 1 hour London update from 04.11.2023 to see what ended up happening.
LTCUSD 1 hour London update 04.11.2023
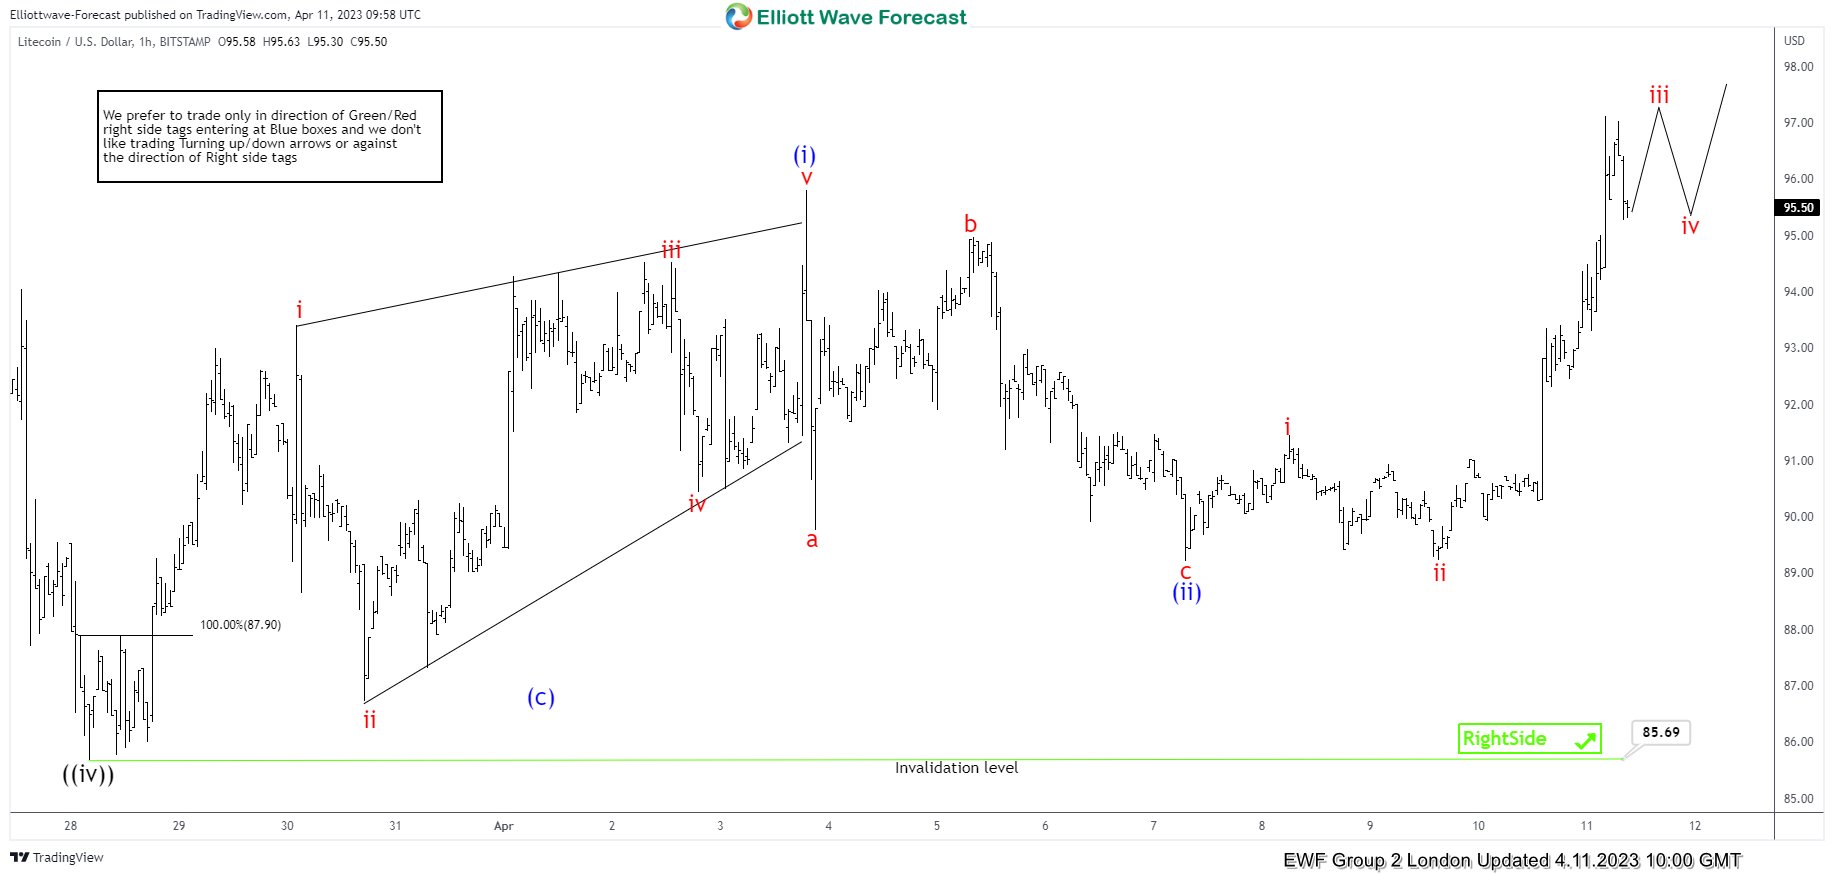
From the low of 85.69 Litecoin has traded higher into wave (i), completed pullback in wave (ii) and extending higher in wave iii of (iii). We can soon expect it to end wave (iii) pullback in (Iv) before it makes one more high into (v). Consequently this will be ending wave ((v)) and cycle from 03.11.2023. You can learn what’s next for Litecoin amongst other cryptocurrencies such as Bitcoin, Ethereum, Cardano, Matic & Dogecoin by becoming a member. Cryptos belong to our Group 2 instruments.
GBP/USD: Bulls Remain in Play after Markets Digested UK GDP Data
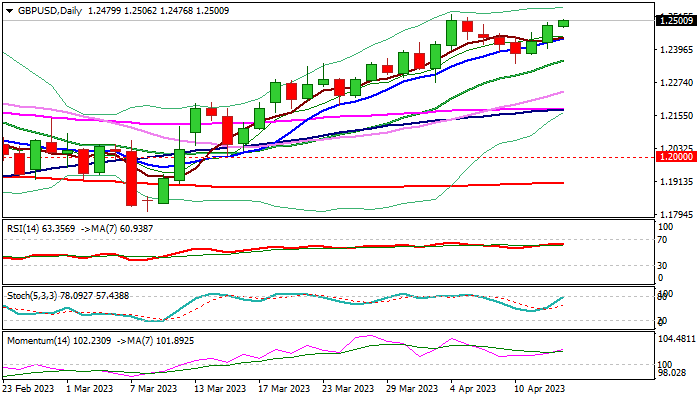
Cable remains firm and probing through psychological 1.2500 barrier in early European trading on Thursday, as markets digested UK data.
UK economic growth was flat in February, against expectations for a minimal expansion by 0.1%, but immediate negative impact was offset by upward revision of January’s figure to 0.4% from 0.3%, which offered fresh support after the pound was lifted by Wednesday’s US CPI below expectations.
The action is underpinned by rising positive momentum and moving averages in full bullish setup on daily chart and extending strong advance from past two days.
Bulls eye key barrier at 1.2525 (2023 high, posted on Apr 4), break of which would open way towards net target at 1.2759 (Fibo 61.8% of 1.4249/1.0348 downtrend).
Confirmation of higher low at 1.2343 (Apr 10) adds to bullish outlook, though bulls may face headwinds at 1.2525 target as stochastic is about to enter overbought territory on daily chart.
Potential dips are expected to offer better buying opportunities and should be ideally contained by rising 10DMA (1.2434).
Caution on sustained break below rising 20DMA (1.2346) which would sideline immediate bulls.
Res: 1.2525; 1.2600; 1.2694; 1.2759.
Sup: 1.2476; 1.2443; 1.2346; 1.2274.
AUD/USD: Extends Recovery after Solid Australian Jobs Data
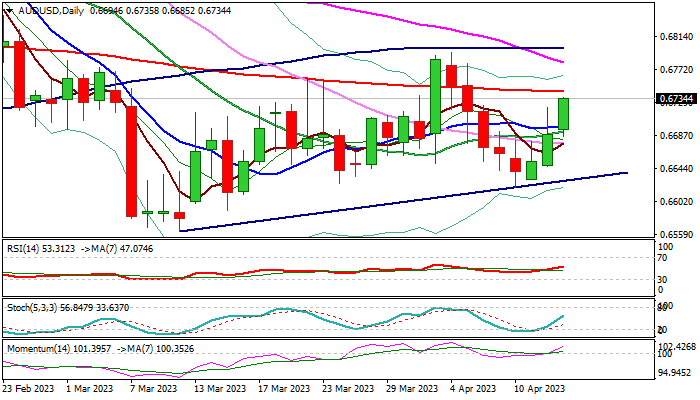
Australian dollar extends rally into third straight day, supported by better than expected Australia’s jobs data in March, which adds to bullish sentiment, boosted by Wednesday’s below expectations US CPI data.
Fresh advance cracks Fibo 61.8% retracement of 0.6793/0.6619 pullback and contribute to signals of higher low at 0.6619, though the action faces another significant obstacle at 0.6743 (200DMA).
Sustained break here is needed to reinforce near-term bullish structure for test of the base of thick daily cloud (0.6769), where bulls may face increased headwinds on the way to full retracement of 0.6793/0.6619 bear-leg.
Technical studies on daily chart are improving (moving averages 10/20/30 turned to bullish setup and 14-d momentum is heading north after returning to positive territory) and support the action.
Today’s close above broken daily Tenkan-sen (0.6706) is needed to keep bulls in play.
Res: 0.6743; 0.6769; 0.6779; 0.6793.
Sup: 0.6726; 0.6706; 0.6678; 0.6660.
EUR/USD Daily Outlook
Daily Pivots: (S1) 1.0935; (P) 1.0968; (R1) 1.1024; More...
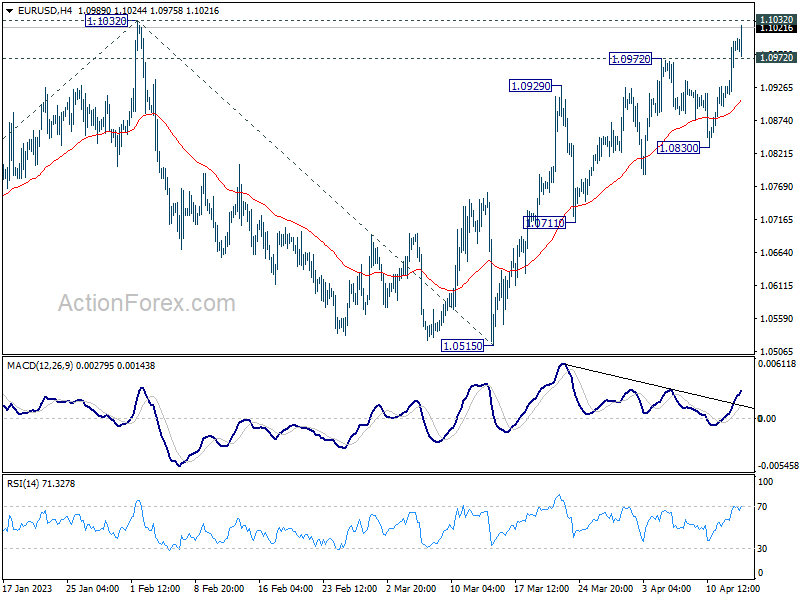
Intraday bias in EUR/USD remains on the upside with focus now on 1.1032 resistance. Decisive break there will resume larger up trend from 0.9534 to 1.1273 fibonacci level. On the downside, break of 1.0972 minor support will turn intraday bias neutral first. Further break of 1.0830 support will now indicate rejection by 1.1032, and turn bias back to the downside for 1.0711 support and below.
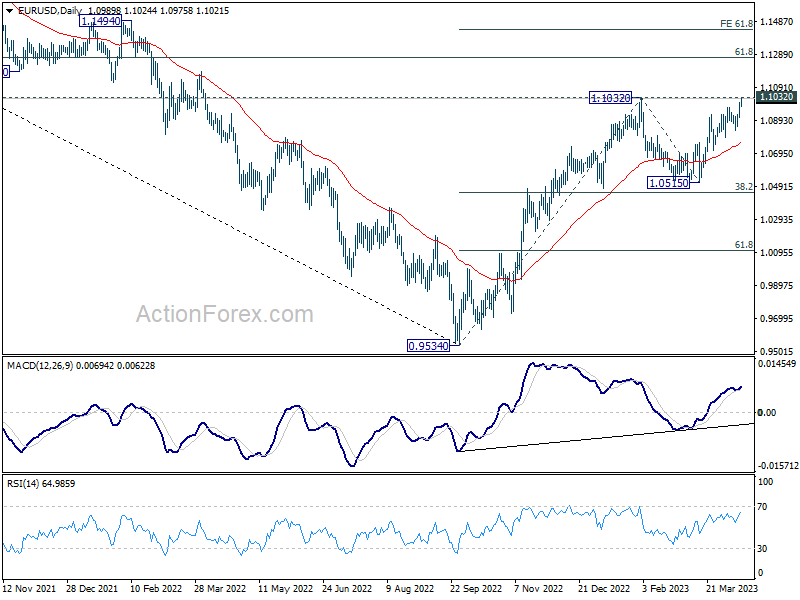
In the bigger picture, rise from 0.9534 (2022 low) is in progress with 38.2% retracement of 0.9534 to 1.1032 at 1.0460 intact. The strong support from 55 week EMA (now at 1.0625) was also a medium term bullish sign. Next target is 61.8% retracement of 1.2348 (2021 high) to 0.9534 at 1.1273. Sustained break there will solidify the case of bullish trend reversal and target 1.2348 resistance next (2021 high).
GBP/USD Daily Outlook
Daily Pivots: (S1) 1.2424; (P) 1.2459; (R1) 1.2520; More...
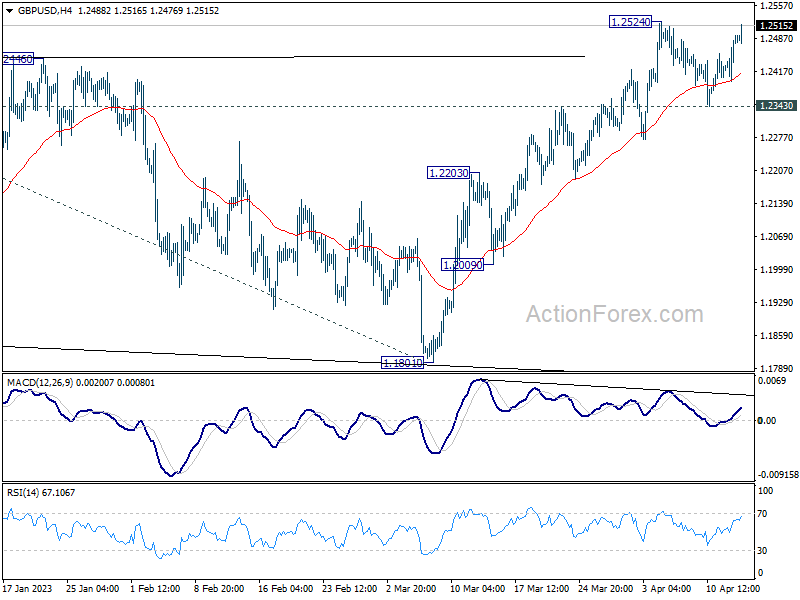
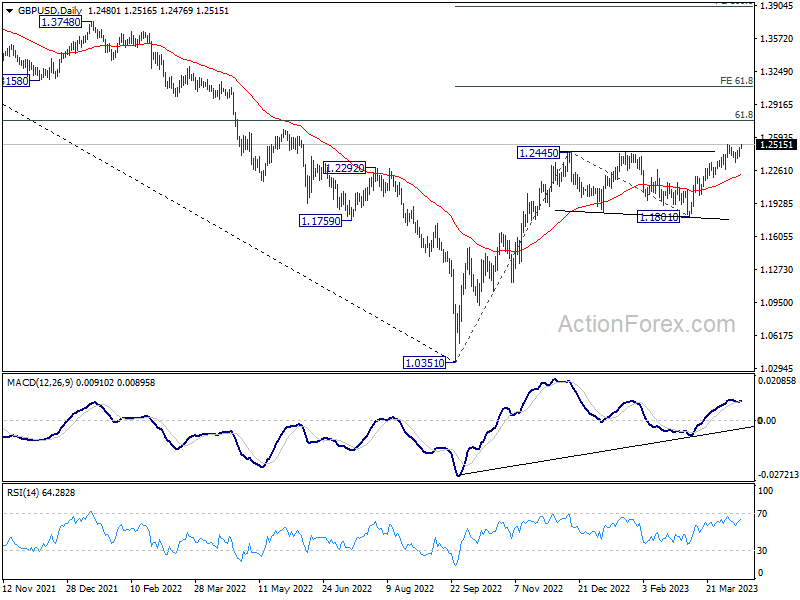
Immediate focus is now back on 1.2524 resistance as GBP/USD's rebound extends today. Decisive break there will resume larger up trend to 1.2759 fibonacci level first. Firm break there will target 61.8% projection of 1.0351 to 1.2445 from 1.1801 at 1.3095. Rejection by 1.2524 will bring more corrective trading first. But outlook will remain bullish as long as 1.2343 support holds.
In the bigger picture, the rise from 1.0351 medium term term bottom (2022 low) is in progress for 61.8% retracement of 1.4248 (2021 high) to 1.0351 at 1.2759. Sustained break there will add to the case of long term bullish trend reversal. Further break of 61.8% projection of 1.0351 to 1.2445 from 1.1801 at 1.3095 could prompt upside acceleration to 100% projection at 1.3895. For now, this will remain the favored case as long as 1.1801 support holds, even in case of deep pull back.
USD/CHF Daily Outlook
Daily Pivots: (S1) 0.9006; (P) 0.9055; (R1) 0.9081; More...
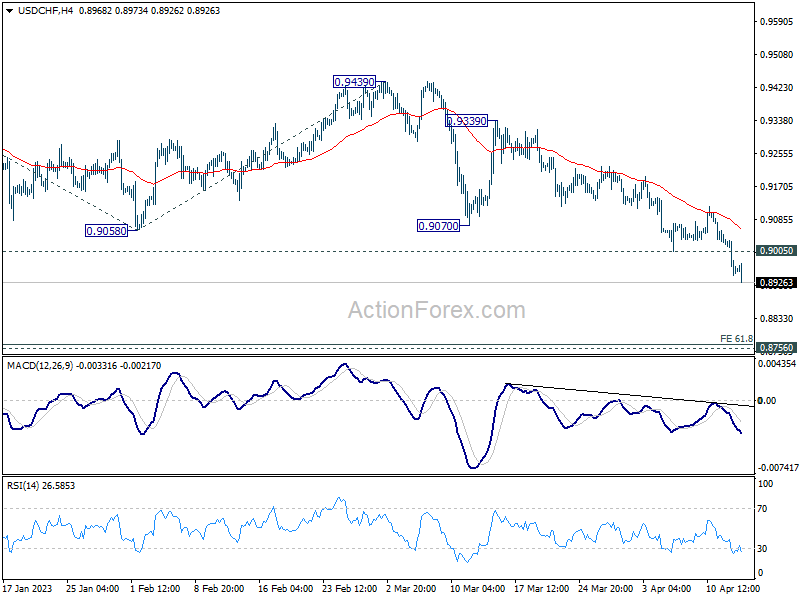
Intraday bias in USD/CHF remains on the downside for the moment. Current down trend from 1.0146 should target 61.8% projection of 1.0146 to 0.9058 from 0.9439 at 0.8767, which is close to 0.8756 long term support. Strong support is expected there to bring rebound, at least on first attempt. On the upside, above 0.9005 minor resistance will turn intraday bias neutral and bring consolidations first, before staging another decline.
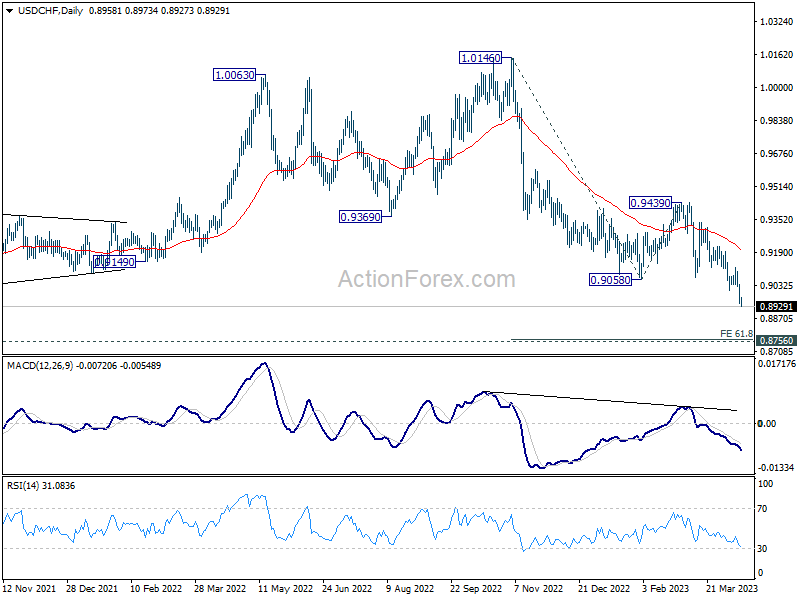
In the bigger picture, outlook will stay bearish as long as 0.9439 resistance holds, and fall from 1.1046 (2022 high) is still in progress. Prior rejection by 55 week EMA was a medium term bearish sign. Sustained of 0.9058 will resume such decline towards 0.8756 support (2021 low). But overall, this fall is still as a leg in the long term range pattern from 1.0342 (2016 high). So, downside should be contained by 0.8756 to bring reversal.
USD/JPY Daily Outlook
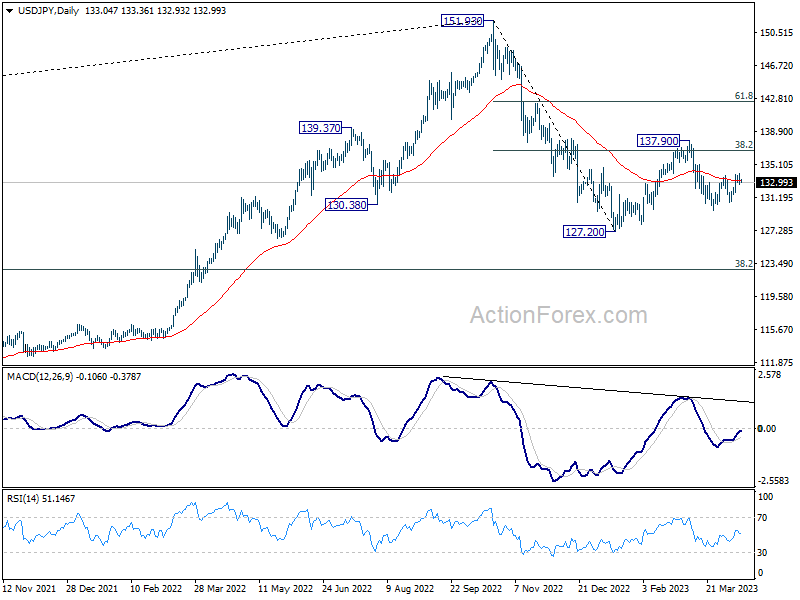
Daily Pivots: (S1) 132.58; (P) 133.31; (R1) 133.88; More...
Intraday bias in USD/JPY stays neutral for the moment. On the upside, break of 134.04 will resume the rebound from 129.62 towards 137.90 resistance again. On the downside, break of 130.62 should resume the fall from 137.90 through 129.62 to retest 127.20 low.
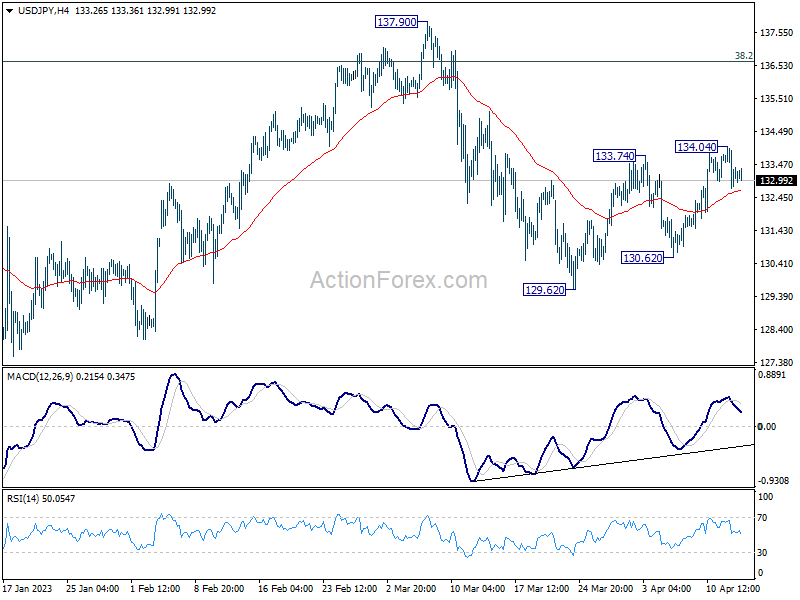
In the bigger picture, corrective pattern from 127.20 might be extending. But after all, down trend from 151.93 is expected to resume at a later stage. Break of 127.20 will resume this down trend and target 61.8% projection of 151.93 to 127.20 from 137.90 at 122.61. This will now be the favored case as long as 137.90 resistance holds.
USD/CAD Daily Outlook
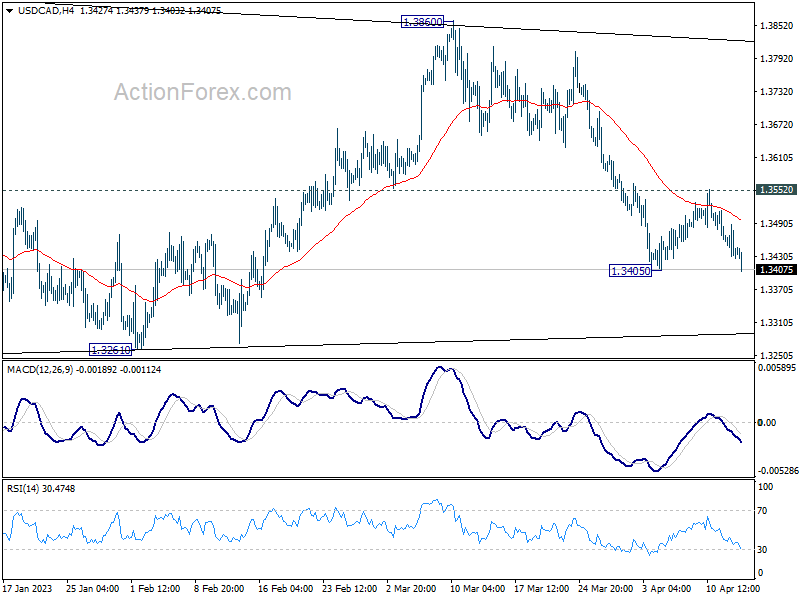
Daily Pivots: (S1) 1.3417; (P) 1.3453; (R1) 1.3478; More....
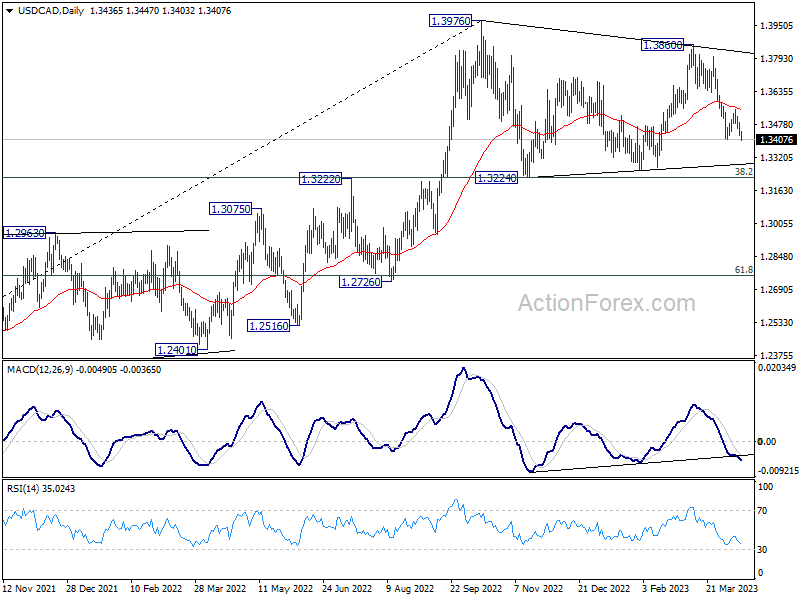
Intraday bias in USD/CAD is back on the downside with breach of 1.3405 support. Fall from 1.3860 is likely resuming and further decline should be seen to 1.3224/61 support zone. As the decline is seen as the third leg of the corrective pattern from 1.3976, strong support should be seen around 1.3224/61 to bring rebound. On the upside, break of 1.3552 will turn bias back to the upside for 1.3860 resistance.
In the bigger picture, the up trend from 1.2005 (2021 low) is still in progress. Break of 1.3976 will confirm resumption and target 61.8% projection of 1.2401 to 1.3976 from 1.3261 at 1.4234. Firm break there will pave the way to long term resistance zone at 1.4667/89 (2016, 2020 highs). On the downside, sustained break of 55 week EMA (now at 1.3282) is needed to confirm medium term topping. Otherwise, outlook will remain bullish even in case of deep pull back.
AUDUSD Recovers Somewhat Within Upward Sloping Channel
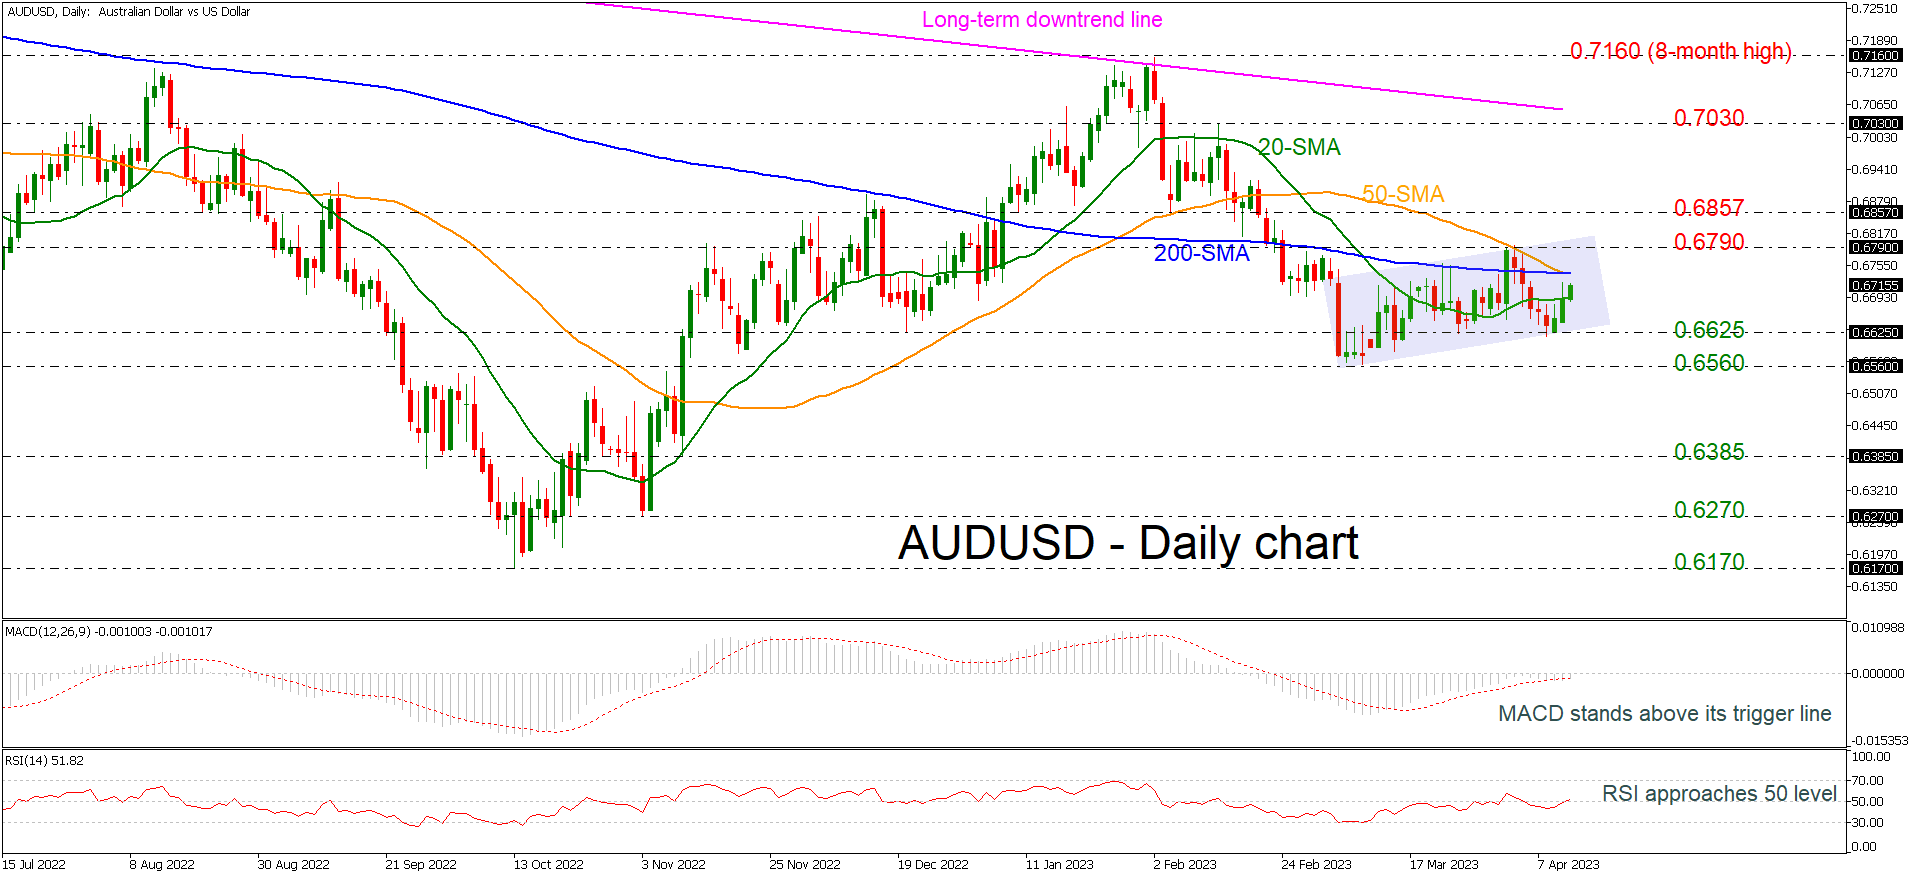
AUDUSD rebounded off the 0.6625 support level, which is also near the lower boundary of the short-term upward sloping channel. Currently, the market is standing above the 20-day simple moving average (SMA) and is approaching a bearish crossover within the 50- and the 200-day SMAs near 0.6740.
Technically, the MACD oscillator is holding above its trigger line in the negative region, while the RSI is pointing upwards above the neutral threshold of 50, suggesting that more bullish moves may be on cards.
If the price action jumps above the SMAs, there is scope to test the 0.6790 resistance. Clearing this key level would see additional gains towards 0.6857. This is considered to be a strong resistance area which has been rejected a few times in the past. Rising above it would see prices re-test the 0.7030 peak.
If the 0.6625 support fails, then the focus would shift to the downside towards 0.6560. This level is the previous bottom and if it is breached, this would increase downside pressure and bring about a reversal of the trend. From here, AUDUSD would be on the path towards the 0.6385 low.
Overall, AUDUSD has been positive in the near-term since bottoming at 0.6560. In the long-term view, the price is appearing negative as it stands beneath the descending trend line.
WTI Oil Futures Challenge Crucial Zone as Advance Resumes
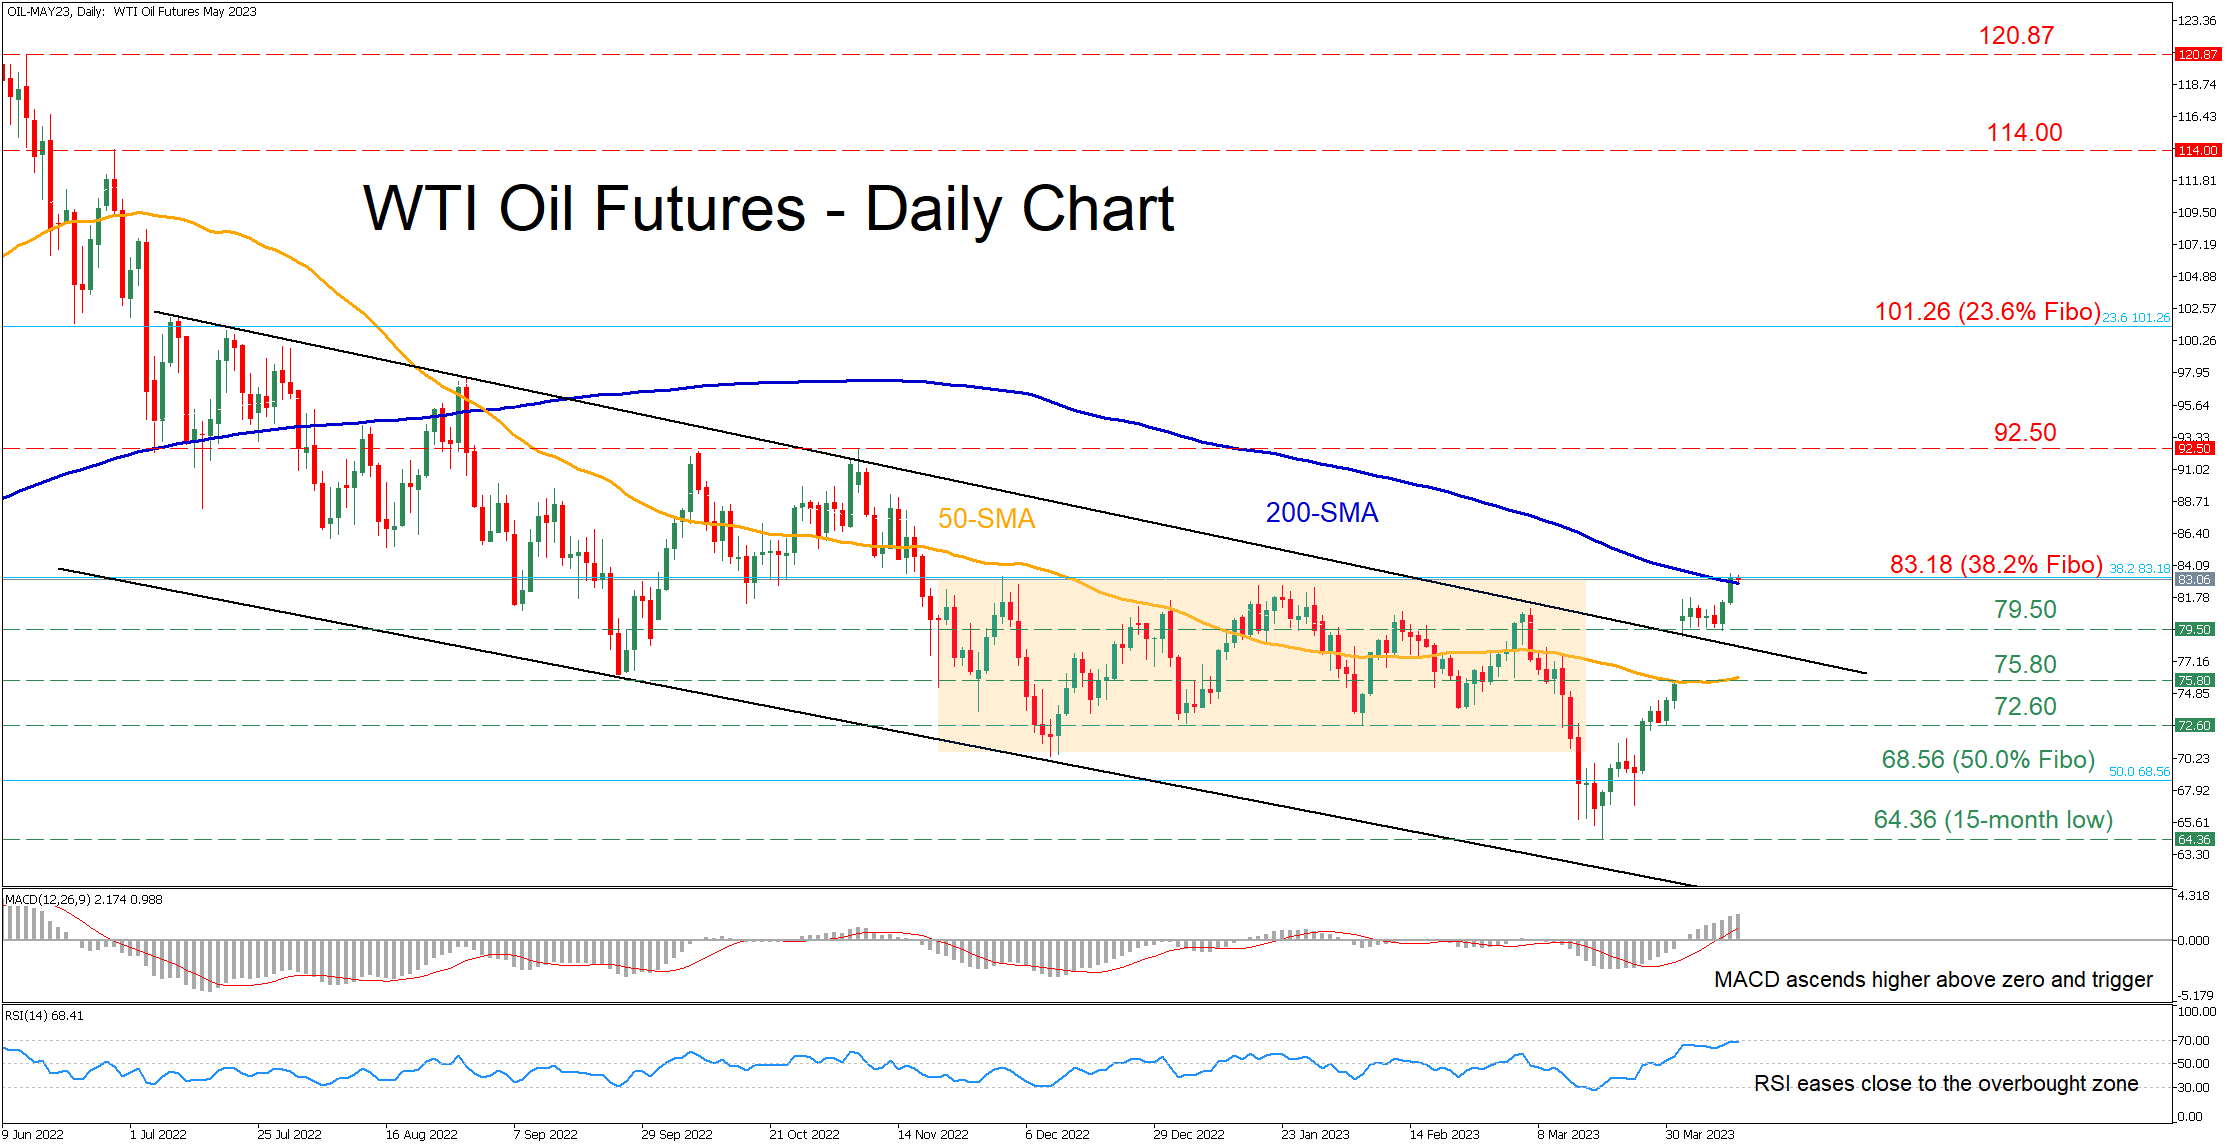
WTI oil futures (May delivery) posted a fresh 15-month low of 64.36 in mid-March after breaking below their long-lasting rectangle pattern. However, the commodity bounced strongly and jumped above both its downward sloping channel and the 50-day simple moving average (SMA), while it is currently battling with a fortified area that includes the 200-day SMA and 38.2% Fibo.
The momentum indicators currently suggest that bullish forces are strengthening near their overbought territories. Specifically, the MACD histogram is gaining ground above both zero and its red signal line, while the RSI has flatlined slightly below the 70-overbought mark.
If buyers try to push the price even higher, they might initially struggle to conquer the 83.18 congested area that includes the 200-day SMA and the 38.2% Fibonacci retracement of the 6.62-130.5 uptrend. Surpassing that barrier, the price may ascend to test the November peak of 92.50. Further advances could cease at the 23.6% Fibo of 101.26.
On the flipside, should the price reverse lower, the recent support zone of 79.50 could act as the first line of defense. A break below that region could turn the spotlight to 75.80, which overlaps with the 50-day SMA. Even lower, the price could retreat towards 72.60 before the 50.0% Fibo of 68.56 gets tested.
In brief, WTI oil futures have been in a strong recovery after hitting a 15-month low and reaching extremely oversold conditions. However, for the medium-term picture to turn bullish, the price needs to close above the 83.18 ceiling.