Sample Category Title
USD/CHF: Bearish Trend Takes the Form of an Ending Diagonal
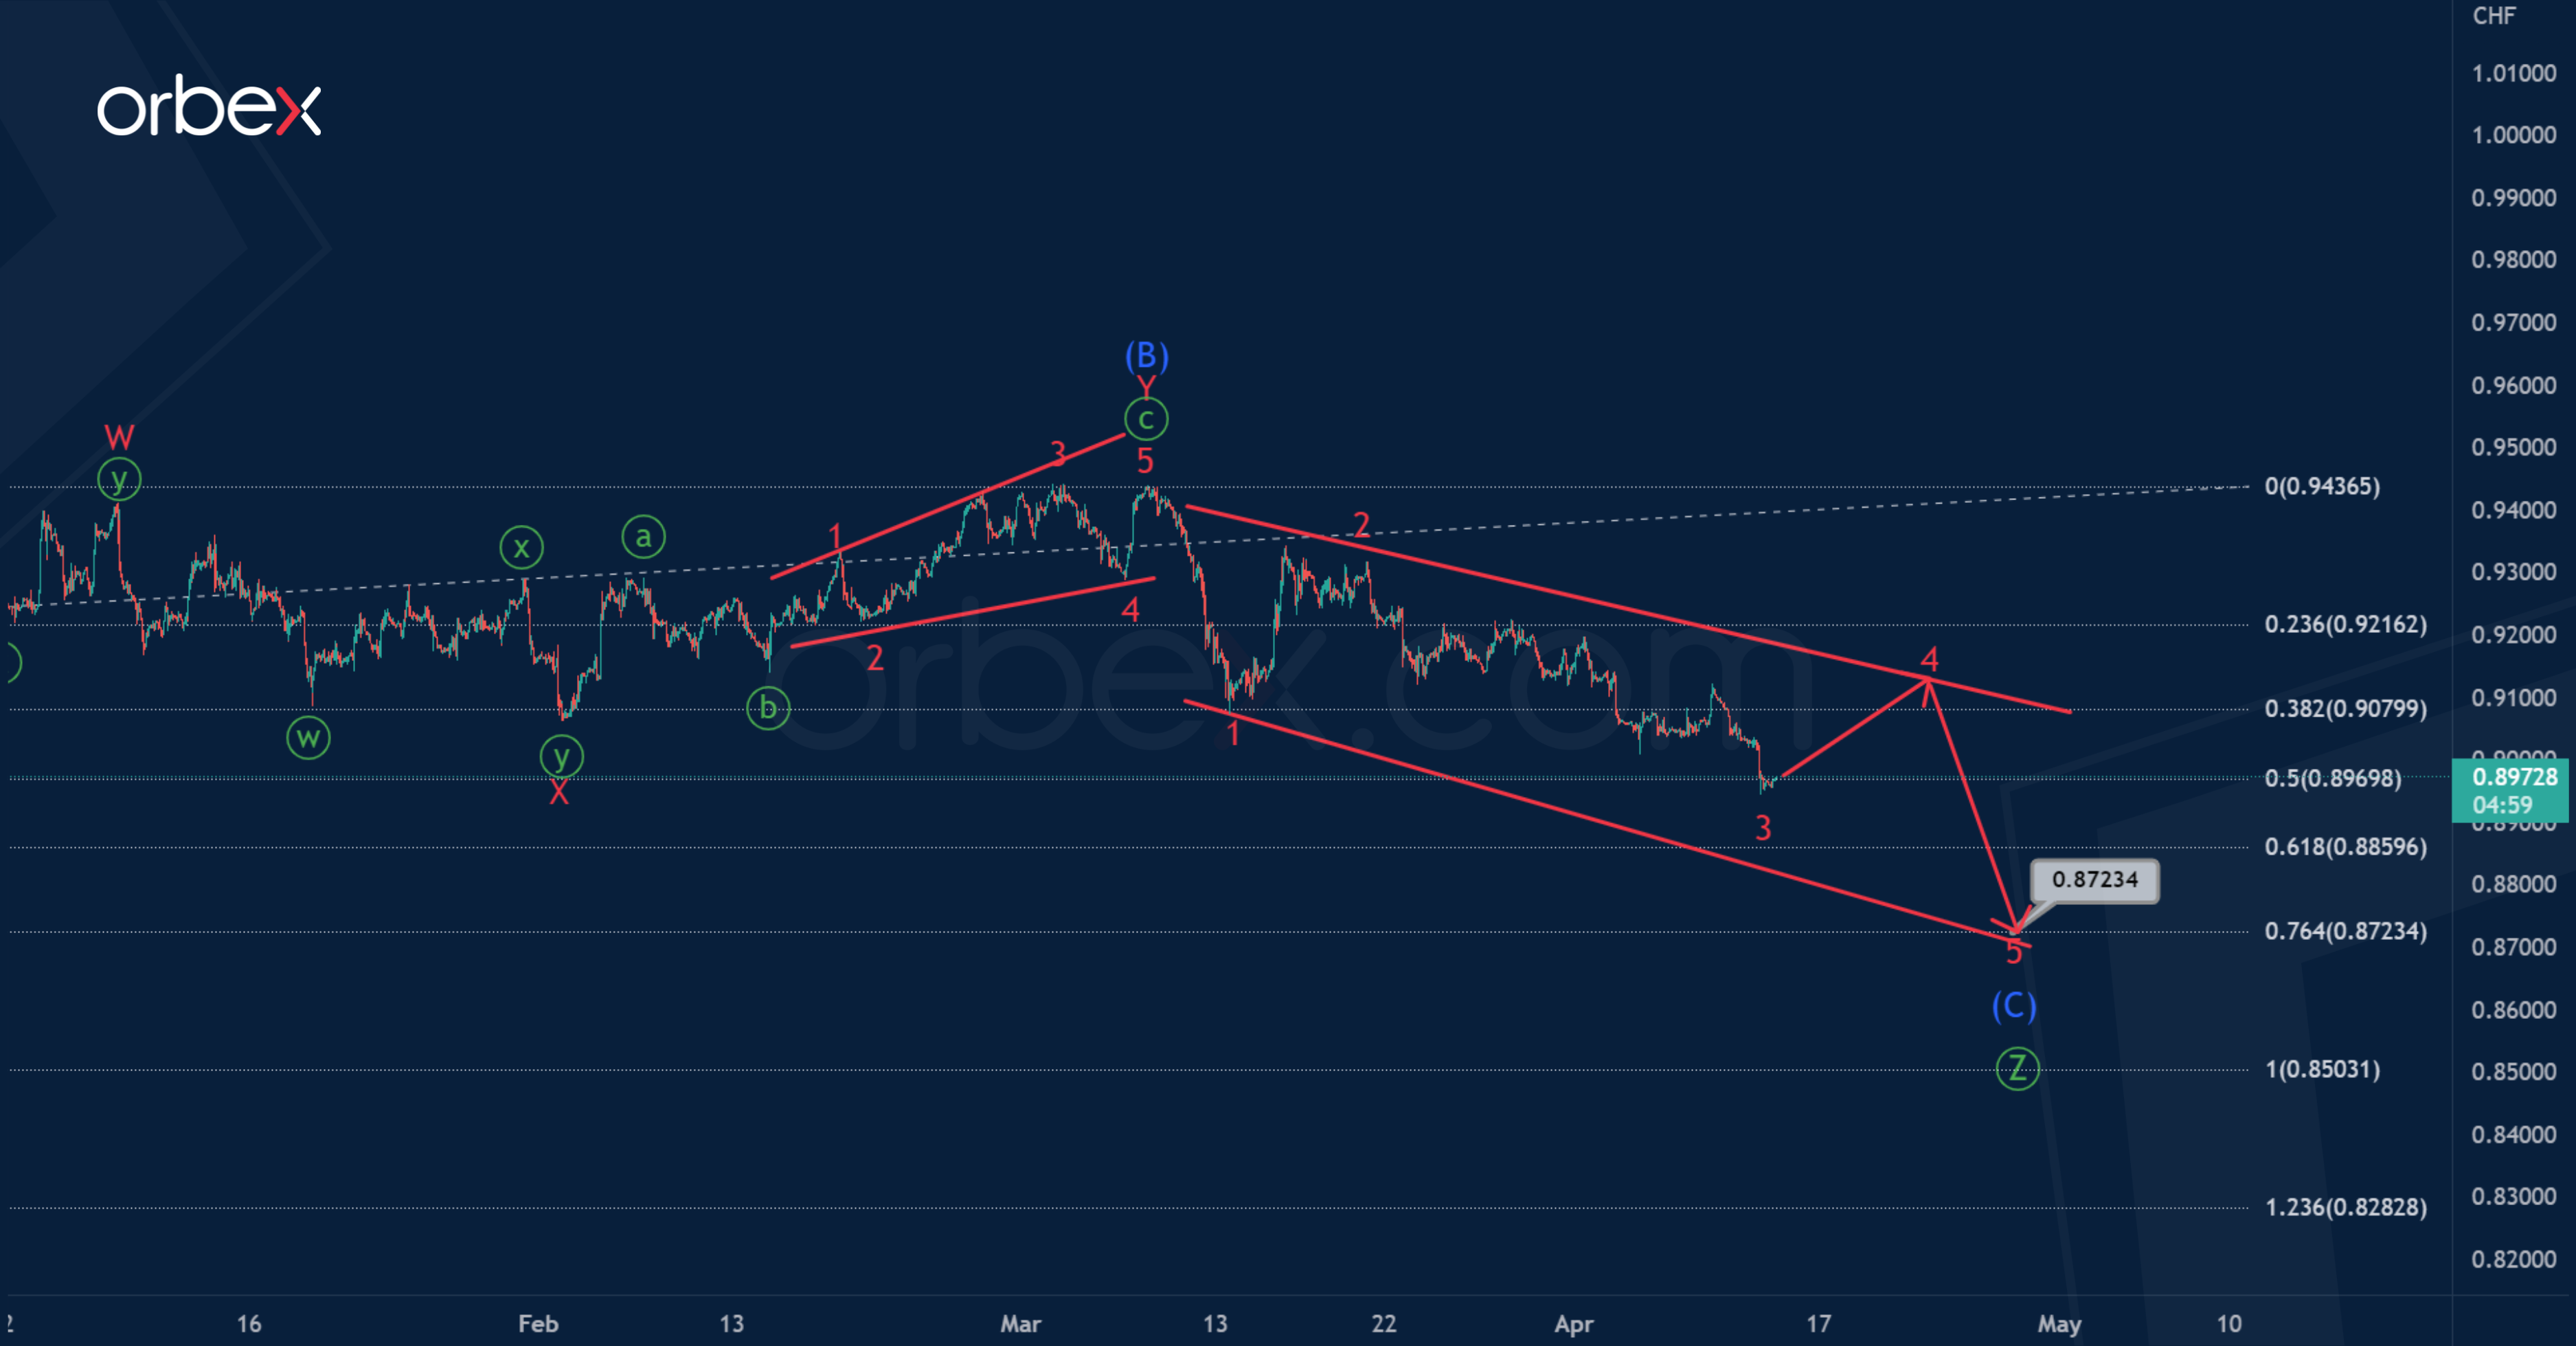
The USDCHF pair most likely forms a triple zigzag pattern Ⓦ-Ⓧ-Ⓨ-Ⓧ-Ⓩ. Its final part, wave Ⓩ, is under development.
The primary wave Ⓩ can end in the form of a standard intermediate zigzag (A)-(B)-(C). Wave (A) is a 5-wave bearish impulse, wave (B) has a horizontal internal structure of a double three W-X-Y.
At the time of writing, the formation of the final intermediate wave (C) is taking place. Perhaps it will be at 76.4% of impulse (A), and will end near 0.872 in the form of an ending diagonal.
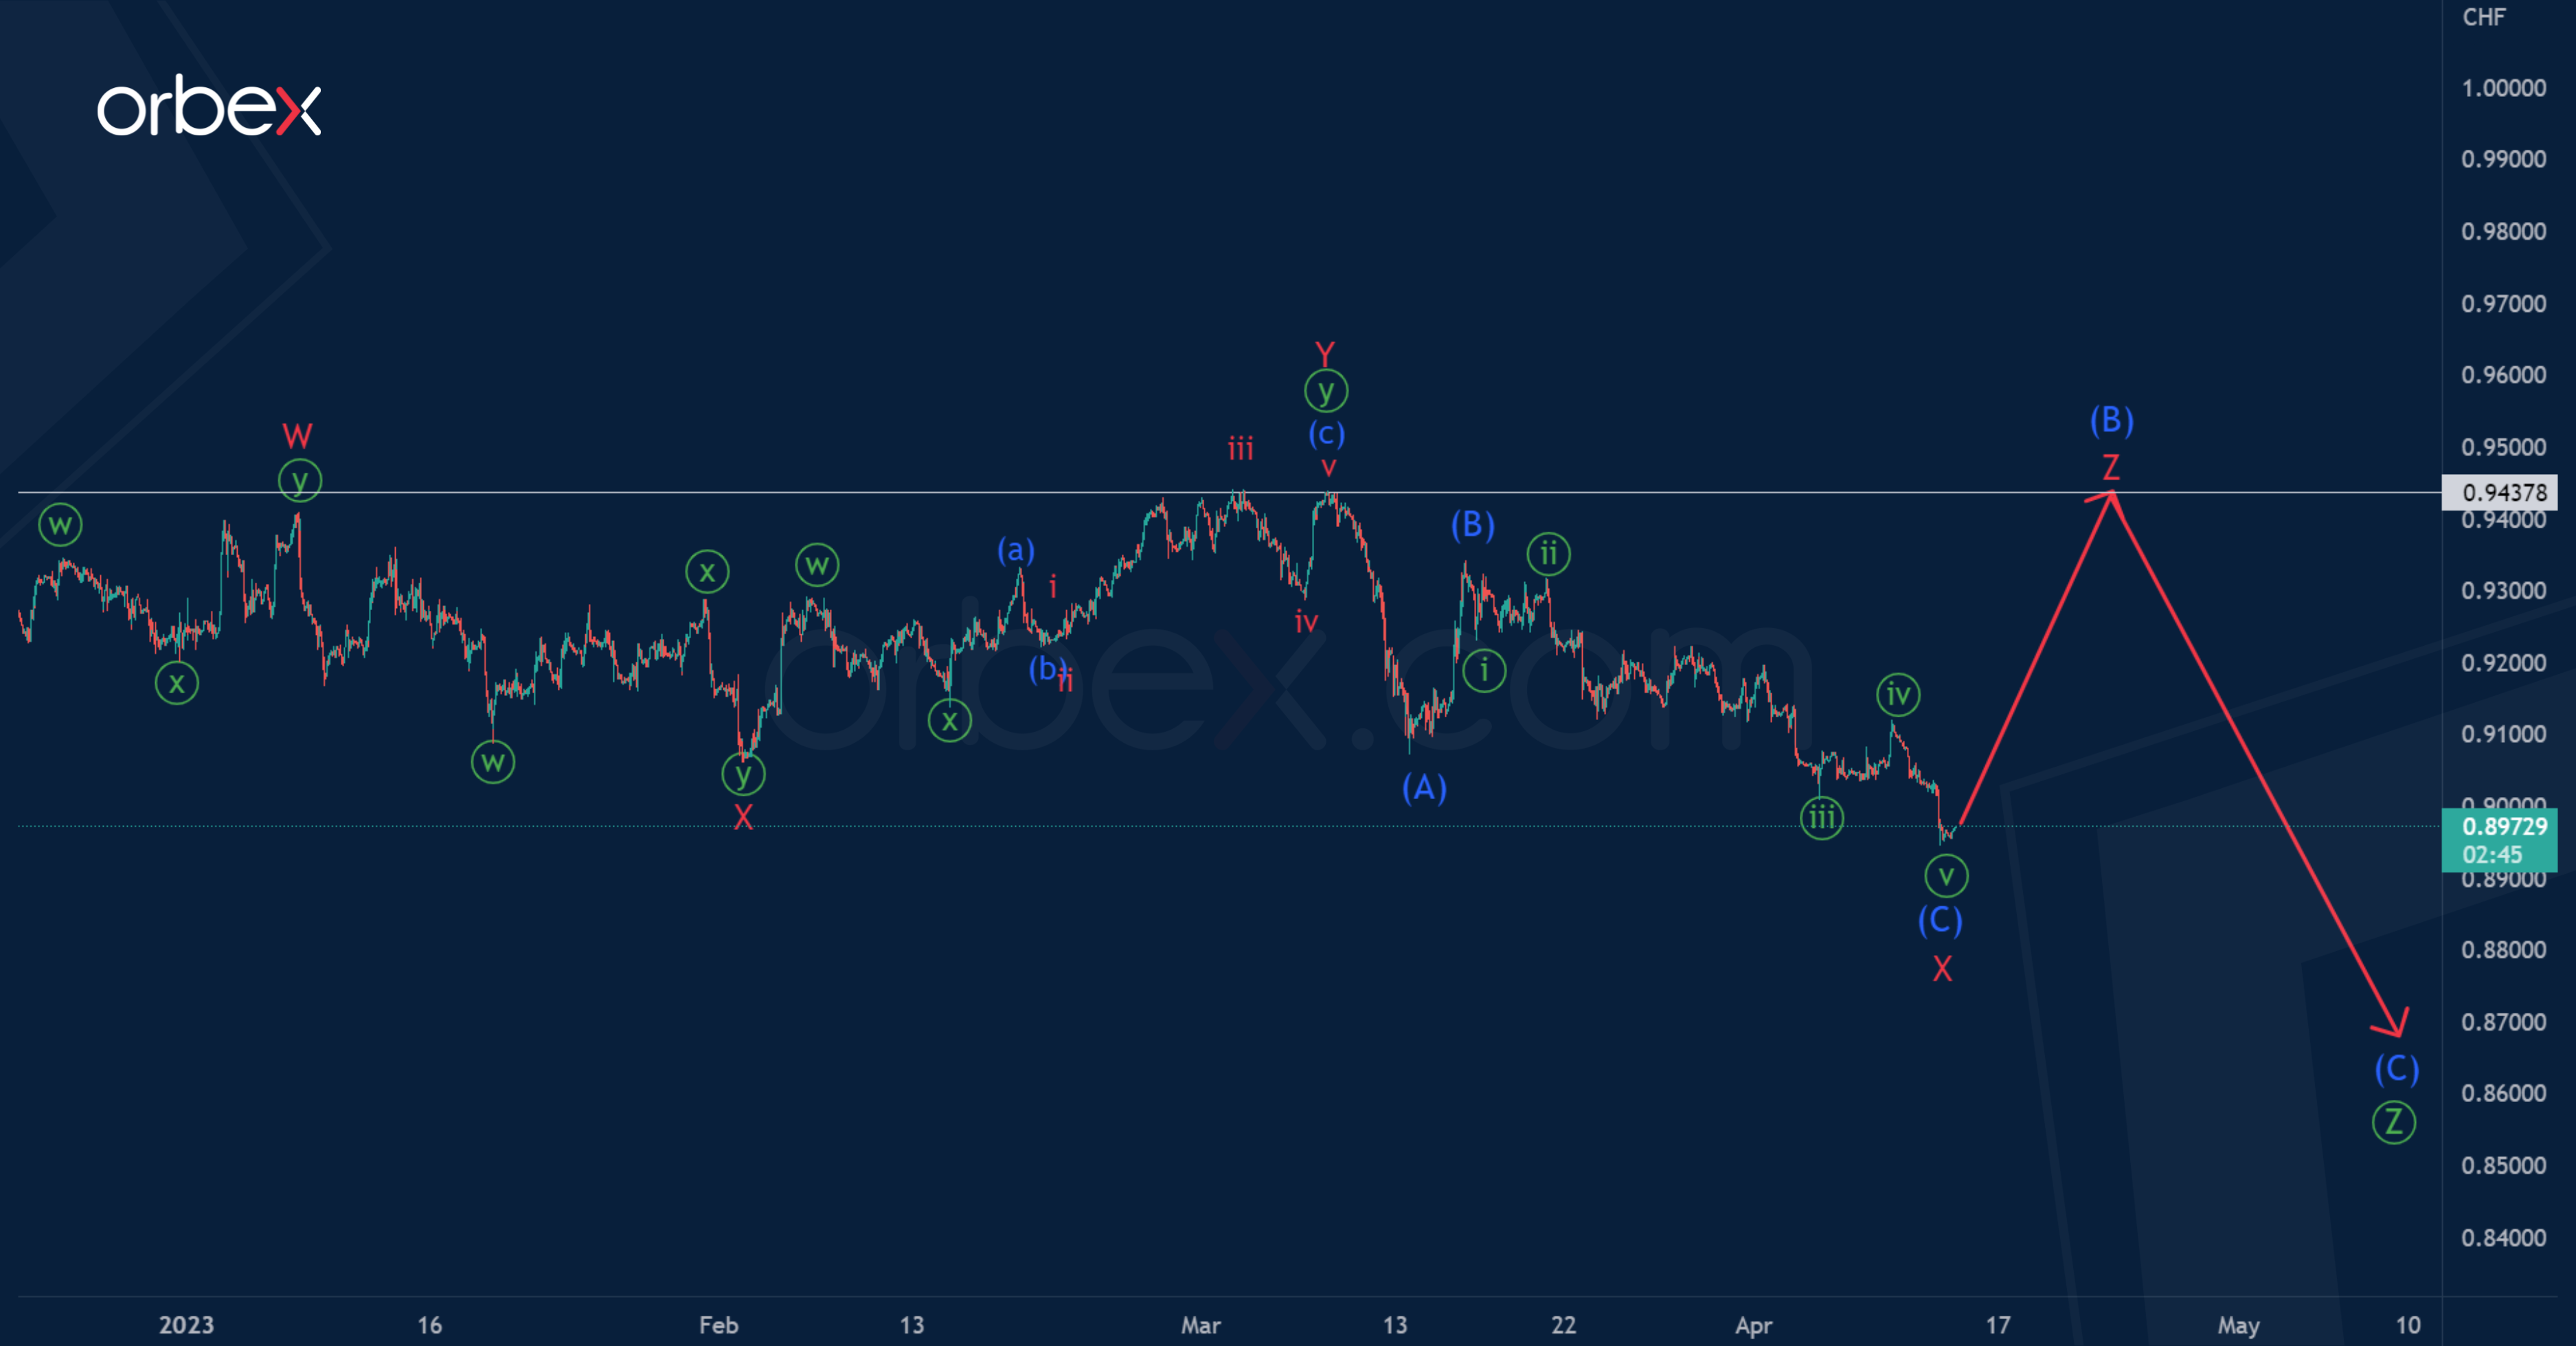
And what if the development of correction (B) continues? Let's consider an alternative scenario, where it can take the form of a triple three consisting of sub-waves W-X-Y-X-Z.
The minor sub-waves W-X-Y-X have been completed. It is necessary to wait for the development of the minor wave Z.
Probably, the bulls will send the market to 0.943, that is, to the maximum of the wave Y.
Given the Uncertain Outlook, There’s a Need for “Flexibility and Optionality”.
Markets
US CPI and the March Fed meeting minutes were the main events defining trading yesterday. The former showed headline prices easing a full percentage point to an annual 5% but a core gauge accelerating from 5.5% to 5.6% on the bank of sticky services/housing inflation. US bond yields whipsawed with the 2-y losing 20 bps from intraday highs, followed by a 15 bps rebound in the hours thereafter. The 10-y fell but then recouped all of the 12 bps drop. The minutes later revealed the Fed balancing risks of a credit crunch following the SVB collapse and stubbornly high inflation. They raised rates by 25 bps and the updated dot plot suggested one more in store even as Fed staff warned for a mild recession. But that’s less than what officials expected to do before the financial turmoil erupted, according to the minutes. Given the uncertain outlook, there’s a need for “flexibility and optionality”. The sky in the meantime cleared up a bit, something which several Fed governors including Daly yesterday, acknowledged. Yet, the overall dovish tone of the minutes in the end still prevented the 2-y yield (-6.4 bps) a close above 4%. Longer maturities underperformed with the 10-y eventually losing 3.5 bps and the 30-y adding 0.4 bps. The US induced decline in German Bund yields was quickly followed by a vigorous rebound, leading to net gains of 5.6 bps (30-y) to 9 bps (2-y). Strong Bund underperformance brought EUR/USD within striking distance of the 1.10 big figure. Dollar weakness also did its part. The trade-weighted index fell from 102.12 to 101.50. EUR/GBP managed to close above 0.88 for the first time since end-March. BoE governor Bailey in an after-market speech said that financial stability issues won’t distract the central bank from its fight against inflation through higher rates, adding that it has different tools to address the matter. Equities struggled. The Euro Stoxx 50 erased a 1.5% gain to trade flat, Wall Street ended a choppy session in the red (Nasdaq -0.85%).
The Australian dollar is the top performer during Asian trading this morning on the back of a stronger-than-expected labour market report. The USD trades stable with EUR/USD hovering near yesterday’s closing levels close to but below 1.10. US cash yields eke out gains of up to 2.5 bps at the front. The 2-y yield remains close near the 4% barrier. Today’s economic calendar contains jobless claims and US PPI numbers. Seeing the market’s over-sensitiveness for downside surprises, core bond yields face larger risks for losing further ground, especially in the US. The dollar in such a case may break through support at around EUR/USD 1.10(33). Doing so immediately brings 1.1185/86 on the radar. The UK industrial update this morning slightly disappoints but sterling in a first reaction trades little changed.
News Headlines
The Bank of Canada kept its policy rate as expected unchanged at 4.5% for a second meeting running. Quantitative tightening continues to complement the restrictive policy stance. It also sticks with a tightening bias if needed to return inflation to the 2% target. Canadian money markets discount a flat policy rate path until December, when they discount a 25 bps rate cut. BoC governor Macklem pushed back against that scenario at the press conference. The BoC expects CPI inflation (5.2% Y/Y in February) to quickly fall to around 3% mid 2023 and then decline more gradually to target by end 2024. Risks are tilted to the upside because inflation expectations are coming down slowly, service price inflation and wage growth remain elevated, and corporate pricing behavior has yet to normalize. Canadian demand is still exceeding supply and the labour market remains tight. Canadian Q1 growth looks to be stronger than anticipated in January with solid consumption and a bounce in exports. The former could take a hit as households renew mortgages at higher rates and as restrictive policy works its way through the economy more broadly. The latter might come under pressure in coming months as US growth is expected to slow considerably. The BoC projects GDP to grow by 1.4% this year (from 1%), 1.3% in 2024 (from 1.8%) and 2.5% in 2025.
March Australian labour data printed very strong this morning. Recall that February jobs data also delivered a big positive surprise (+63.6k). Employment grew by 53k (vs 20k expected) with full time job gains even bigger at 72.2k. Part time jobs fell by 19.2k. The unemployment rate stabilized at a near 50-yr low of 3.5% (vs 3.6% expected) with the participation rate unchanged at 66.7% as well. Australian money markets aren’t convinced yet that back-to-back payroll strength will tempt the RBA into delivering a (final?) 25 bps rate hike at the May policy meeting. The Aussie dollar trades slightly strong this morning against a weak USD (AUD/USD 0.67).
CL_F (Crude Oil) Looking To Complete Impulse Elliott Wave Sequence Before Pullback Starts
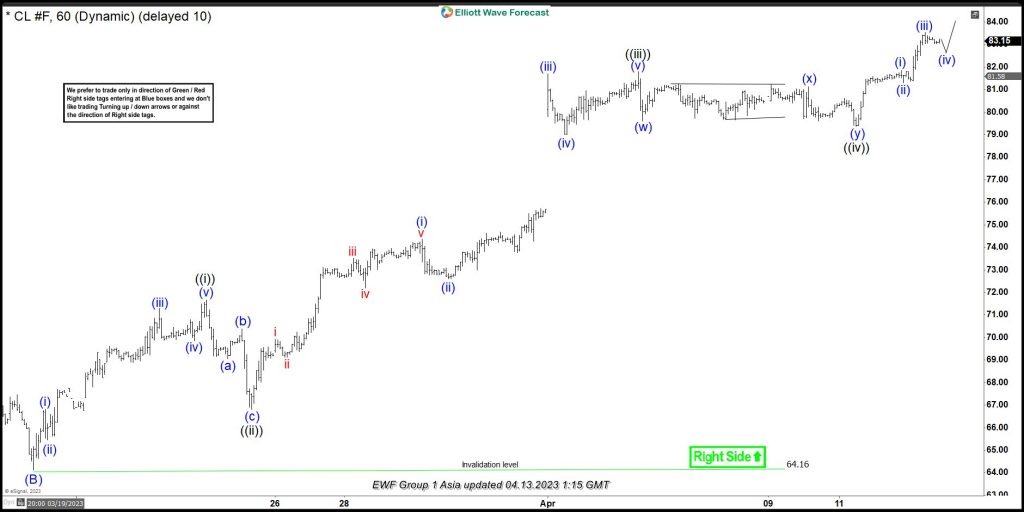
CL_F (Crude Oil) favors higher in 5 wave Impulse Elliott Wave sequence as wave 1 before pullback starts. It placed (B) at $64.12 low on 3/20/2023. Above (B) low, it placed ((i)) at $71.67 high & ((ii)) at $66.82 low. ((ii)) was 0.618 Fibonacci retracement of ((i)). It favored ended ((iii)) at $81.81 high on 4/04/2023 high as extended ((iii)). Within ((iii)), it placed (i) at $74.37 high, (ii) at $72.61 low, (iii) at $81.69 high, (iv) at $79.00 low & (v) ended at $81.81 high as ((iii)) as 2.0 Fibonacci extension of ((i)). It ended ((iv)) at $79.37 low as double as shallow correction on 4/11/2023. Above ((iv)) low, it favors higher in ((v)) of 1.
Above ((iv)) low of $79.37, it ended (i) of ((v)) at $81.85 high & (ii) at $81.28 low. It ended (iii) at $83.53 high & favors pullback in (iv) before upside resumes in (v) to finish ((v)) as wave 1. Impulse sequence expects to finish with momentum divergence in fifth wave against third wave before correction starts. So, if it erases the momentum divergence with more upside, then it can be the part of nest within impulse sequence before pullback starts. Once it finished wave 1 as impulse sequence, it expect to pullback in 3, 7 or 11 swings against 3/20/2023 low before turning higher. It expects to remain supported at extreme areas in pullback.
CL_F (Crude Oil) 60 Minute Elliott Wave Chart
CL_F (Crude Oil) Elliott Wave Video
https://www.youtube.com/watch?v=9iUJVQDykZs
USD Drifts Lower
USD/CHF breaks lower
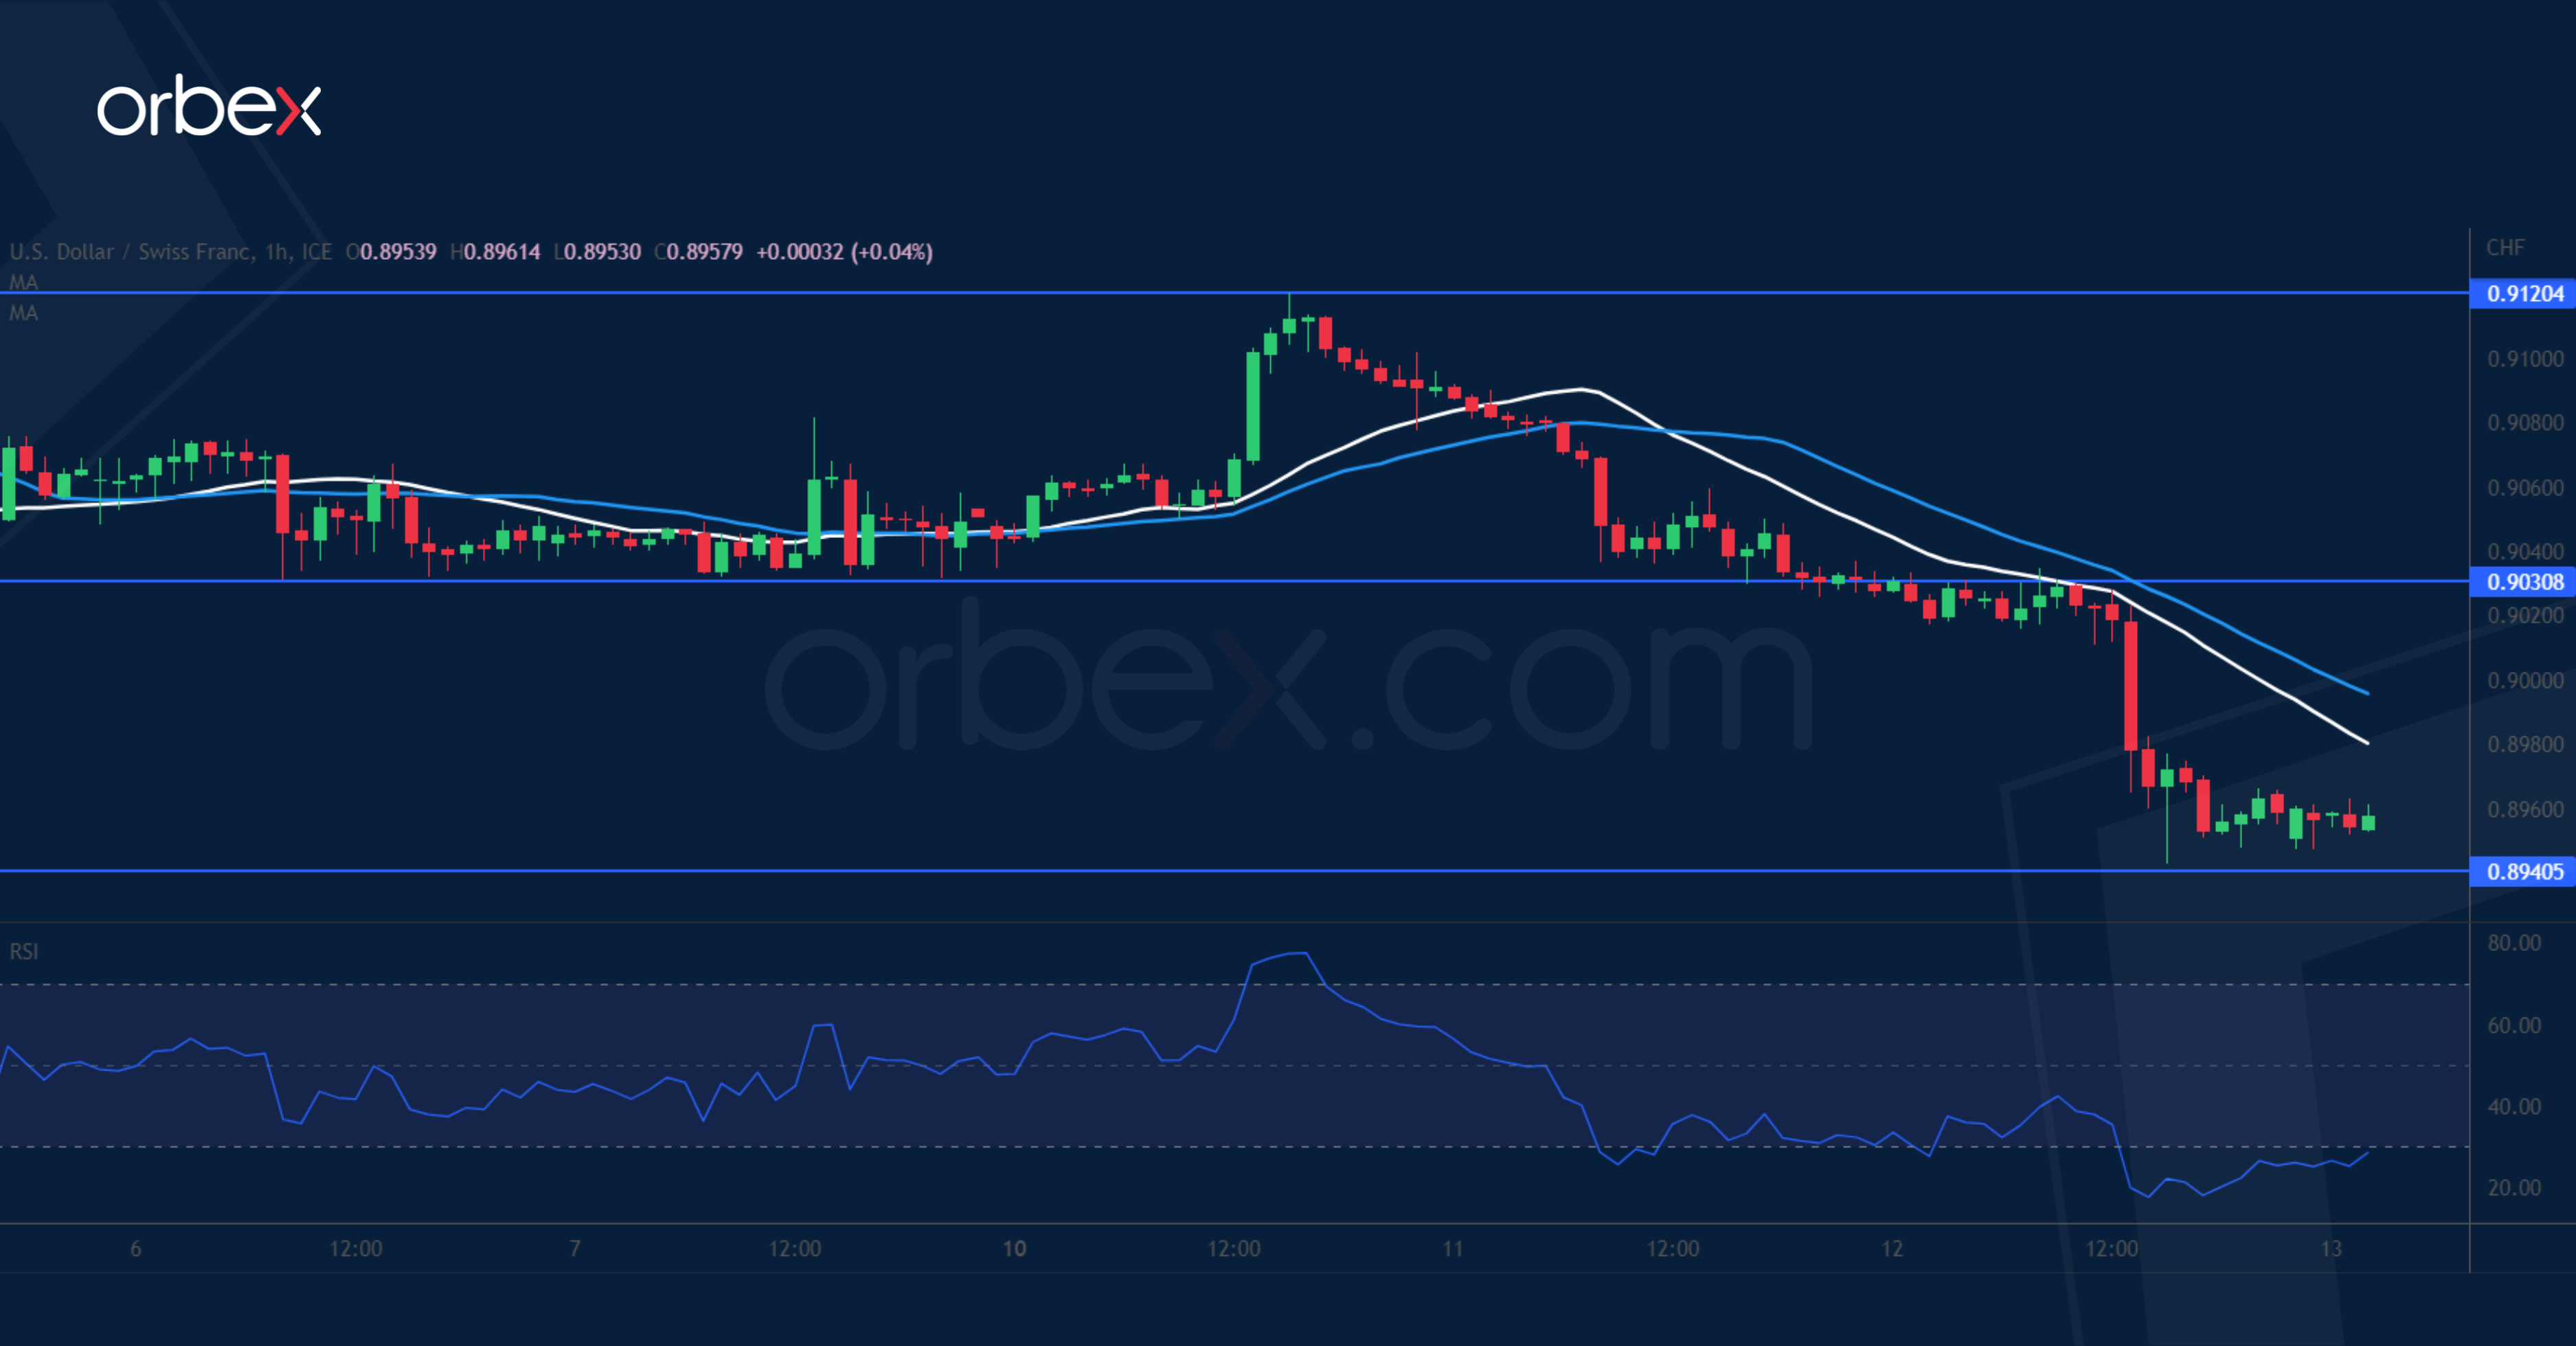
The US dollar tumbled over cooling inflation in March. The price action has remained under pressure after it dropped below the daily support of 0.9070. A limited rebound saw stiff selling pressure at 0.9120 with a shooting star indicating little buying interest. Such a reversal pattern in a supply zone is significant, making it a major ceiling in the short-term. The pair has reached June 2021’s low of 0.8940 and its breach may further depress the exchange rate towards 0.8900. The support-turned-resistance at 0.9030 is a fresh hurdle.
USD/CAD tests support
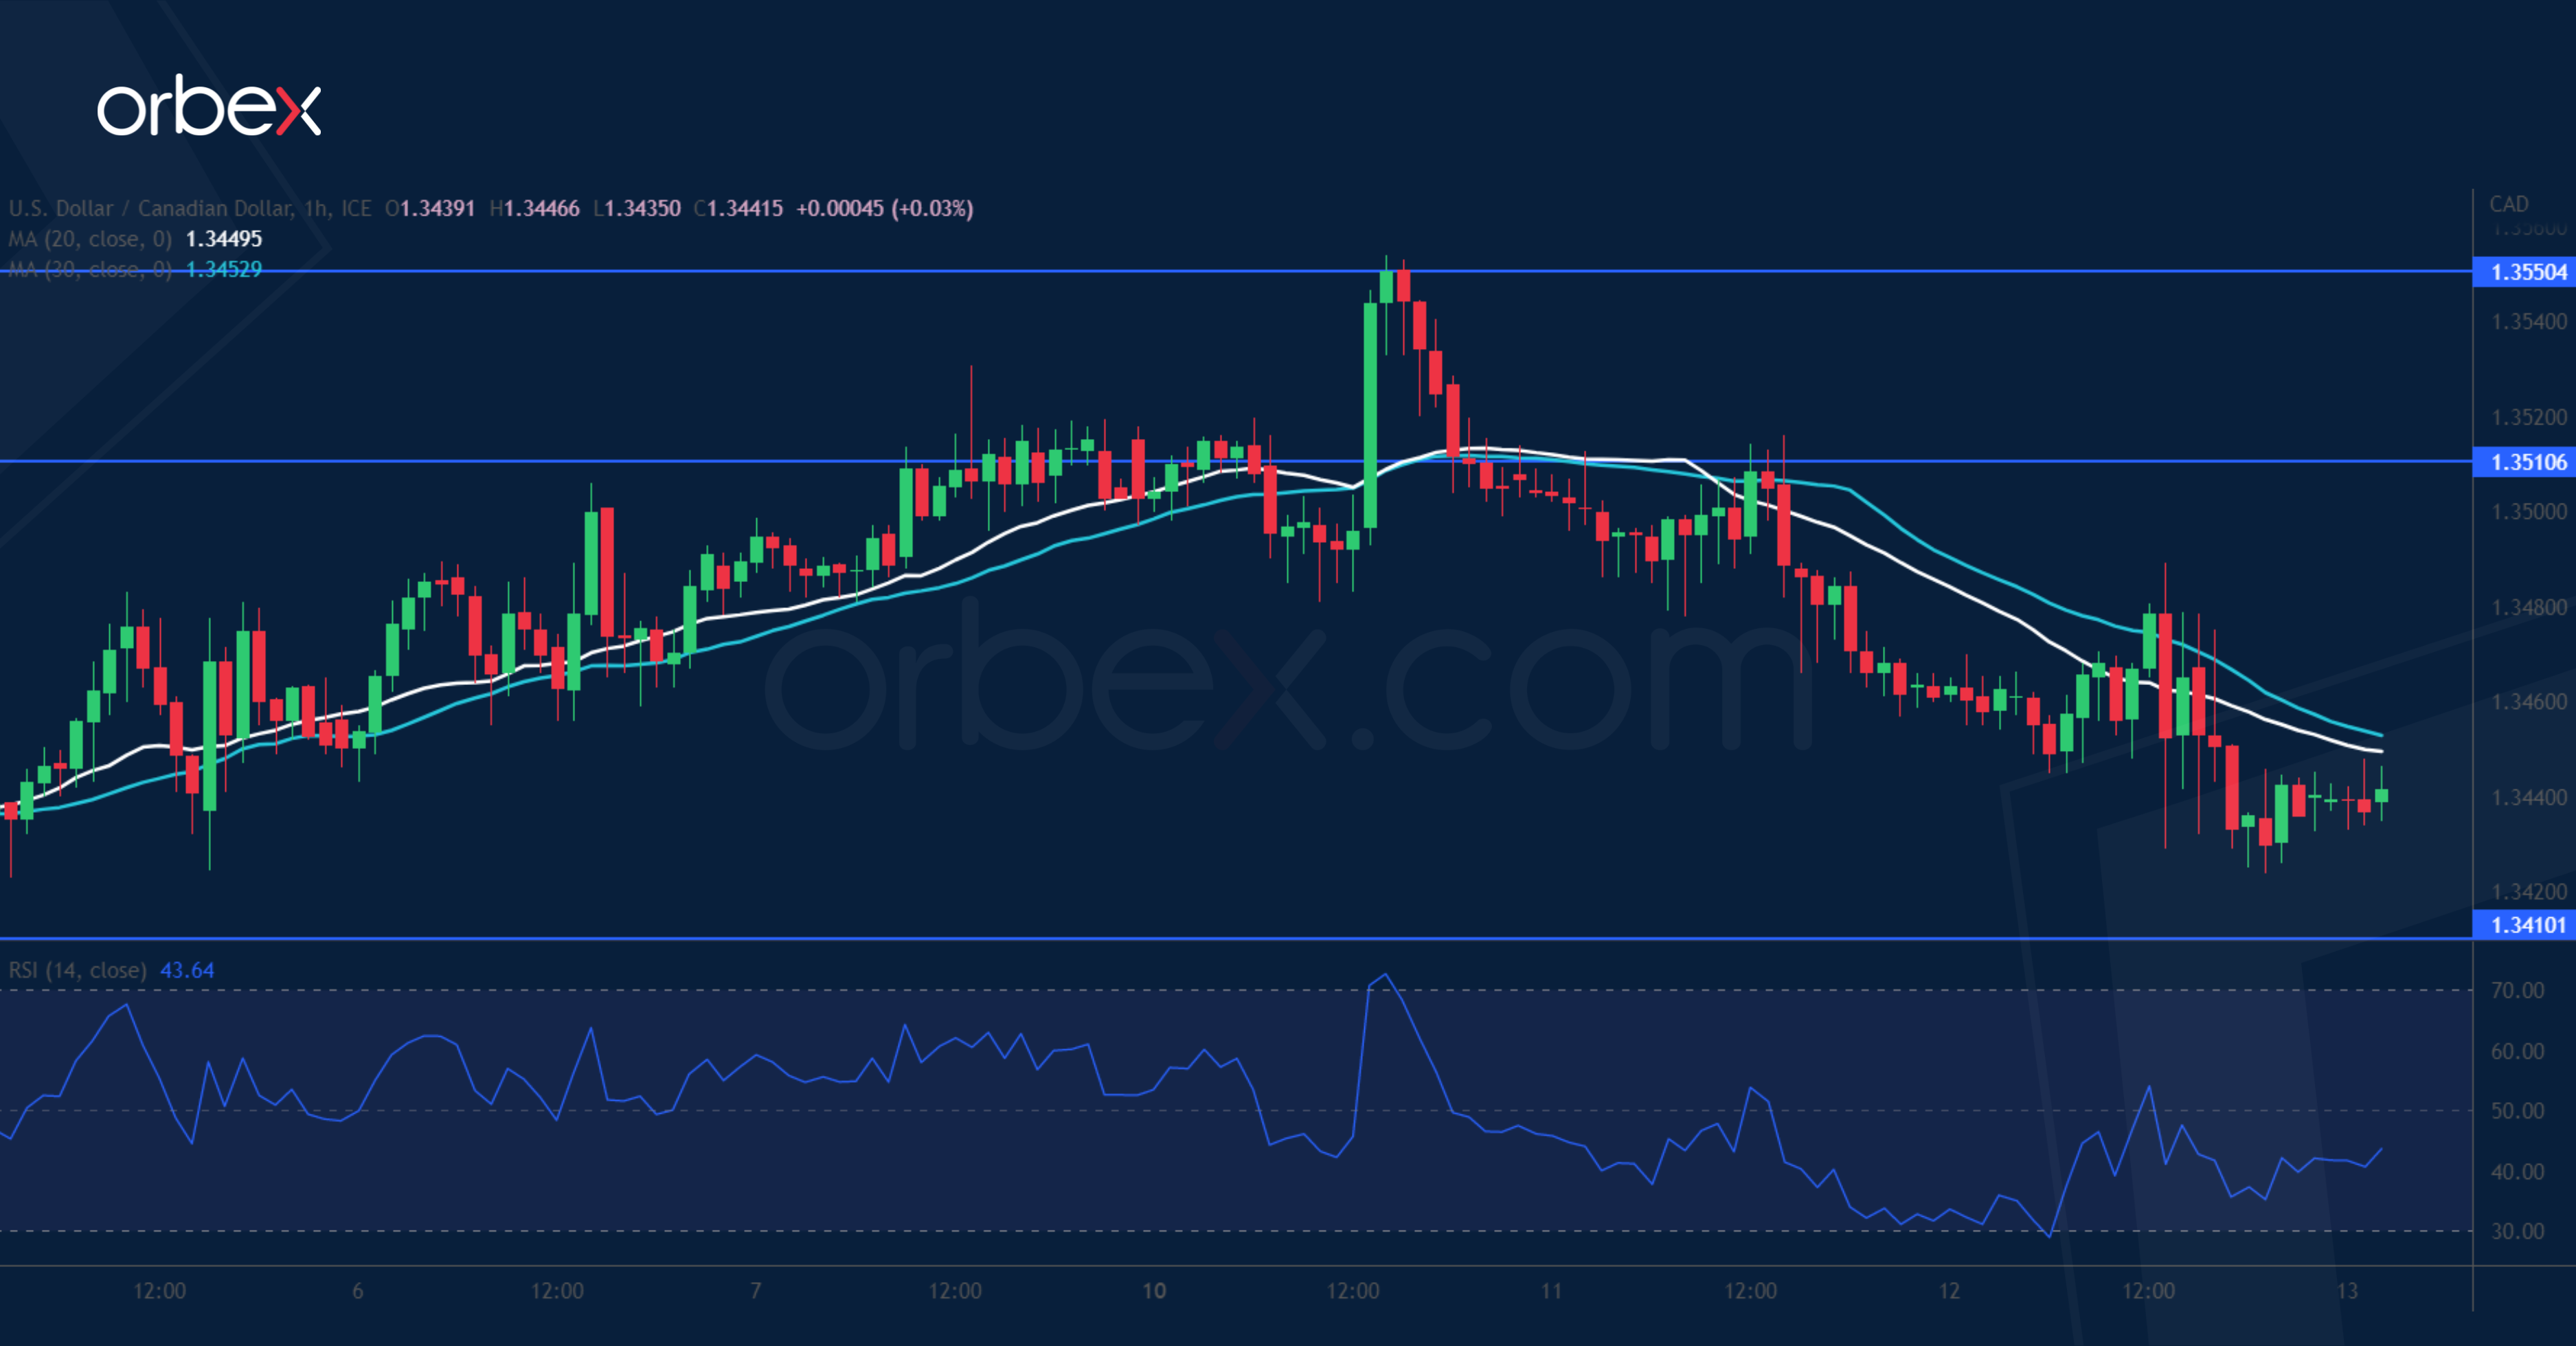
The Canadian dollar held against its US counterpart as the BoC rejected rate cuts for this year. On the daily chart, the pair is testing the demand zone (1.3400) at the start of the February rally. However, a bearish MA cross suggests mounting downward pressure, which means that the price is in a broad consolidation before a breakout would dictate the next move. 1.3410 is a key floor from the latest rebound and its breach would trigger a bearish continuation. 1.3510 is the first resistance to clear before a recovery could materialise.
US Oil breaks major resistance
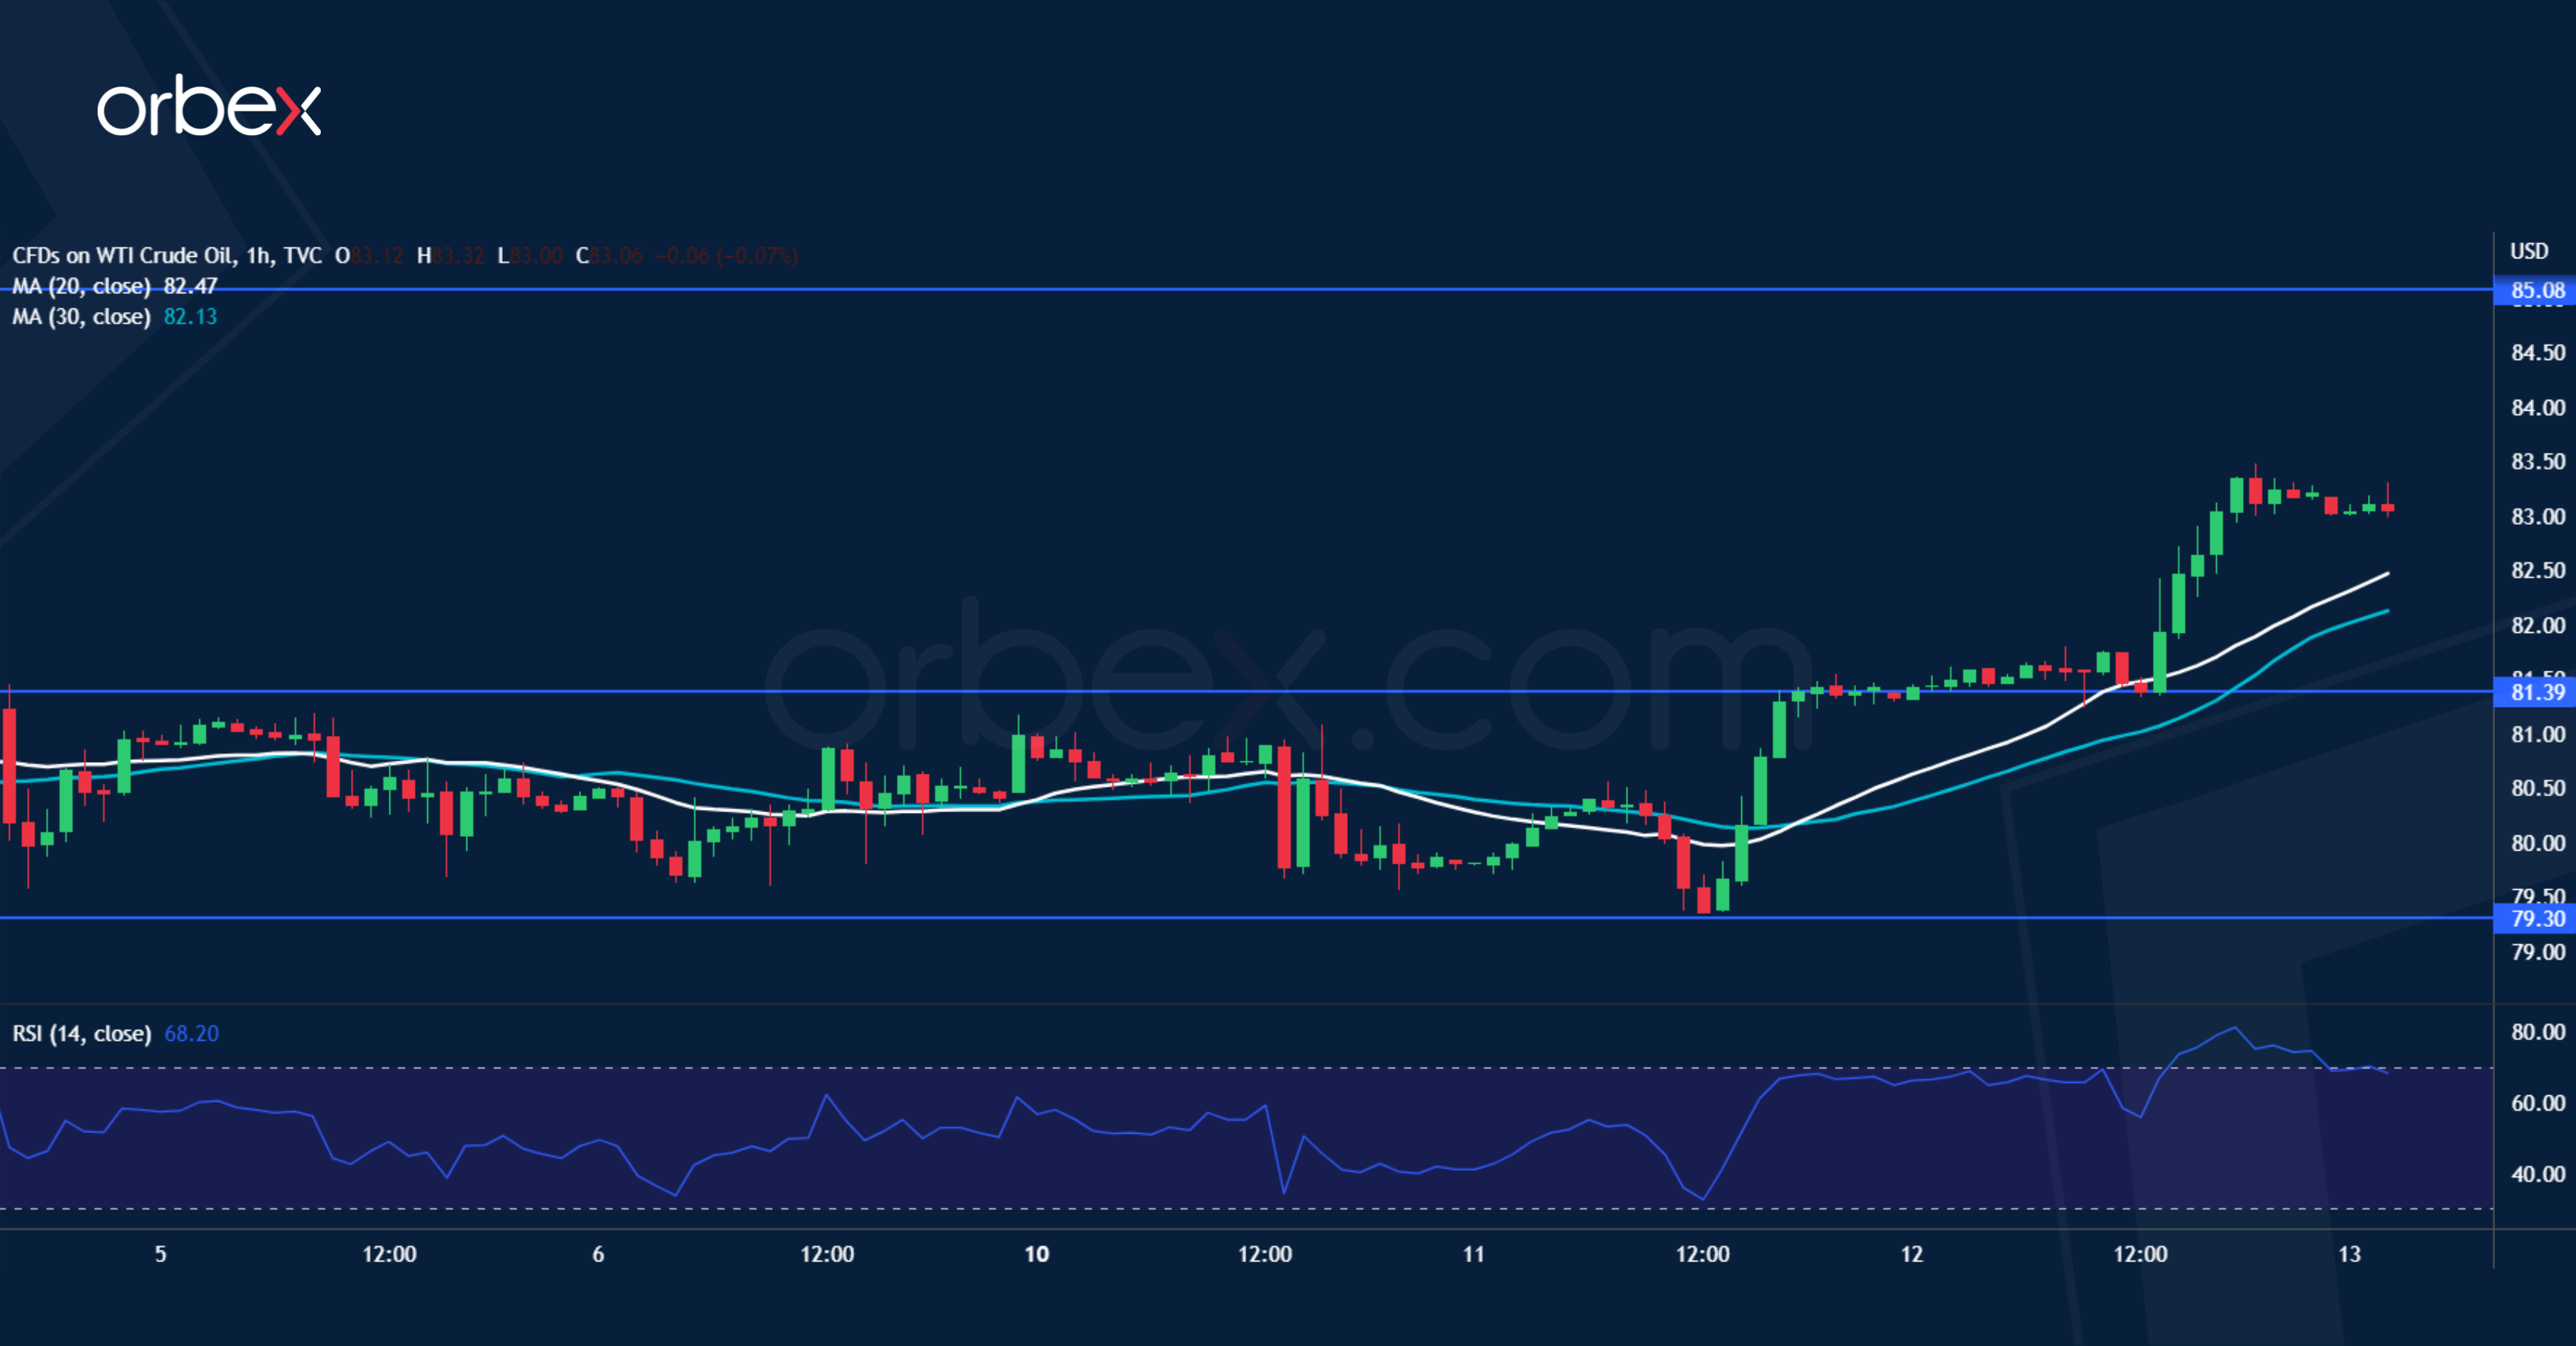
WTI crude rallies as lower US CPI may point to the end of the tightening cycle. After consolidating their gains following a parabolic rise the bulls managed to push past January’s high of 82.20, which would pave the way for an extended recovery towards 88.00 with 85.00 as an intermediate resistance. Medium-term sentiment could be turning around. As the RSI shot into the overbought area, the bulls may need to catch their breath with the former resistance at 81.40 as a fresh support. Further down, 79.30 would be a key floor.
Technical Outlook and Review
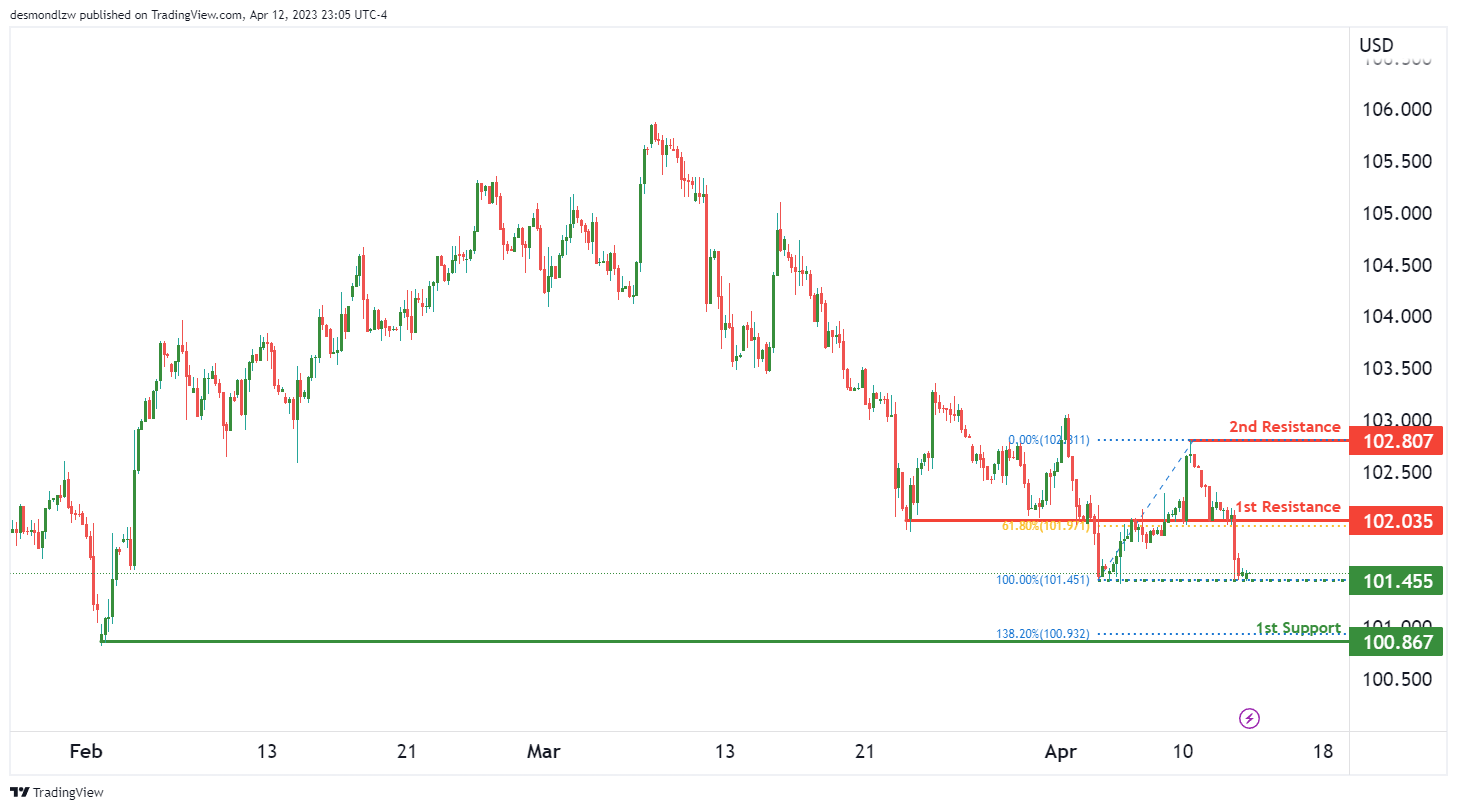
DXY:
The momentum of the DXY chart is currently bearish, which suggests that we may see further price drops in the near future. At the time of writing, the price is trading around 101.63.
If the bearish trend continues, the price could potentially make a bearish continuation towards the 1st support level of 100.86. This support level is a swing low support and also coincides with a 138.20% Fibonacci Expansion level, which makes it a strong level of support.
If the price breaks through the 1st support level, the next support level is the intermediate support level at 101.45, which is a multi-swing low support level that the price has bounced off multiple times in the past. This level is also a good level of support, as it has been tested multiple times before.
On the resistance side, we have the 1st resistance level at 102.03. This is an overlap resistance level, as well as a 61.80% Fibonacci Retracement level, which makes it a strong level of resistance that the price may struggle to break through.
If the price were to break through the 1st resistance level, the next resistance level is the 2nd resistance level at 102.80, which is a swing high resistance level. This level marks the high point of a previous bullish trend, and therefore it may also be a strong resistance level.
EUR/USD:
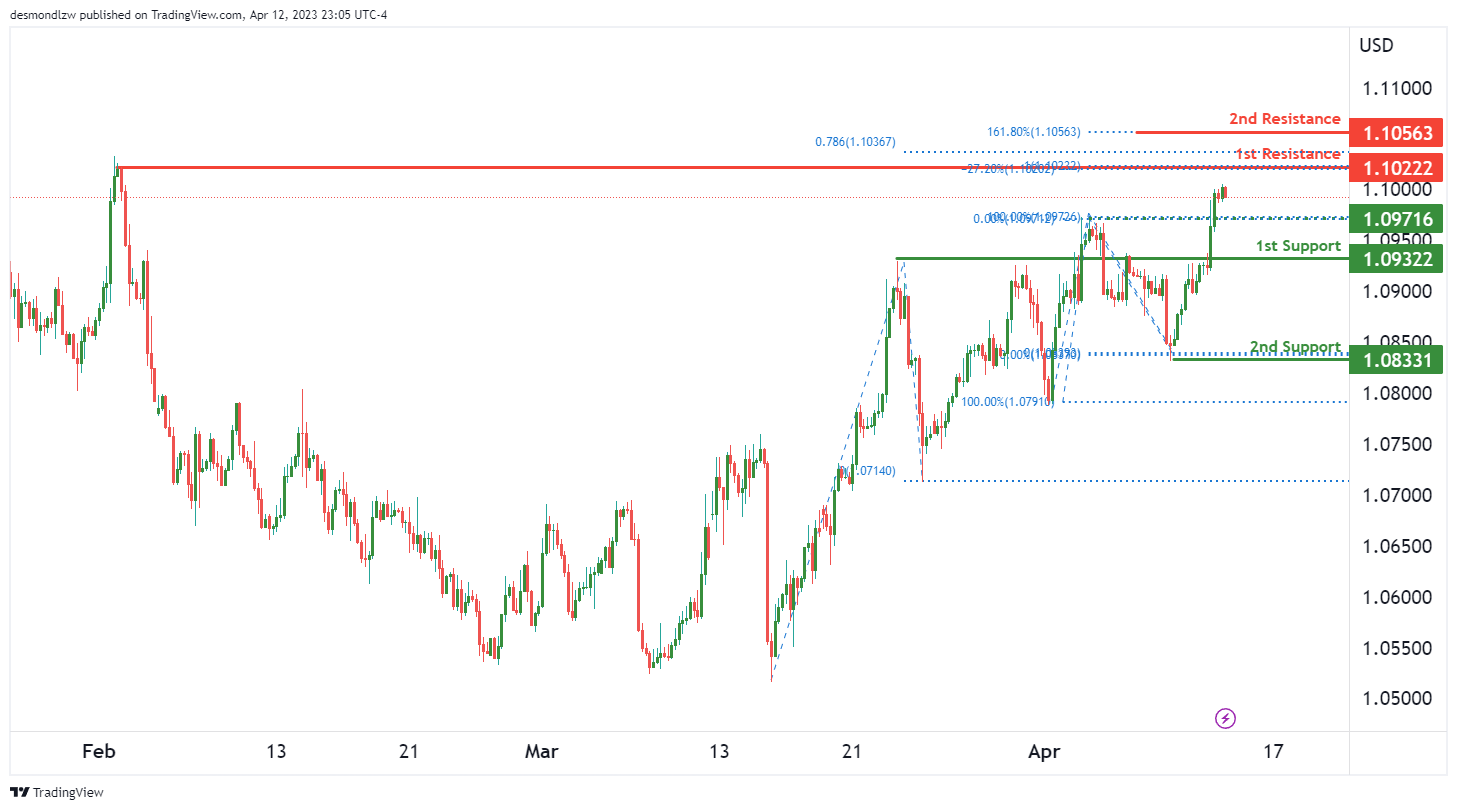
The EUR/USD chart is currently bullish, which suggests that we may see further price increases in the near future. At the time of writing, the price is trading around 1.0985.
If the bullish trend continues, the price could potentially make a bullish continuation towards the 1st resistance level of 1.1022. This resistance level is a swing high resistance and also coincides with a -27% Fibonacci Expansion level, which makes it a strong level of resistance.
If the price breaks through the 1st resistance level, the next resistance level is the 2nd resistance level at 1.1056, which is a swing high resistance level that marks the high point of a previous bullish trend. This level also coincides with a 161.80% Fibonacci Extension level, which makes it a strong level of resistance.
On the support side, we have the 1st support level at 1.0932, which is an overlap support level. This level has been tested multiple times before and has shown strength in holding the price up.
If the price were to drop further, the next support level is the 2nd support level at 1.0833, which is a swing low support level that the price has bounced off multiple times in the past. This level is also a good level of support, as it has been tested multiple times before.
It’s worth noting that there is an intermediate support level at 1.0971, which is a pullback support level. This level may provide a temporary halt to any downward momentum that the price may experience.
GBP/USD:
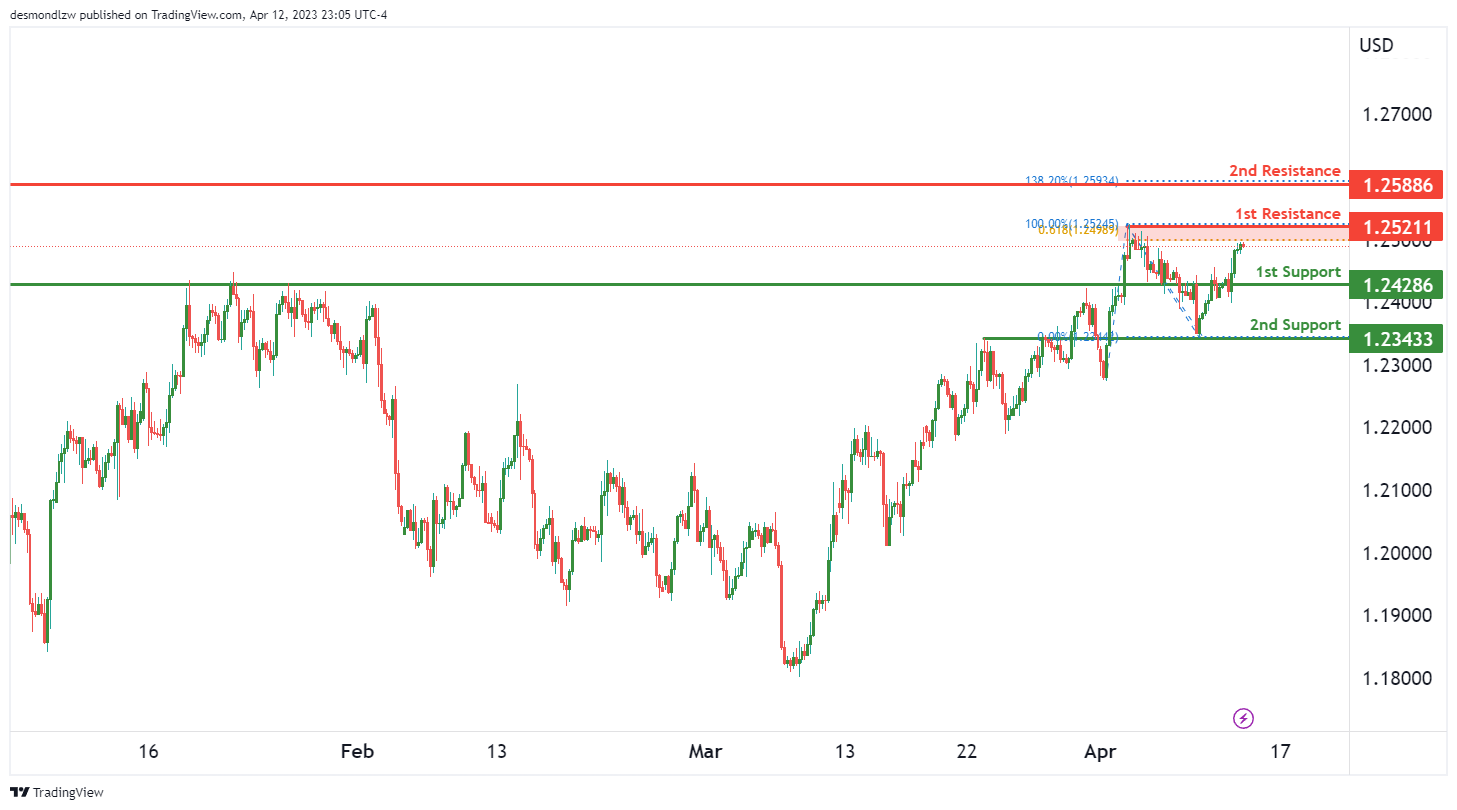
The GBP/USD chart is currently bearish, which suggests that we may see further price drops in the near future. At the time of writing, the price is trading around 1.2485.
If the bearish trend continues, the price could potentially make a bearish reaction off the 1st resistance level of 1.2521 and drop to the 1st support level of 1.2428. This support level is an overlap support level and has shown strength in holding the price up.
If the price were to break through the 1st support level, the next support level is the 2nd support level at 1.2343, which is also an overlap support level that the price has bounced off multiple times in the past.
On the resistance side, we have the 1st resistance level at 1.2521, which is a pullback resistance level and also coincides with a 61.80% Fibonacci Projection level. This makes it a strong level of resistance that the price may struggle to break through.
If the price were to break through the 1st resistance level, the next resistance level is the 2nd resistance level at 1.2588, which is a swing high resistance level that marks the high point of a previous bullish trend. This level also coincides with a 138.20% Fibonacci Extension level, which makes it a strong level of resistance.
USD/CHF:
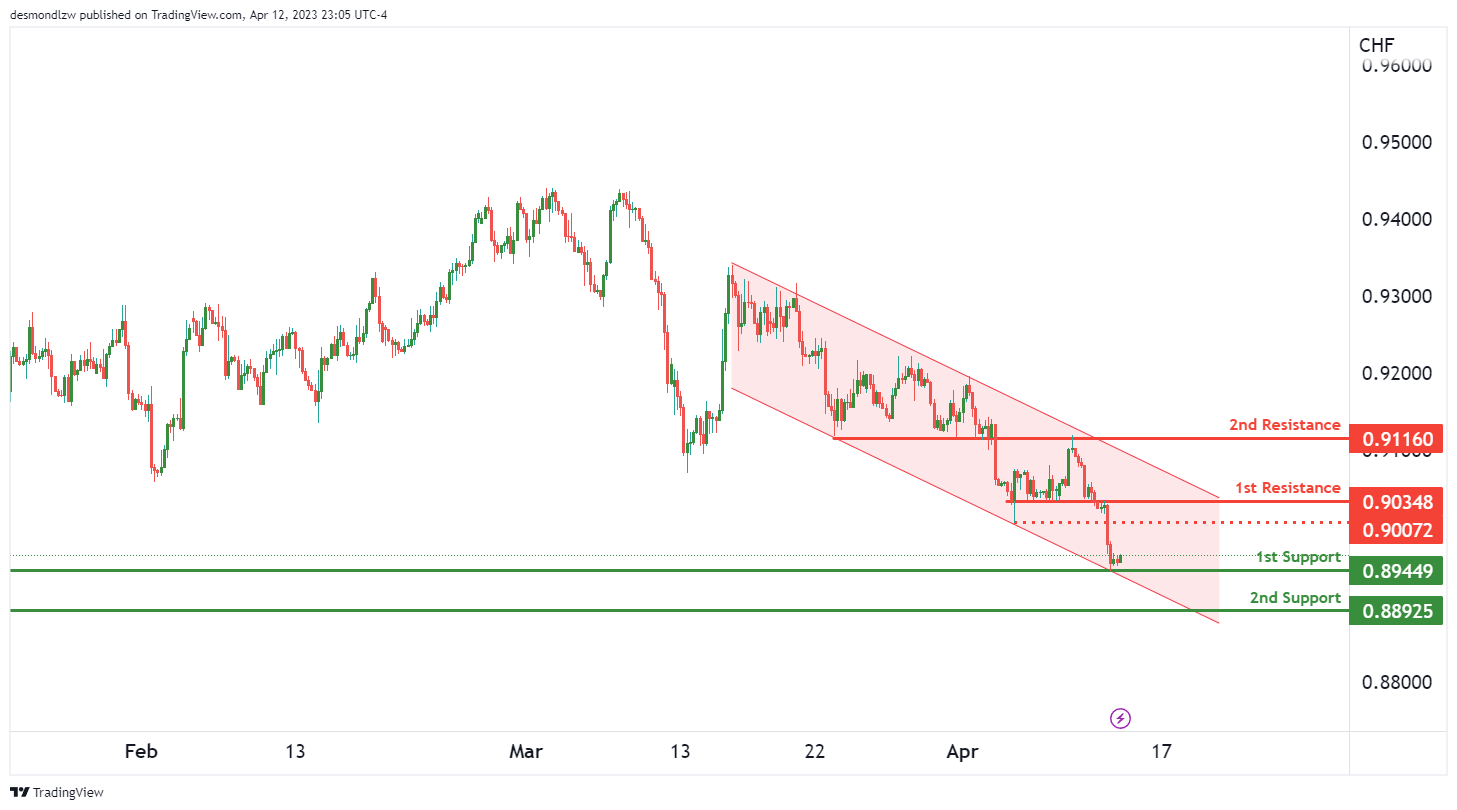
The USD/CHF chart is currently bearish, and this is supported by the fact that the price is in a bearish descending channel. At the time of writing, the price is trading around 0.8985.
If the bearish trend continues, the price could potentially make a bearish break off the 1st support level of 0.8944 and drop towards the 2nd support level of 0.8892. This support level is a swing low support level that the price has bounced off multiple times in the past.
If the price were to break through the 1st support level, it may further support the bearish momentum of the chart, especially given that the price is already in a bearish channel. This could potentially result in a drop towards the 2nd support level at 0.8892, which is also a strong level of support that the price may bounce off of.
On the resistance side, we have the 1st resistance level at 0.9034, which is a pullback resistance level. This level may provide a temporary halt to any upward momentum that the price may experience.
If the price were to break through the 1st resistance level, the next resistance level is the 2nd resistance level at 0.9116, which is an overlap resistance level that the price has struggled to break through in the past.
It’s worth noting that there is also an intermediate resistance level at 0.9007, which is a pullback resistance level. This level may provide a temporary halt to any upward momentum that the price may experience.
USD/JPY:
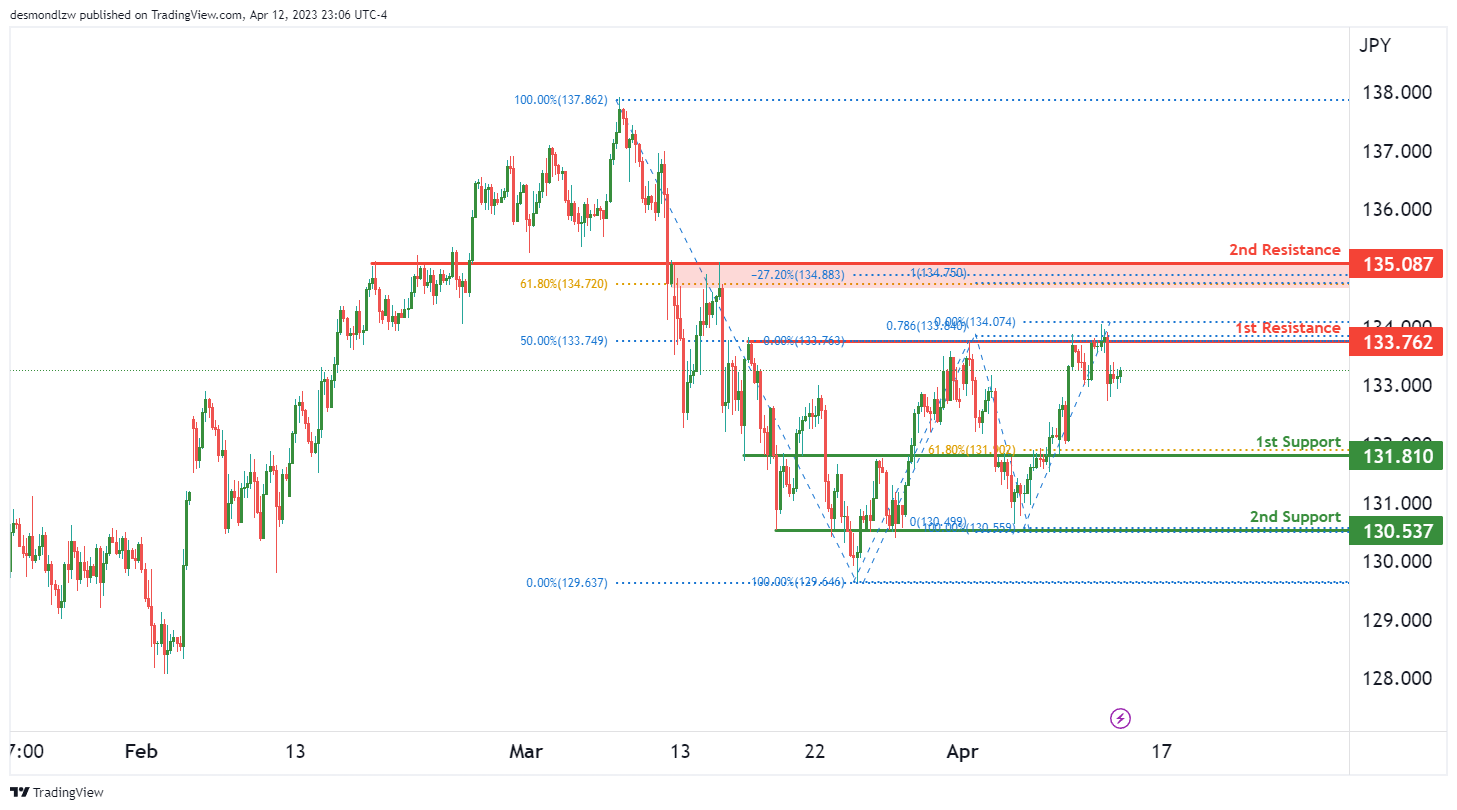
The USD/JPY chart currently shows bullish momentum, with the potential for further price rises in the near future. The current trading price is around 132.68.
However, there is also a possibility for a bearish continuation towards the 1st support level of 131.81. This support level has been tested multiple times in the past and is considered a strong level of support. Additionally, it coincides with a 61.80% Fibonacci Retracement level, further strengthening its significance.
If the price were to break through the 1st support level, the next level of support is the 2nd support level at 130.53. This is another overlap support level that the price has bounced off of in the past.
On the resistance side, we have the 1st resistance level at 133.76, which is an overlap resistance level that has proven to be difficult for the price to break through in previous attempts. This level also coincides with a 50% Fibonacci Retracement level, making it a strong level of resistance that may prevent the price from continuing its bullish momentum.
If the price were to break through the 1st resistance level, the next resistance level is the 2nd resistance level at 135.08. This is another overlap resistance level that the price may struggle to break through, as it also coincides with a 61.80% Fibonacci Retracement level.
AUD/USD:
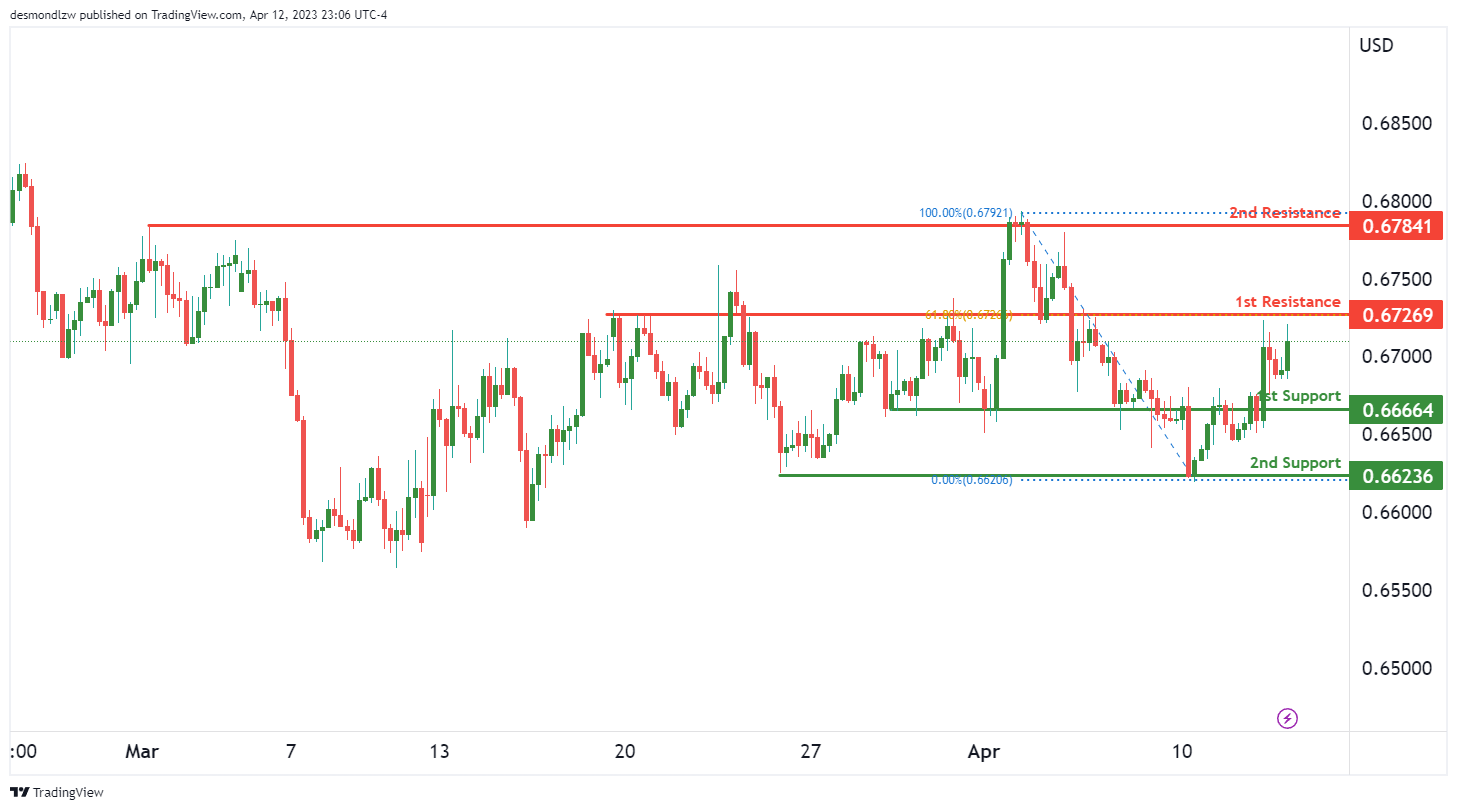
The AUD/USD chart is currently bullish, which suggests that we may see further price rises in the near future. At the time of writing, the price is trading around 0.6708.
There is a potential for a bullish continuation towards the 1st resistance level of 0.6726. This resistance level is an overlap resistance level that the price has struggled to break through in the past. Additionally, it coincides with a 61.80% Fibonacci Retracement level, making it a strong level of resistance that may be difficult for the price to break through.
If the price were to break through the 1st resistance level, the next resistance level is the 2nd resistance level at 0.6784, which is a multi-swing high resistance level. This level does not have any significant Fibonacci levels coinciding with it, but it has been a strong level of resistance in the past.
On the support side, we have the 1st support level at 0.6666, which is an overlap support level that the price has bounced off of in the past. The next level of support is the 2nd support level at 0.6623, which is a multi-swing low support level.
NZD/USD:
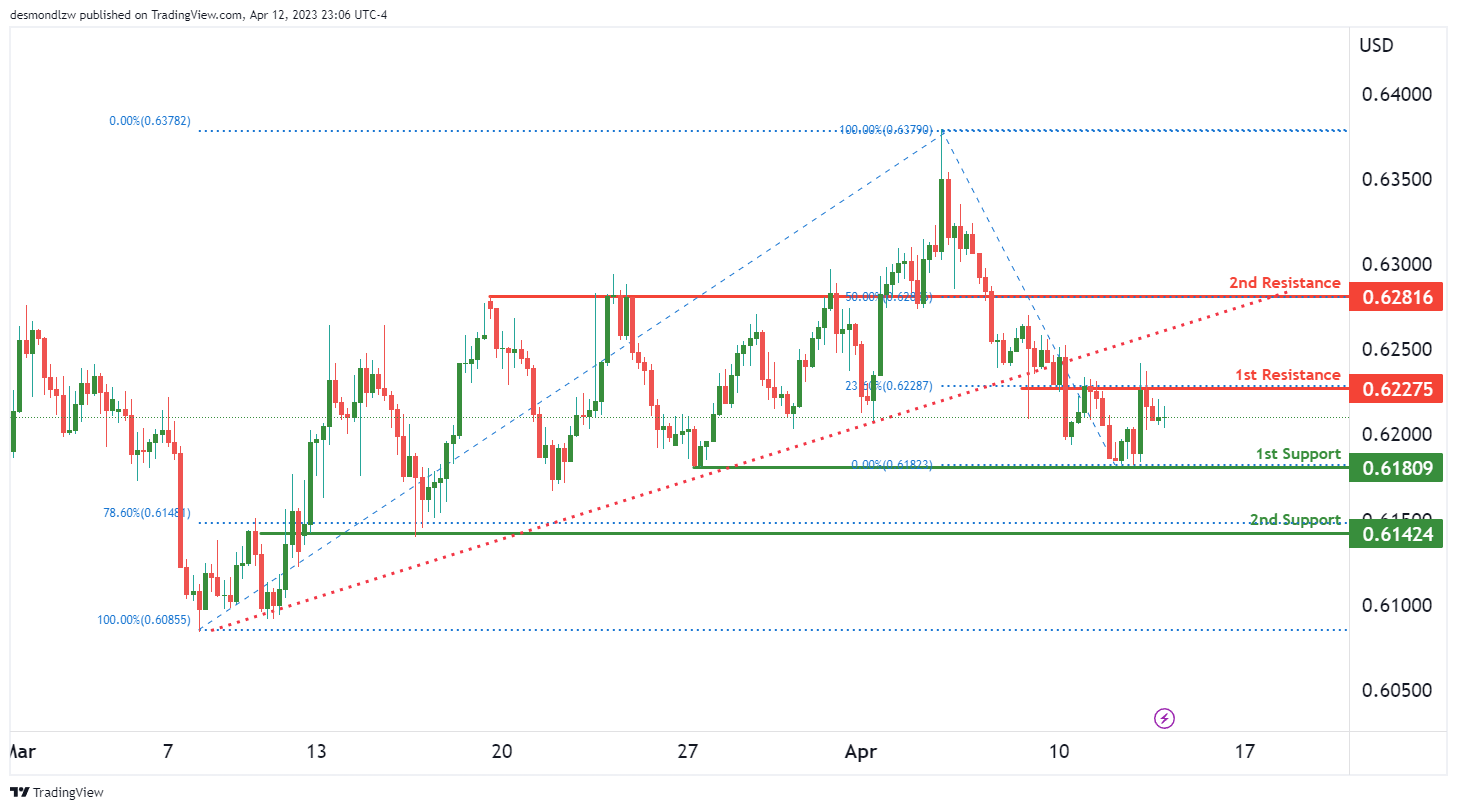
The overall momentum of the NZD/USD chart is currently bearish, triggered by a break below an ascending support line.
There is a potential for a bearish continuation towards the 1st support level of 0.6180. This support level is a multi-swing low support level, and if the price were to break through it, we could see a further drop towards the 2nd support level of 0.6142. This level is also an overlap support level and coincides with a 78.60% Fibonacci Retracement level.
On the resistance side, we have the 1st resistance level at 0.6227, which is an overlap resistance level. This level coincides with a 23.60% Fibonacci Retracement level, making it a relatively weak level of resistance. The next resistance level is the 2nd resistance level at 0.6281, which is an overlap resistance level and coincides with a 50% Fibonacci Retracement level.
USD/CAD:
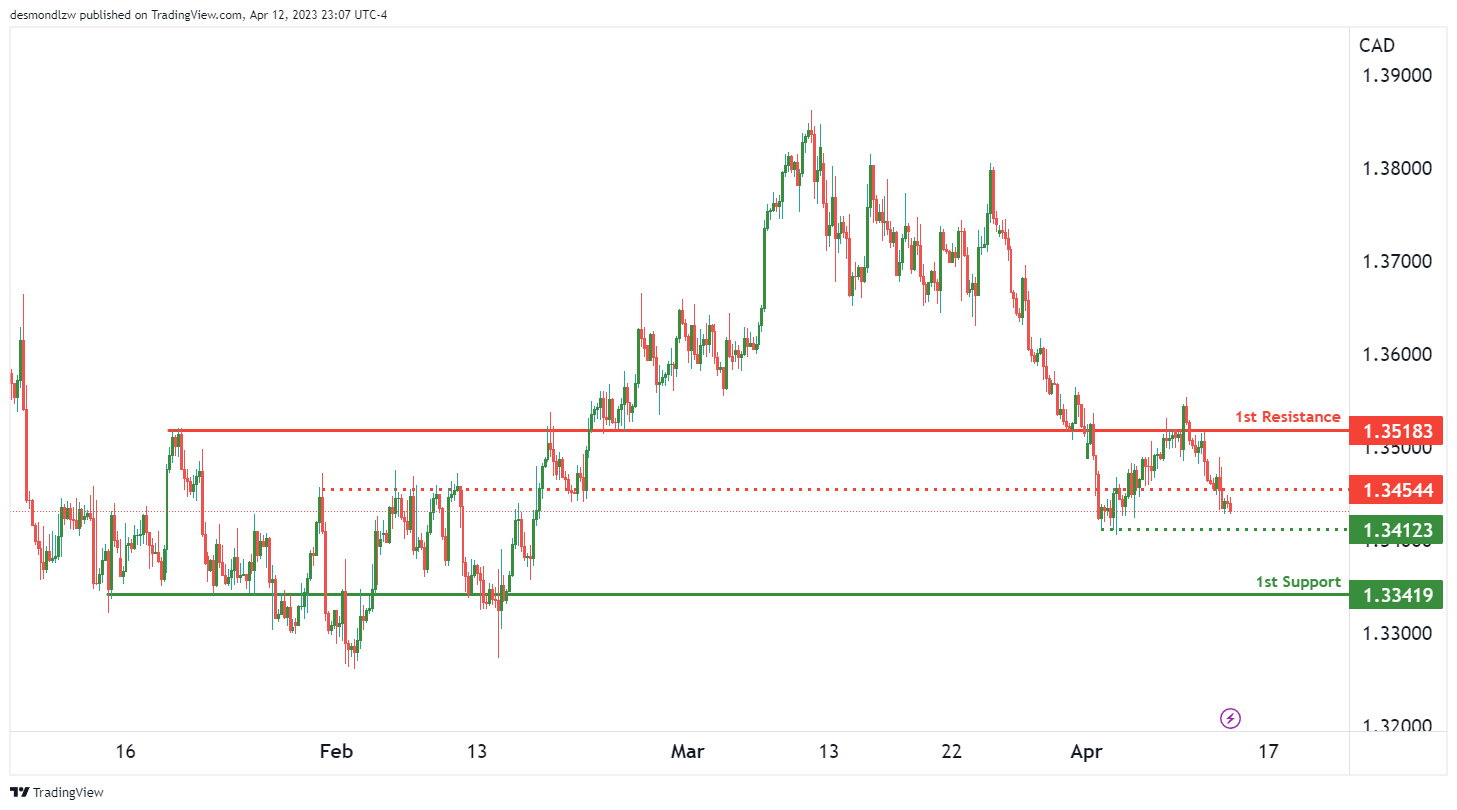
The USD/CAD chart is currently showing a bearish momentum, suggesting that we may see further price declines in the near future. At the time of writing, the price is trading around 1.3442.
There could potentially be a bearish continuation towards the 1st support level at 1.3341. This support level is an overlap support level that the price has bounced off multiple times in the past.
If the price were to break through the 1st support level, the next support level is the intermediate support level at 1.3412, which is a multi-swing low support level that the price has also bounced off multiple times in the past.
On the resistance side, we have the 1st resistance level at 1.3518, which is an overlap resistance level that the price has struggled to break through in the past.
If the price were to break through the 1st resistance level, the next resistance level is the intermediate resistance level at 1.3454, which is another overlap resistance level that the price may struggle to break through.
DJ30:
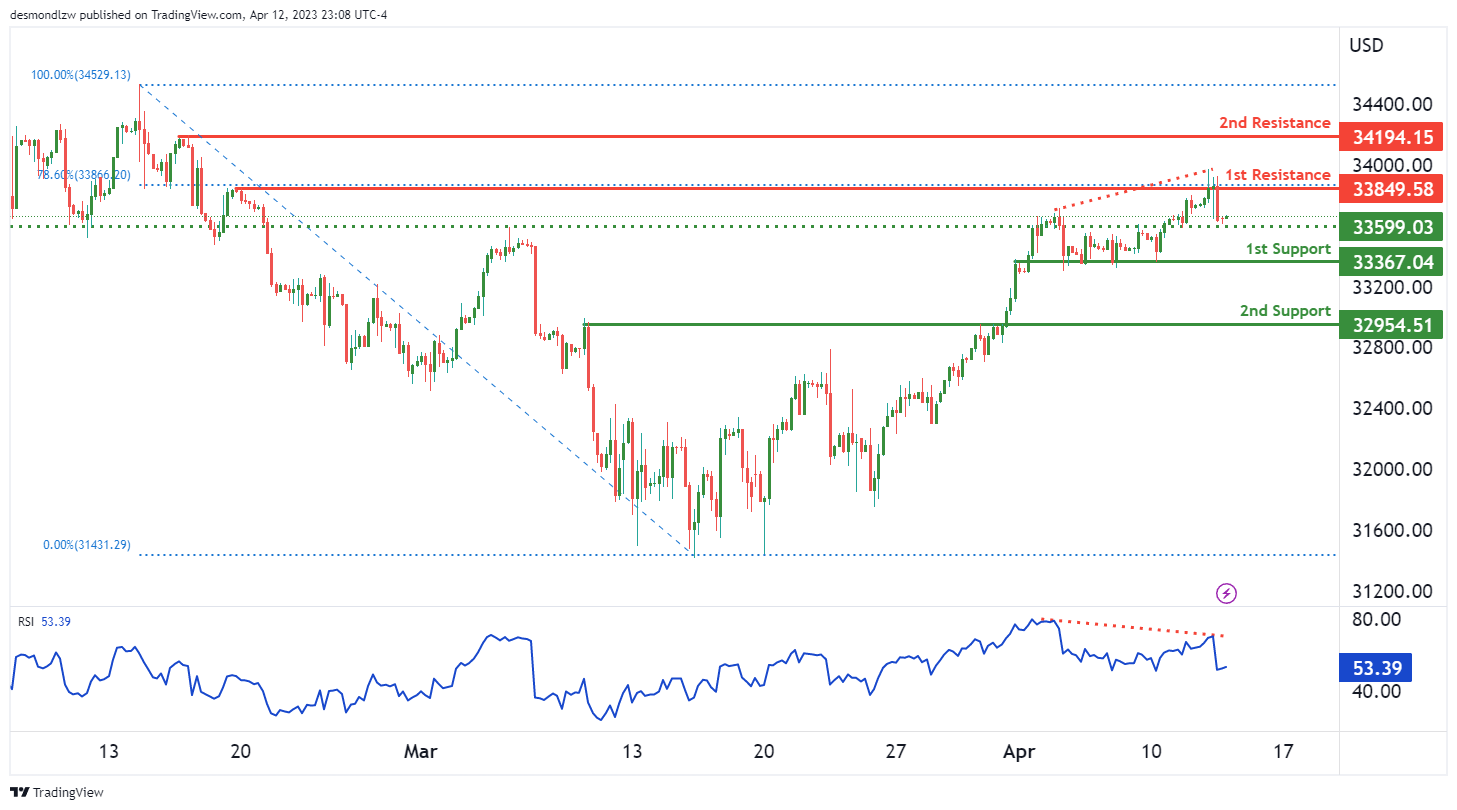
The DJ30 chart is currently showing bearish momentum, indicating a potential continuation towards the 1st support level at 33367.04. This support level is a pullback support and if price were to break below it, the next support level is the 2nd support at 32954.51, which is also a pullback support.
On the resistance side, we have the 1st resistance level at 33849.58, which is a multi-swing high resistance level that the price has struggled to break through in the past. This resistance level coincides with a 78.60% Fibonacci retracement level, making it a strong level of resistance that the price may struggle to break through. If price were to break above the 1st resistance level, the next resistance level is the 2nd resistance level at 34194.15, which is a swing high resistance level.
In addition, RSI is displaying bearish divergence versus price, suggesting that a reversal might occur soon. This indicates a potential for a bearish reversal in the near future.
There is an intermediate support level at 33599.03, which is an overlap support level that the price has bounced off multiple times in the past.
GER30:
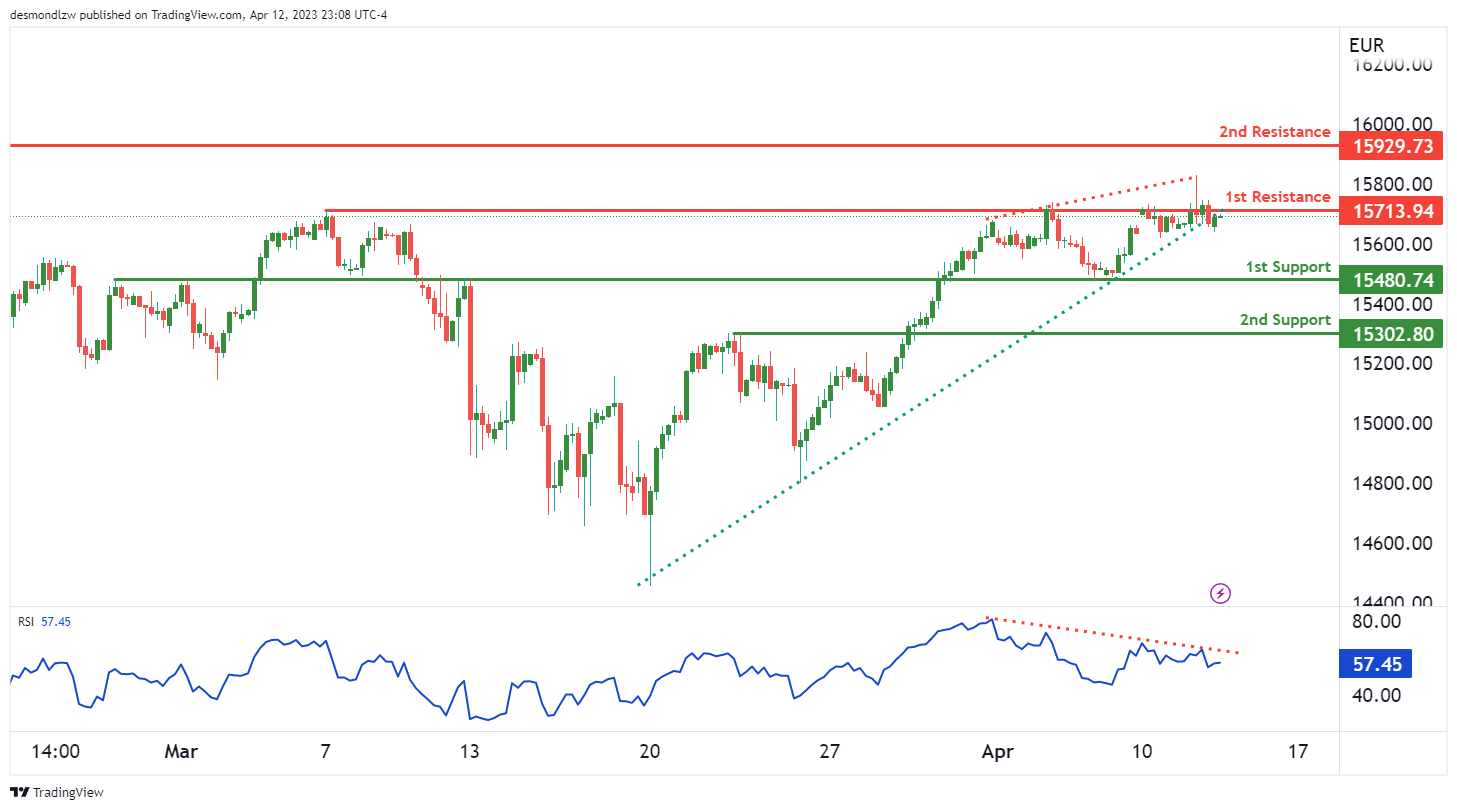
The GER30 chart is currently showing bearish momentum, as it broke below an ascending support line, suggesting that we may see further price declines in the near future.
Price could potentially react bearishly off the 1st resistance level of 15713.94 and drop towards the 1st support level of 15480.74. The 1st support level is an overlap support level that has held the price multiple times in the past, making it a strong level of support. The 2nd support level is at 15302.80, which is a pullback support level and could also provide some support if the price were to continue to drop.
On the resistance side, we have the 1st resistance level at 15713.94, which is a multi-swing high resistance level that the price has struggled to break through in the past. The 2nd resistance level is at 15929.73, which is a swing high resistance level.
Additionally, the RSI is displaying bearish divergence versus price, suggesting that a reversal might occur soon, which could further support the bearish momentum on the GER30 chart.
BTC/USD:
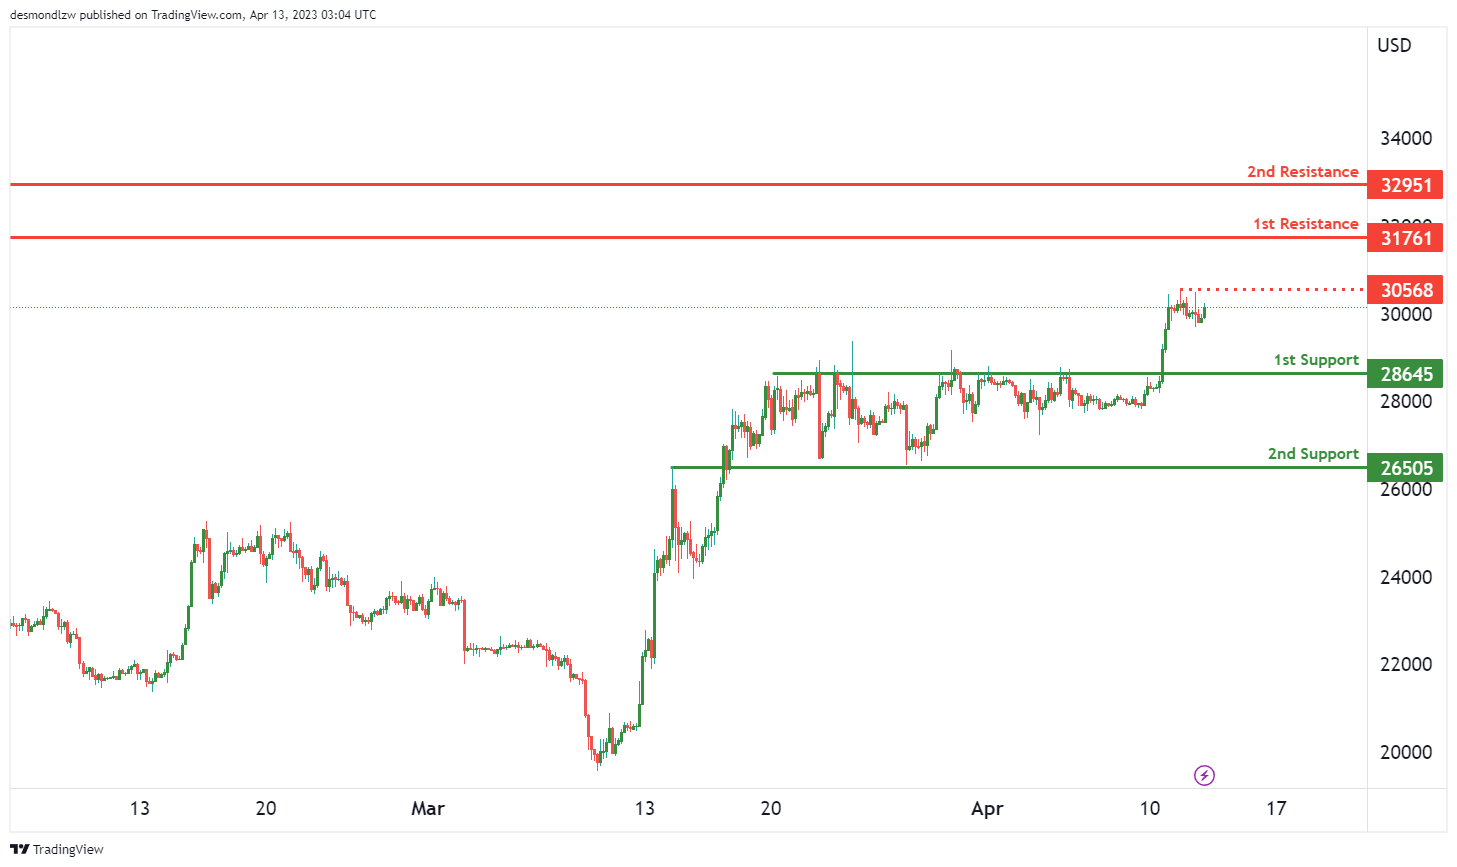
The BTC/USD chart is currently showing a bullish momentum, suggesting that we may see further price rises in the near future. The first support level is at 28645, which is a pullback support level that the price has bounced off multiple times in the past. The second support level is at 26505, which is an overlap support level that the price has also bounced off multiple times in the past.
On the resistance side, we have the first resistance level at 31761, which is a swing high resistance level. If the price were to break through the first resistance level, the next resistance level is the second resistance level at 32951, which is also a swing high resistance level.
In addition, there is an intermediate resistance level at 30568, which is a multi-swing high resistance level. If the price were to break through this level, it could potentially trigger a stronger bullish acceleration towards the first resistance level.
US500
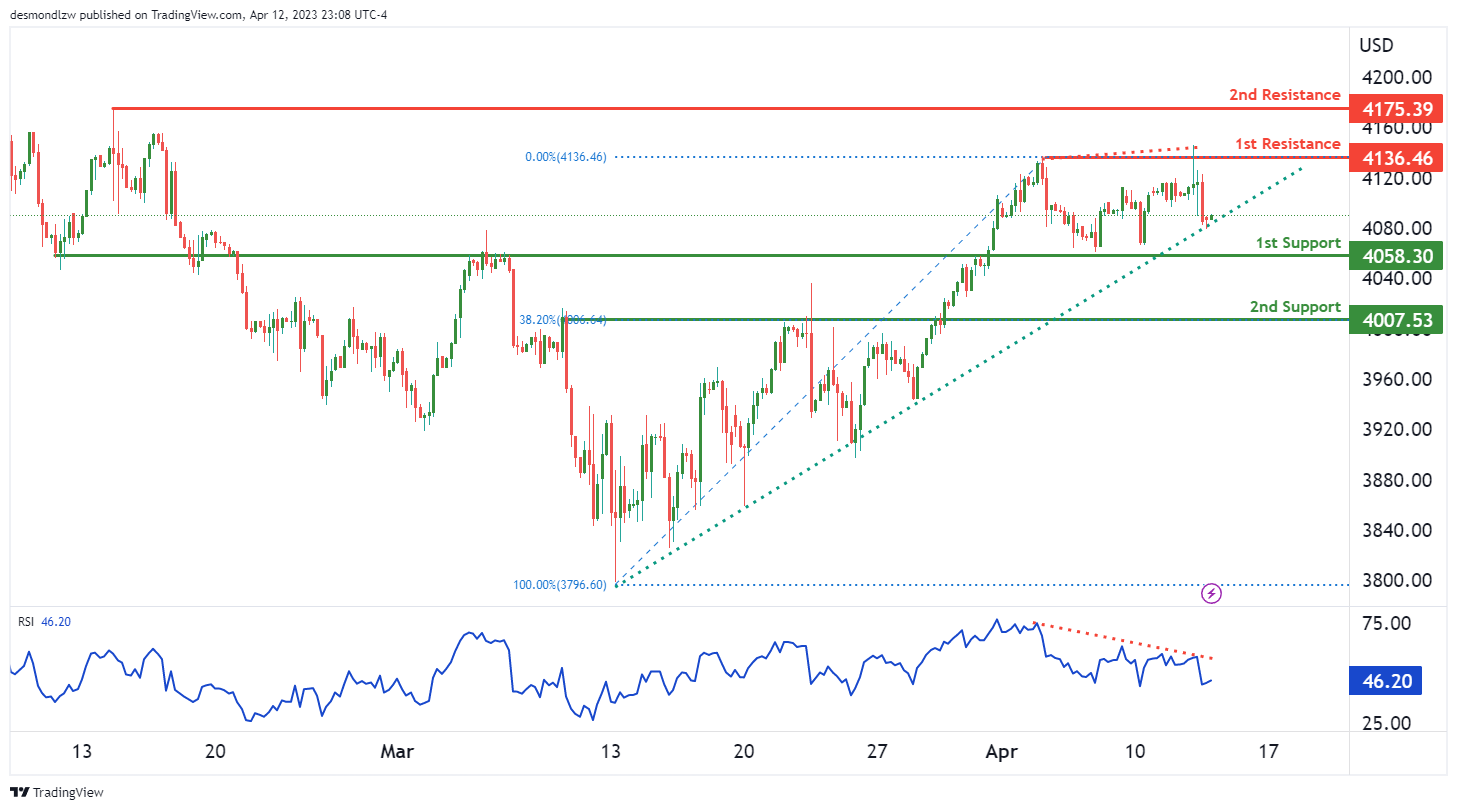
US500 shows signs of bullish momentum as it continues to trade above a major ascending trend line. This suggests that further bullish moves may be on the horizon. However, RSI is displaying bearish divergence versus price, which could potentially signal a reversal in the near future.
Currently, the price could potentially make a bullish continuation towards the 1st resistance level at 4136.46. The 1st support level is located at 4058.30 and is a strong overlap support that also coincides with an ascending trend line, further strengthening its significance. In the event of a pullback, the 2nd support level at 4007.53 could provide additional support as it is also an overlap support.
On the other hand, the 1st resistance level at 4136.46 is a multi-swing high resistance that could potentially halt the bullish move. If the price manages to break through this level, the next level to watch out for is the 2nd resistance level at 4175.39, which is a swing high resistance.
ETH/USD:
The overall momentum of the ETH/USD chart is bullish, with the price currently above a major ascending trend line, suggesting further bullish momentum is on the cards.
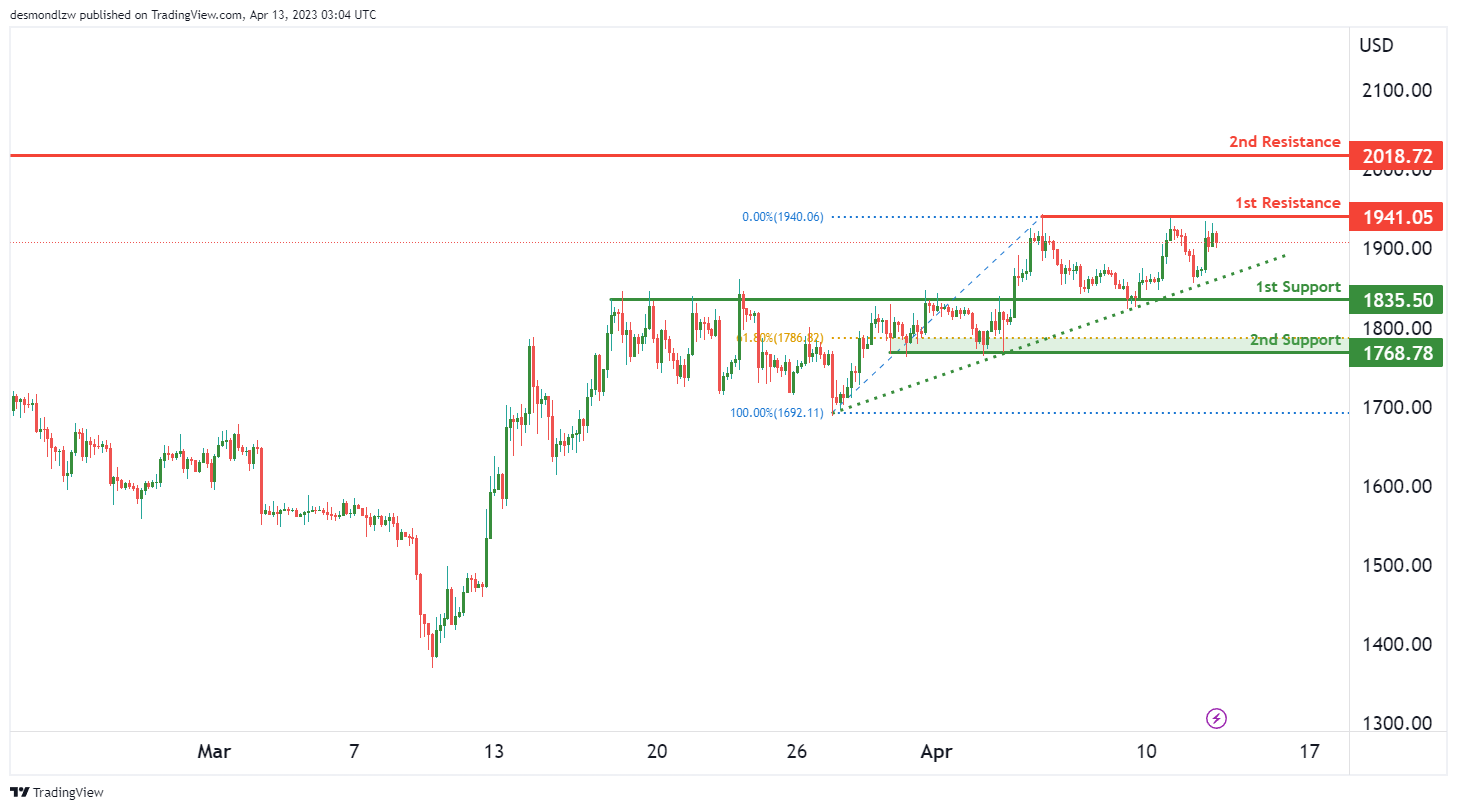
Looking at the chart, we can see that the price could potentially make a bullish continuation towards the first resistance level at 1941.05. Before reaching this level, the price may find support at the first support level of 1835.50. This level is an overlap support and is also on an ascending trend line, which acts as support.
If the price were to break below the first support level, the second support level at 1768.78 may provide additional support. This level is also an overlap support and coincides with the 61.80% Fibonacci retracement level.
On the other hand, if the price were to break above the first resistance level, it may rise towards the second resistance level at 2018.72. This level is a swing high resistance level and may provide a strong resistance to the price movement.
WTI/USD:
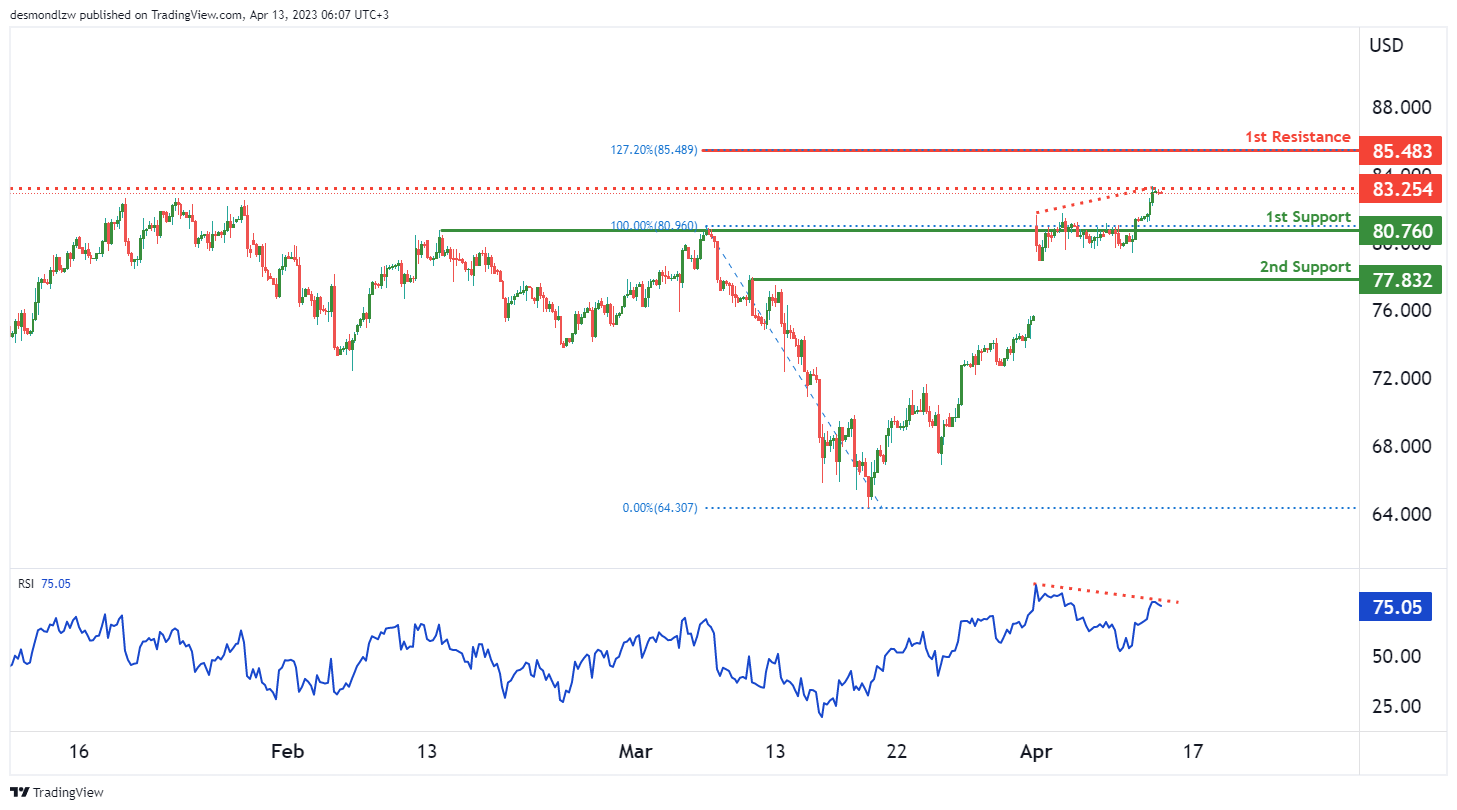
The overall momentum of WTI appears to be bearish. The price could potentially experience a bearish reaction off the first resistance and drop to the first support. The first support is at 80.76, which is an overlap support, while the second support is at 77.83, which is a swing low support. The first resistance is at 85.48, which is a swing high resistance, while the intermediate resistance is at 83.25, which is also a swing high resistance.
Additionally, RSI is displaying bearish divergence versus the price, suggesting that a reversal might occur soon. Overall, it appears that the price could potentially continue to drop towards the first support level, especially given the bearish momentum on the chart. Traders should keep an eye on these key support and resistance levels and monitor any potential reversals or breakouts that could signal a shift in momentum.
XAU/USD (GOLD):
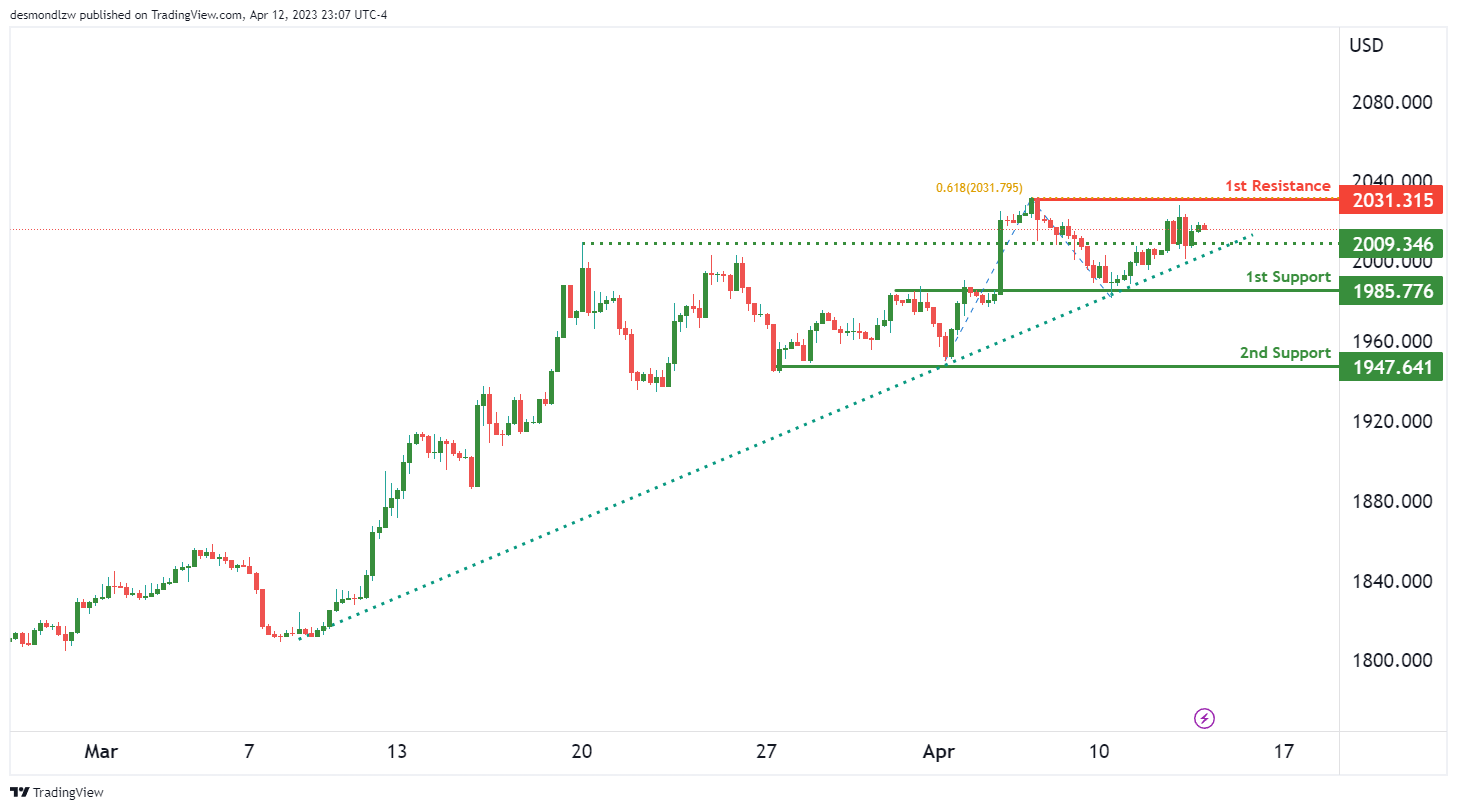
Gold has been displaying bullish momentum on the chart, with the price above a major ascending trend line. This suggests further bullish momentum could be on the cards for XAU/USD.
If the bullish momentum continues, the price could potentially move towards the 1st resistance at 2031.31. This level is an important swing high resistance level, and coincides with the 61.80% Fibonacci projection.
In terms of support levels, the 1st support level is at 1985.77. This level is an overlap support level, and is also on the ascending trend line which acts as support. The 2nd support level is at 1947.64, which is a swing low support level.
Additionally, there is an intermediate support level at 2009.34, which is also an overlap support level.
UK economy stalls in Feb as GDP growth misses expectations
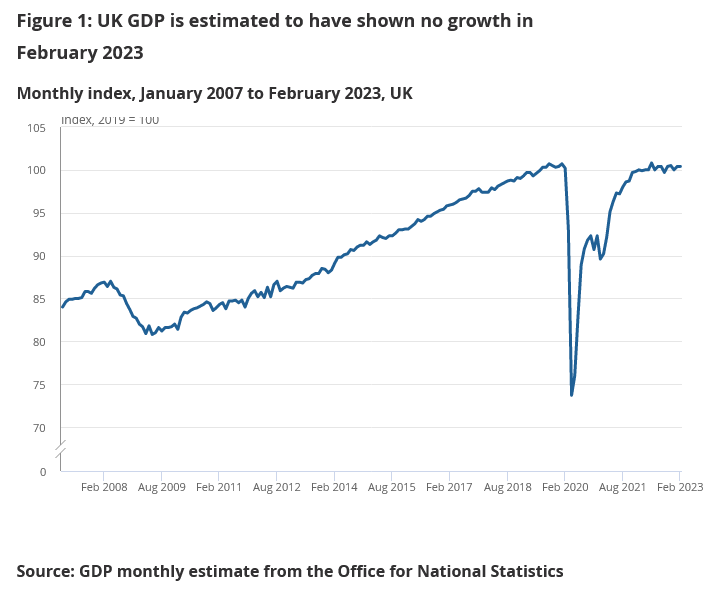
UK economy experienced a slowdown in February, with no monthly growth (0.0% mom) in GDP, falling short of the 0.1% mom growth expected by analysts. The disappointing result follows a 0.4% mom growth in January. The data reveals that services contracted by -0.1% mom after a 0.7% mom growth in January, while production fell by -0.2% mom following a -0.5% mom contraction in January. In contrast, construction sector saw growth of 2.4% mom, rebounding from a -1.7% mom contraction in January.
In the three months to February, GDP grew by a mere 0.1% when compared to the three months to November. During this period, services grew by 0.1%, production declined by -0.2%, and construction experienced growth of 0.9%. The lackluster performance raises concerns about the overall health of the UK economy.
Also published, industrial production came in at -0.2% mom, -3.1% yoy, versus expectation o f0.3% mom, -3.7% yoy. Manufacturing production was at 0.0%mom, -2.4% yoy, versus expectation of 0.3% mom, -4.7% yoy. Goods trade deficit narrowed slightly to GBP -17.5B, versus expectation of GBP -17.0B.
AUD/USD Daily Report
Daily Pivots: (S1) 0.6653; (P) 0.6688; (R1) 0.6728; More...
AUD/USD's recovery from 0.6619 continues today but stays well below 0.6792 resistance. Intraday bias remains neutral for the moment. Risk stays on the downside with 0.6792 resistance intact. Below 0.6619 will bring retest of 0.6563 low first. sustained break of 0.6563 support will resume the decline from 0.7156 to 61.8% projection of 0.7156 to 0.6563 from 0.6792 at 0.6426.
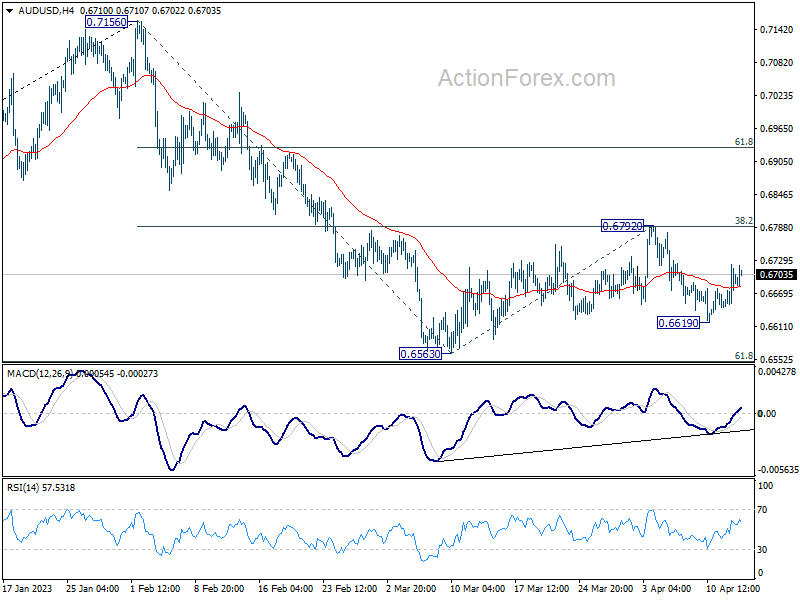
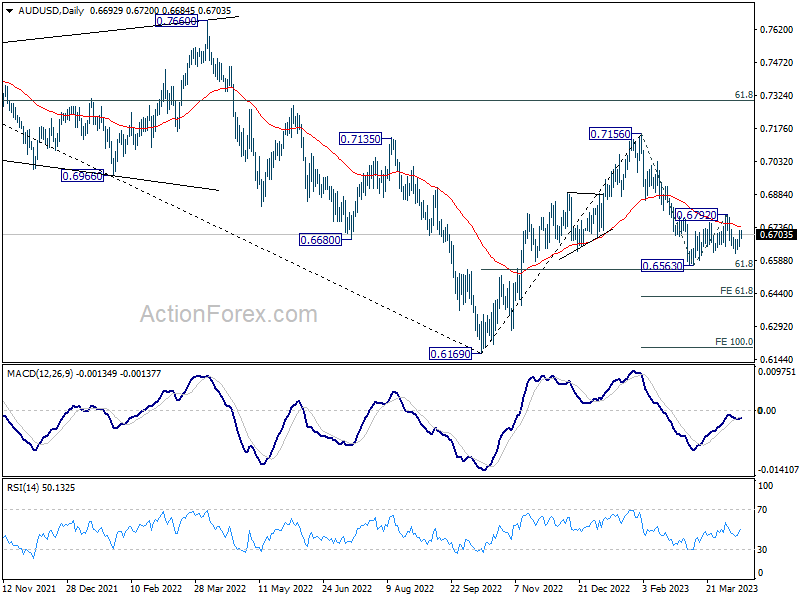
In the bigger picture, as long as 61.8% retracement of 0.6169 to 0.7156 at 0.6546 holds, the decline from 0.7156 is seen as a correction to rally from 0.6169 (2022 low) only. Another rise should still be seen through 0.7156 at a later stage. However, sustained break of 0.6546 will raise the chance of long term down trend resumption through 0.6169 low.
Aussie Lifted Slightly by Job Data, Dollar Loss Limited by Hawkish FOMC Minutes
Dollar remains somewhat soft in the Asian trading session, though it hasn't seen any follow-through selling. Hawkish FOMC minutes have partially offset the impact of consumer inflation data on the currency. The broader financial markets also lack a clear direction, as US stock indexes closed lower after initial rally. Benchmark treasury yields mostly reversed their initial losses, while gold remains above 2000 level but struggles to break through recent high. Market participants will look for further guidance from upcoming data to adjust their expectations of Fed rate path, as Fed fund futures continue to suggest a near 70% chance of another 25 basis point hike in May.
In the currency markets, Australian Dollar is slightly buoyed by stronger-than-expected job data, while Canadian Dollar appears unfazed by BoC's decision to keep interest rates unchanged. Japanese Ten, Swiss Franc, and Euro are today's weaker currencies so far, but most major pairs and crosses are currently confined within yesterday's trading range. For the week, Yen is the worst performer, followed by New Zealand Dollar and US Dollar, while Swiss franc leads, followed by the Euro and Canadian dollar.
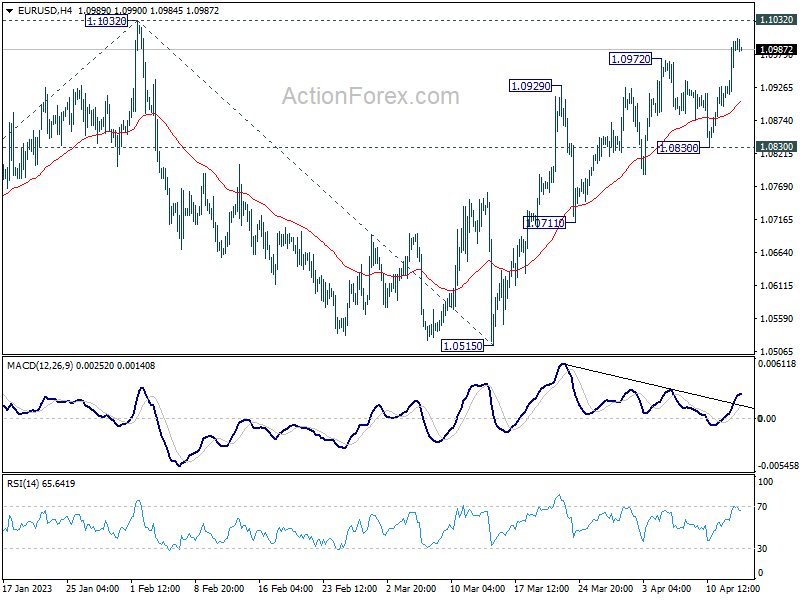
Technically, a key focus remains on the EUR/USD pair's reaction to the 1.1032 resistance level. The currency pair is building upside momentum, as evidenced by the 4H MACD. However, it remains uncertain if this momentum is enough to break through the resistance and resume the larger uptrend from 2022 low at 0.9534. A rejection by 1.1032 followed by break of 1.0830 would signal that the correction pattern from 1.1032 is set to extend with another falling leg, back towards the 1.0515 support level, before eventually staging an upside breakout.
In Asia, at the time of writing, Nikkei is up 0.22%. Hong Kong HSI is down -0.46%. China Shanghai SSE is up 0.02%. Singapore Strait Times is up 0.02%. Japan 10-year JGB yield is up 0.0011 at 0.467. Overnight, DOW dropped -0.11%. S&P 500 dropped -0.41%. NASDAQ dropped -0.85%. 10-year yield dropped -0.013 to 3.421.
FOMC minutes reveal larger rate hike considered, banking developments held back aggressive action
FOMC minutes from the March 21-22 meeting revealed that committee members acknowledged inflation remaining significantly above the 2% target and a tight labor market, suggesting that "additional policy firming may be appropriate." Some participants even considered a 50 basis point increase in the target range, but due to potential banking-sector developments impacting financial conditions and economic activity, they opted for a smaller increment.
The minutes note that several participants contemplated keeping the target range steady to allow more time to assess the economic effects of recent banking-sector developments and the cumulative tightening of monetary policy. However, due to Fed's actions in coordination with other government agencies, which helped stabilize the banking sector, they deemed a 25 basis point increase appropriate in order to address elevated inflation and stay committed to the 2% longer-run goal.
The Committee agreed to consider recent banking developments in future monetary policy decisions, focusing on how they may affect employment, inflation, and the risks surrounding the outlook.
BoJ Ueda emphasizes divergent inflation path in Japan, pledges continued monetary easing
In the G7 central bank chief briefing in Japan, BoJ Governor Kazuo Ueda underscored the unique inflation situation in Japan compared to other countries. While elevated inflation rates are affecting many countries, Japan's price gains are expected to slow down to below 2%, prompting the BoJ to continue its monetary easing policies.
Ueda acknowledged the possibility of Japan falling behind the curve in addressing the risk of high inflation. However, he emphasized the importance of being more focused on the risk of inflation falling short of the 2% target. He stated, "As we guide monetary policy, it is appropriate to pay more attention to the risk of inflation undershooting 2 percent and thus moving away from the goal."
Ueda is set to have his first policy meeting on April 27-28, where he will likely further discuss Japan's distinct inflation trajectory and the country's monetary policy approach.
Australian employment grew solidly by 53k, bolstering case for more RBA tightening
Australian labor market continued to show strength in March, with employment growth significantly outperforming expectations. The strong employment data shows very few signs of weakness in the labor market, suggesting that RBA may need to resume tightening in May.
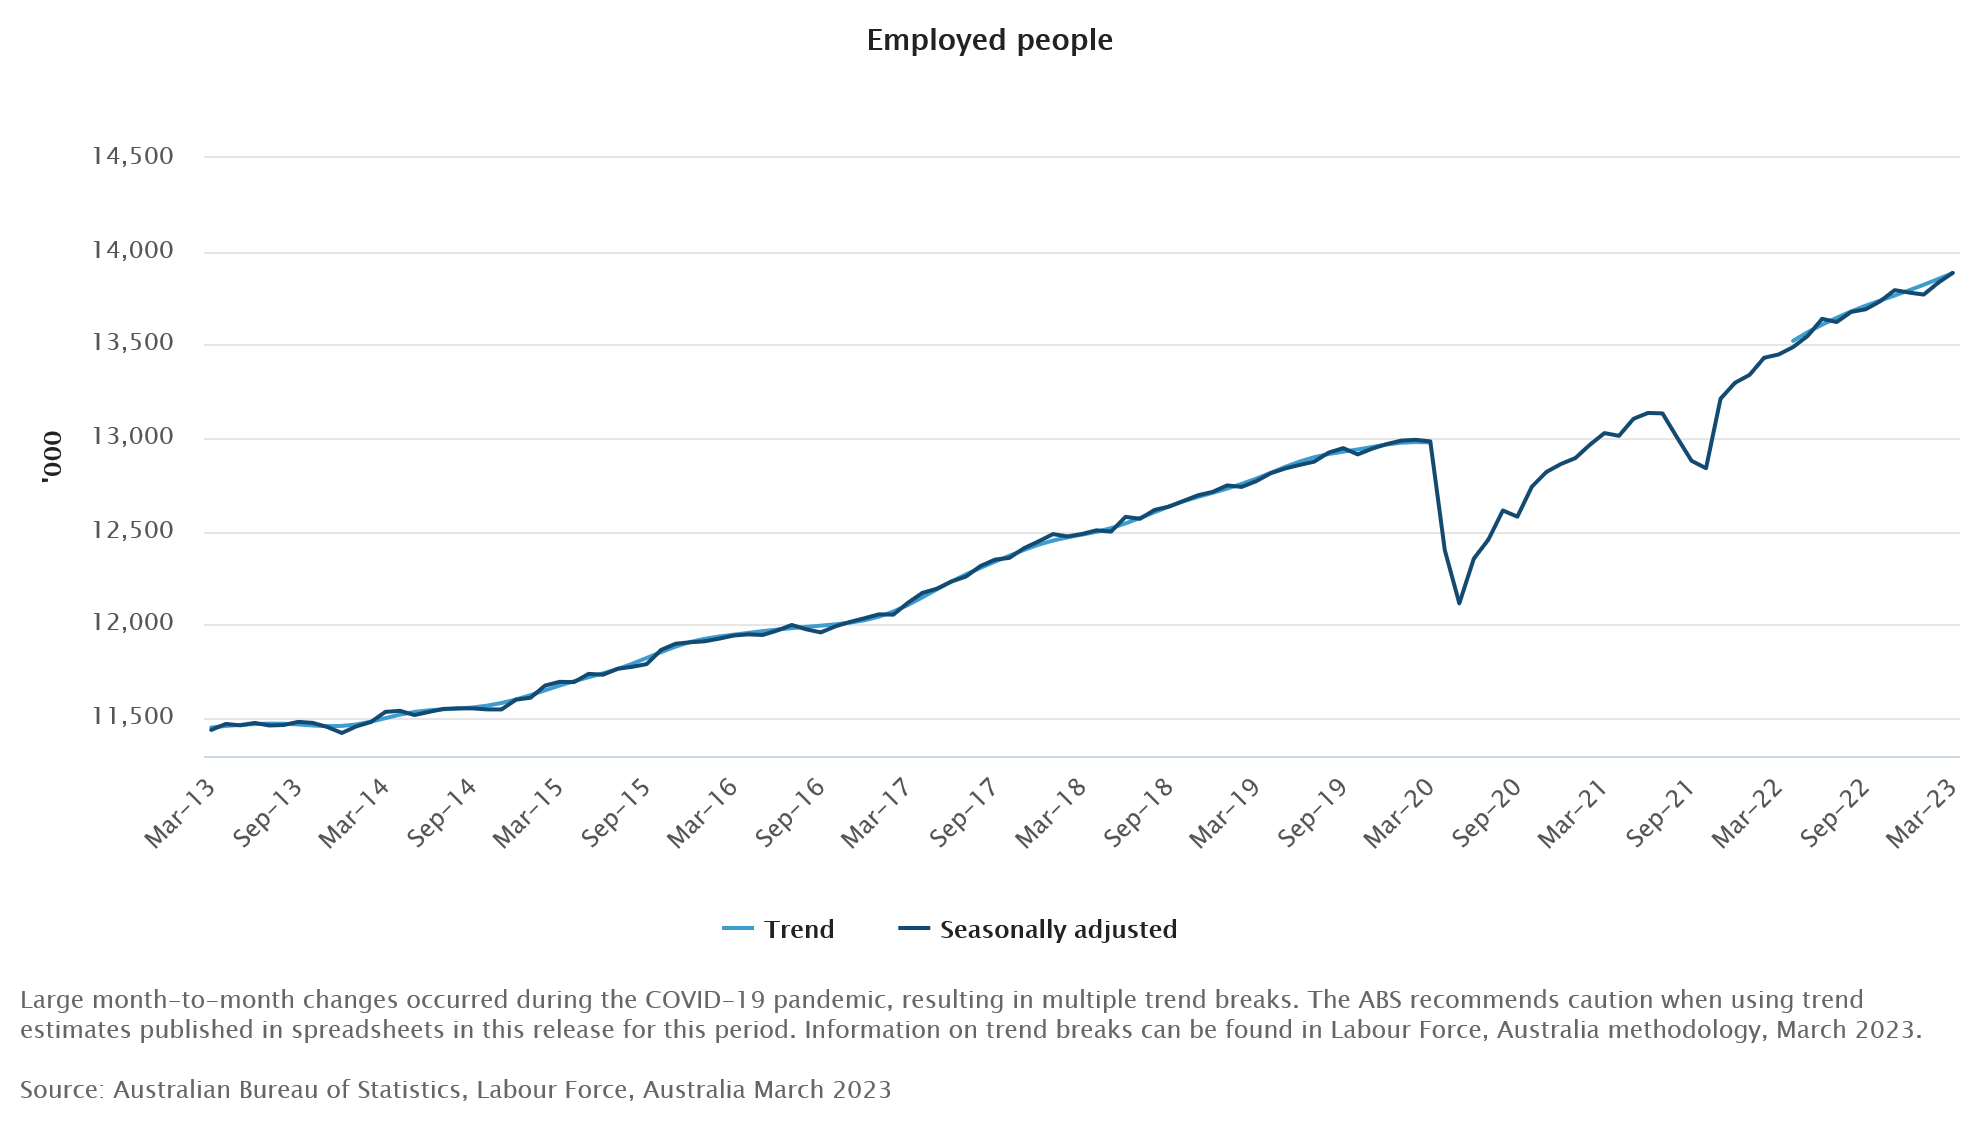
According to the today's data, employment increased by 53k in seasonally adjusted terms, well above expectation of 20k gain. Full-time jobs saw an increase of 72.2k, while part-time employment declined by -19.2k.
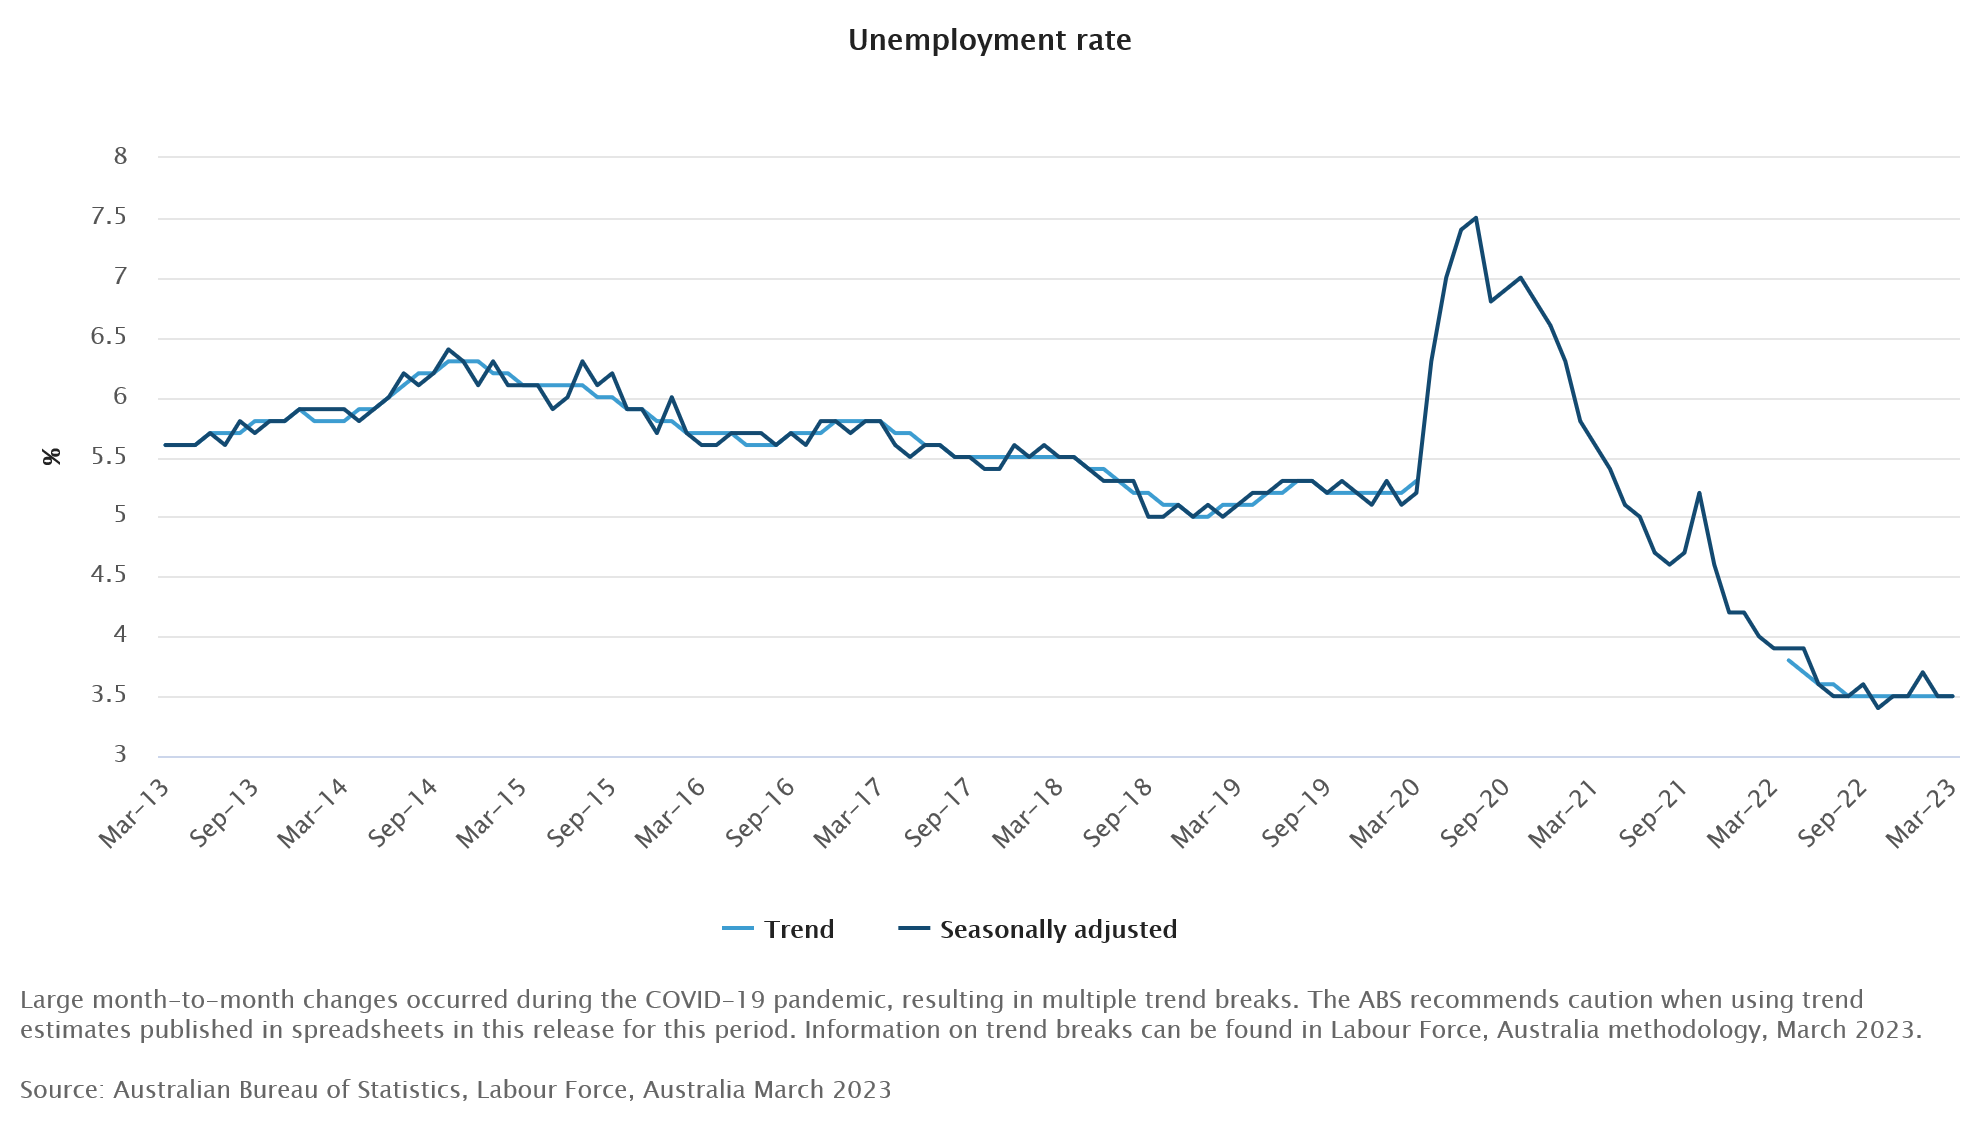
Despite expectations of a rise to 3.6%, unemployment rate remained unchanged at 3.5%. Additionally, the participation rate held steady at 66.7%, and monthly hours worked decreased by -0.2%. Lauren Ford, the ABS head of labor statistics, highlighted that the unemployment rate stayed at a near 50-year low of 3.5%.
Ford also noted that the employment-to-population ratio increased by 0.1 percentage point to 64.4%, with the participation rate remaining at 66.7%. Both indicators were close to their historical highs in November 2022, reflecting a tight labor market that has made it challenging for employers to fill the high number of job vacancies.
Looking ahead
UK GDP is the main feature in European session while production and trade balance will be released too. Eurozone too publish industrial production. Later in the day, US will release PPI and jobless claims.
AUD/USD Daily Report
Daily Pivots: (S1) 0.6653; (P) 0.6688; (R1) 0.6728; More...
AUD/USD's recovery from 0.6619 continues today but stays well below 0.6792 resistance. Intraday bias remains neutral for the moment. Risk stays on the downside with 0.6792 resistance intact. Below 0.6619 will bring retest of 0.6563 low first. sustained break of 0.6563 support will resume the decline from 0.7156 to 61.8% projection of 0.7156 to 0.6563 from 0.6792 at 0.6426.
In the bigger picture, as long as 61.8% retracement of 0.6169 to 0.7156 at 0.6546 holds, the decline from 0.7156 is seen as a correction to rally from 0.6169 (2022 low) only. Another rise should still be seen through 0.7156 at a later stage. However, sustained break of 0.6546 will raise the chance of long term down trend resumption through 0.6169 low.
Economic Indicators Update
| GMT | Ccy | Events | Actual | Forecast | Previous | Revised |
|---|---|---|---|---|---|---|
| 23:50 | JPY | Money Supply M2+CD Y/Y Mar | 2.60% | 2.50% | 2.60% | |
| 01:30 | AUD | Employment Change Mar | 53.0K | 20.0K | 64.6K | 63.6K |
| 01:30 | AUD | Unemployment Rate Mar | 3.50% | 3.60% | 3.50% | |
| 03:00 | CNY | Trade Balance (USD) Mar | 88.2B | 40.0B | 116.9B | |
| 03:00 | CNY | Exports Y/Y Mar | 14.80% | 3.10% | -6.80% | |
| 03:00 | CNY | Imports Y/Y Mar | -1.40% | 3.90% | -10.20% | |
| 06:00 | EUR | Germany CPI M/M Mar F | 0.80% | 0.80% | ||
| 06:00 | EUR | Germany CPI Y/Y Mar F | 7.40% | 7.40% | ||
| 06:00 | GBP | GDP M/M Feb | 0.10% | 0.30% | ||
| 06:00 | GBP | Index of Services 3M/3M Feb | -0.20% | 0.00% | ||
| 06:00 | GBP | Industrial Production M/M Feb | 0.30% | -0.30% | ||
| 06:00 | GBP | Industrial Production Y/Y Feb | -3.70% | -4.30% | ||
| 06:00 | GBP | Manufacturing Production M/M Feb | 0.30% | -0.40% | ||
| 06:00 | GBP | Manufacturing Production Y/Y Feb | -4.70% | -5.20% | ||
| 06:00 | GBP | Goods Trade Balance (GBP) Feb | -17.0B | -17.9B | ||
| 08:00 | EUR | Italy Industrial Output M/M Feb | 0.50% | -0.70% | ||
| 09:00 | EUR | Eurozone Industrial Production M/M Feb | 1.00% | 0.70% | ||
| 11:00 | GBP | NIESR GDP Estimate (3M) Mar | -0.10% | -0.10% | ||
| 12:30 | USD | PPI M/M Mar | 0.10% | -0.10% | ||
| 12:30 | USD | PPI Y/Y Mar | 3.10% | 4.60% | ||
| 12:30 | USD | PPI Core M/M Mar | 0.20% | 0.00% | ||
| 12:30 | USD | PPI Core Y/Y Mar | 3.30% | 4.40% | ||
| 12:30 | USD | Initial Jobless Claims (Apr 7) | 235K | 228K | ||
| 14:30 | USD | Natural Gas Storage | 25B | -23B |
Australia March Labour Force: A Sound Update Reflecting the Strength of Labour Supply
Total employment: +53.0k from +63.6k (revised from +64.6k); unemployment rate: 3.5% from 3.5% (unrevised 3.5%); participation rate: 66.7% from 66.7% (revised from 66.6%). The labour market continues to weather the headwinds facing the broader economy, remaining in robust health.
Total employment gained 53.0k or 0.4% in March following on from a 63.6k gain in February, shifting the three-month average change in employment from 13.3k/mth up to 35.4k/mth. The size of the lift in employment was also enough to lift the employment-to-population ratio to 64.4%, only 0.1ppt shy of the record high that was reached back in November 2022.
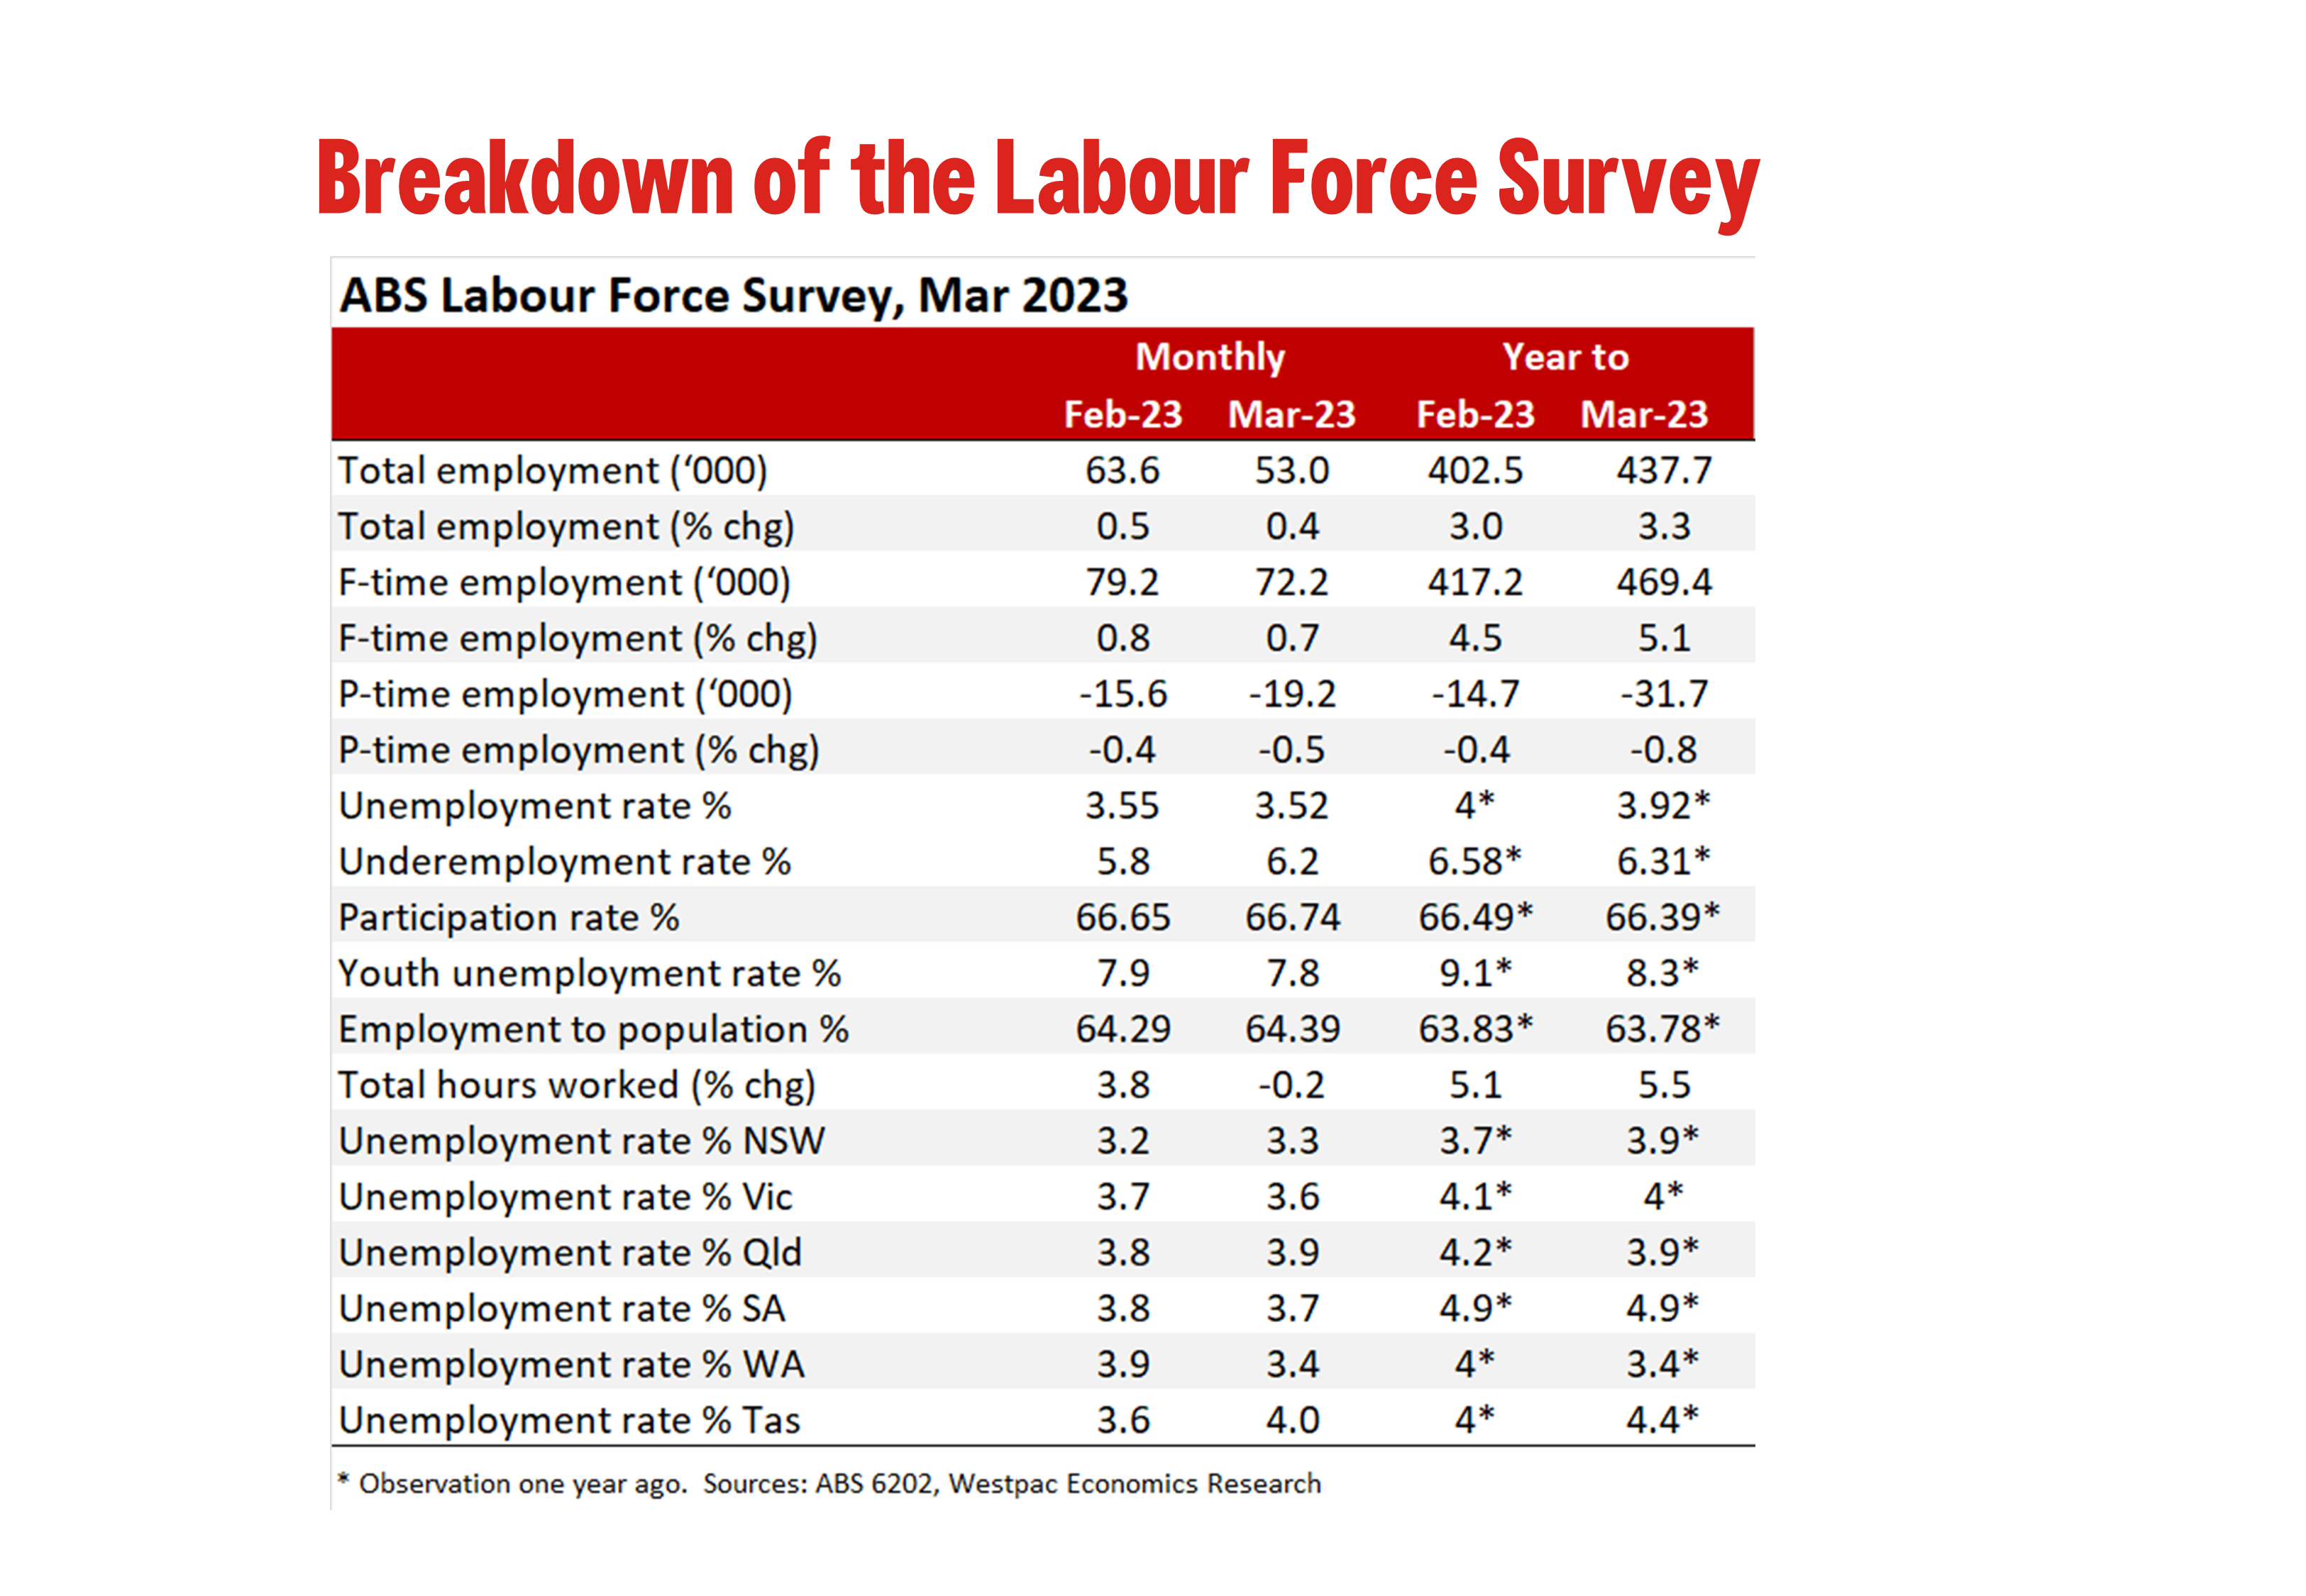
Seasonally adjusted monthly hours worked declined by 0.2% in March, but following on from the 3.8% surge in February – associated with a larger-than-usual number of people returning to work from summer holidays – the gains in hours worked still outstrip that of employment.
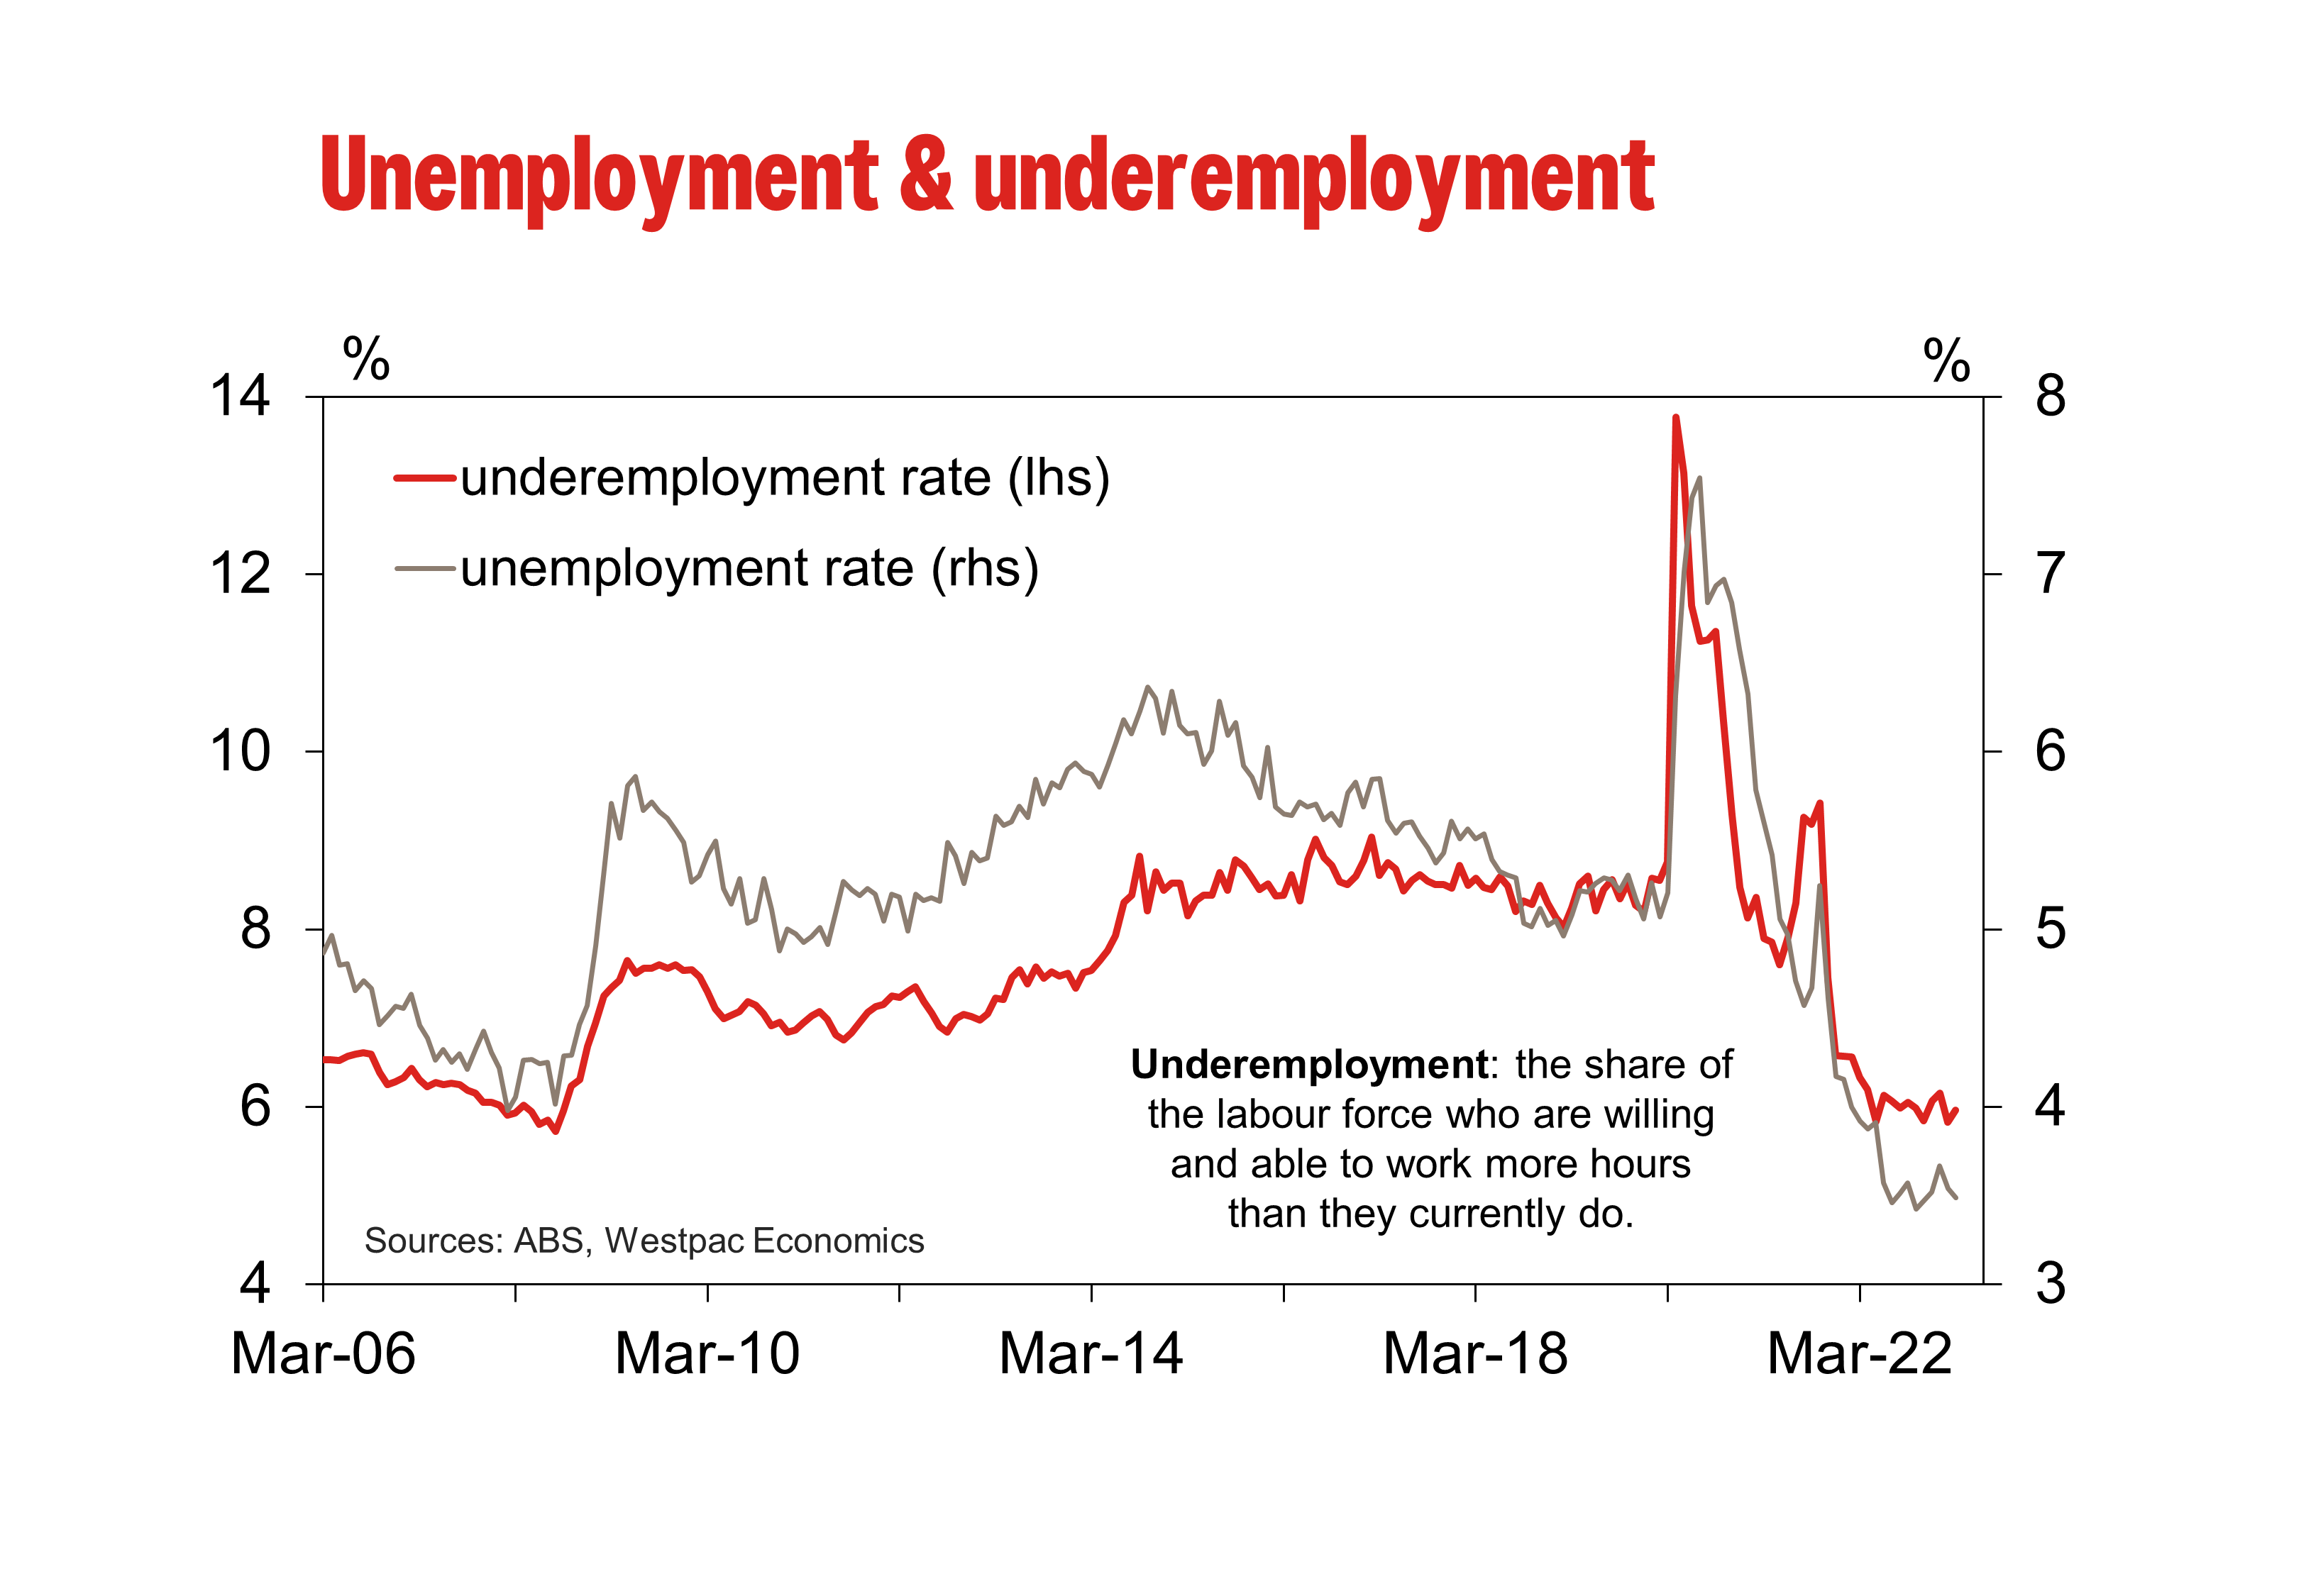
While the participation rate held flat at one decimal place (66.7%), it rose 0.9ppt at two decimal places, from 66.65% in February to 66.74% in March, just below November’s historic high of 66.8%. Underemployment – those who are employed and are willing and able to work more hours if offered to them – returned back to 6.2% in March after temporarily dipping in February.
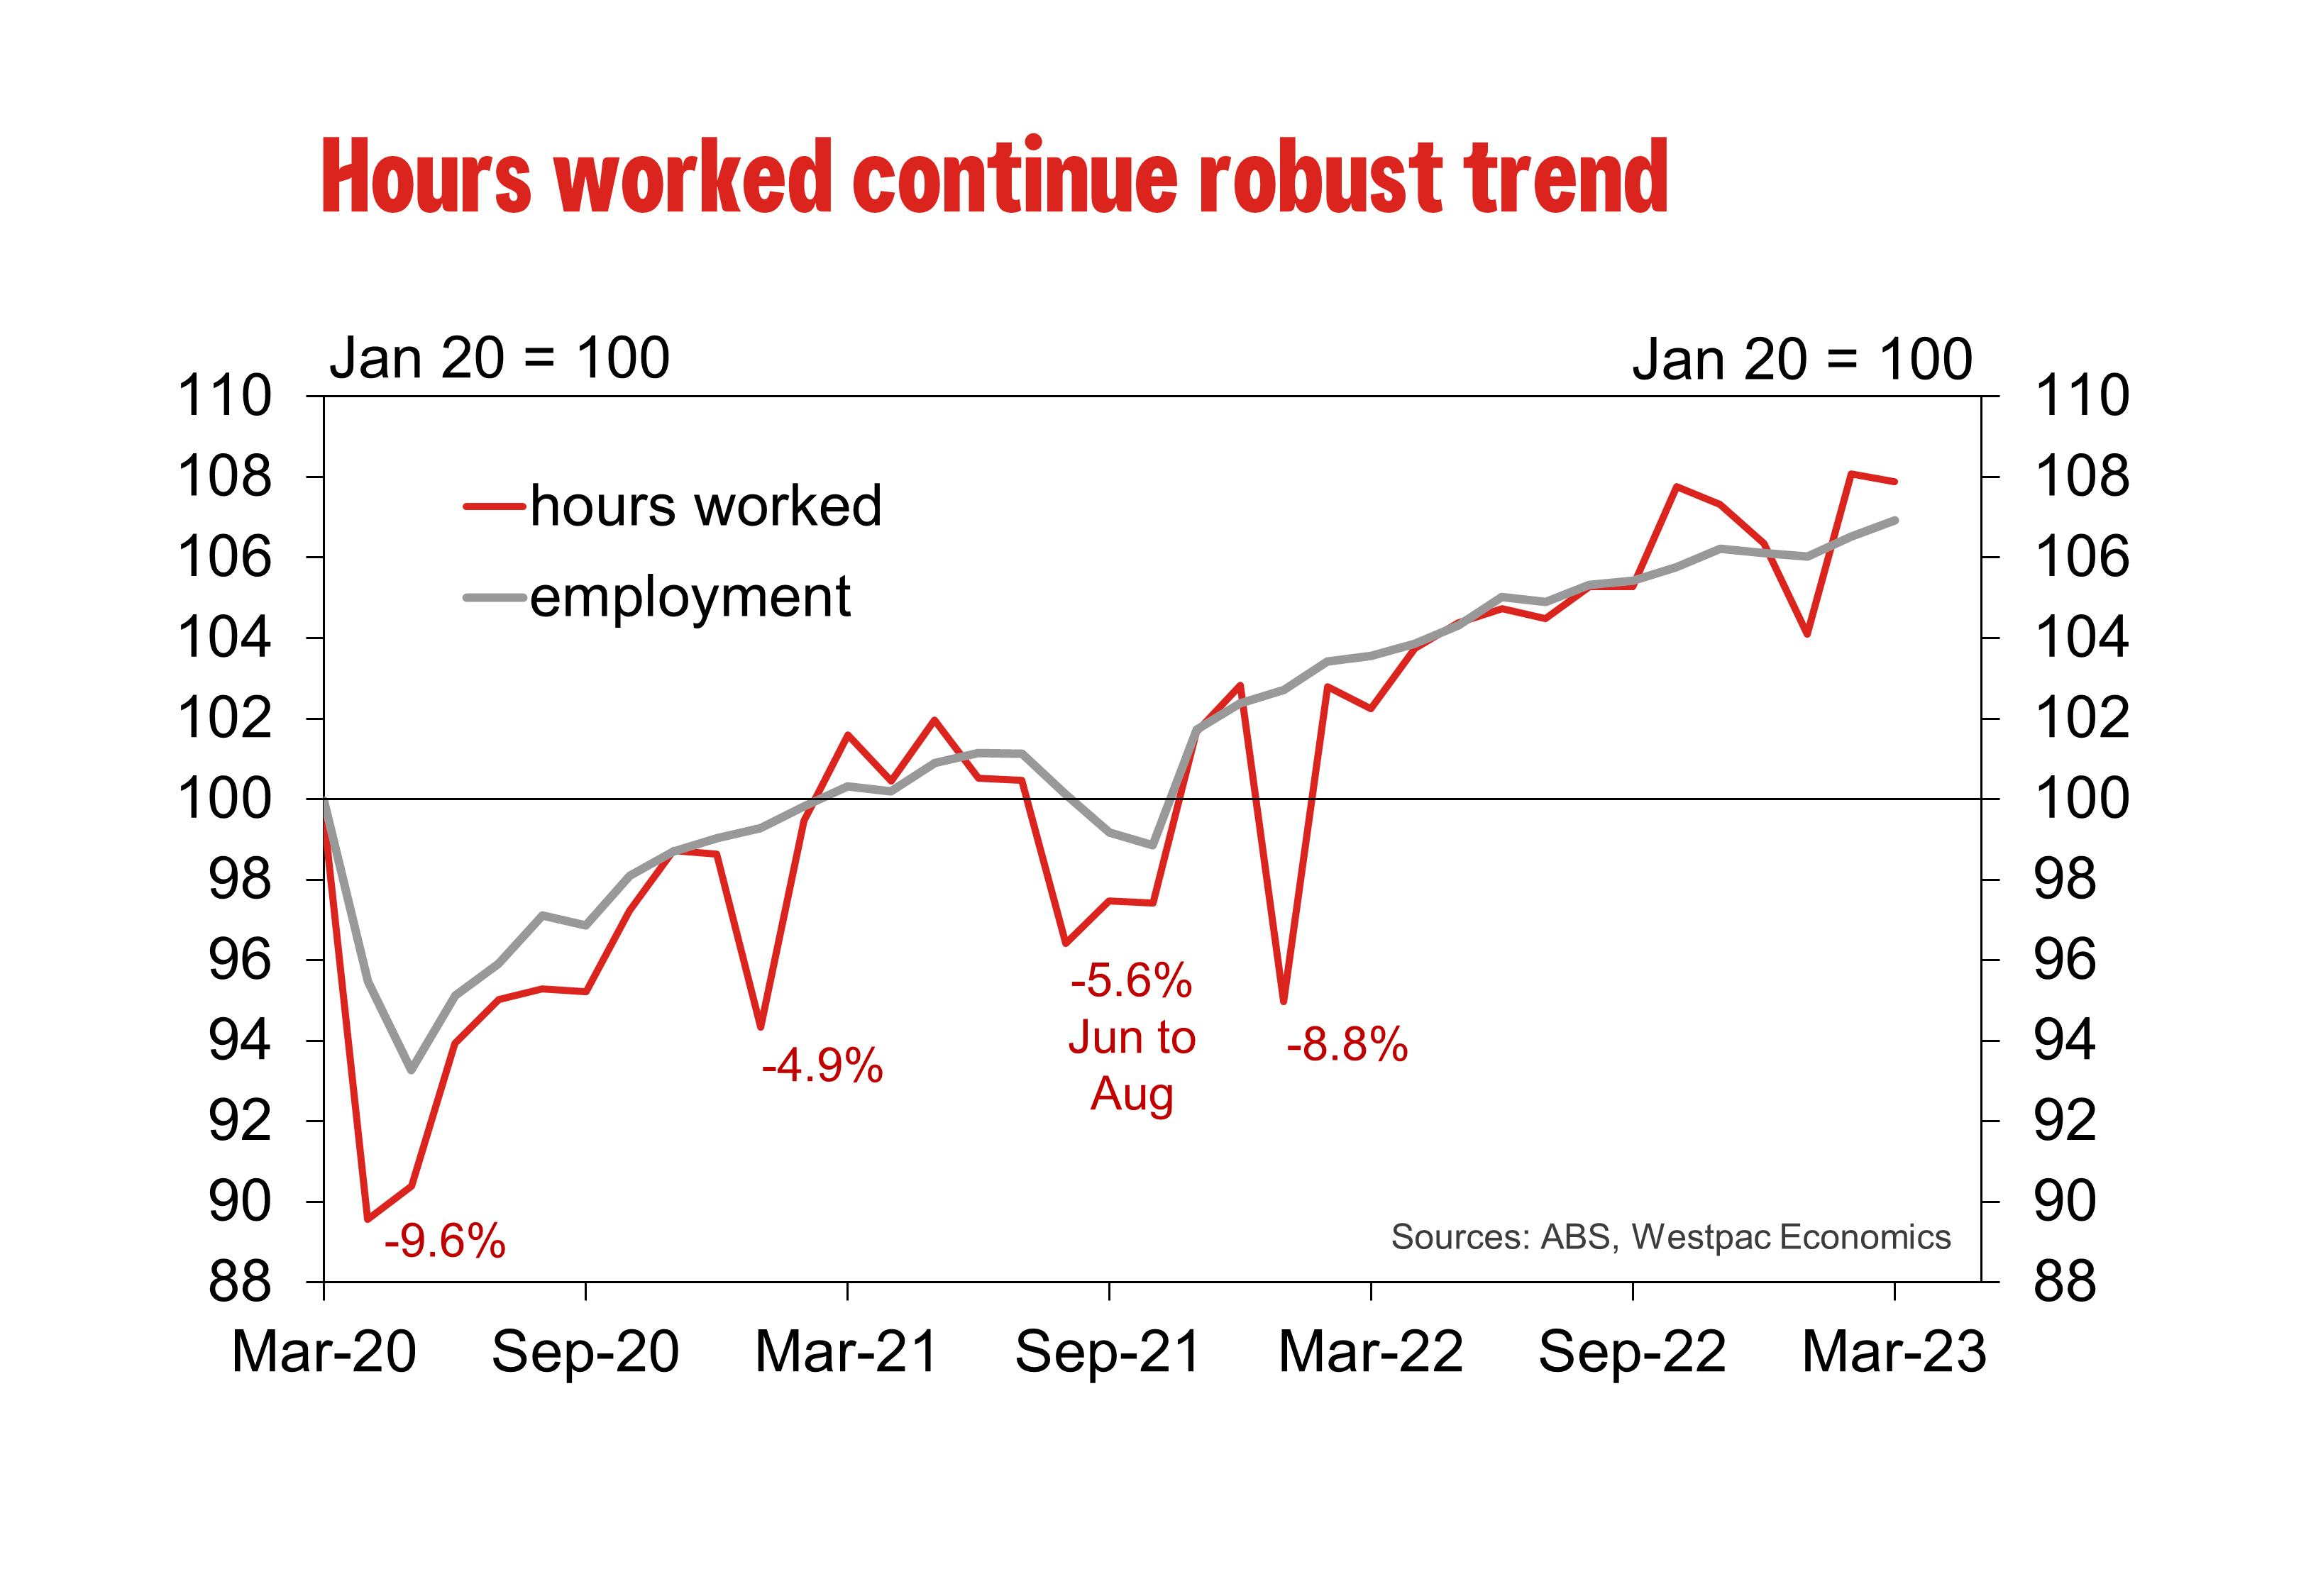
Together, these results suggest that the supply side of the labour market – captured by the strength in labour force participation and individuals’ willingness to work more hours – will remain a supportive factor for the near-term. Indeed, the lift in participation saw the labour force grow by 51.4k, slightly lower than the gain in employment, resulting in the unemployment rate holding at 3.5%, near the cycle-low of 3.4% observed back in October 2022. At two decimal places, the unemployment rate fell by 0.03ppts from 3.55% to 3.52%.
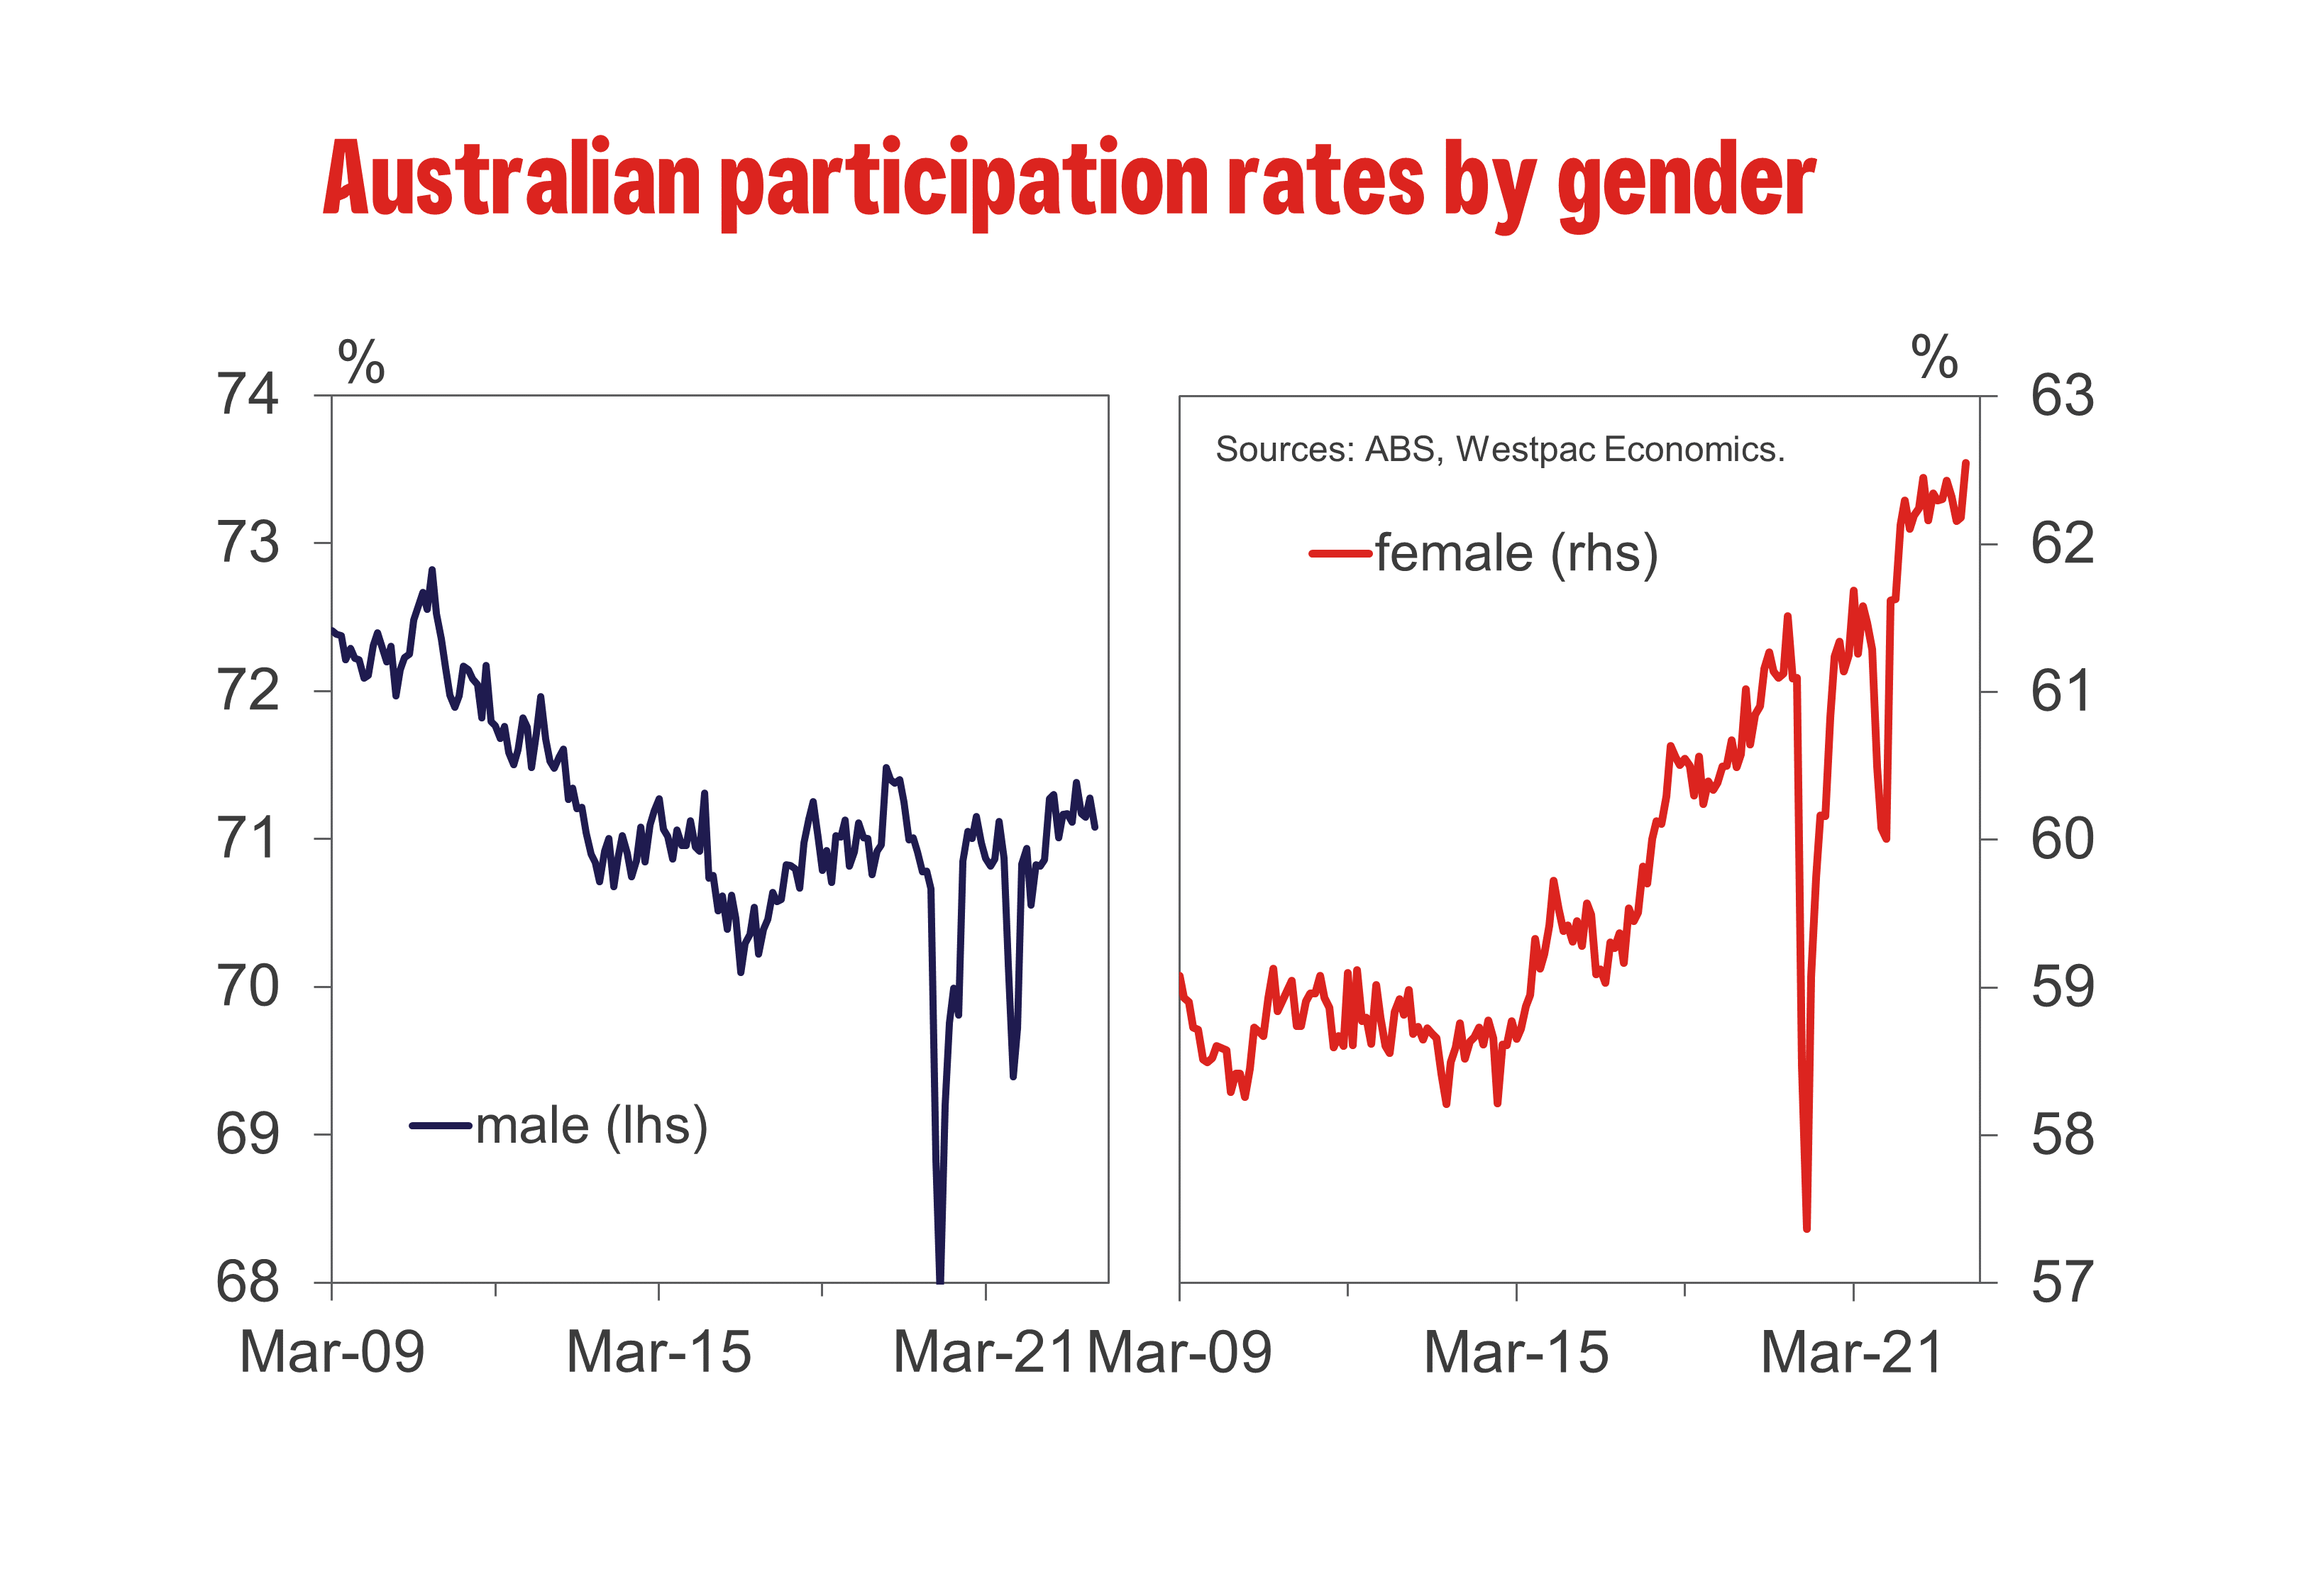
Underlying these results has been a continued outperformance by females in broader labour market outcomes. In March, female participation rose a record high of 62.5%, and with continued strength in employment gains – a lift of 56.3k for females while male employment was effectively flat at –3.3k – the female employment-to-population ratio also rose to a historical high of 60.4%.
As noted above, this reflects a strong supply-side story, with labour force growth for females (+55.6k) clearly outperforming that of males (–4.2k). Consequently, the downtrend in the female unemployment rate remains firmly entrenched, even falling to a fresh record low of 3.4%, while the male unemployment rate remains well off its cycle-low from October.
It is also interesting to note that employment lifted in all states except NSW, which reported a 0.5% decline in the month. Despite lifting 0.1ppts to 3.3%, the unemployment rate in NSW remains well below the national average. Qld also saw a lift in the unemployment rate (+0.1ppt to 3.9%), but declines were evident across Vic (3.6%), SA (3.7%) and WA (3.4%).
Overall, the March report presented a sound update on the labour market. Businesses’ appetite for new workers remains robust, in line with the growth in labour supply, but we continue to expect labour market outcomes will soften more clearly into the second half of this year.
Australian employment grew solidly by 53k, bolstering case for more RBA tightening
Australian labor market continued to show strength in March, with employment growth significantly outperforming expectations. The strong employment data shows very few signs of weakness in the labor market, suggesting that RBA may need to resume tightening in May.
According to the today's data, employment increased by 53k in seasonally adjusted terms, well above expectation of 20k gain. Full-time jobs saw an increase of 72.2k, while part-time employment declined by -19.2k.
Despite expectations of a rise to 3.6%, unemployment rate remained unchanged at 3.5%. Additionally, the participation rate held steady at 66.7%, and monthly hours worked decreased by -0.2%. Lauren Ford, the ABS head of labor statistics, highlighted that the unemployment rate stayed at a near 50-year low of 3.5%.
Ford also noted that the employment-to-population ratio increased by 0.1 percentage point to 64.4%, with the participation rate remaining at 66.7%. Both indicators were close to their historical highs in November 2022, reflecting a tight labor market that has made it challenging for employers to fill the high number of job vacancies.