

Sample Category Title
EUR/USD: Triangle is Completed, We are Waiting for a Drop in Impulse
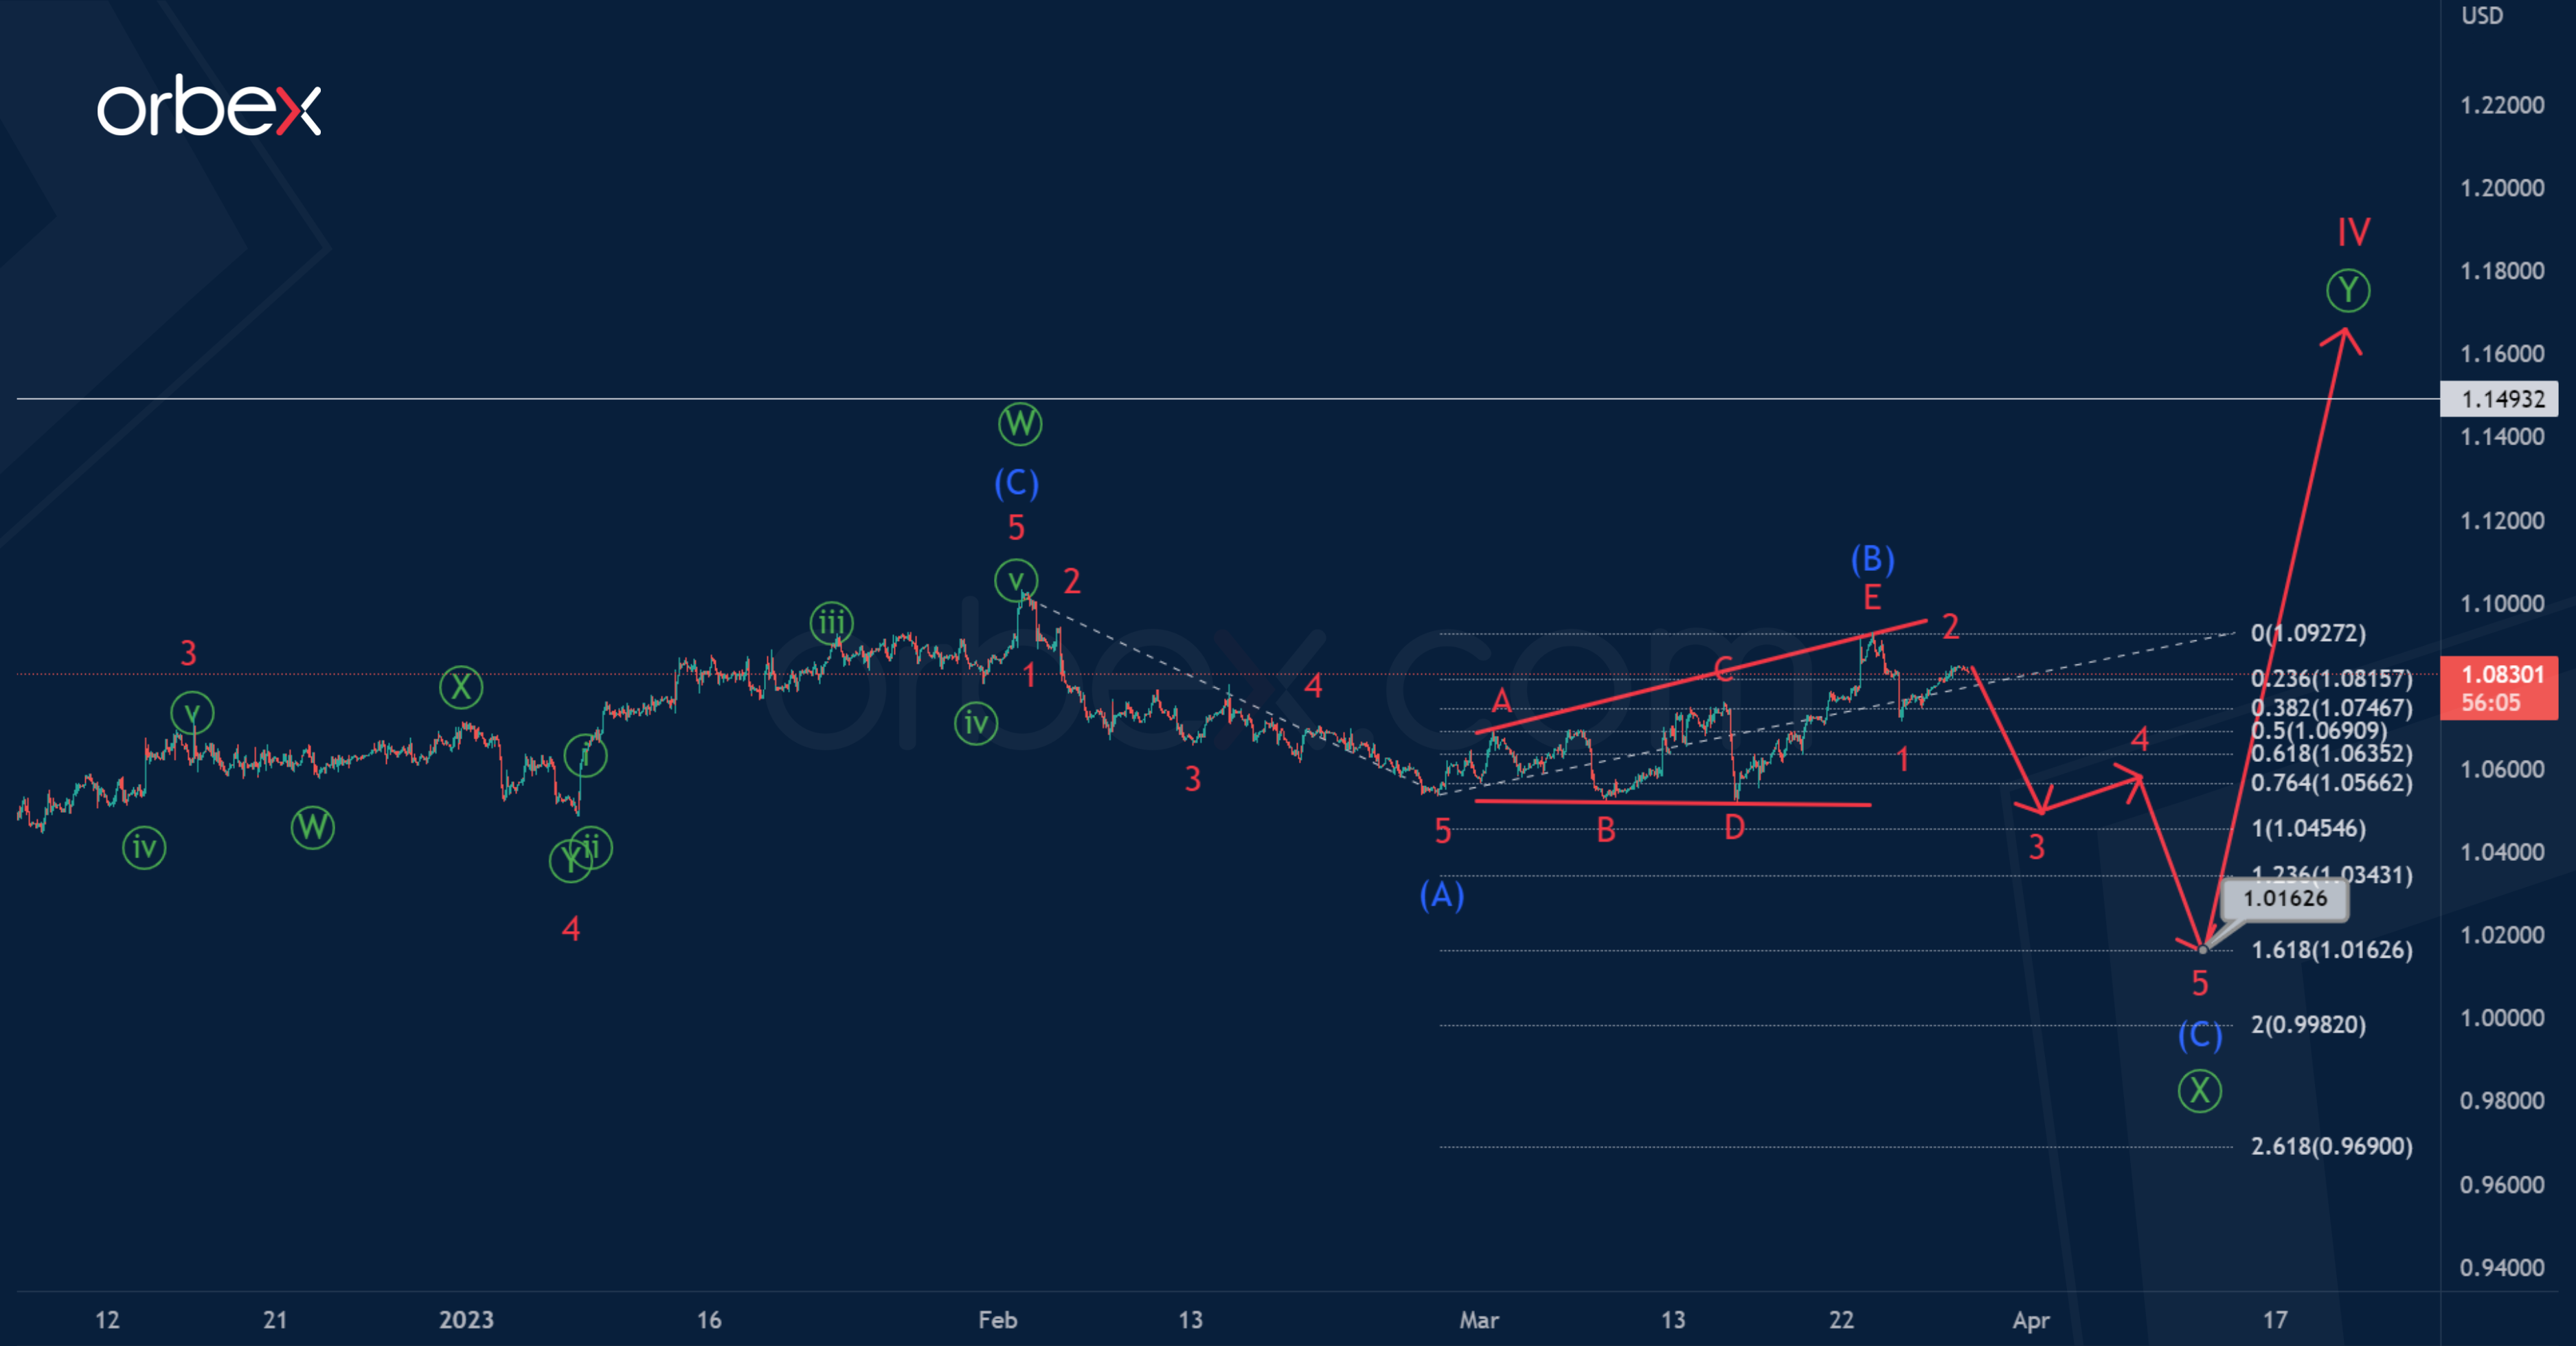
EURUSD continues to form the correction wave IV inside the large-scale impulse. Cycle correction IV, most likely, takes the form of a primary double zigzag.
The actionary leg is completed. A bearish corrective intervening wave, may be in the development stage now. It is also similar to the standard zigzag (A)-(B)-(C). The triangular intermediate correction (B) has recently come to an end, and now the price may be in the last impulse wave (C).
It is assumed that the price may fall to 1.016. At that level, impulse (C) will be at 161.8% of first impulse (A).
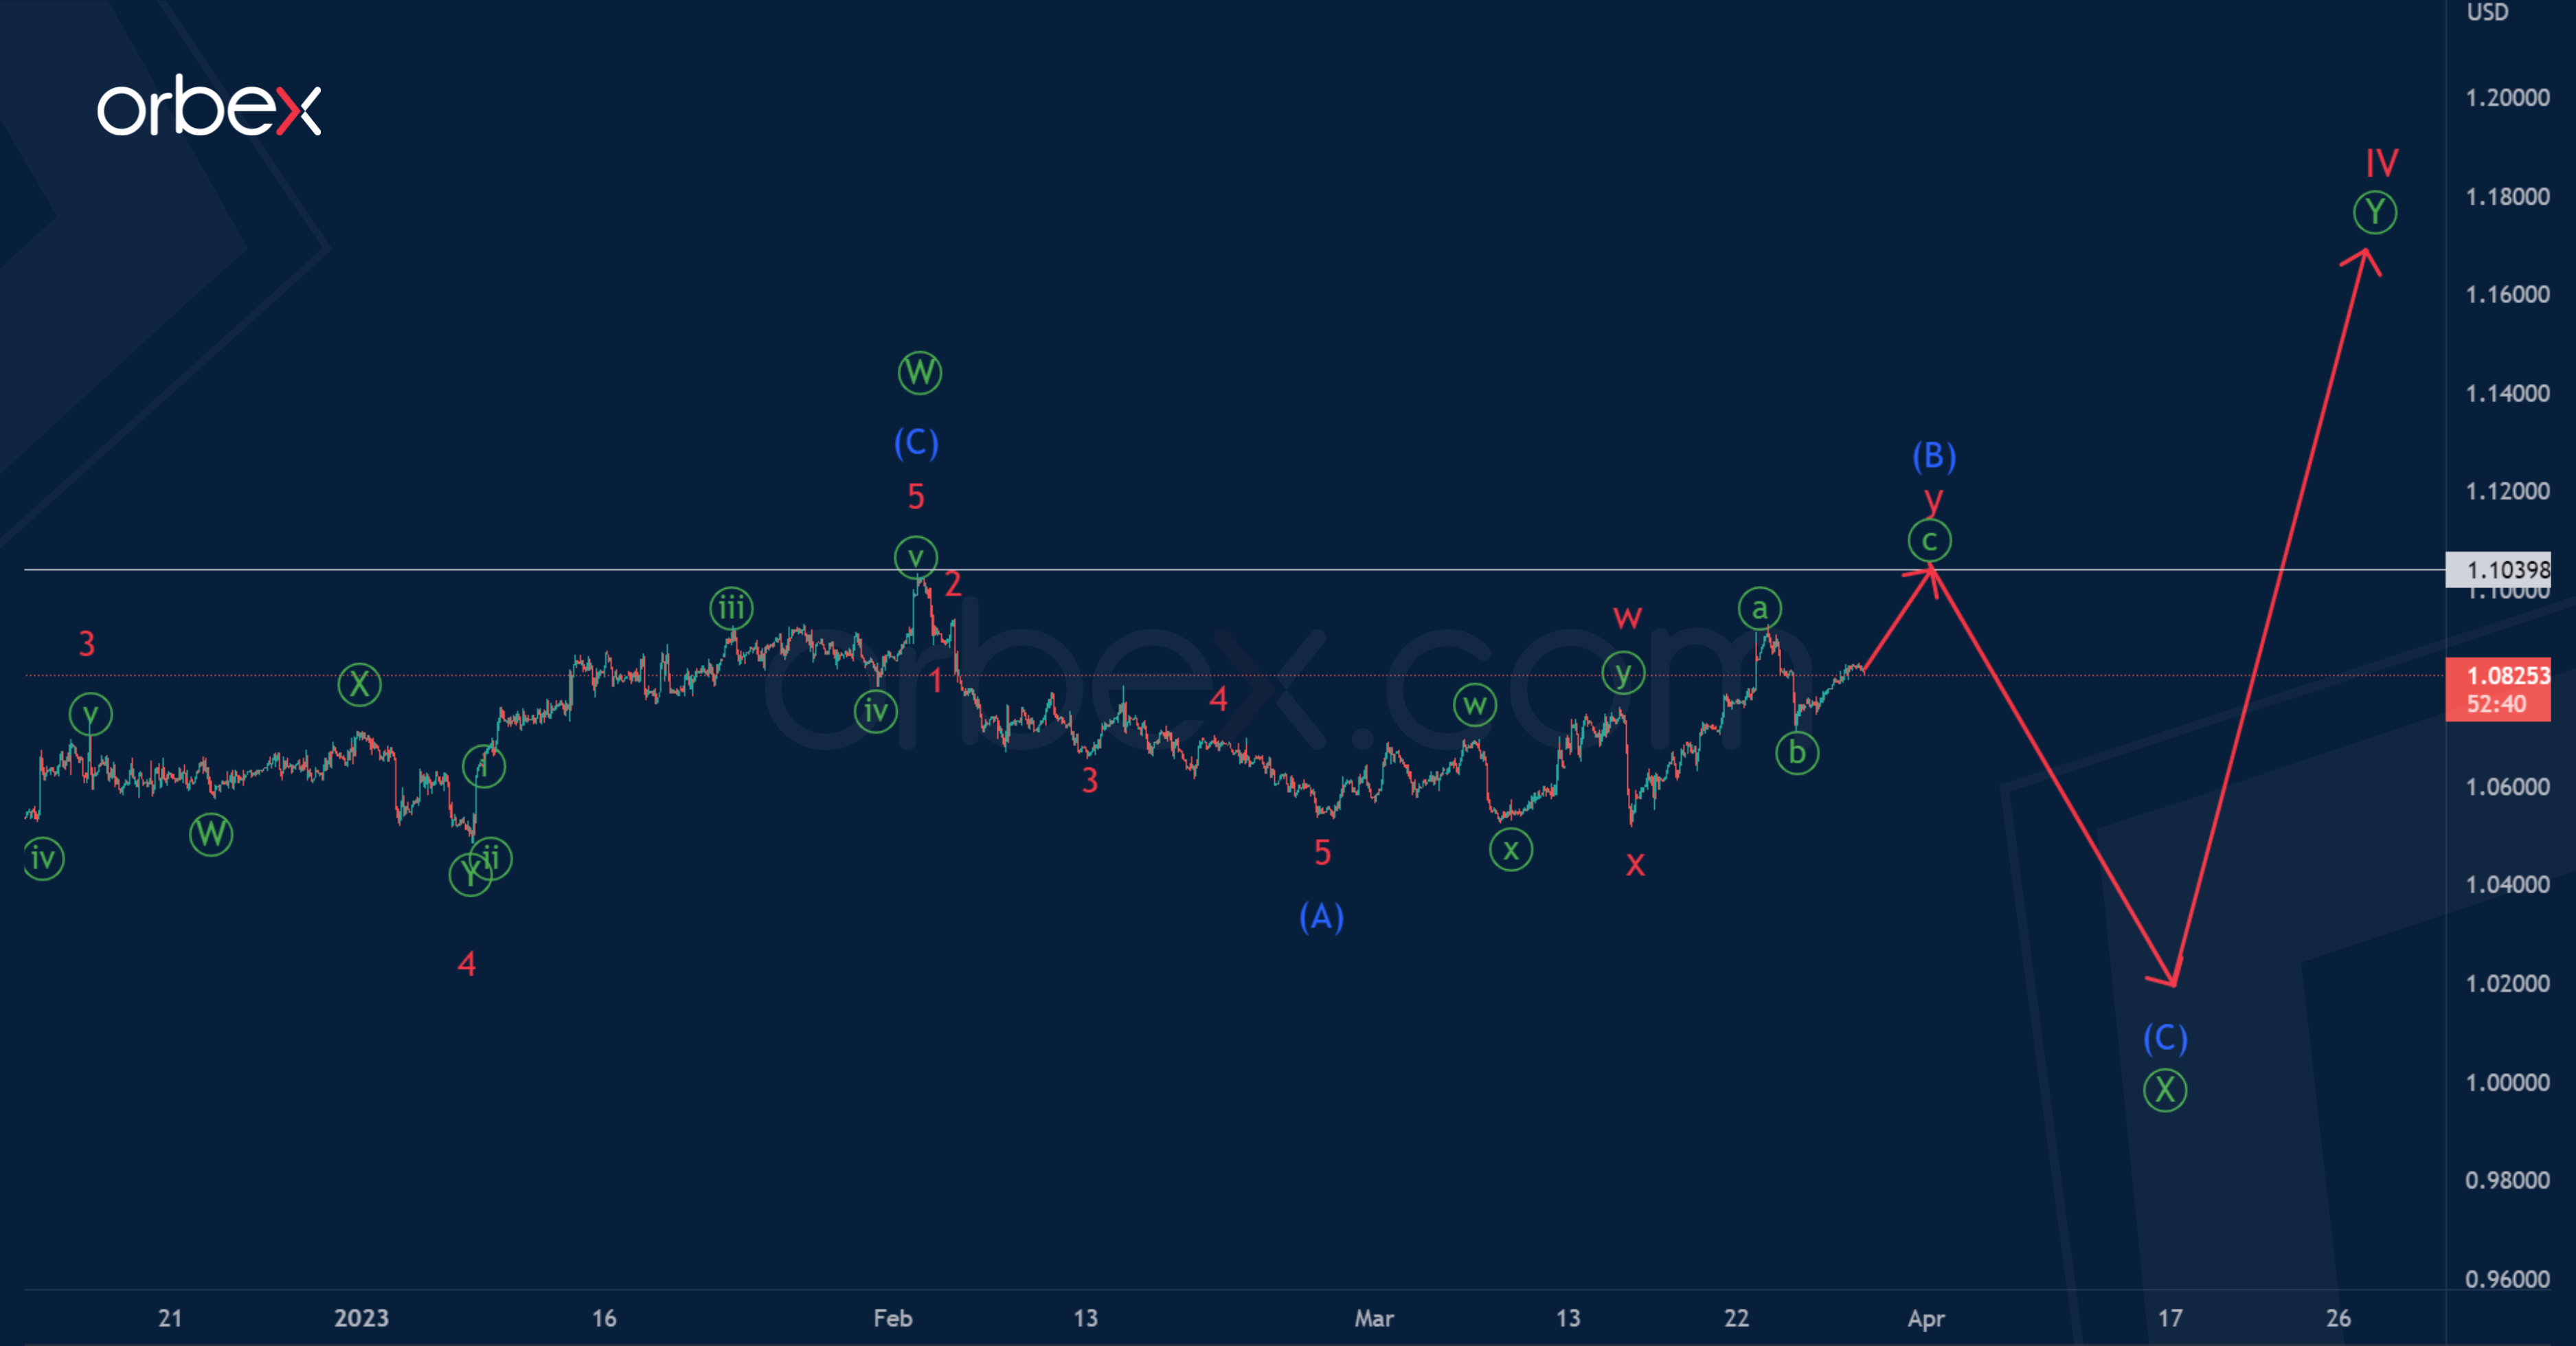
An alternative scenario suggests that the intermediate correction (B) not a triangle, but a double zigzag. Its end is possible at the previous maximum of 1.103, at which we saw the end of the first actionary wave.
Only after reaching the maximum, the market will turn and decline. Alternatively, it is also assumed that the primary intervening wave can take a horizontal structure, and then it will not be a zigzag, but, let's say, a double three.
While we are watching which of the scenarios the currency will move.
NZDUSD Hovers Within a Tight Range of SMAs
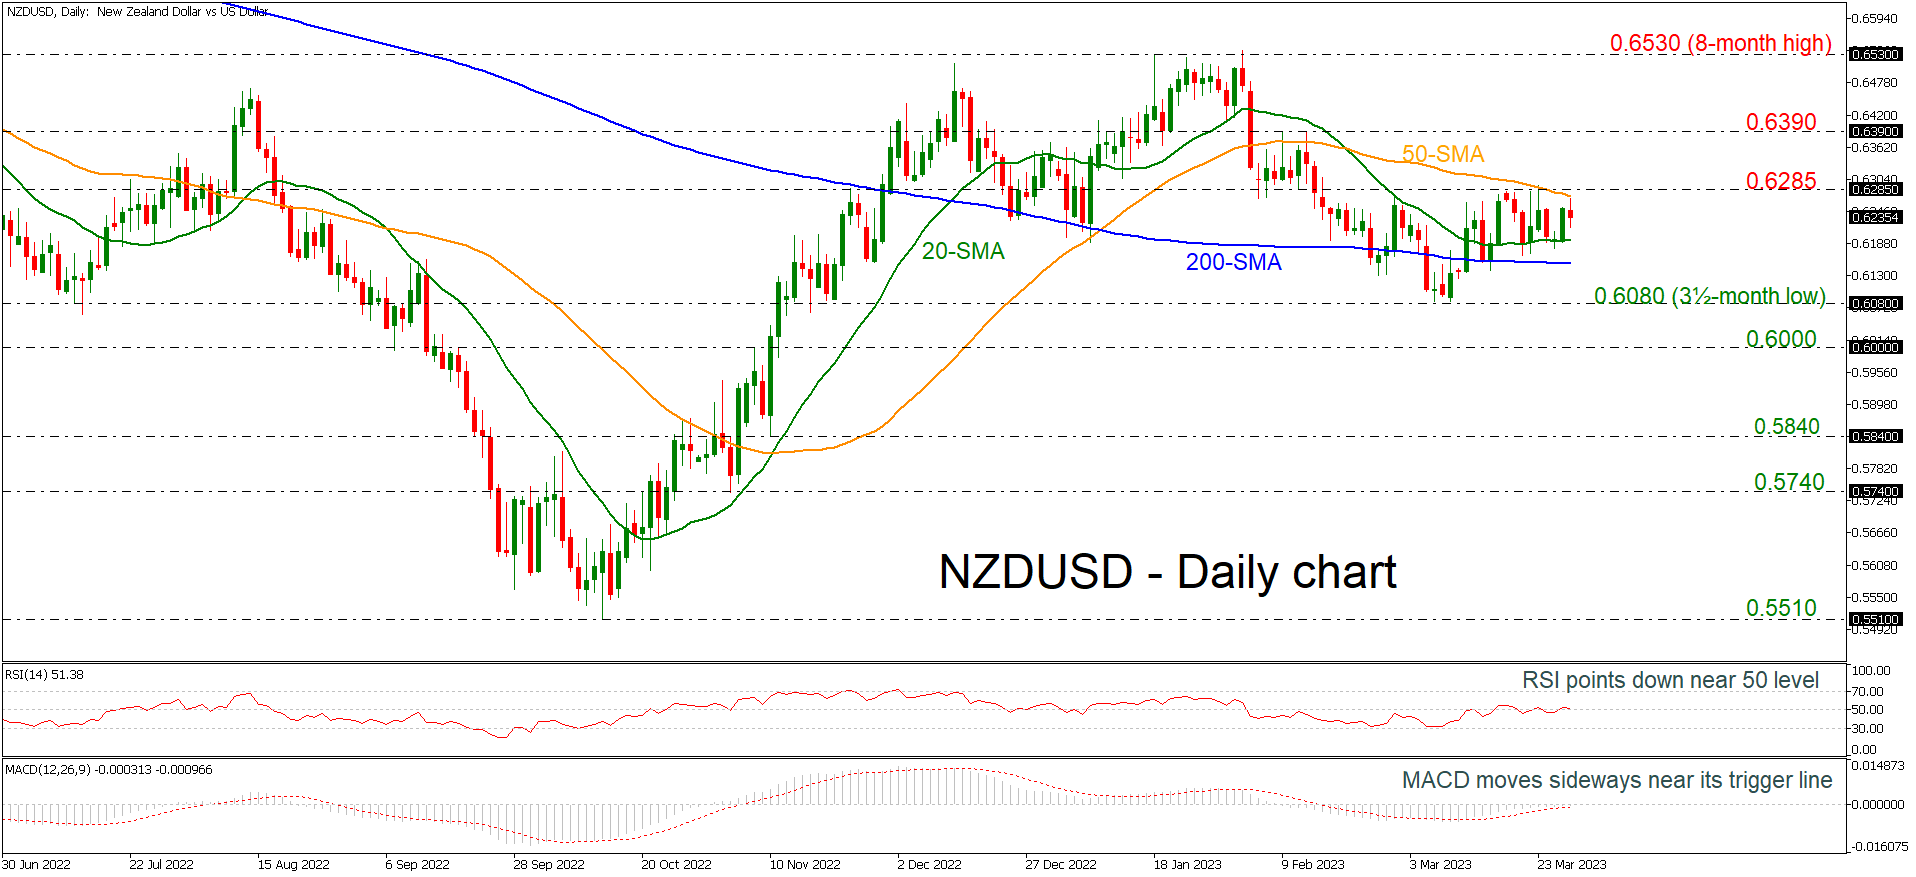
NZDUSD is hovering within a tight range with boundaries of the 20- and the 50-day simple moving averages (SMAs) at 0.6190 and 0.6280 respectively.
From the technical perspective, the RSI is standing near the neutral threshold of 50 and is pointing south, while the MACD is moving sideways below the zero level and near its trigger line.
In the event of an upside reversal, the immediate 0.6285 resistance could act as a significant barrier before being able to re-challenge the 0.6390 obstacle. A break above this level and the eight-month peak of 0.6530 would shift the medium-term outlook to a more positive one.
Further losses should see the 20-day SMA at 0.6190 ahead of the flat 200-day SMA at 0.6150 acting as a major support. A drop lower would meet the three-and-a-half-month low of 0.6080 and the 0.6000 psychological mark, endorsing the short-term bearish structure.
Summarizing, NZDUSD fails to have a clear picture in the very short-term and only a move above or below the SMAs may clear the current view.
Gold keeps high ground
USD/CHF sees little bounce
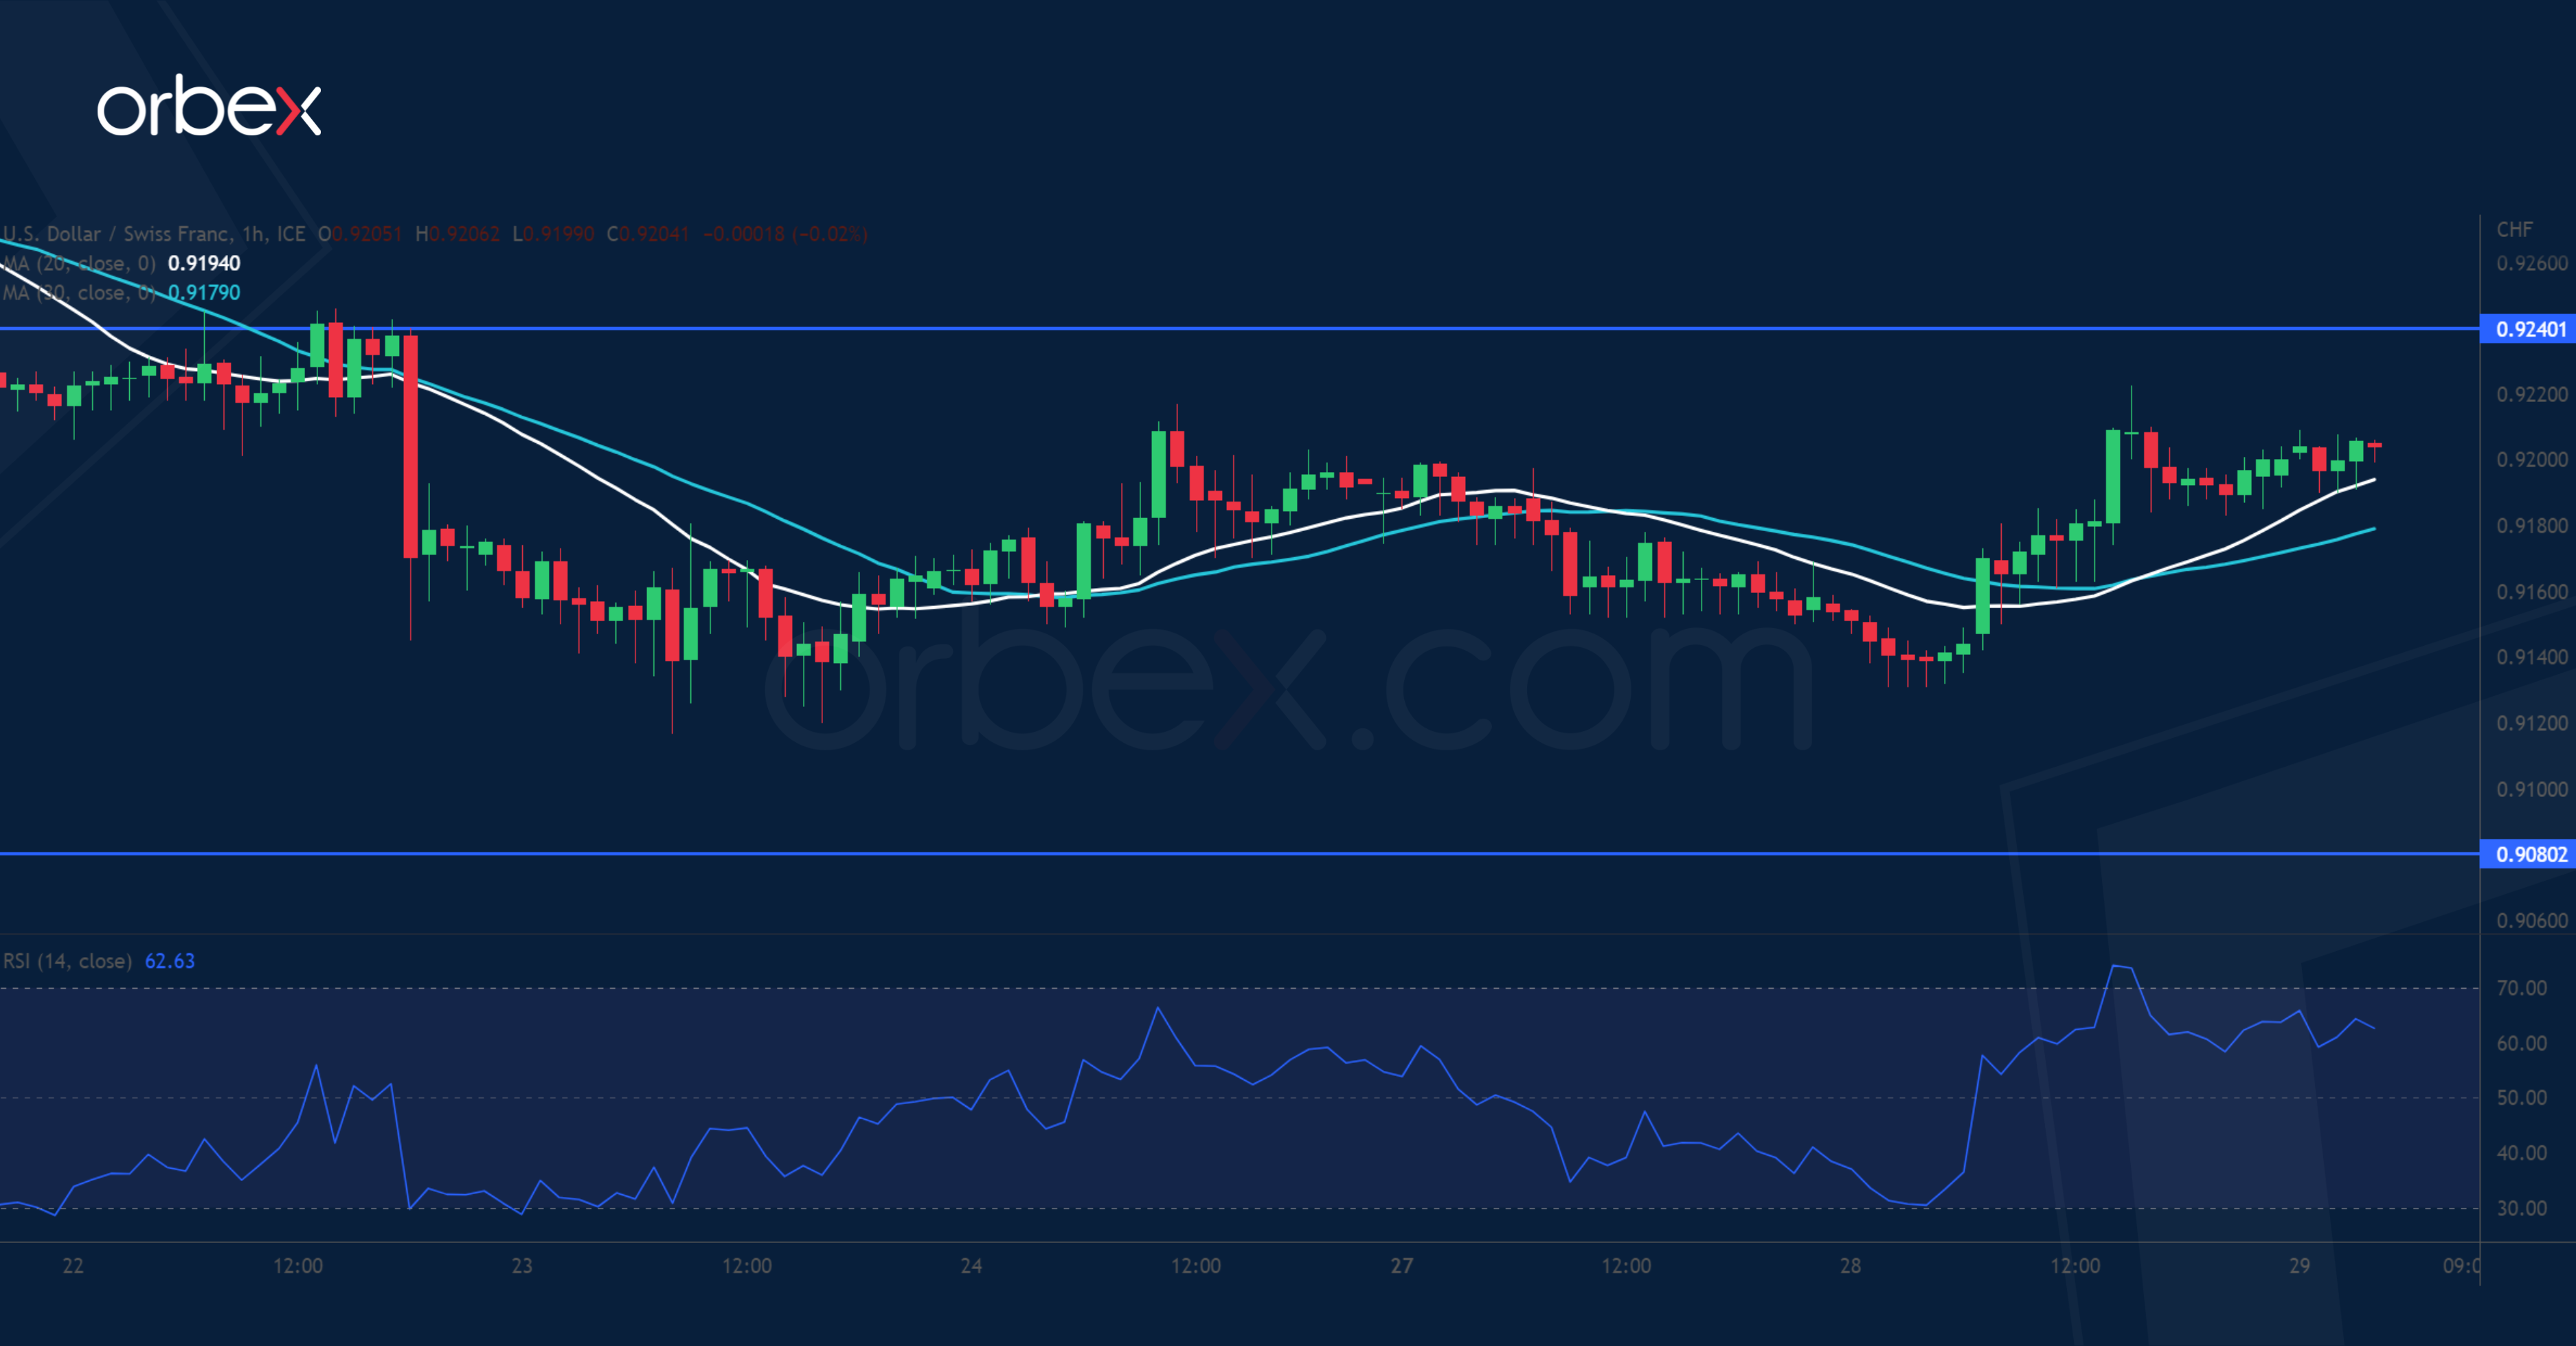
The US dollar struggles as risk appetite returns amid banking optimism. On the daily chart, a drop below 0.9170 and a bearish MA cross suggest that the bias is still downbeat after a four-month long sell-off. The pair has remained under pressure in the short-term after the previous rebound came to a halt around 0.9340. February’s low of 0.9080 is buyers’ last stronghold and its breach would extend losses towards 0.89s. On the upside, 0.9240 is the first hurdle and only a break above 0.9340 would turn things around.
XAU/USD holds on to gains
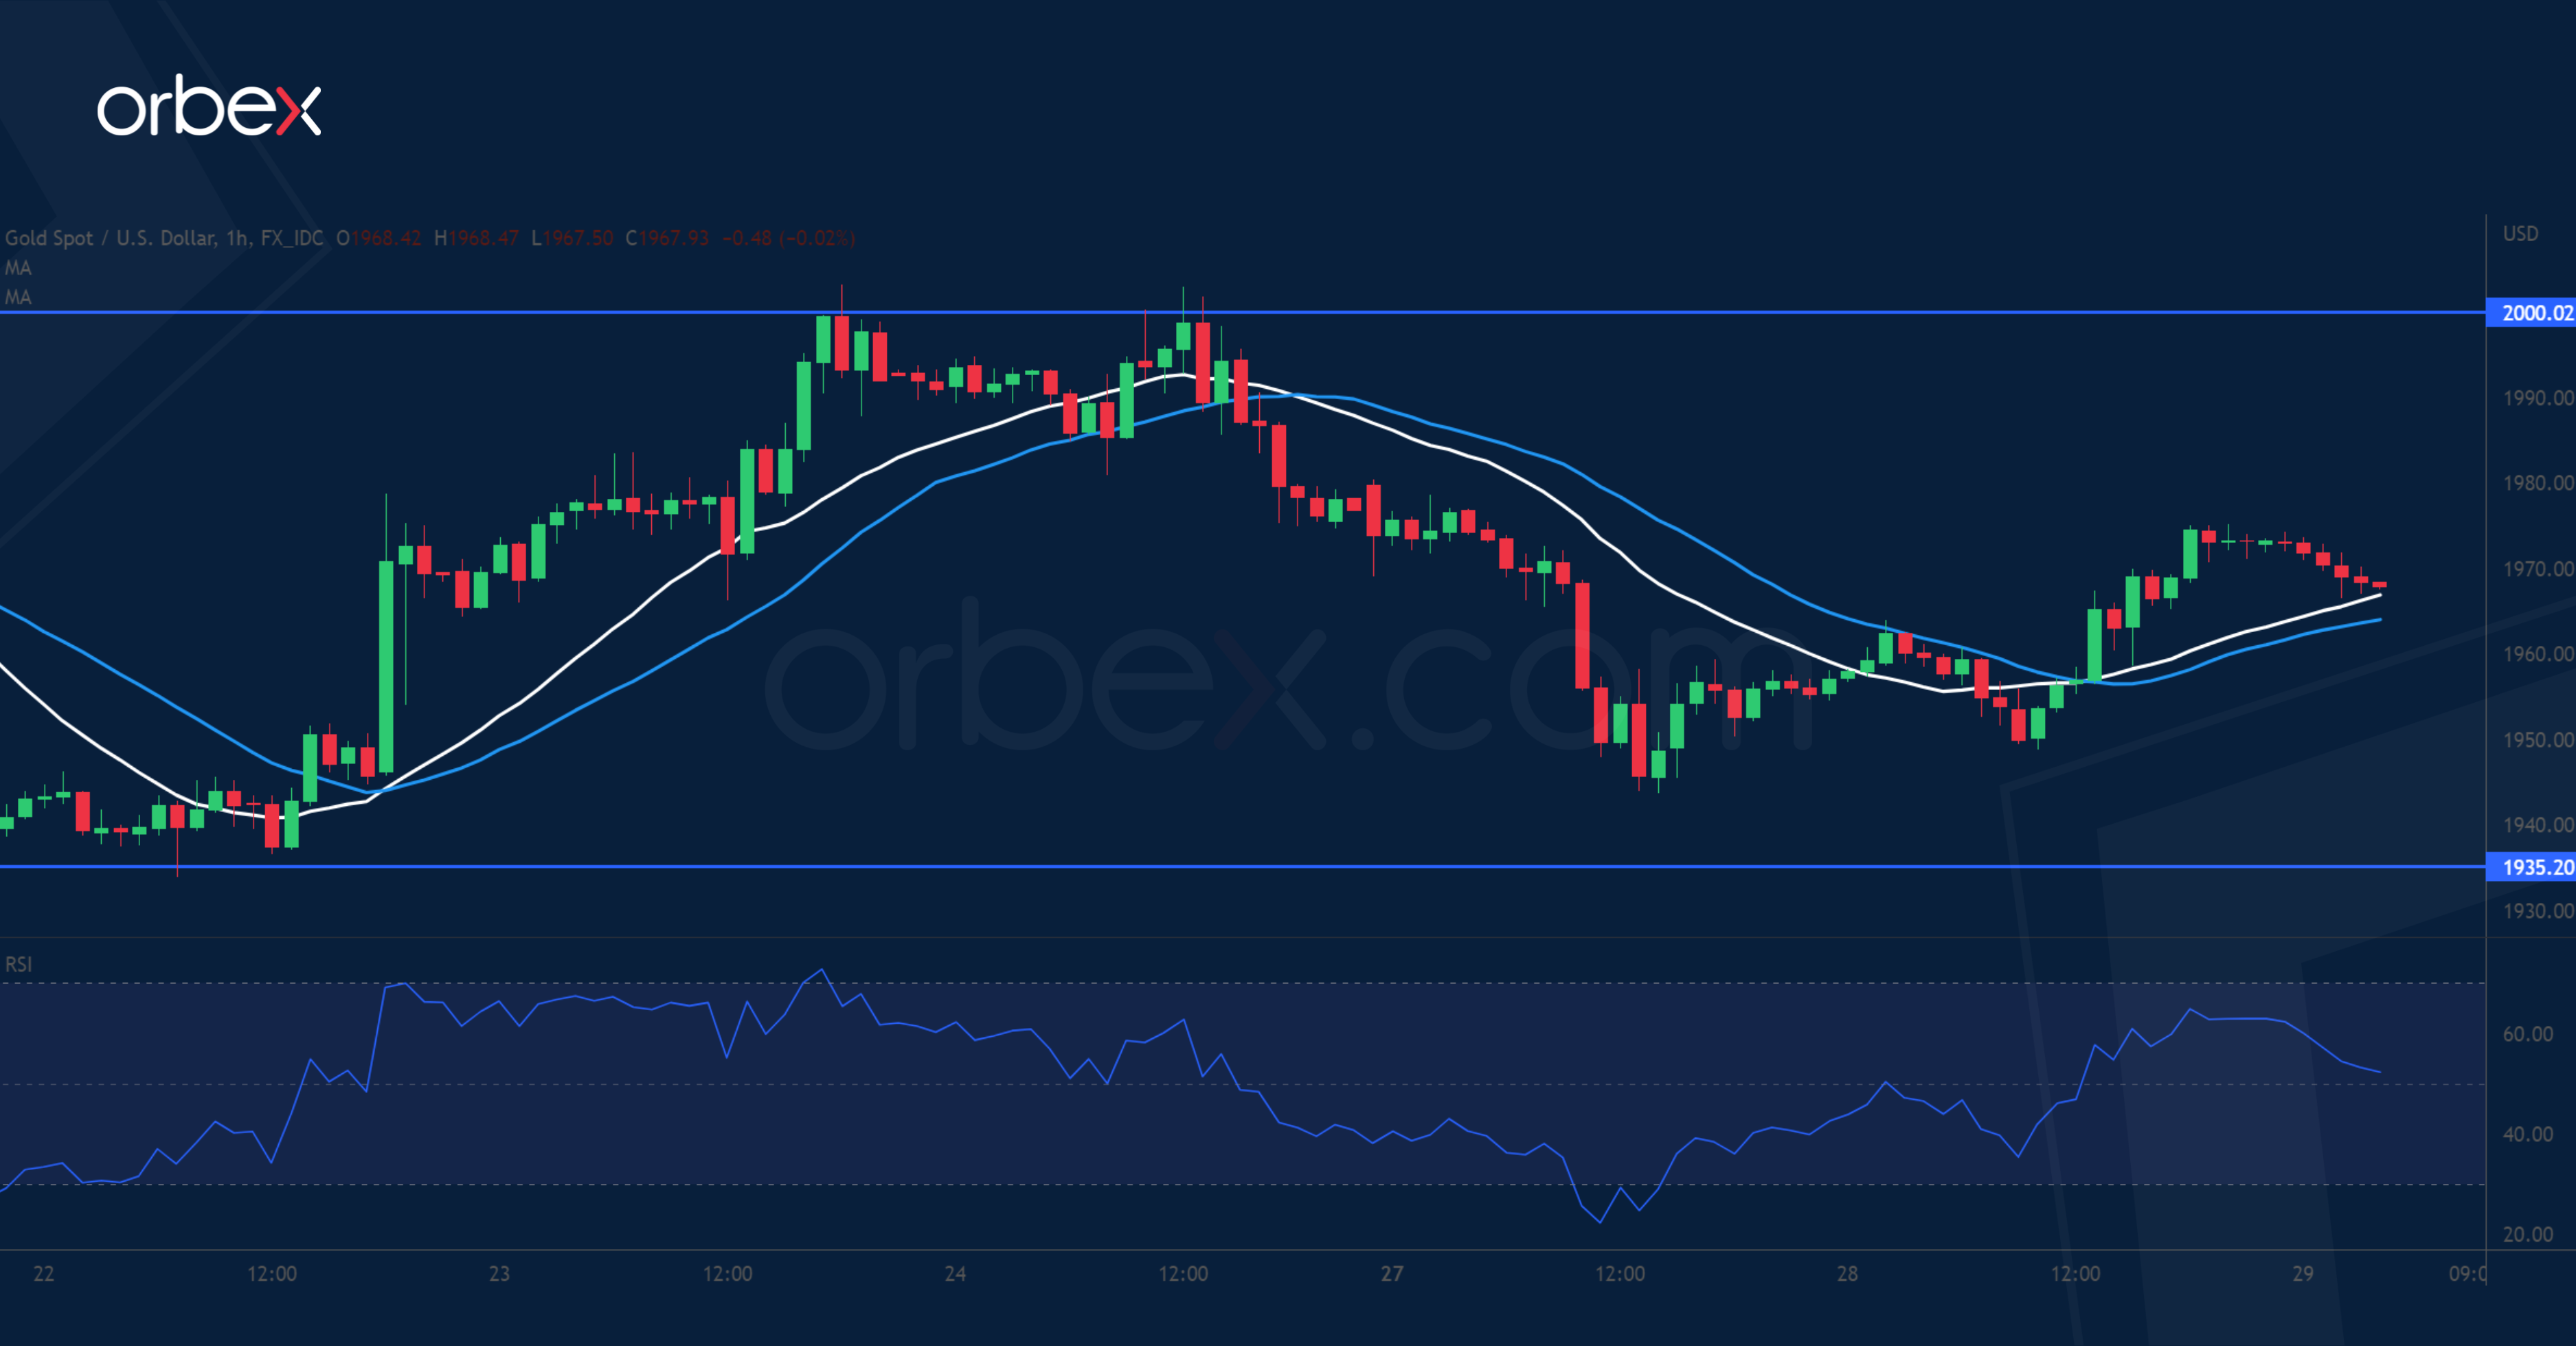
Gold inched higher supported by a retreat of the US dollar index. The price is striving to hold onto its 11- month high at 2000 with the daily RSI showing an overbought situation. The double top at this major psychological level is another sigh of exhaustion after a parabolic rise. The bullish mood is still intact though a pullback might be due to let the bulls catch their breath. The previous swing low at 1935 is the first level to see if bids would re-emerge. Otherwise, 1886 over the 20-day SMA would be a second support.
UK 100 awaits breakout
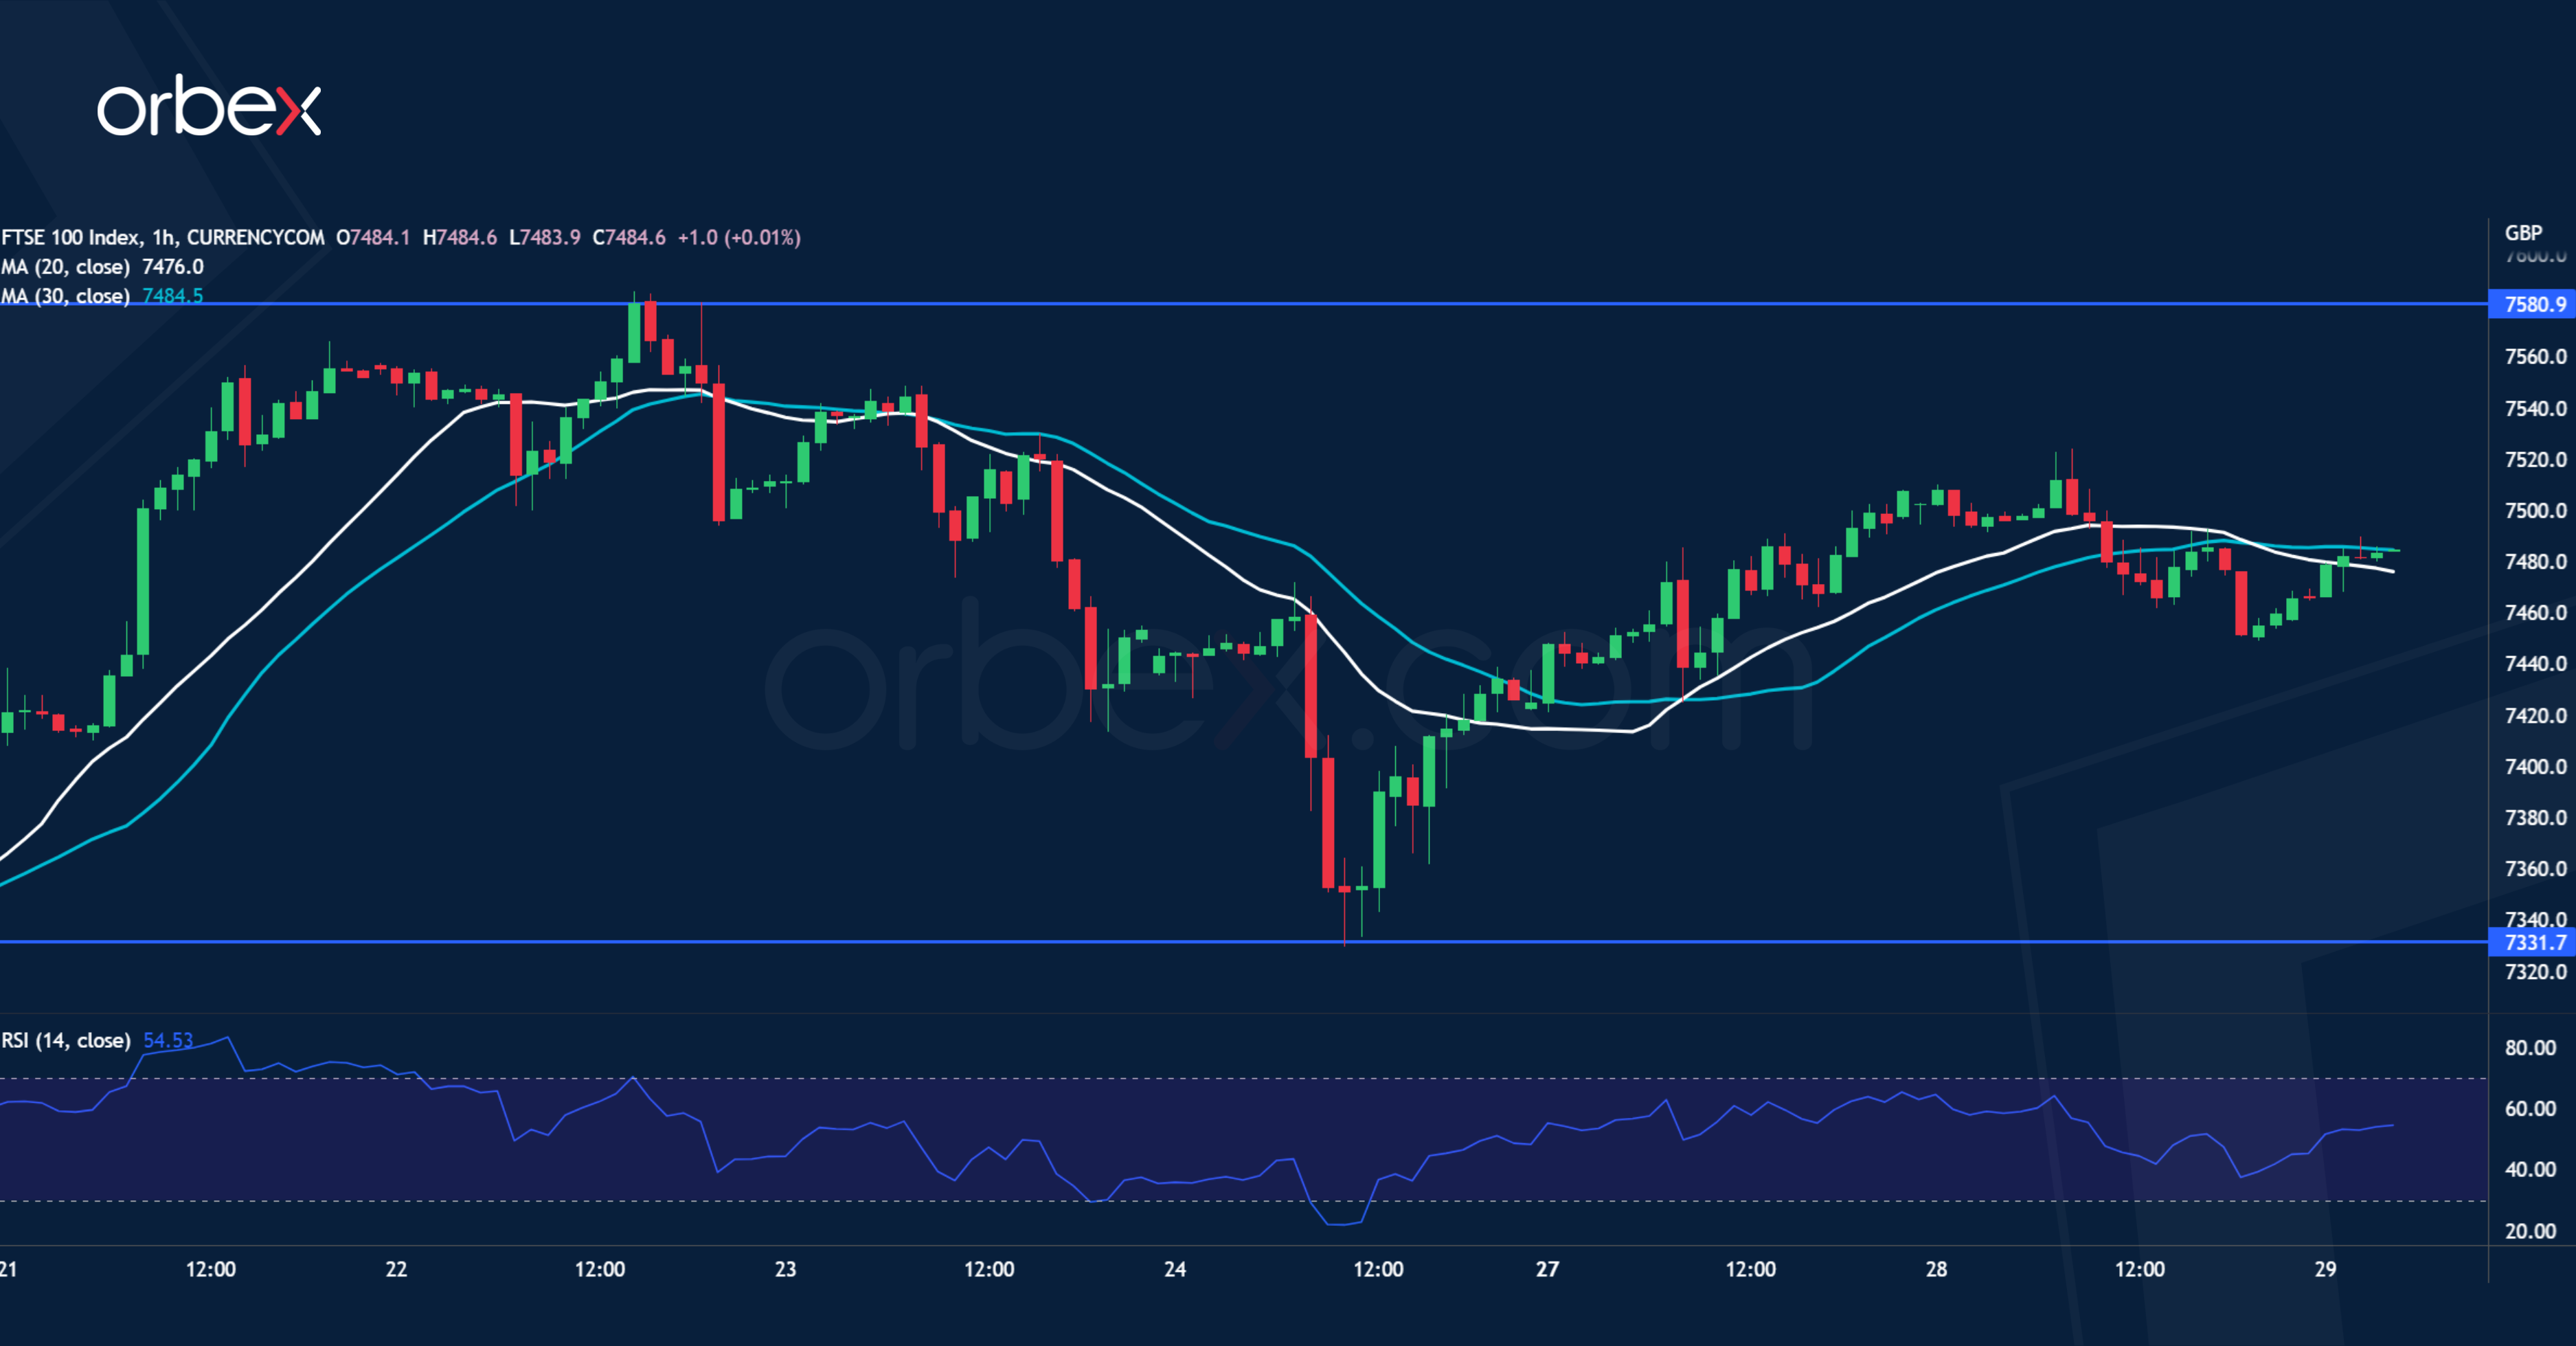
The FTSE 100 grinds higher thanks to gains in the energy sector. The index is still trying to secure a foothold after the sharp liquidation earlier this month. A bounce above the first resistance at 7500 has prompted sellers to trim their positions, easing the downward pressure. The bulls need to consolidate their gains above the demand zone 7200-7330 then lift the recent high of 7580 to trigger a broader recovery. Failing that, this would turn out to be a dead cat bounce and the index might head below 7100.
GBP/JPY Daily Outlook
Daily Pivots: (S1) 160.93; (P) 161.35; (R1) 161.97; More...
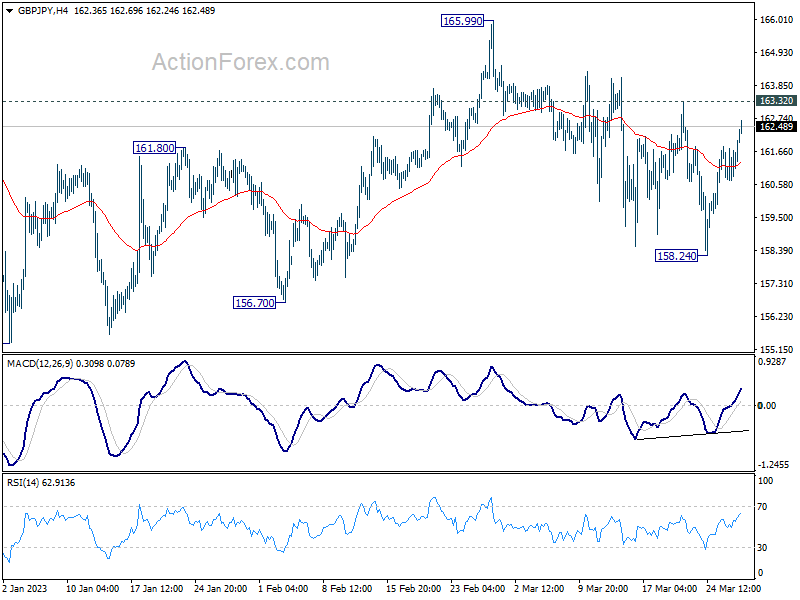
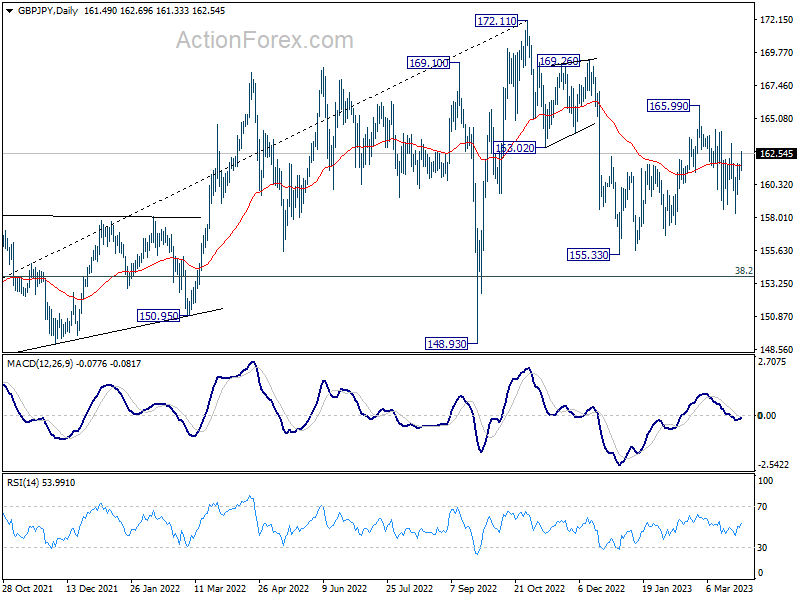
Intraday bias in GBP/JPY remains neutral at this point. Risk will stay on the downside as long as 163.32 resistance holds. Fall from 165.99 is seen as part of the whole fall from 172.11. Sustained break of 158.54 will argue that larger decline from 172.11 is resuming through 155.33 low. However, break of 163.32 will bring stronger rise back to 165.99 resistance instead.
In the bigger picture, as long as 38.2% retracement of 123.94 (2020 low) to 172.11 (2022 high) at 153.70 holds, medium term bullishness is retained. That is, larger up trend from 123.94 (2020 low) is still in progress. Break of 172.11 high to resume such up trend is expected at a later stage.
EUR/JPY Daily Outlook
Daily Pivots: (S1) 141.30; (P) 141.73; (R1) 142.40; More....
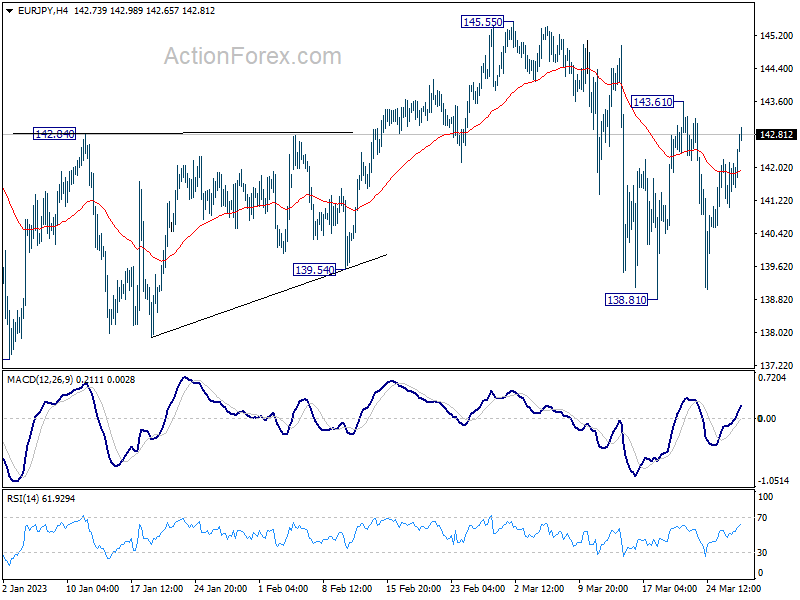
Range trading continues in EUR/JPY and intraday bias remains neutral. Risk remains on the downside as long as 143.61 resistance holds. Break of 138.81 will affirm the bearish case that fall from 145.55 is a leg inside the whole corrective decline from 148.38. Next target is 137.37 low, and then 135.40 fibonacci level. However, break of 143.61 will dampen the bearish case and bring stronger rise to 145.55 resistance instead.
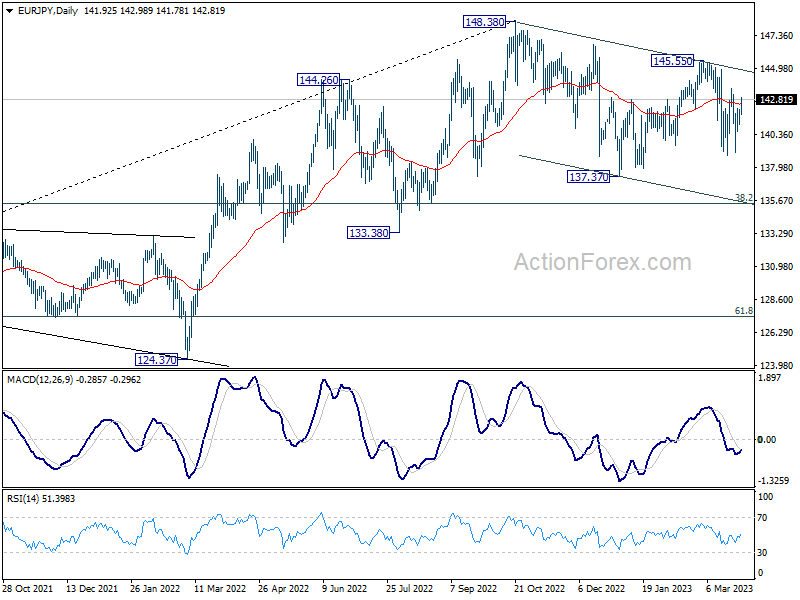
In the bigger picture, as long as 55 week EMA (now at 139.58) holds, larger up trend from 114.42 (2020 low) is still in progress for 149.76 long term resistance. However, sustained break of 55 week EMA will bring deeper fall to 38.2% retracement of 114.42 to 148.38 at 135.40. Decisive break there will raise the chance of trend reversal, and target 61.8% retracement at 127.39.
EUR/GBP Daily Outlook
Daily Pivots: (S1) 0.8771; (P) 0.8789; (R1) 0.8807; More...
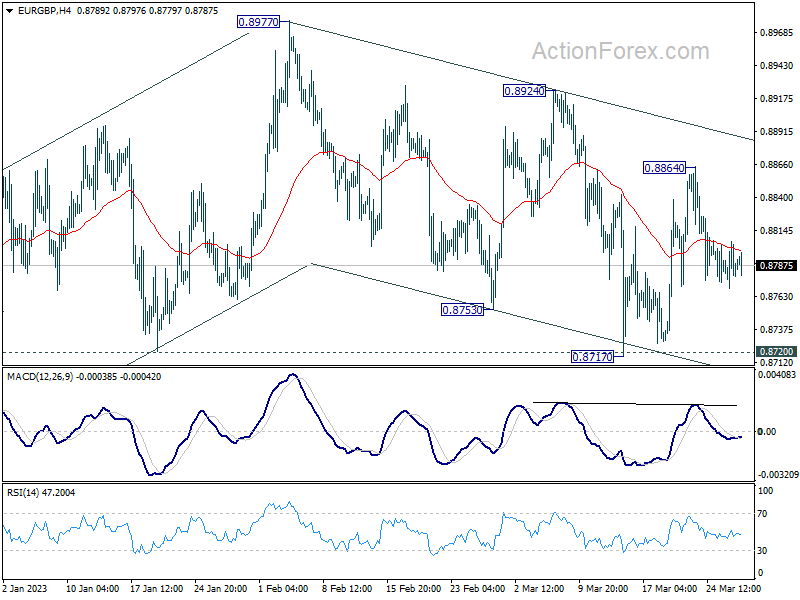
Outlook in EUR/GBP remains mixed and intraday bias stays neutral first. On the upside, break of 0.8864 will target 0.8924 resistance first. Firm break there should resume larger rise from 0.8545 through 0.8977 high. However, decisive break of 0.8717 support will resume the decline from 0.8977 instead.
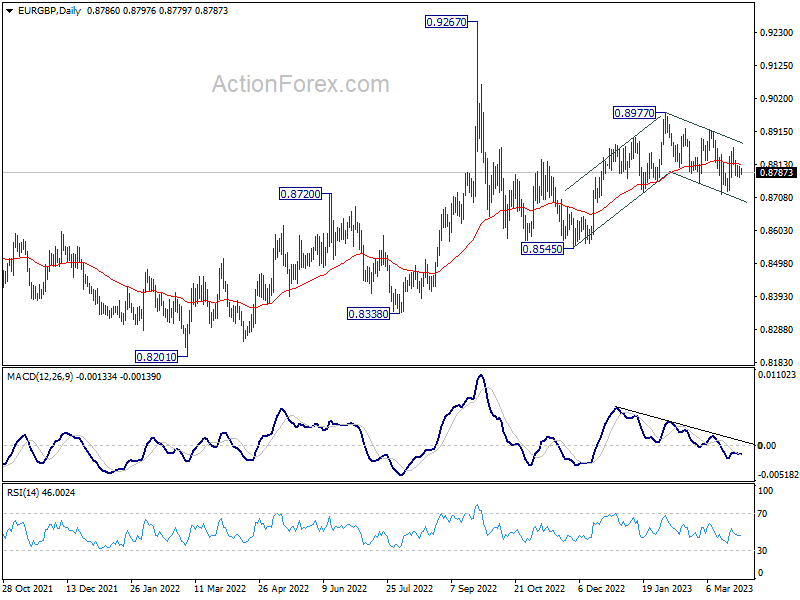
In the bigger picture, outlook remains rather mixed for now, except that price actions from 0.9267 (2022 high) are part of the long term range pattern from 0.9499 (2020 high). With 0.8720 support intact, rise from 0.8545 is in favor to continue through 0.8977. However, firm break of 0.8720 will argue that such rebound has completed, and open up deeper fall through this support level.
EUR/AUD Daily Outlook
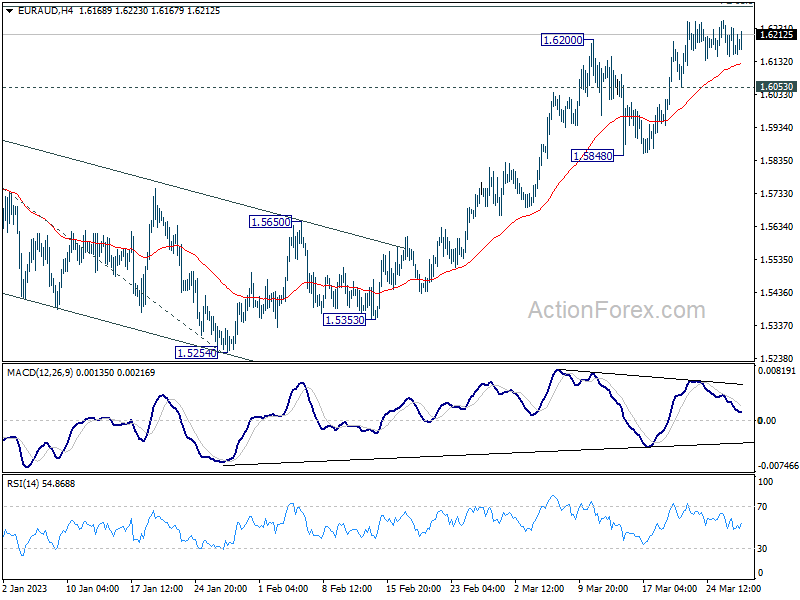
Daily Pivots: (S1) 1.6131; (P) 1.6188; (R1) 1.6225; More...
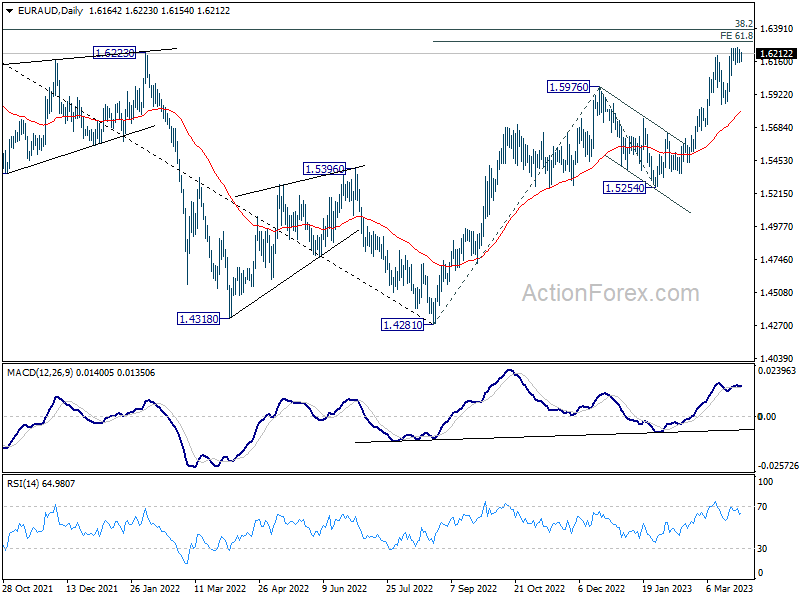
Sideway trading continues in EUR/AUD and intraday bias remains neutral. Further rally is expected as long as 1.6053 support holds. Decisive break of 61.8% projection of 1.4281 to 1.5976 from 1.5254 at 1.6302 will resume larger rally from 1.4281 to 1.6389 fibonacci level and then 1.6434 resistance. However, firm break of 1.6053 will indicate rejection by 1.6302 and turn bias back to the downside for 1.5848 support.
In the bigger picture, the strong support from 55 week EMA (now at 1.5404) is raising the chance of bullish trend reversal. Focus is now on 1.6434 cluster resistance (38.2% retracement of 1.9799 to 1.4281 at 1.6389). Sustained break there should confirm that whole down trend from 1.9799 (2020 high) has completed. Further rally should then be seen to 61.8% retracement at 1.7691. However, rejection by this cluster resistance will make medium term outlook neutral at best.
EUR/CHF Daily Outlook
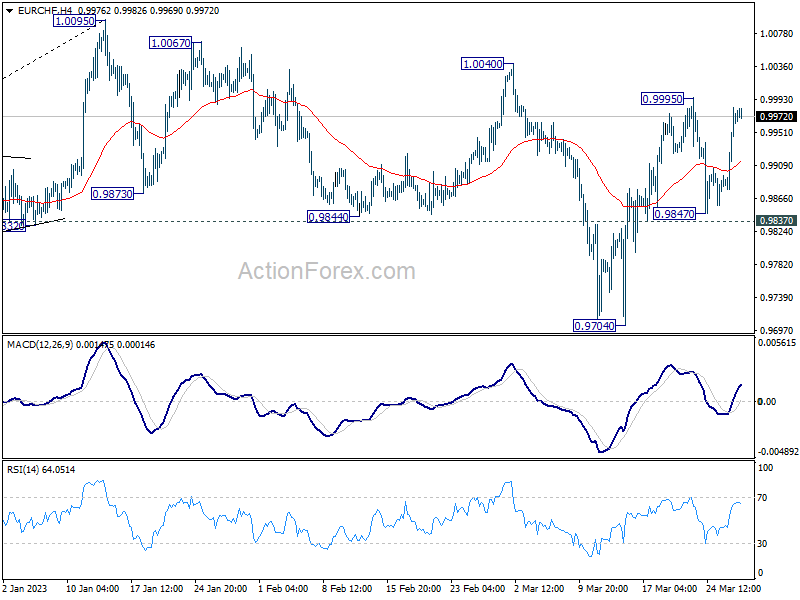
Daily Pivots: (S1) 0.9908; (P) 0.9946; (R1) 1.0013; More...
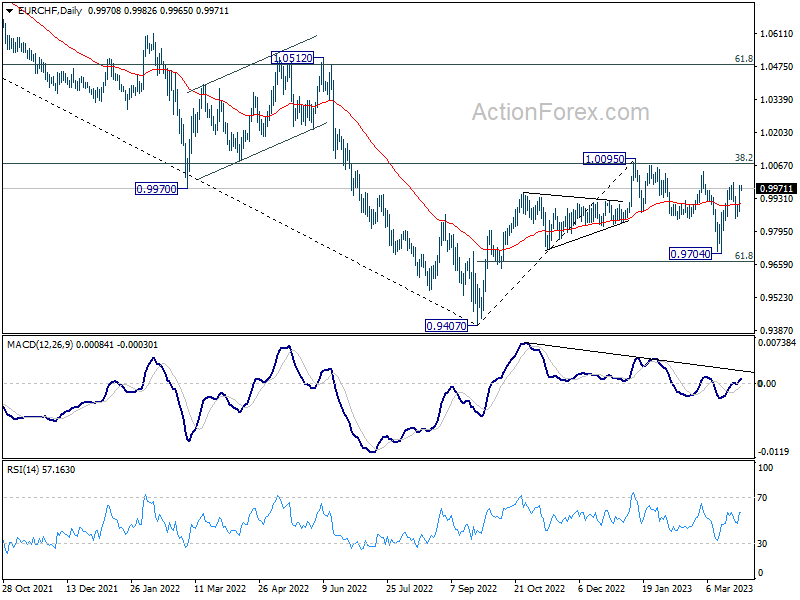
Intraday bias in EUR/CHF remains neutral and further rise is in favor with 0.9837 minor support intact. On the upside, break of 0.9995 will affirm the case that correction from 1.0095 has completed at 0.9704. Further rally should be seen through 1.0040 to retest 1.0095 high. However, firm break of 0.9837 will dampen this bullish view and turn bias back to the downside for 0.9704 support instead.
In the bigger picture, prior rejection by 55 week EMA (now at 1.1002) and 38.2% retracement of 1.1149 to 0.9407 at 1.0072 suggests that medium term outlook is staying bearish. That is, down trend from 1.2004 is not completed yet and is in favor to resume through 0.9407 at a later stage. However, decisive break of 1.0095 resistance will raise the chance of bullish trend reversal. Rise from 0.9407 should then target 1.0505 cluster resistance (2020 low at 1.0505, 61.8% retracement of 1.1149 to 0.9407 at 1.1484).
Cryptocurrencies Dispel Fears
Market picture
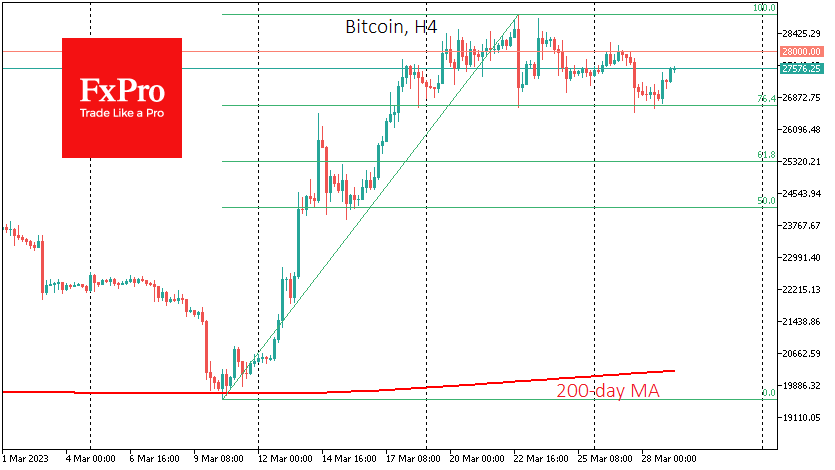
After spending most of Tuesday below $27.0K, bitcoin began to gain strength towards the end of the day, trading at $27.5K on Wednesday morning, up 2.3%. Total crypto market capitalisation rose 3% to $1.16 trillion, driven by general demands for risky assets following optimism around Alibaba and continued confidence in an imminent Federal Reserve rate cut.
Technically, BTCUSD found support from buyers after a correction to 76.4% of the rally since March 10th. Such shallow retreats (compared to a typical pullback to 61.8%) are characteristic of strong bull markets. More cautious investors may prefer to wait for confirmation of new bullish momentum with a takeover of $29.0K.
News background
Changpeng Zhao, head of major cryptocurrency exchange Binance, has denied allegations made by the Commodity Futures Trading Commission (CFTC). He said the CFTC’s claim contained an “incomplete statement of facts” and was “unexpected and disappointing”. Zhao pointed to the firm’s mandatory KYC programme, blocking US users, interaction with authorities and commitment to transparency.
Adam Cochran, a partner at venture capital firm Cinneamhain Ventures, described the CFTC’s lawsuit as an attempt to deal a fatal blow to Binance and did not rule out that the authorities “have a good chance of success”. The regulator classified BTC, Ethereum, Litecoin, USDT and BUSD as “commodities” in the lawsuit.
According to Thanefield Capital, exchange customers withdrew more than $1 billion from their accounts overnight following the CFTC’s lawsuit. According to Coinglass, Binance users started 3,611 BTC overnight. Binance’s spot market share shrank by nearly 10% in a week.
After a month of litigation, US authorities secured a $1 billion settlement between bankrupt crypto lender Voyager and Binance.US.
Speculators have stepped up transfers of BTC to exchanges, confirming profit-taking, Glassnode noted. However, most investors are willing to hold the coins for longer, hoping that the uptrend will continue.
Under pressure from critics, the UK government has abandoned the Royal Mint’s plans to issue non-exchangeable Royal Mint NFT tokens.
Elliott Wave Favors DAX Rally to Fail
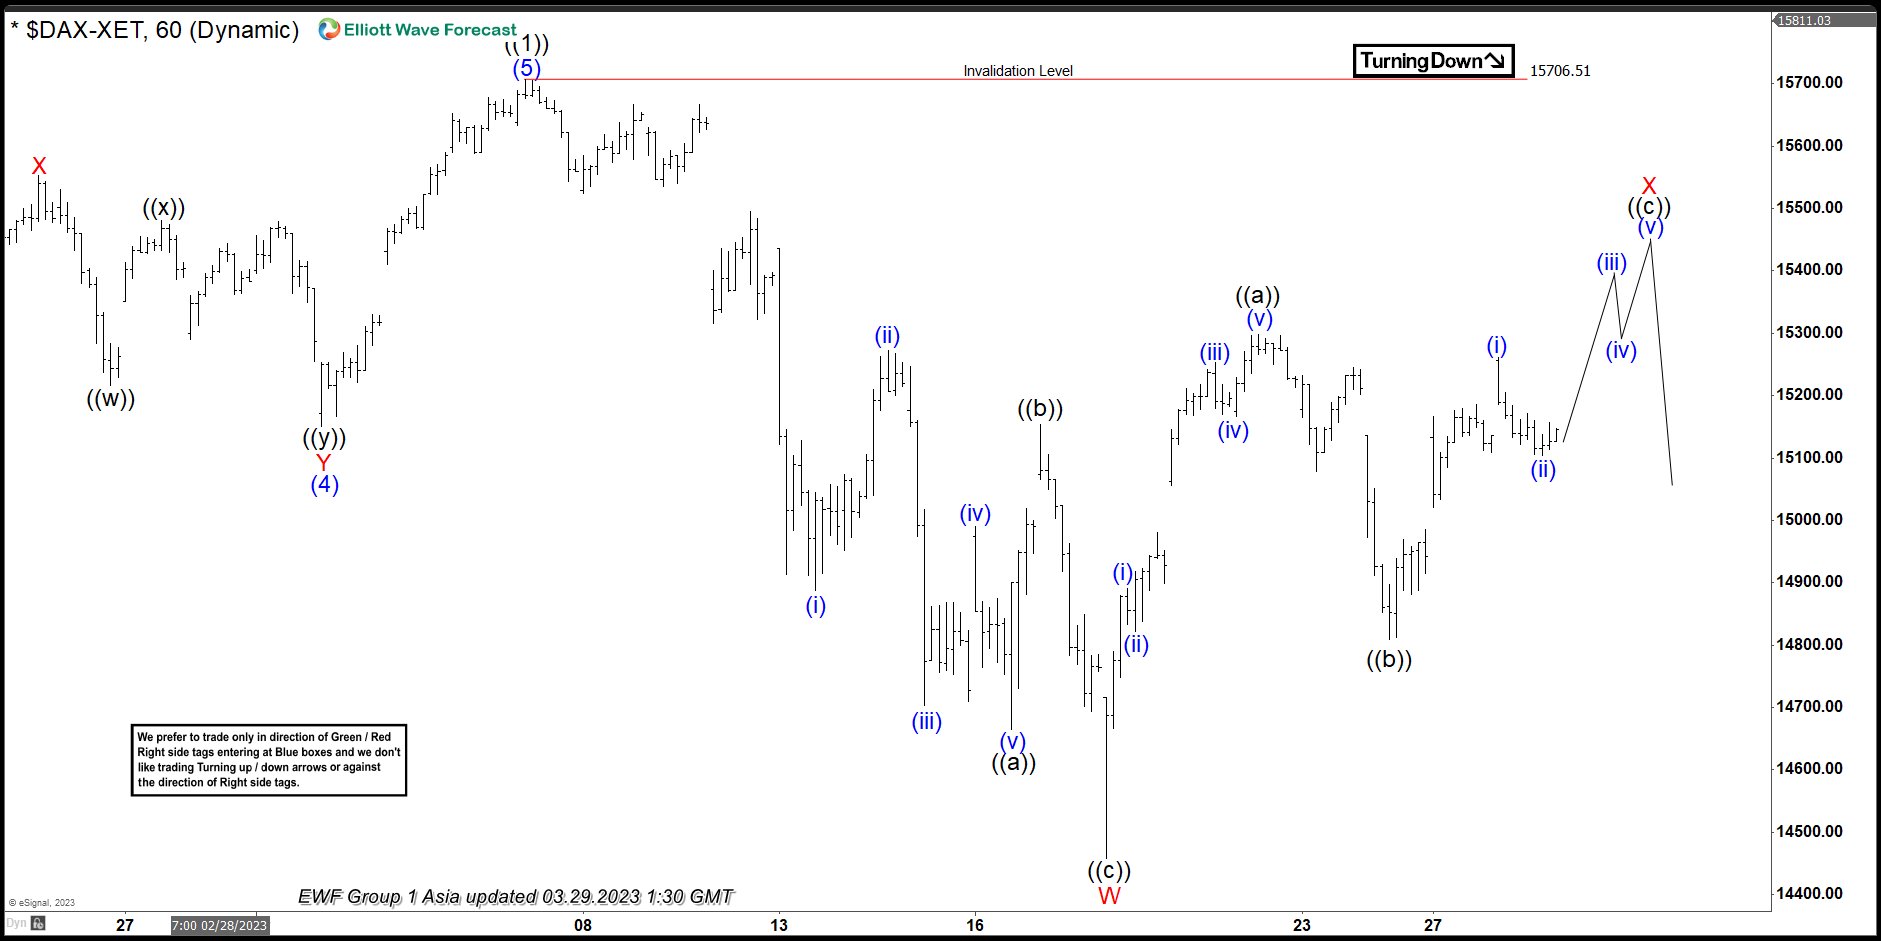
Cycle from 9.28.2022 low has ended as a 5 waves impulse at 15706.51. We labelled this rally as wave ((1)) as the 1 hour chart below shows. Wave ((2)) pullback is currently in progress to correct cycle from 9.28.2022 low. The decline from wave ((1)) peak on March 7, 2023 is unfolding as a double three Elliott Wave structure. Down from March 7, 2023 high, wave ((a)) ended at 14664.17 and rally in wave ((b)) ended at 15153.11. Final leg wave ((c)) lower ended at 14458.39 which completed wave W in higher degree. Wave X rally is now in progress to correct cycle from 3.7.2023 high with internal subdivision as a zigzag structure.
Up from wave W, wave ((a)) ended at 15298.49 and pullback in wave ((b)) ended at 14809.82. Wave ((c)) higher is in progress to retest wave ((1)) high at 15706.51 before the Index turns lower. A 100% Fibonacci extension of wave ((a)) comes at 15644.18 which is a possible target for wave ((c)) of X. Near term, as far as pivot at 15706.51 high stays intact, expect the rally to fail and the Index to resume lower again.
DAX 1 Hour Elliott Wave Chart
DAX Elliott Wave Video
https://www.youtube.com/watch?v=4pH4o56d-jc