Sample Category Title
Current Cautiously Optimistic Asian Risk Mood to Spill Over into European Dealings
Markets
Calm returned after a nervous European opening yesterday. The Swiss government with the UBS-Credit Suisse deal sent a shockwave through the AT1 bond market which spilled over to other market segments too. European regulators in a statement reiterated their view on the matter, stressing that shareholders remain the first in line to absorb any losses. Equities in Europe and the US eventually rebounded up to 1% in a general sigh of relief after Credit Suisse’s rescue. Core bonds gave back all or more of their early morning surge. US yields closed 4.5-13.9 bps higher in an inversion deepener. German yields at the front reversed a 30 bps decline to close less than 3 bps lower at the end. Longer-term bond yields added 1.7-5.1 bps. Appearing before the European Parliament, ECB president Lagarde stuck to her message delivered last week and said there’s more ground to cover. She did add that “Financial-stability tensions might have an impact on demand, and might actually do part of the work that would otherwise be done by monetary policy.” The impact is uncertain, she said, but it will have to be taken into account when deciding about the next move and producing the next projections. The US dollar stayed in the defensive on currency markets. DXY closed below 103.35 support, EUR/USD moved towards the 1.0735 resistance level. Sterling was boosted to EUR/GBP 0.8733, heavily testing the 0.8735 resistance area. Cable (GBP/USD) closed above 1.22 for the first time since early February. The Swiss franc tumbled against the background of improved sentiment. EUR/CHF soared to 0.9963.
The Asian session is a quiet one. Shares recoup some of the losses incurred yesterday. Helping sentiment were reports that the US is exploring ways to temporarily guarantee all bank deposits should tensions intensify. Chinese stocks outperform. Japan is closed (Equinox Day). Core bonds in thin(ner) trading eke out some gains, suggesting a lower cash yield open. The euro and the dollar take the lead with the latter having a slight edge, preventing EUR/USD to power through 1.0735. The current cautiously optimistic Asian risk mood is set to spill over into European dealings. With the sting out of the CS issue for now, we think this could color trading for today. We don’t expect any major moves though given the empty economic calendar and the Fed policy meeting looming (tomorrow). ECB president Lagarde is scheduled to speak later today but after yesterday and given the event (innovation summit), it’s unlikely she’ll give us anything new.
News Headlines
Minutes of the previous meeting by the Reserve Bank of Australia showed that members considered pausing the interest rate hiking cycle instead of delivering a 25 bps rate hike (to 3.6%). “Members agreed to reconsider the case for a pause at the following meeting, recognizing that pausing would allow additional time to reassess the outlook for the economy. At what point it will be appropriate to pause will be determined by data and the board’s assessment of the outlook.” The latter featured somewhat differently in the post-meeting statement which suggested that more tightening will be needed, but that in assessing when and how much further interest rates need to increase, the Board will be paying close attention to developments in the global economy, trends in household spending and the outlook for inflation and the labour market. AUD swap yields cede up to 10 bps this morning, though especially at the long end of the curve. Recent market turmoil already reduced the odds of additional RBA-tightening down the road, with markets pricing a cumulative 50 bps rate cuts by year-end. AUD/USD loses slightly ground this morning, switching sides around the 0.67 big figure.
The French government narrowly survived two confidence votes on its unpopular decision to push through its pension reform bill – including raising the minimum retirement age from 62 to 64 years - without a parliamentary vote. The first motion got 278 votes; only 9 short to topple PM Borne. The second no-confidence motion received 94 votes. If one of the no-confidence votes had been successful, the bill would have been nullified and Borne would have had to resign. Opposition parties are now exploring other measures such as a review by the constitutional court or a public referendum to nevertheless block the bill.
Equities Gain, Bonds Confused, as Fed Meets
Bank stocks had a volatile session on Monday. UBS lost up to 16% after the Credit Suisse deal but closed the session more than 1% higher.
In the US, JP Morgan, Goldman Sachs and Morgan Stanley closed the day with 1 to 2% of gains. The regional US banks also had a calm session, except for the First Republic Bank - which plunged 47% after a second credit downgrade in just a week from S&P.
JP Morgan is reportedly in talks with other leading banks to do more, after big US banks put a combined $30 billion in the First Republic Bank as a show of support last week.
In bonds, the announcement of full write-down of Credit Suisse’s AT1 bonds got bond investors confused, as equities should be written down before any other paper in the ‘bonds’ category. Authorities said that equities will be written down first to end confusion. JP Morgan and Morgan Stanley said that they are willing to buy CS’s AT1 bonds for 2 cents to sell them back ‘somewhere’ for 5 cents.
The BoFA’s implied bond volatility index MOVE is lower than last week’s peak but is still at the highest levels since 2007/2008 subprime crisis.
Equity traders, however, are focused on waning bank stress; the S&P500 closed the day 0.89% up, as Nasdaq 100 gained 0.34%.
Fed meets
The Federal Reserve (Fed) begins its two-day policy meeting today in the middle of a storm.
If the European Central Bank (ECB) decision serves as a cheat sheet, the Fed could hike by 25bp and say that it has tools to inject liquidity in the system to contain crisis.
Investors are also focused on what the Fed will do with the Quantitative Tightening (QT). I don’t think that the Fed will reverse its balance sheet unwinding strategy, or to pause it – because the crisis intervention is a tactical and a short-term move, while the Fed’s huge $8.6 trillion balance sheet must be unwound sooner rather than later.
In this context, the Fed’s balance sheet ticked higher since the SVB collapse, but the Fed members couldn’t comment on the latest events, because the trouble hit the fan while they were in their pre-Fed quiet period.
As a result, all the comments that have not been made since the SVB collapse will come out from Fed Chair Jerome Powell’s mouth, and the March dot plot tomorrow after the decision.
This morning, activity on Fed funds futures assesses a 75% chance for a 25bp hike. This probability tipped a toe below 50% yesterday.
In the FX, the US dollar index slipped below the 50-DMA yesterday on expectation that the Fed will stay cautious at this week’s meeting given the turmoil across the financial place.
Gold traded above the $2000 psychological mark on Monday, but the price of an ounce is back to below $1980 this morning, thanks to the calming nerves regarding the price action on the banks front. A further improvement in sentiment could rapidly pull the price of an ounce to $1900 mark.
Improving Risk Sentiment
Market movers today
Today's key data release will be the ZEW index from Germany. We expect though that the index does not yet fully reflect recent market turbulence.
From the US, we get existing home sales data.
ECB's Lagarde will be on the wires again today. In her remarks yesterday, she did not give any new signals but confirmed that the ECB is following market developments closely and remains ready to provide liquidity if necessary. However, interest rates remain their primary tool as inflation is projected to remain too high for too long.
The 60 second overview
Markets: Risk sentiment started very shaky yesterday on the back of the UBS' takeover of Credit Suisse but strongly recovered during the day. Equities in the US and Europe both closed higher. Concerns in the banking sector still lingers as shares of First Republic Bank fell 47% after another downgrade. 2-year US Treasury yield ended the day where it started around 4% but was down to 3.63% during the day, which underlines that volatility still persists. This morning, positive sentiment has spilled over to Asia where equity markets broadly are in green and equity futures point to a green opening in US and Europe.
Takeover of Credit Suisse: Yesterday marked the first day following the announcement of UBS' takeover of Credit Suisse, which saw the AT1s of the latter being wiped out. Unsurprisingly, the AT1 segment was under heavy pressure from the morning, though sentiment improved during the day. The same development was visible in iTraxx indices which opened the day sharply wider, but actually recovered so that Main ended the day 3bp tighter at 98bp, while Xover ended just 7bp wider at 501bp, the latter having peaked at 580bp during the morning.
FI: It was again a dramatic day in the global financial markets after Credit Suisse was taken over by UBS during the weekend. The markets were under pressure as holders of Credit Suisse AT1 debt took a full loss while there was still some value for the Credit Suisse equity holders. This was a very unusual restructuring of a bank and European authorities have been out stating that for European bank holders of AT1 debt will only take a loss after the equity holders.
Hence, initially there was a significant drop in yields and rates but later during the day the markets calmed down and the yield on 10Y German government bonds rose 2bp. Furthermore, the Schatz ASW-spread which was above 100bp in the morning rebounded and closed the day around 85bp. 10Y Treasury yields rose some 6bp, while 2Y yields closed up 15bp, but the intraday move was massive.
FX: The start to the week in G10 FX market was relatively quiet despite the big gyrations in the equity, credit and fixed income market. SEK and GBP came out on top, while USD, CHF and NZD lost out. EUR/USD reversed a drop below 1.0650 and ended the day above 1.07.
Nordic macro
The Riksbank's Anna Breman will speak on the very timely topic "Monetary Policy in a troubled world". We would expect that she elaborates on the Riksbank's priorities when it comes to inflation vs banking worries and the risks of the current market turmoil from a Swedish perspective. So far, the Riksbank has seemingly downplayed the risks to the Swedish banking sector and latest Riksbank speeches and comments have been more focused on getting inflation down.
Technical Outlook and Review
DXY:
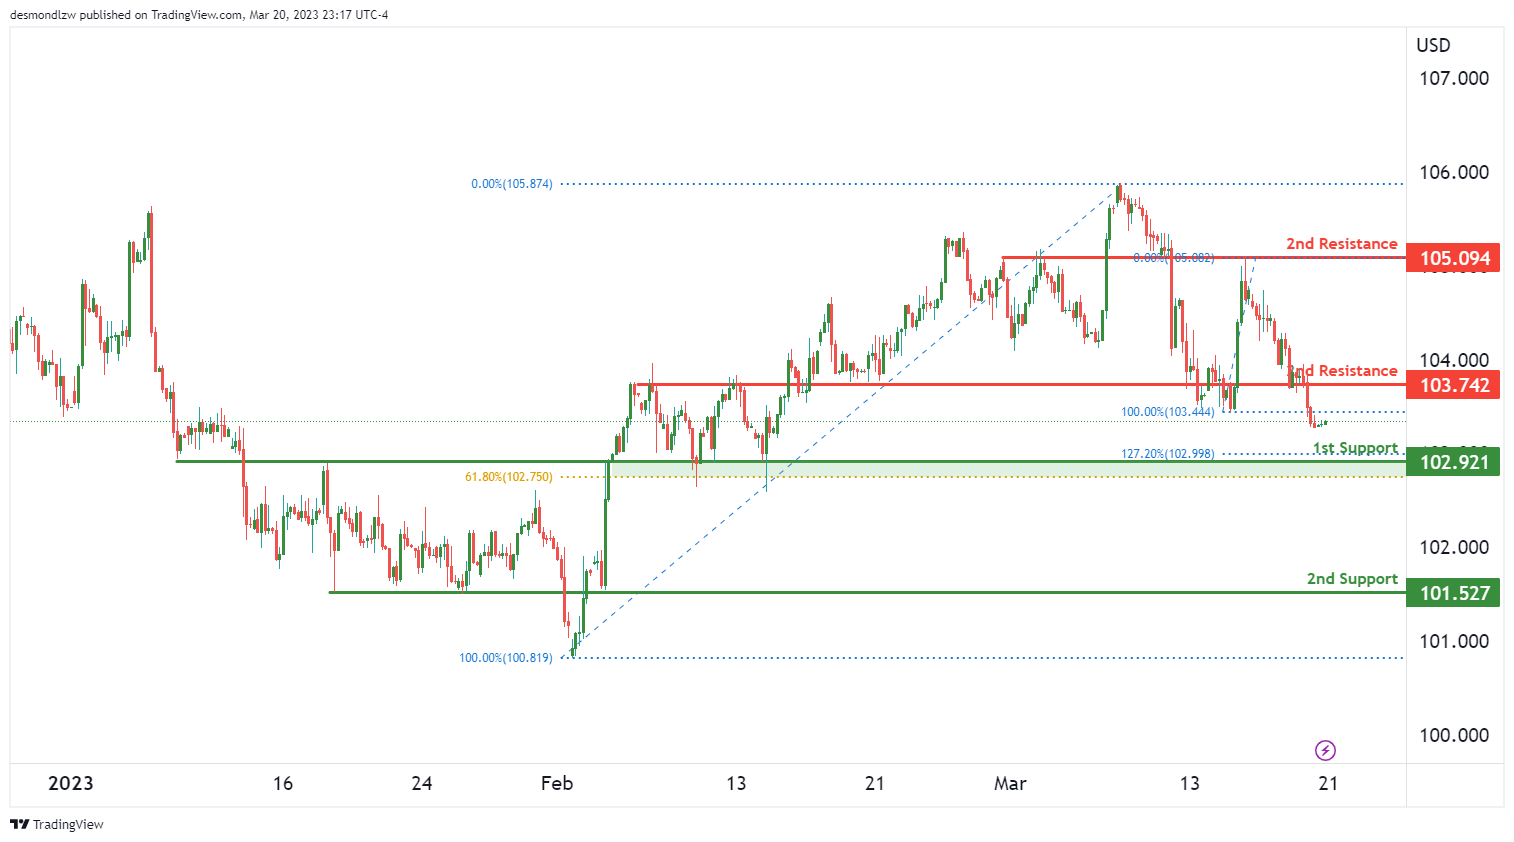
The DXY chart is currently showing a neutral momentum, which suggests that the price could potentially fluctuate between the 1st resistance and 1st support level.
The 1st support level is at 102.92, which is a strong overlap support and has a 61.80% Fibonacci retracement lining up with it. Additionally, there is an intermediate support level at 101.53, which is also an overlap support.
On the other hand, the 1st resistance level at 103.74 is another strong overlap support, and the 2nd resistance level at 105.09 is an overlap resistance. These levels could potentially limit any bullish movements.
EUR/USD:
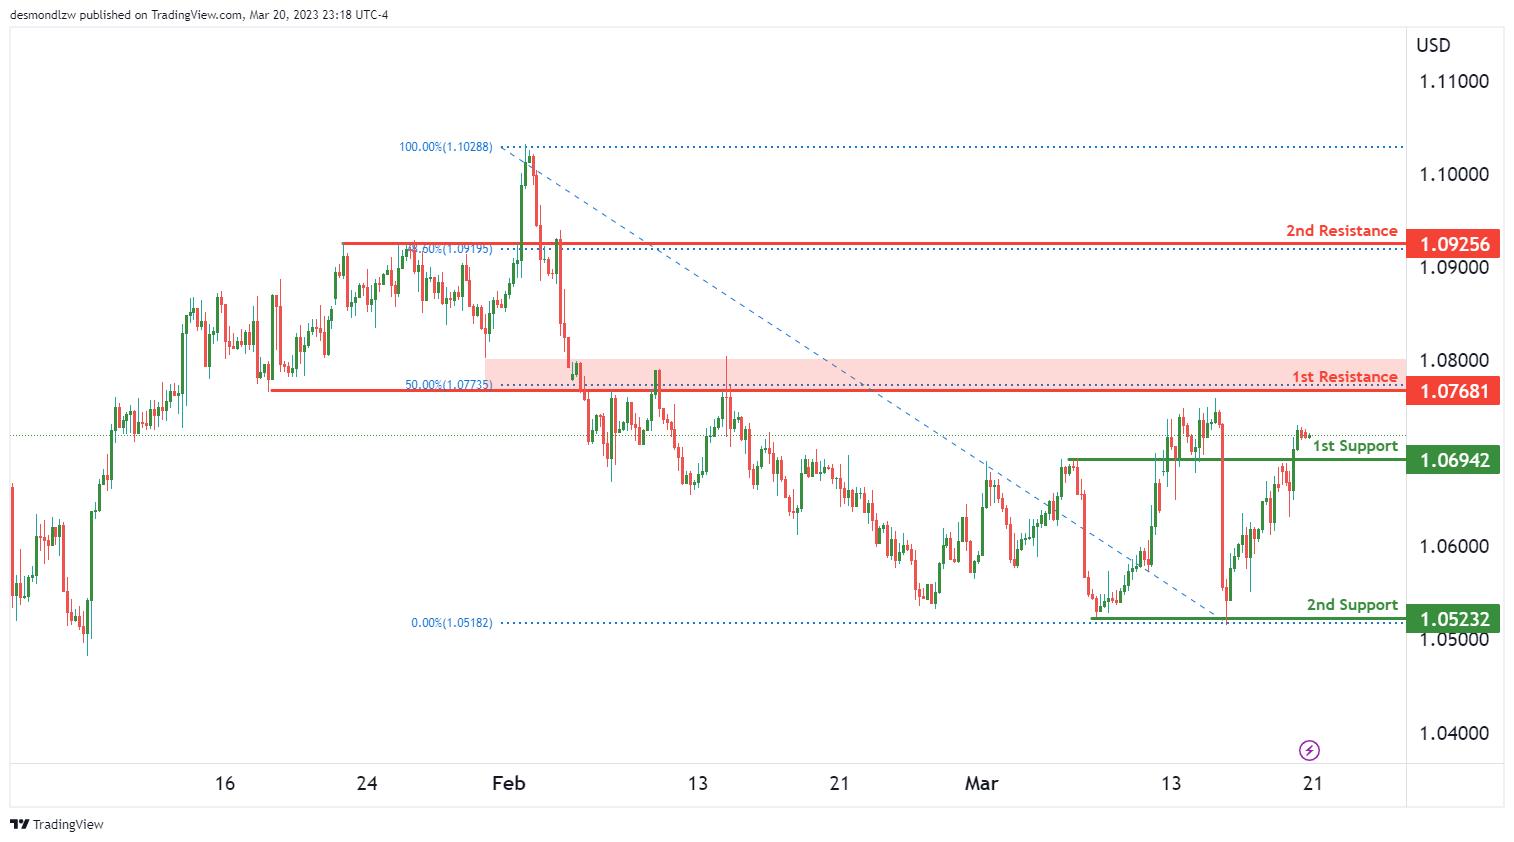
The EUR/USD chart exhibits bullish momentum, with potential for a continuation towards the 1st resistance level.
The 1st support level at 1.0694 is a strong overlap support, while the 2nd support level at 1.0523 is a multi-swing low support.
On the other hand, the 1st resistance level at 1.0768 is an overlap resistance, and also coincides with the 50% Fibonacci retracement level. If price manages to break this level, it could head towards the 2nd resistance level at 1.0925, which is a pullback resistance and has a 61.80% Fibonacci retracement level lining up with it.
GBP/USD:
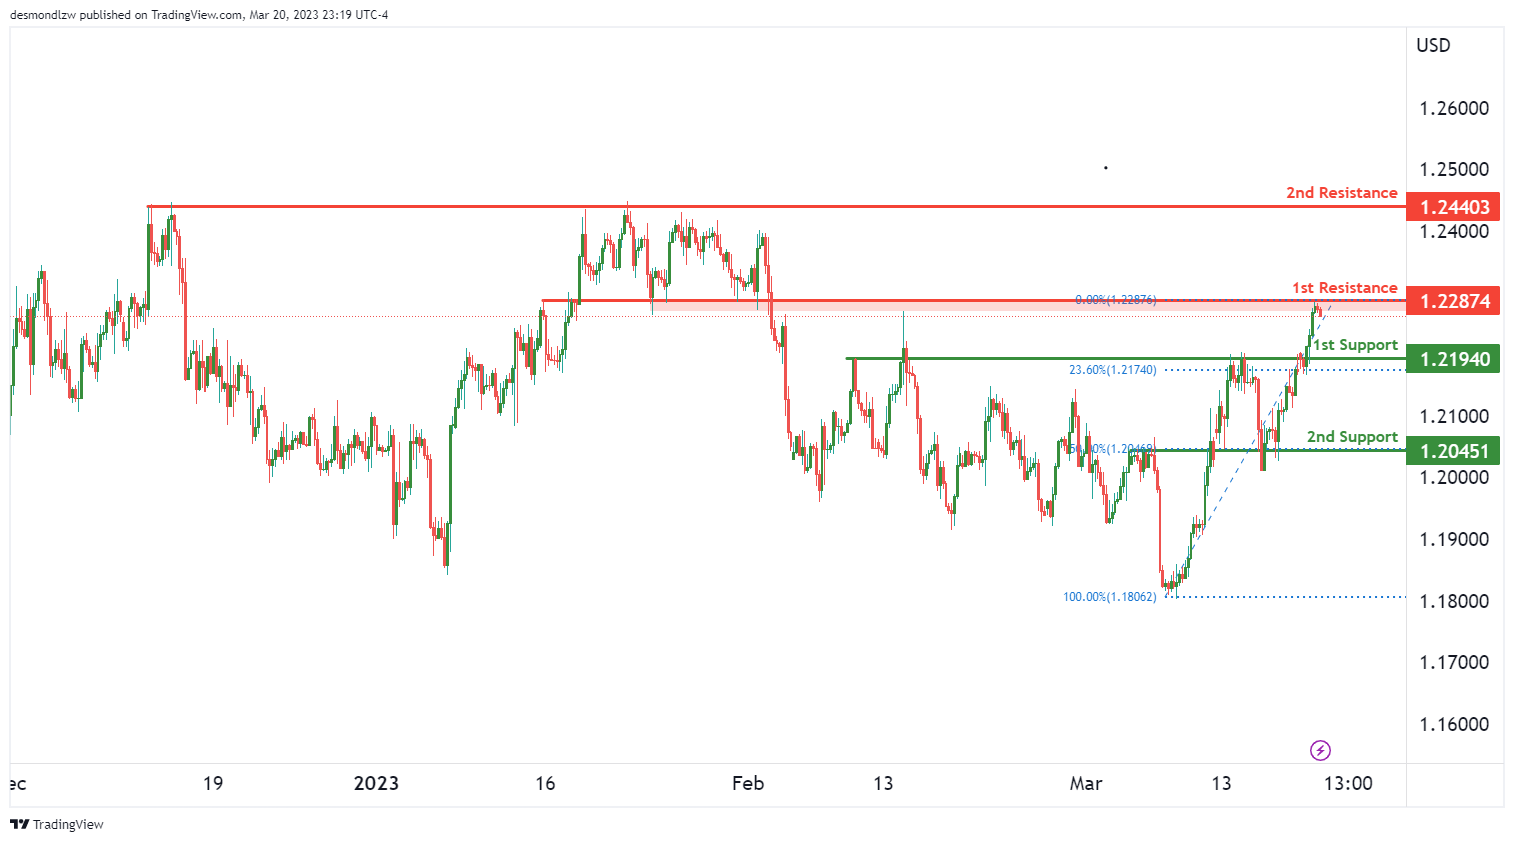
The GBP/USD chart is showing bearish momentum, suggesting a potential bearish reaction off the 1st resistance level towards the 1st support level.
The 1st support level is at 1.2194, which is a pullback support level and has a 23.60% Fibonacci retracement lining up with it. If price were to break below this level, the next support level it could reach is the 2nd support at 1.2045, which is also a pullback support level and has a 50% Fibonacci retracement lining up with it.
On the other hand, the 1st resistance level at 1.2287 is an overlap resistance level that could potentially limit any bullish movements. Beyond that, the 2nd resistance level at 1.2440 is a significant swing high resistance level.
USD/CHF:
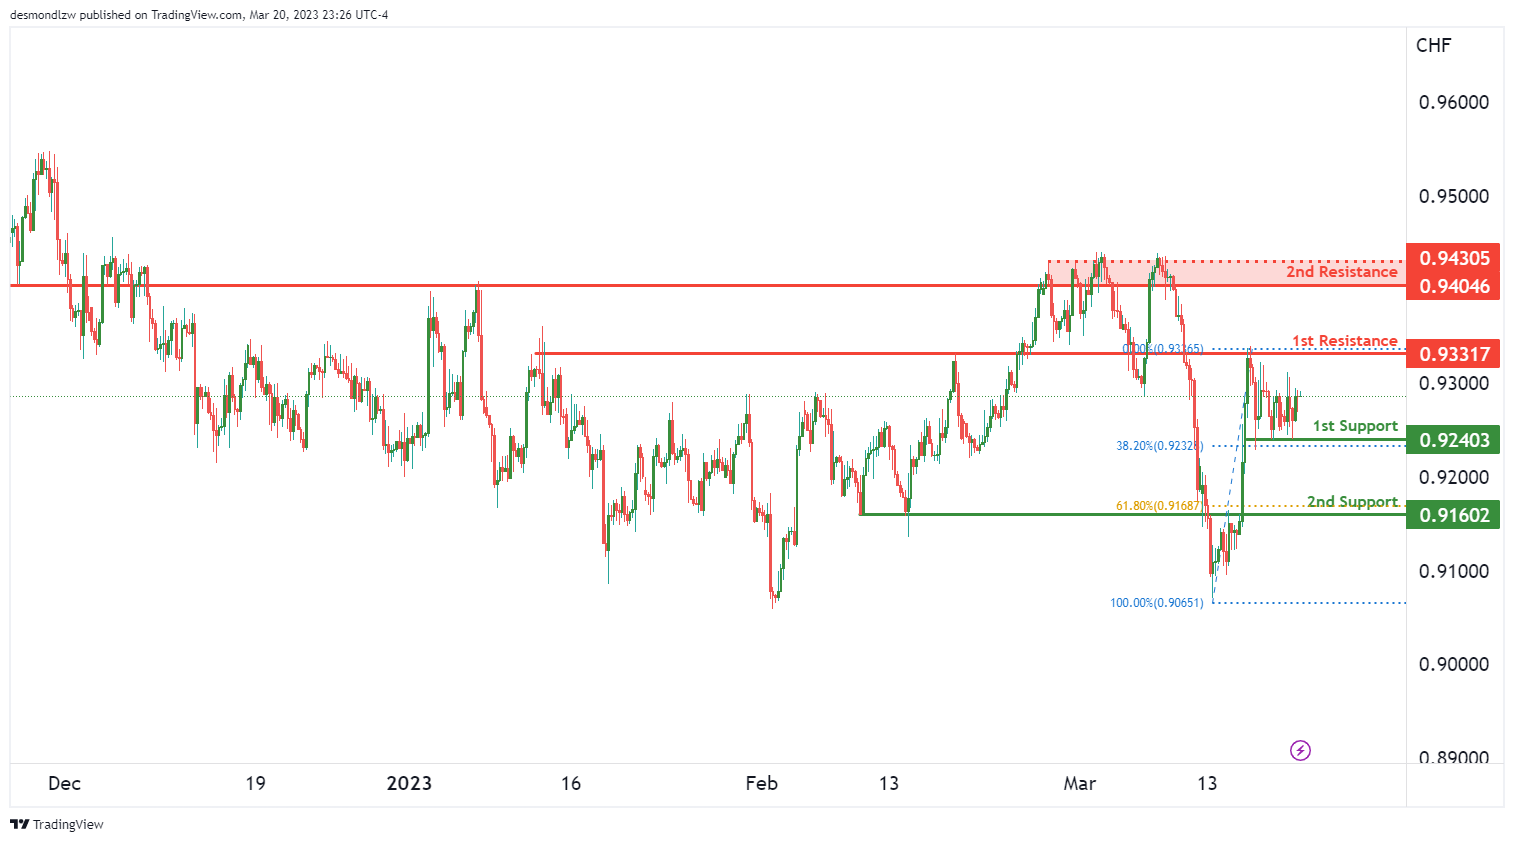
The USDCHF chart currently exhibits a neutral momentum, with potential for price to fluctuate between the 1st resistance and 1st support level. The 1st support level at 0.9240 is a strong overlap support and has a 38.20% Fibonacci retracement lining up with it, making it a potential area for price to bounce off from. If price were to break below this level, it could drop towards the 2nd support at 0.9160, which is another overlap support level and has a 61.80% Fibonacci retracement lining up with it.
On the other hand, the 1st resistance level at 0.9331 is a significant overlap resistance, which could potentially limit any bullish movements. If price were to break above this level, it could head towards the 2nd resistance level at 0.9430, which is a swing high resistance level.
USD/JPY:
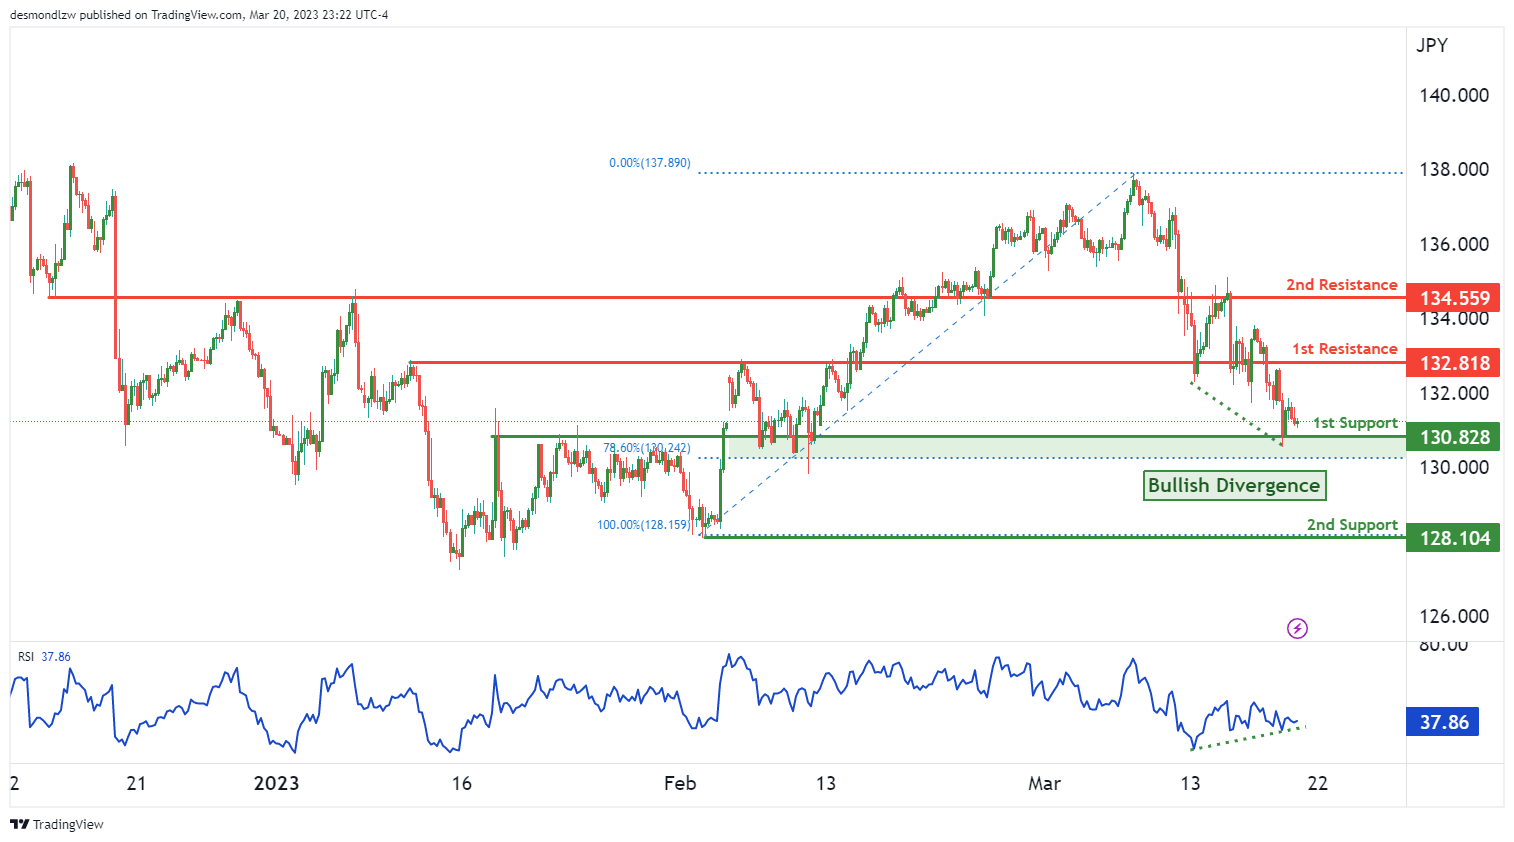
The USD/JPY chart currently shows bullish momentum and has the potential to bounce off the 1st support level and head towards the 1st resistance level. The 1st support level is at 130.8200, which is a strong overlap support level and has a 78.60% Fibonacci retracement lining up with it. The next support level is at 128.1000, which is a multi-swing low support level.
On the other hand, the 1st resistance level at 132.8100 is a significant overlap resistance level. If price manages to break through this resistance level, it could move towards the 2nd resistance level at 134.5500, which is another important overlap resistance level.
Additionally, the RSI indicator is showing bullish divergence versus price, suggesting that a potential bounce could occur soon.
AUD/USD:
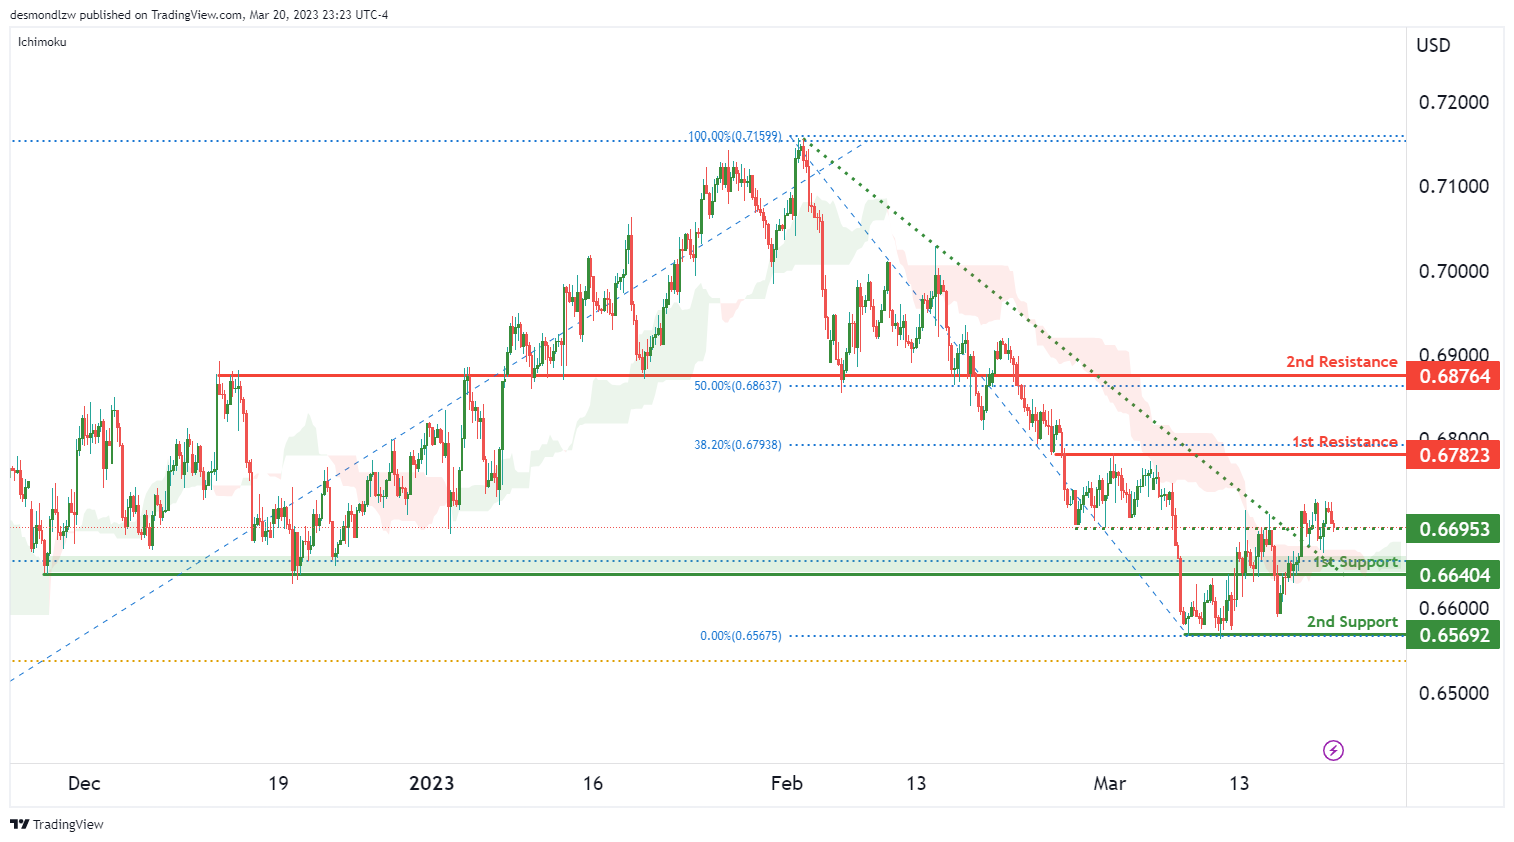
The AUD/USD chart is currently exhibiting bullish momentum, as price has broken above a descending resistance line and crossed above the Ichimoku cloud. In terms of potential price movement, there could be a continuation of this bullish trend towards the first resistance level.
The first support level is at 0.6640, which is a strong overlap support level. The second support level at 0.6569 is a multi-swing low support level, which price has bounced off multiple times in the past.
On the other hand, the first resistance level at 0.6782 is a multi-swing high resistance level, which also aligns with the 38.20% Fibonacci retracement level. If price were to break above this level, it could head towards the second resistance level at 0.6876, which is another significant overlap resistance level.
NZD/USD:
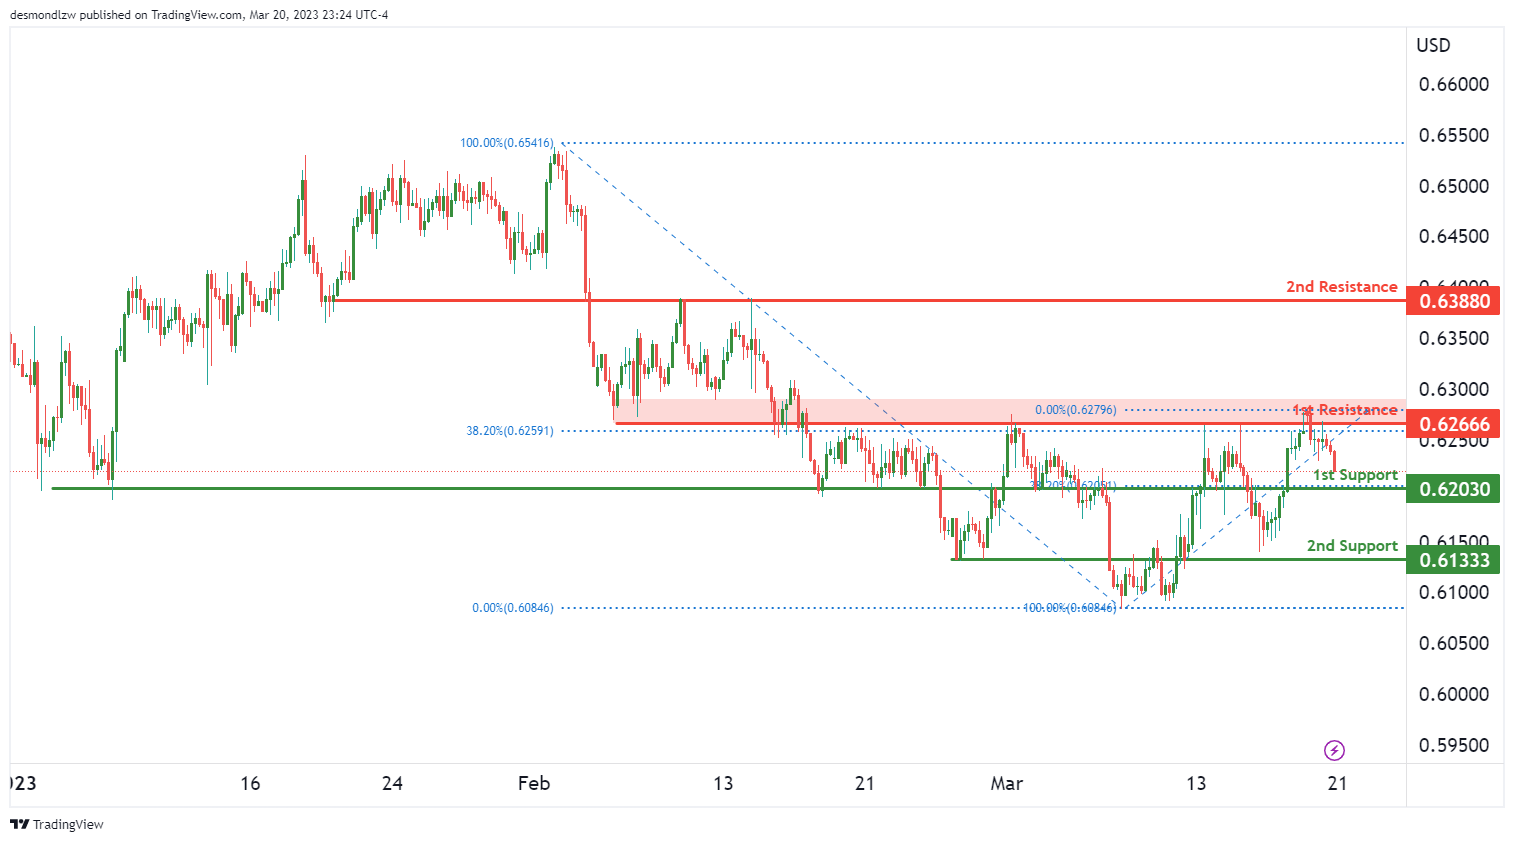
Due to the bearish momentum of the NZD/USD chart, the price could potentially have a bearish reaction off the 1st resistance level at 0.6266 and drop towards the 1st support level at 0.6203. This support level is an overlap support and coincides with the 38.20% Fibonacci retracement, which could provide significant support to the price.
If the price were to break below the 1st support level, the next support level it could reach is the 2nd support level at 0.6133, which is also an overlap support level.
On the other hand, if the price manages to break through the 1st resistance level, it could potentially move towards the 2nd resistance level at 0.6388, which is a pullback resistance level.
It’s worth noting that the overall momentum of the chart is bearish, so a bearish bias remains despite the potential for short-term price fluctuations.
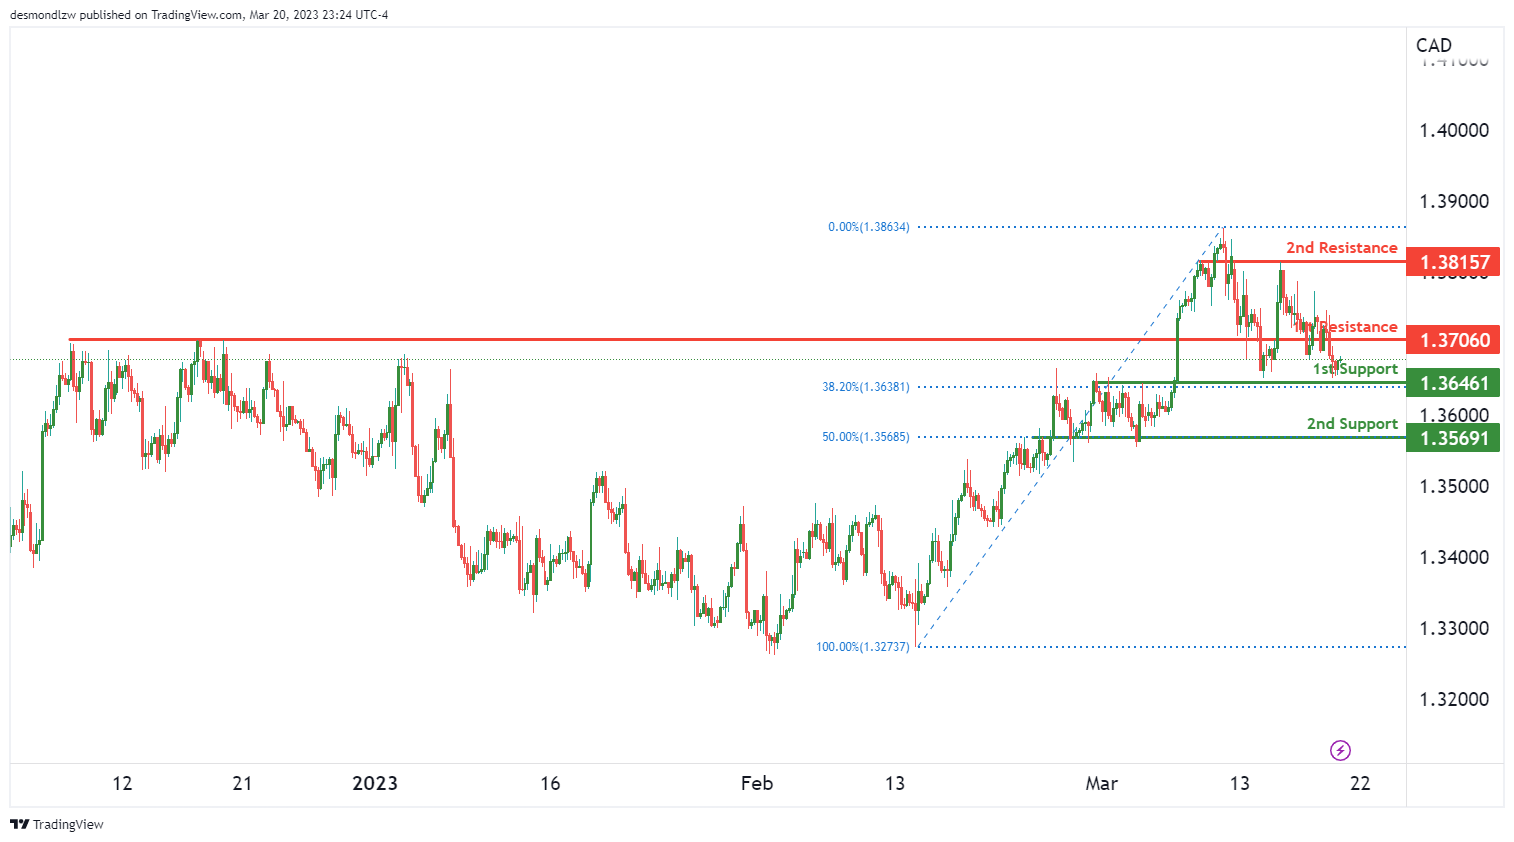
USD/CAD:
The USD/CAD chart has a bullish momentum, and the price could potentially bounce off the first support and head towards the first resistance level. The first support level is at 1.3646, which is a pullback support and has a 38.20% Fibonacci retracement lining up with it. If the price were to bounce off this level, it could rise towards the first resistance at 1.3706, which is an overlap resistance level.
If the price were to break above the first resistance level, it could head towards the second resistance at 1.3815, which is a pullback resistance level. On the other hand, if the price were to break below the first support level, it could drop to the second support level at 1.3569, which is another pullback support level and has a 50% Fibonacci retracement lining up with it.
DJ30:
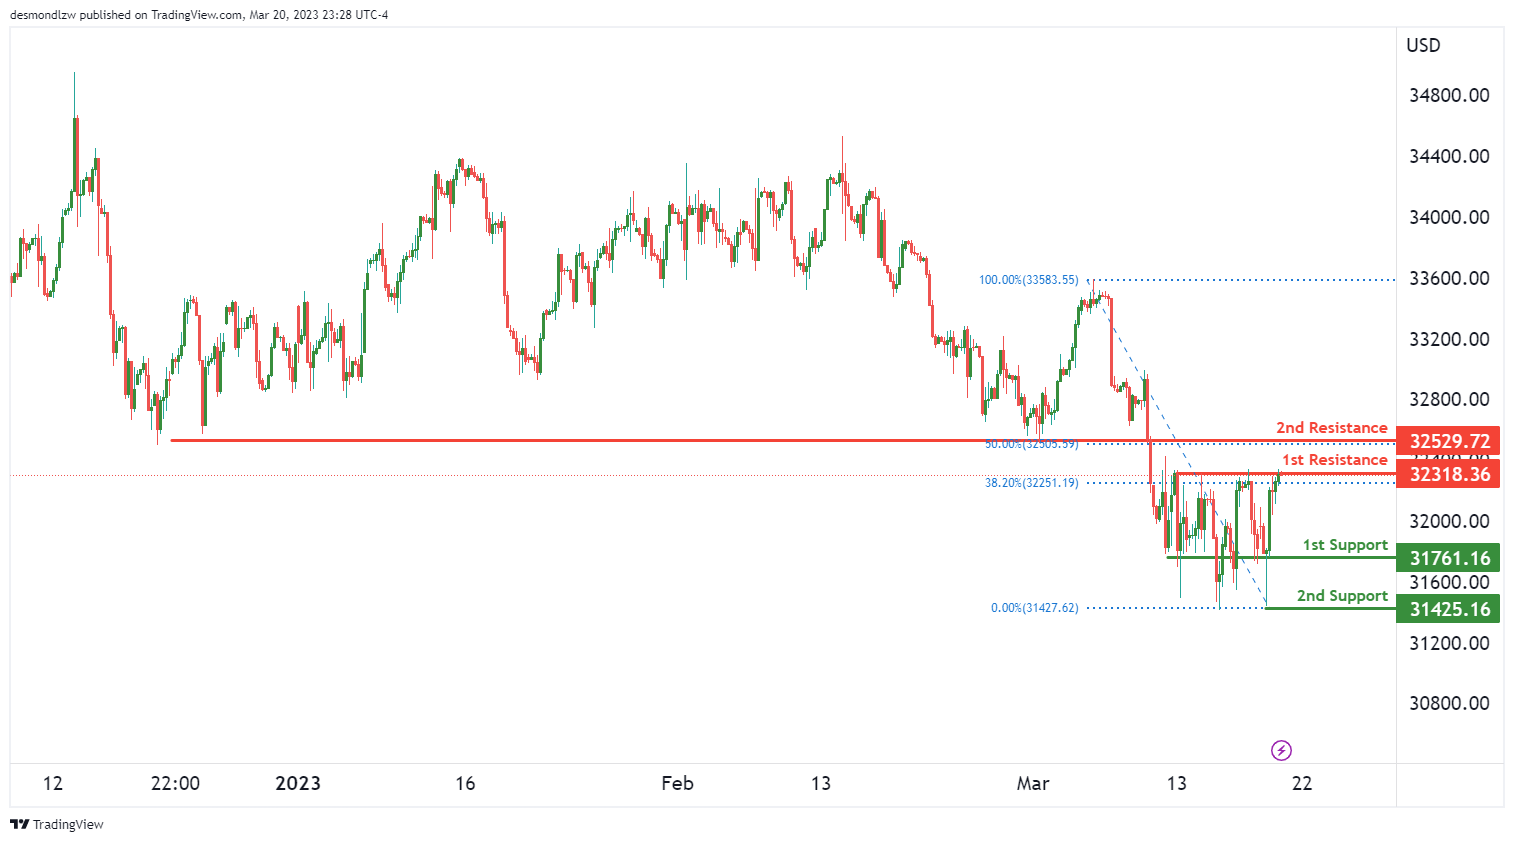
Instrument: DJ30
Overall momentum of the chart: Bearish
Based on the current chart analysis, there is potential for a bearish reaction off the first resistance level, leading to a drop towards the first support level.
The first support level is located at 31761, and it is identified as an overlap support. The second support level at 31425 is considered a swing low support.
On the other hand, the first resistance level is at 32318, and it is identified as a multi-swing high resistance with a 38.20% Fibonacci retracement level. The second resistance level at 32529 is an overlap resistance, with a 50% Fibonacci retracement level.
GER30:
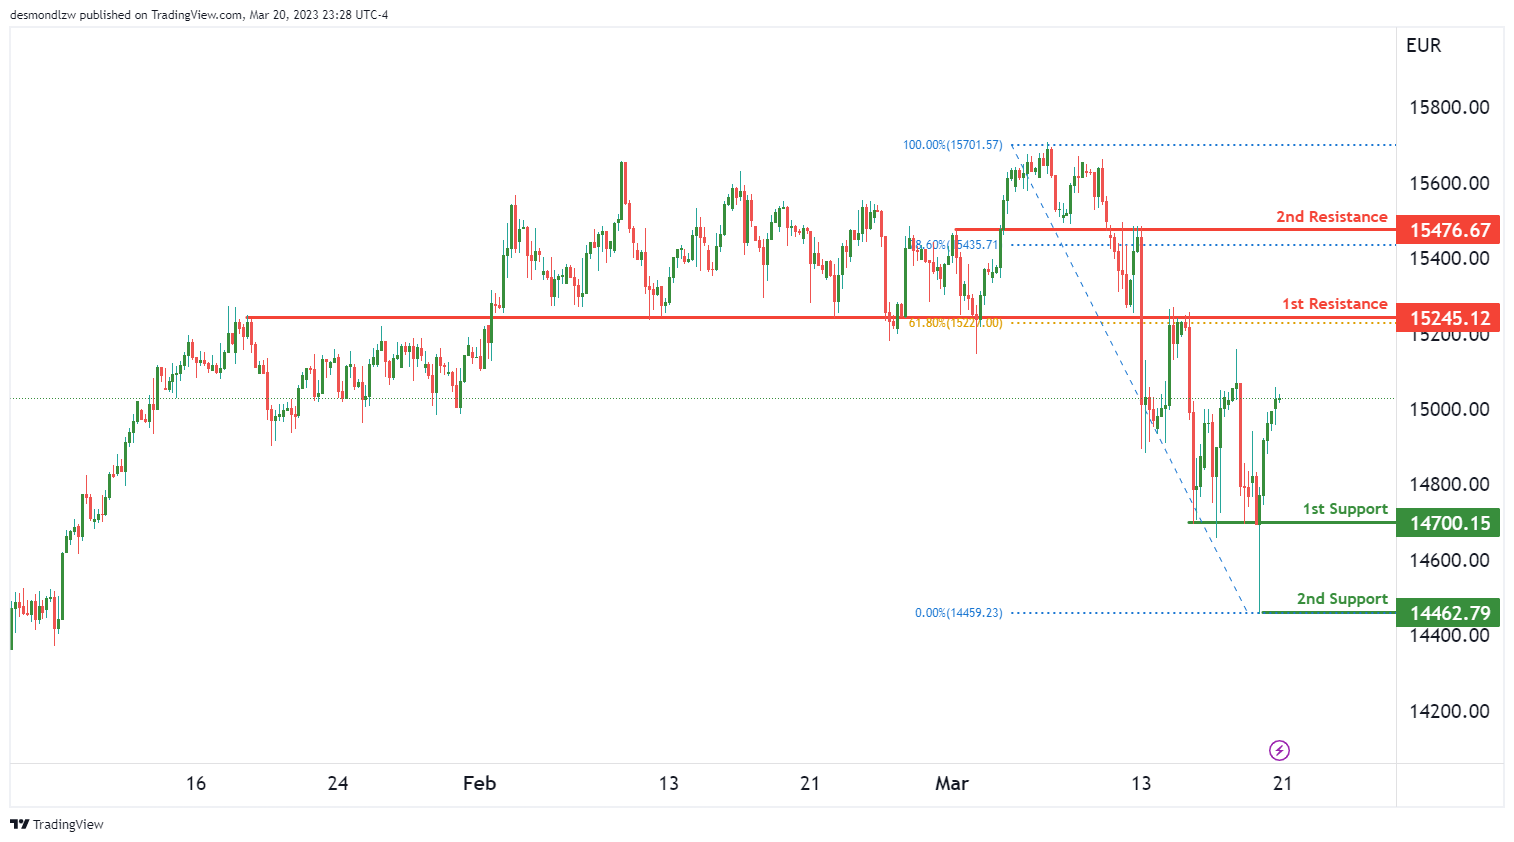
The GER30 chart displays a bullish overall momentum, and price could potentially continue on a bullish trend towards the 1st resistance level. The 1st support level is located at 14700, which is a swing low support. Additionally, the 2nd support level at 14462 is also a swing low support. On the upside, the 1st resistance level at 15245 is an overlap resistance and coincides with the 61.80% Fibonacci retracement level. The 2nd resistance level at 15476 is also an overlap resistance and is located at the 78.60% Fibonacci retracement level.
BTC/USD:
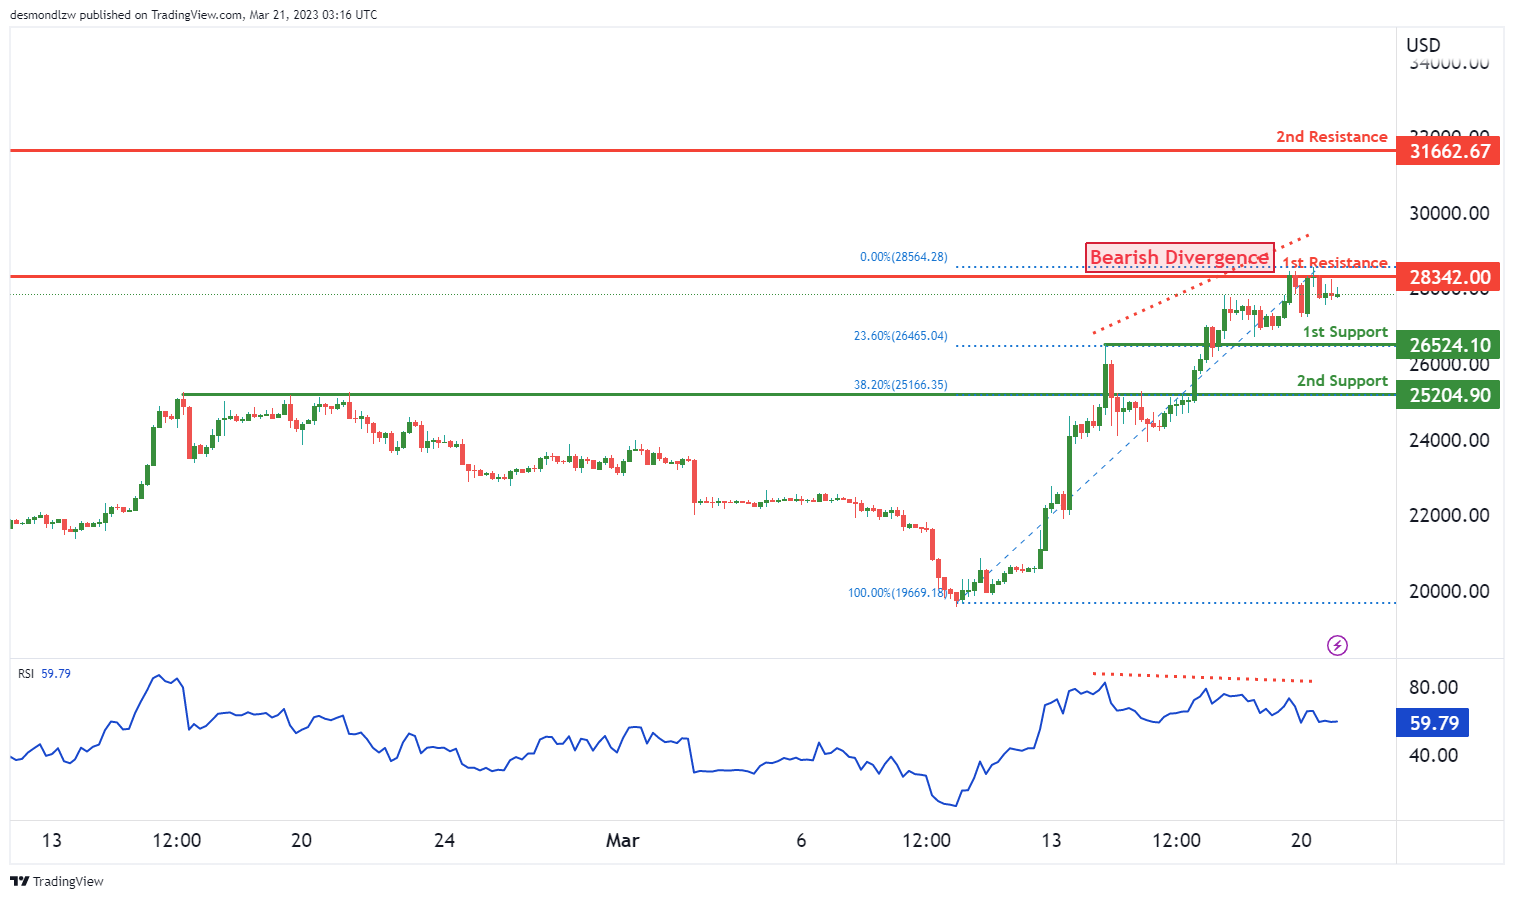
The BTC/USD chart currently shows a bearish momentum, and the price is likely to continue on a bearish trend towards the 1st support level. The 1st support level is located at 26524, which is a pullback support and coincides with the 23.60% Fibonacci retracement level. Additionally, the 2nd support level at 25204 is an overlap support and coincides with the 38.20% Fibonacci retracement level. On the upside, the 1st resistance level at 28342 is a multi-swing high resistance, and the 2nd resistance level at 31662 is a swing high resistance.
It is worth noting that the RSI is displaying bearish divergence versus price, which suggests that a reversal may occur soon.
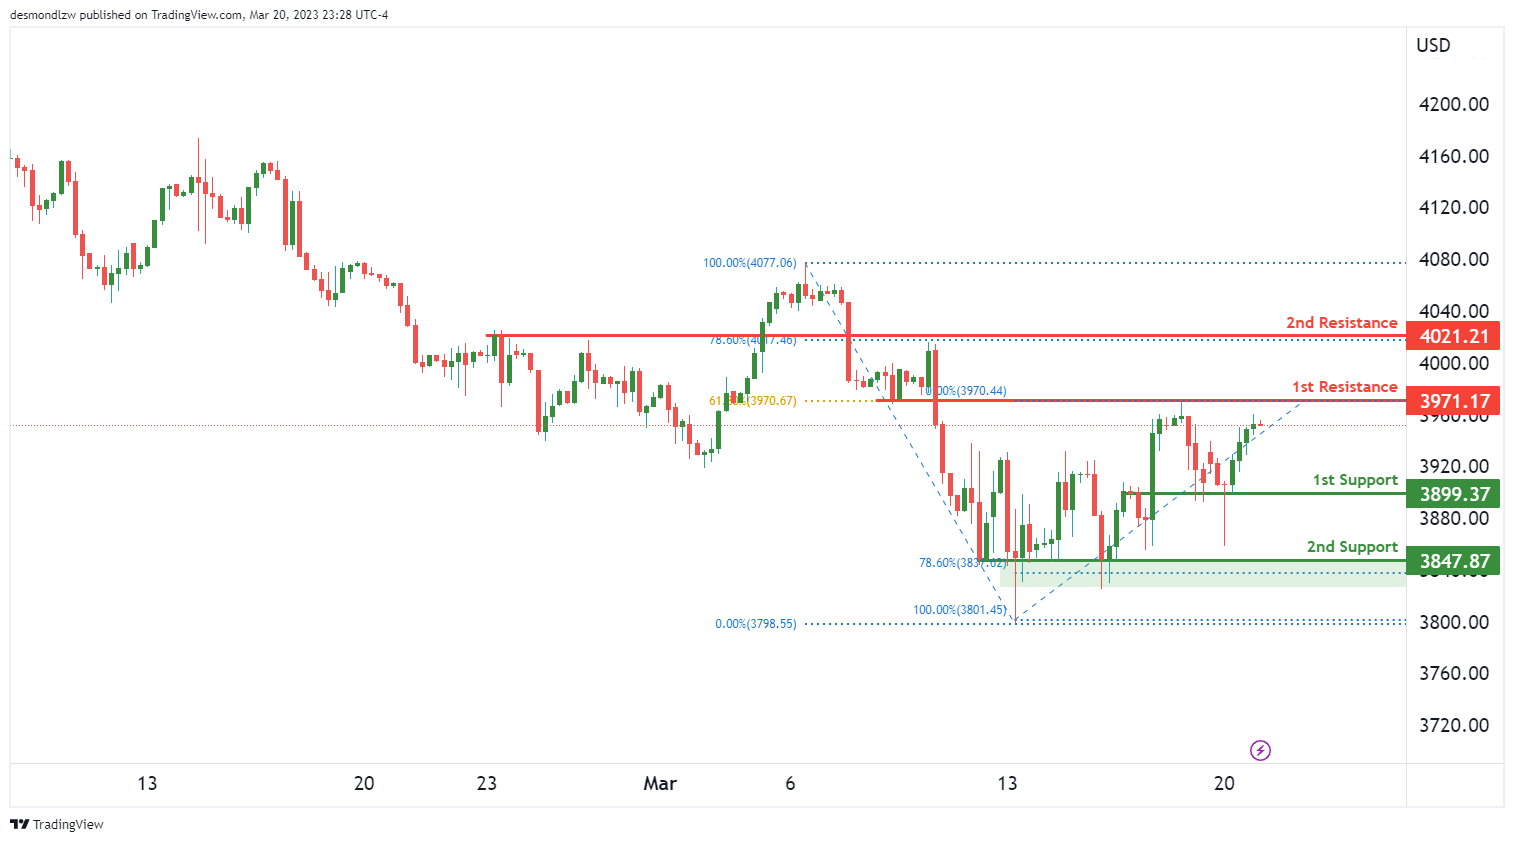
US500
The US500 chart currently shows a bullish momentum, and the price could potentially continue its bullish trend towards the 1st resistance level. The 1st support level is at 3899.37, which is an overlap support level. The 2nd support level at 3847.87 is a multi-swing low support level and coincides with the 78.60% Fibonacci retracement level.
On the upside, the 1st resistance level at 3971.17 is a pullback resistance and coincides with the 61.80% Fibonacci retracement level. The 2nd resistance level at 4021.21 is an overlap resistance level and coincides with the 78.60% Fibonacci retracement level.
These levels indicate that the price may potentially rise further towards the resistance levels, with the 1st resistance level acting as a significant barrier for the price to overcome.
ETH/USD:
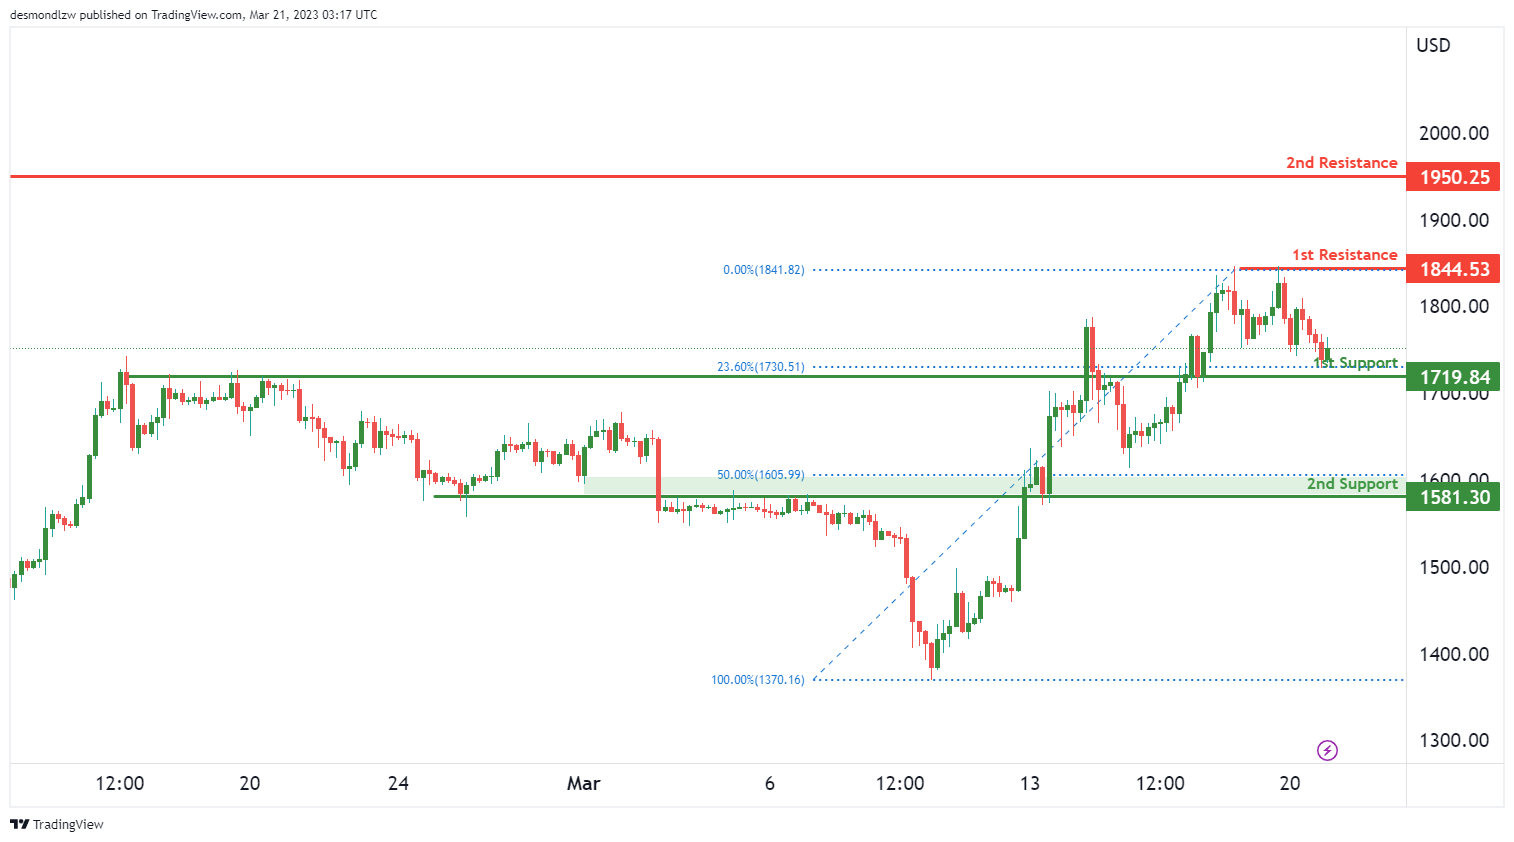
The ETH/USD chart is currently displaying a bearish overall momentum, and price could potentially experience a bearish reaction off the 1st resistance level and drop towards the 1st support level. The 1st support level is located at 1719.84, and it is an overlap support that coincides with the 23.60% Fibonacci retracement level. The 2nd support level at 1581.30 is also an overlap support and coincides with the 50% Fibonacci retracement level.
On the upside, the 1st resistance level at 1844.53 is a multi-swing high resistance. The 2nd resistance level at 1950.00 is a swing high resistance.
It is worth noting that the ETH/USD chart has been showing a bearish momentum, which could lead to a further drop in price.
WTI/USD:
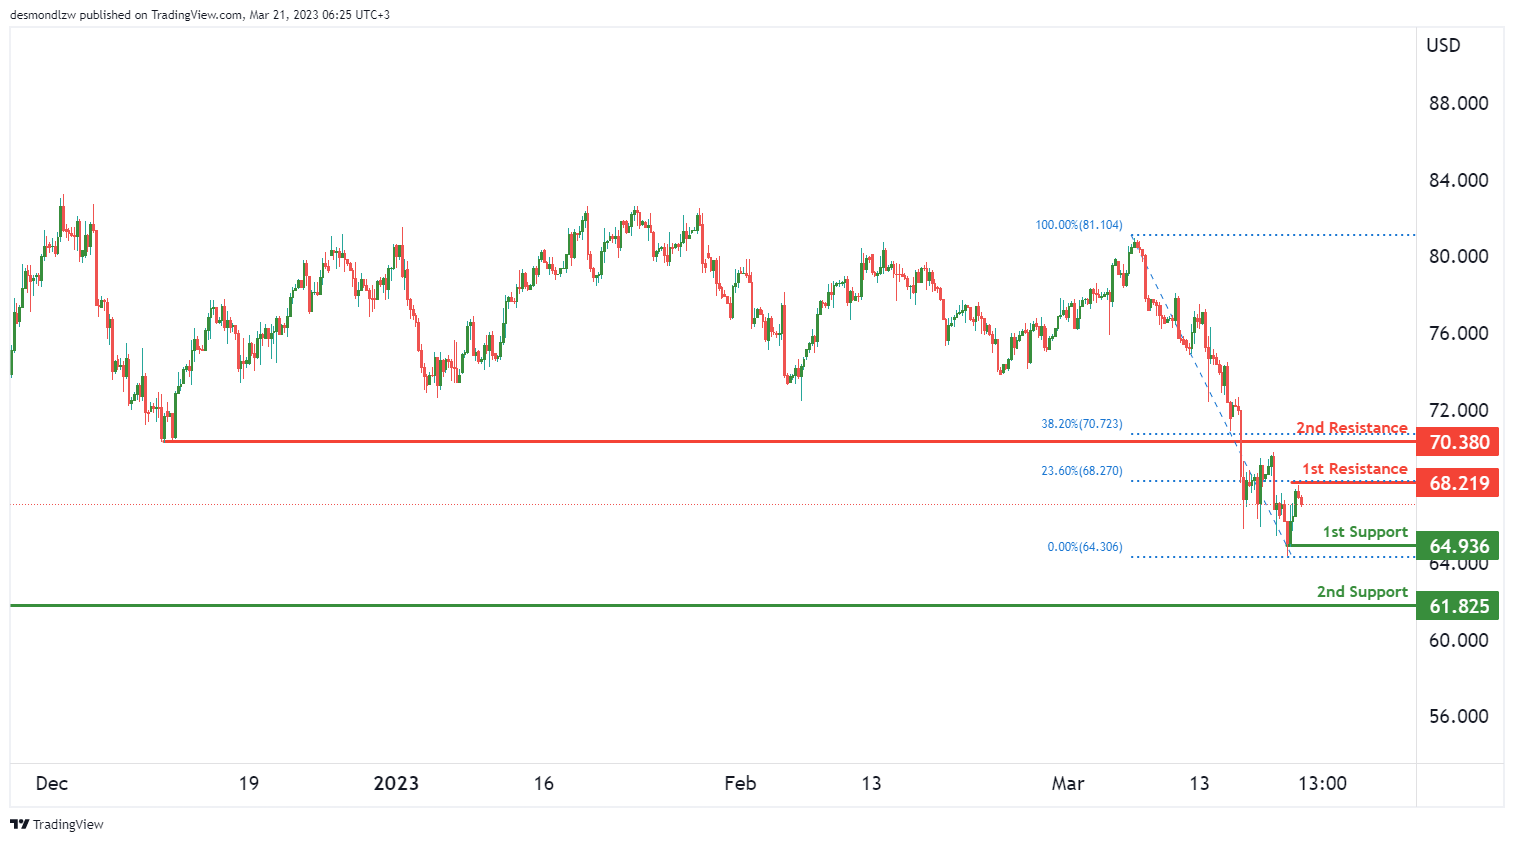
Based on the chart’s bearish momentum, it is likely that the price of WTI will experience a bearish reaction off the 1st resistance level and drop towards the 1st support. The 1st support level is located at 64.93 and is a swing low support, which suggests that it is a strong level of support. The 2nd support level at 61.82 is also a multi-swing low support.
On the upside, the 1st resistance level at 68.21 is an overlap resistance and coincides with the 23.60% Fibonacci retracement level. The 2nd resistance level at 70.38 is a pullback resistance and is located at the 38.20% Fibonacci retracement level.
Overall, it seems likely that the price of WTI will experience some bearish pressure, but it remains to be seen whether it will break through the 1st support level or continue on a bullish trend.
XAU/USD (GOLD):
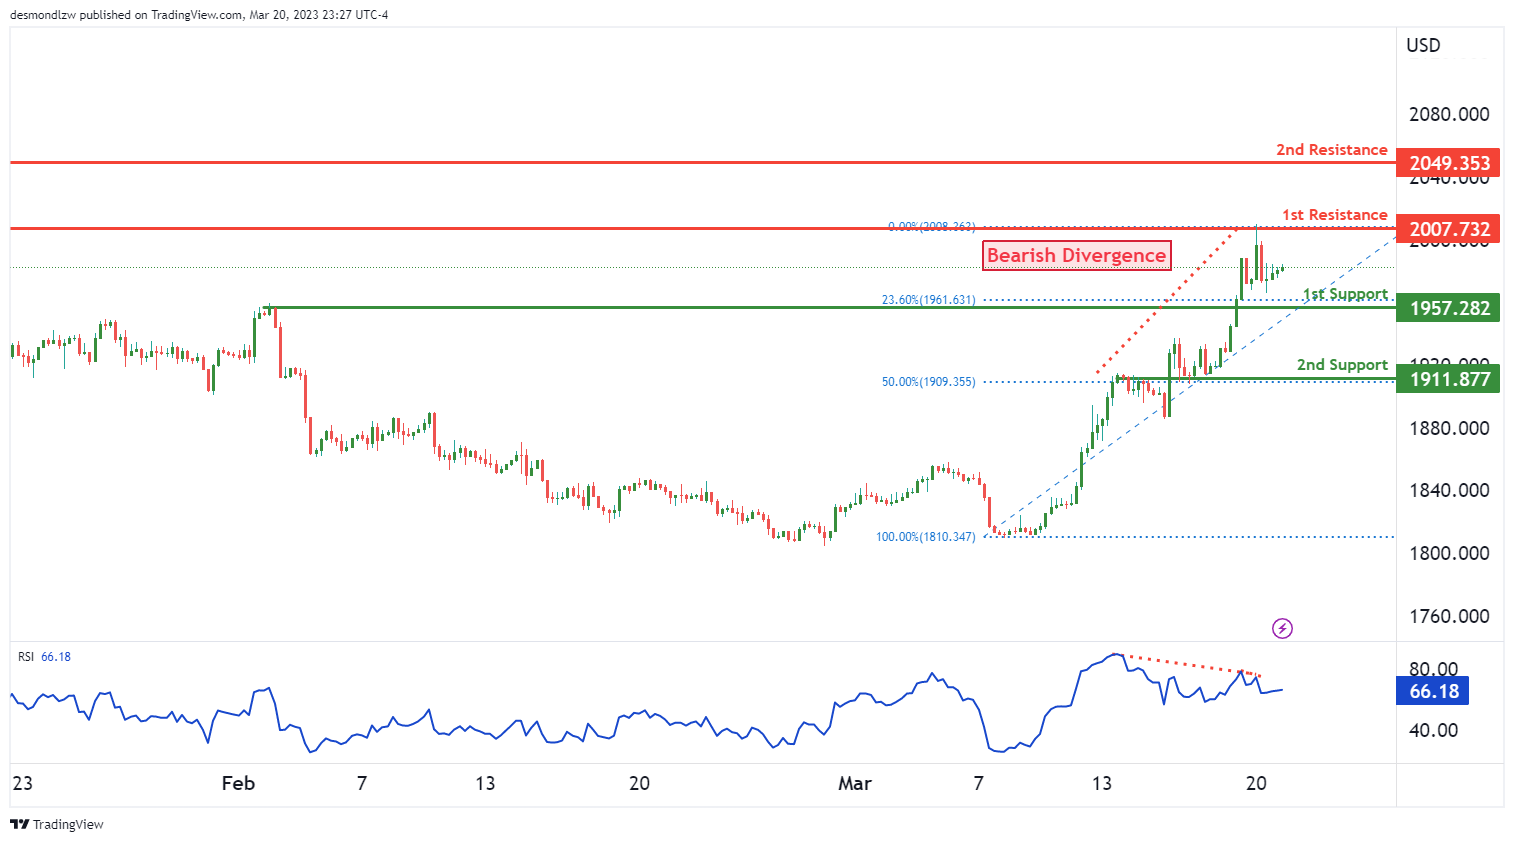
The XAU/USD chart shows a bearish overall momentum, but price could potentially rise towards the 1st resistance in the short term before reversing off it and dropping towards the 1st support. The 1st support level is at 1957.28, which is a pullback support level with a 23.60% Fibonacci retracement. The 2nd support level at 1911.87 is also an overlap support with a 50% Fibonacci retracement. On the upside, the 1st resistance level at 2007.73 is a swing high resistance, while the 2nd resistance level at 2049.00 is also a swing high resistance.
It’s worth noting that RSI is displaying bearish divergence versus price, suggesting that a reversal might occur soon.
GBP/JPY Daily Outlook
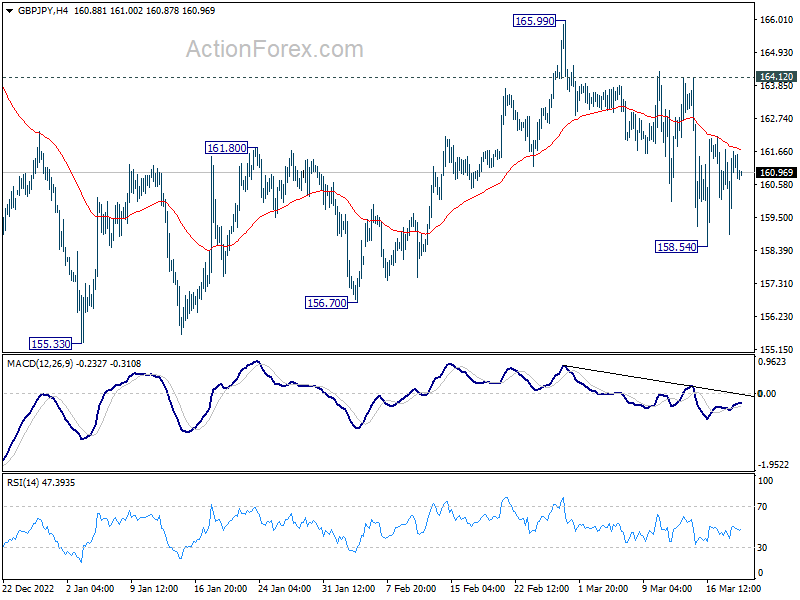
Daily Pivots: (S1) 159.55; (P) 160.65; (R1) 162.32; More...
Intraday bias in GBP/JPY remains neutral for the moment and outlook is unchanged. Current development suggests that fall from 165.99 is a falling leg of the whole decline from 172.11. Deeper decline is expected as long as 164.12 resistance holds. Break of 158.54 will target a retest on 155.33 low.
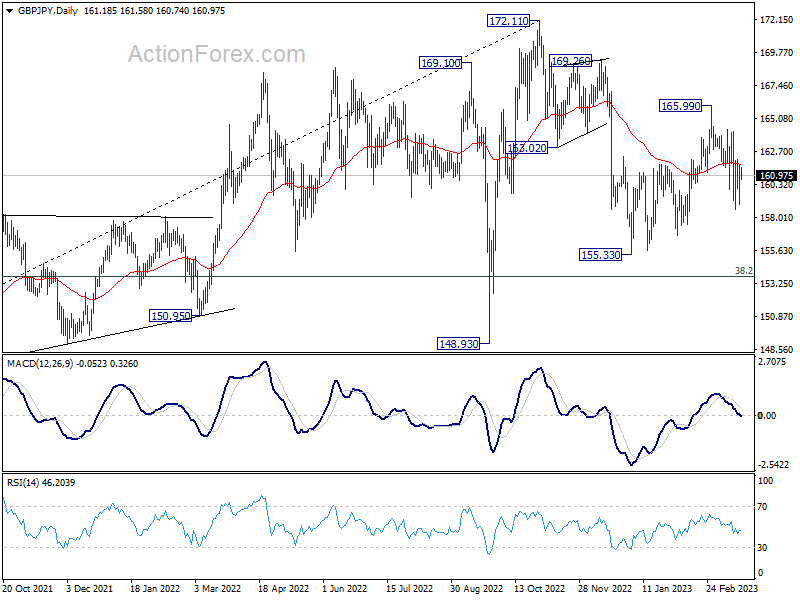
In the bigger picture, as long as 38.2% retracement of 123.94 (2020 low) to 172.11 (2022 high) at 153.70 holds, medium term bullishness is retained. That is, larger up trend from 123.94 (2020 low) is still in progress. Break of 172.11 high to resume such up trend is expected at a later stage.
EUR/JPY Daily Outlook
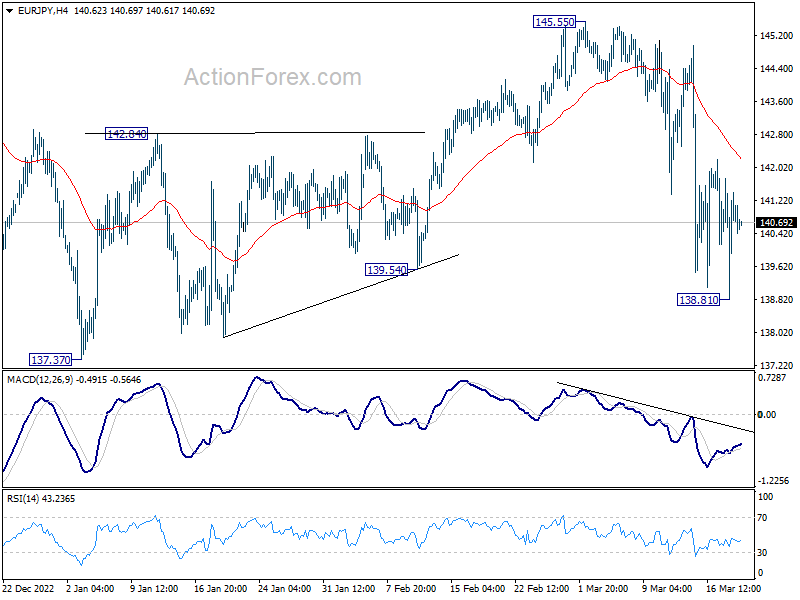
Daily Pivots: (S1) 139.18; (P) 140.47; (R1) 142.10; More....
EUR/JPY recovered quickly after dipping to 138.81 and intraday bias remains neutral first. Outlook is unchanged that fall from 145.55 is the third leg of the whole corrective decline from 148.38. Risk stays on the downside as long as 4 hour 55 EMA (now at 142.21) holds. Below 138.81 will target 137.37 low, and then 135.40 fibonacci level.
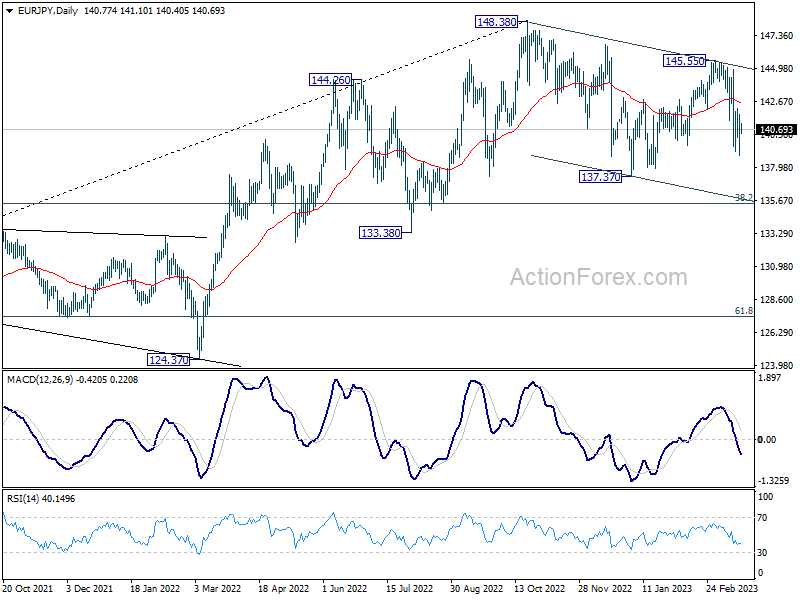
In the bigger picture, as long as 55 week EMA (now at 139.54) holds, larger up trend from 114.42 (2020 low) is still in progress for 149.76 long term resistance. However, firm break of 55 week EMA will bring deeper fall to 38.2% retracement of 114.42 to 148.38 at 135.40. Sustained break there will raise the chance of trend reversal, and target 61.8% retracement at 127.39.
EUR/GBP Daily Outlook
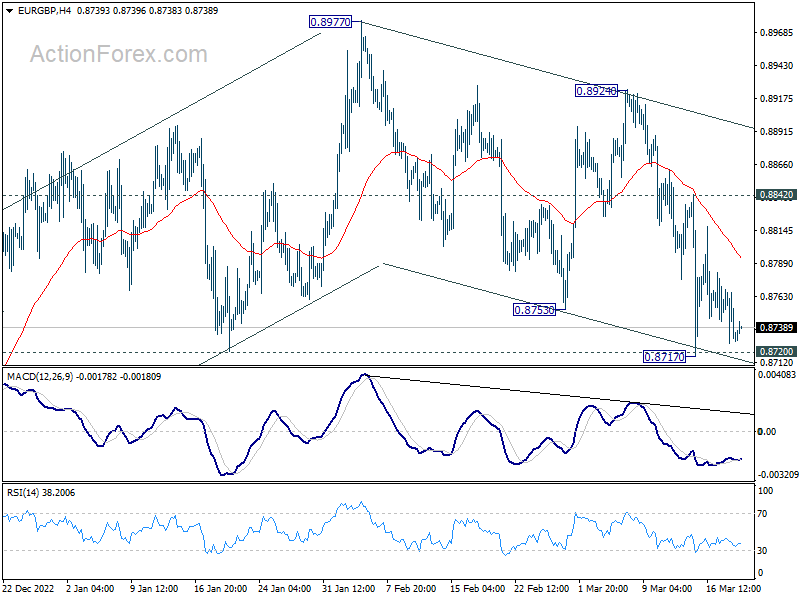
Daily Pivots: (S1) 0.8718; (P) 0.8743; (R1) 0.8759; More...
Intraday bias in EUR/GBP stays neutral at this point. On the upside, break of 0.8842 resistance will argue that corrective fall from 0.8977 has completed, after touching 0.8720 support. Further rise should be seen back to 0.8924 resistance and above. However, sustained break of 0.8720 will bring deeper decline back to 0.8545 instead.
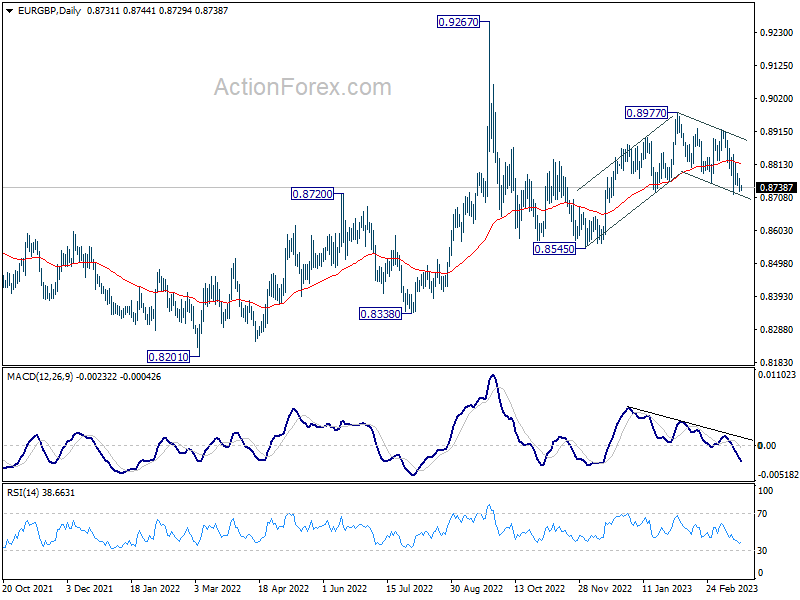
In the bigger picture, outlook is rather mixed for now, except that price actions from 0.9267 (2022 high) are part of the long term range pattern from 0.9499 (2020 high). With 0.8720 support intact, rise from 0.8545 is in favor to continue through 0.8977. However, firm break of 0.8720 will argue that such rebound has completed, and open up deeper fall through this support level.
EUR/AUD Daily Outlook
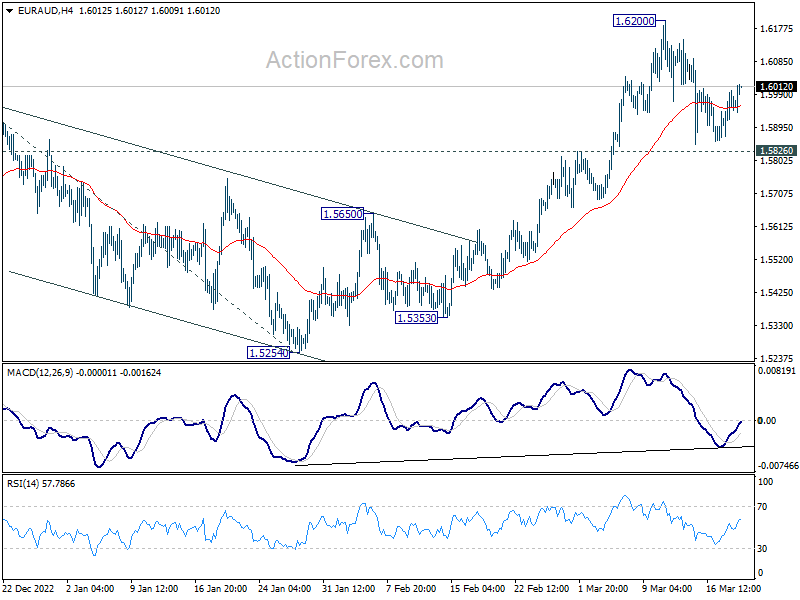
Daily Pivots: (S1) 1.5889; (P) 1.5946; (R1) 1.6020; More...
Intraday bias in EUR/AUD remains neutral as range trading continues inside 1.5826/6200. Outlook stays bullish with 1.5826 resistance turned support intact. On the upside, break of 1.6200 will resume the larger rise from 1.4281 to 61.8% projection of 1.4281 to 1.5976 from 1.5254 at 1.6302 next. However, firm break of 1.5826 will confirm short term topping, and bring deeper fall to 55 day EMA (now at 1.5706).
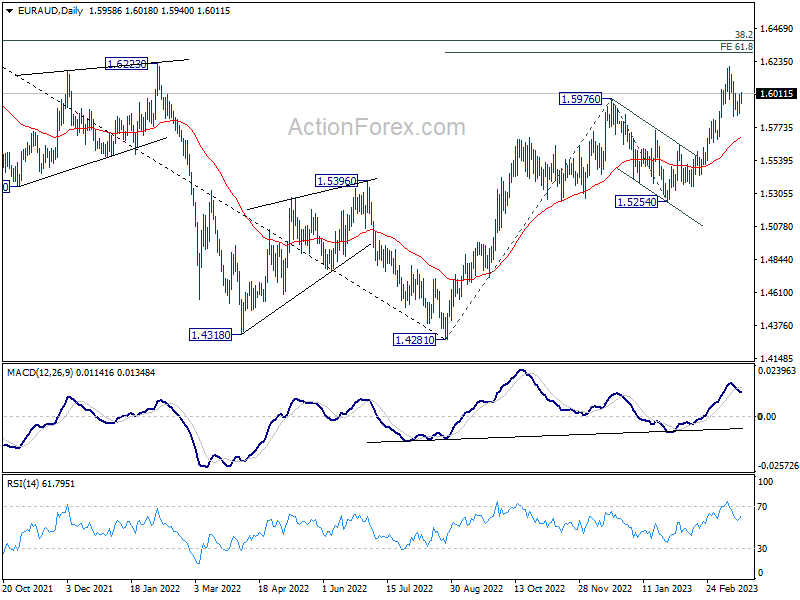
In the bigger picture, the strong support from 55 week EMA (now at 1.5404) is raising the chance of bullish trend reversal. Focus is now on 1.6434 cluster resistance (38.2% retracement of 1.9799 to 1.4281 at 1.6389). Sustained break there should confirm that whole down trend from 1.9799 (2020 high) has completed. Further rally should then be seen to 61.8% retracement at 1.7691. However, rejection by this cluster resistance will make medium term outlook neutral at best.
EUR/CHF Daily Outlook
Daily Pivots: (S1) 0.9894; (P) 0.9930; (R1) 1.0001; More...
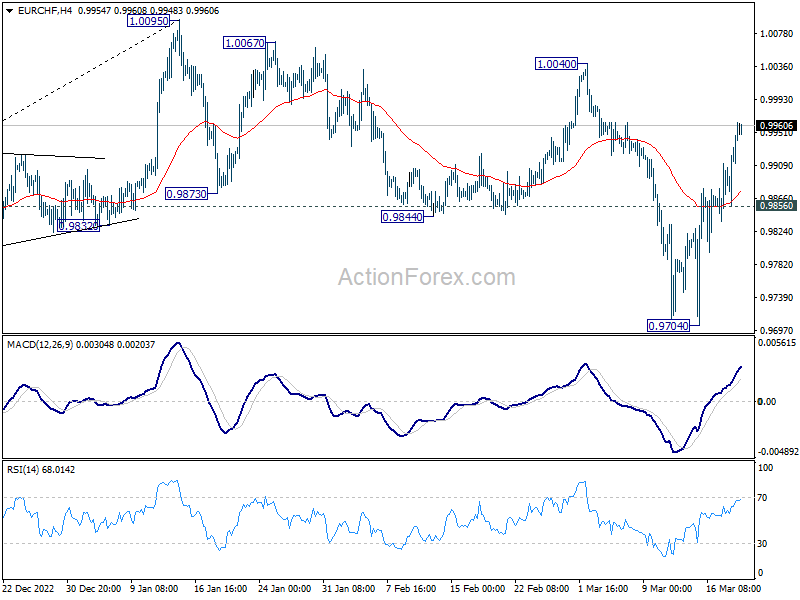
Intraday bias in EUR/CHF stays on the upside for the moment. Current development argues that decline from 1.0095 has completed as a correction, with three waves down to 0.9704. Further rally would be seen to 1.0040 resistance first. Firm break there would argue that larger rise from 0.9407 is resuming through 1.0095. On the downside, though, break of 0.9856 minor support will turn intraday bias neutral first.
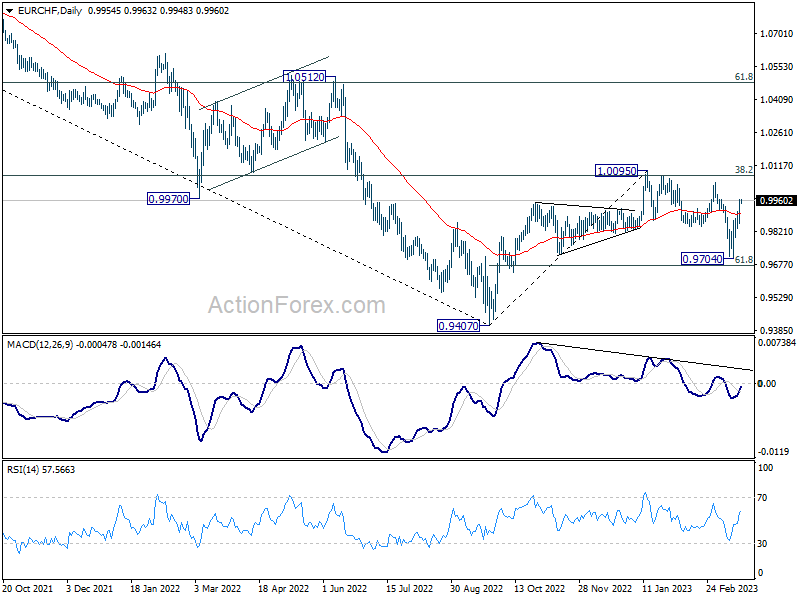
In the bigger picture, prior rejection by 55 week EMA (now at 1.0011) and 38.2% retracement of 1.1149 to 0.9407 at 1.0072 suggests that medium term outlook is staying bearish. That is, down trend from 1.2004 is not completed yet and is in favor to resume through 0.9407 at a later stage. However, decisive break of 1.0095 resistance will raise the chance of bullish trend reversal. Rise from 0.9407 should then target 1.0505 cluster resistance (2020 low at 1.0505, 61.8% retracement of 1.1149 to 0.9407 at 1.1484).
USD/CAD Daily Outlook
Daily Pivots: (S1) 1.3628; (P) 1.3688; (R1) 1.3723; More....
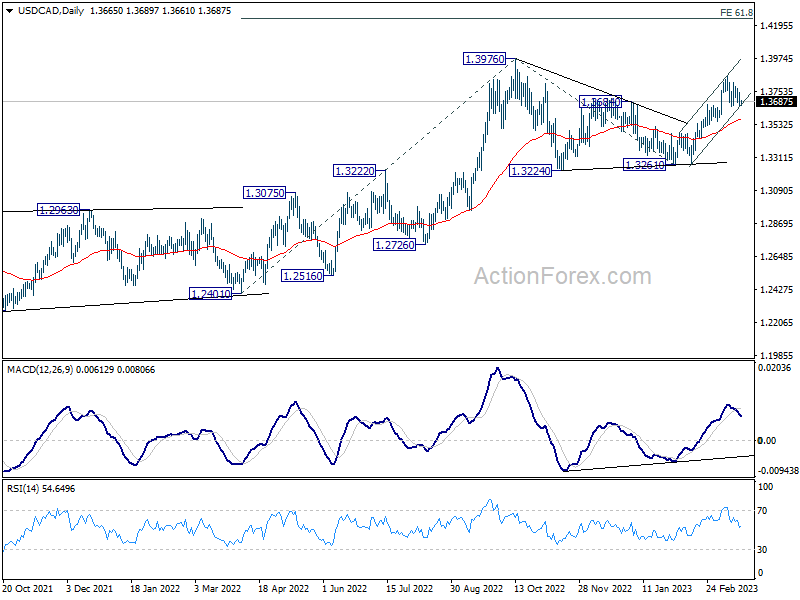
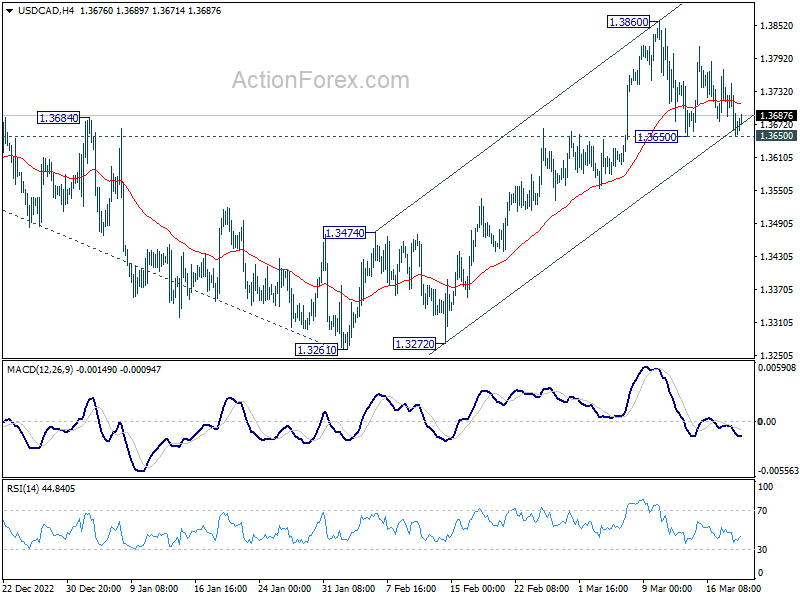
Intraday bias in USD/CAD stays neutral as range trading continues. Further rally is expected with 1.3650 support intact. On the upside, break of 1.3860 will resume the rally from 1.3261 to retest 1.3976 high. However, firm break of 1.3650 will mix up the near term outlook and bring deeper pullback to 55 day EMA (now at 1.3566) first.
In the bigger picture, the up trend from 1.2005 (2021 low) is still in progress. Break of 1.3976 will confirm resumption and target 61.8% projection of 1.2401 to 1.3976 from 1.3261 at 1.4234. Firm break there will pave the way to long term resistance zone at 1.4667/89 (2016, 2020 highs). On the downside, break of 1.3261 support is needed to confirm medium term topping. Otherwise, outlook will remain bullish even in case of deep pull back.