Sample Category Title
Australia Monthly CPI – Softer than Expected as Holiday Travel Prices Pull Back
January surprised to the downside with some sign the inflationary pulse may be starting to ease.
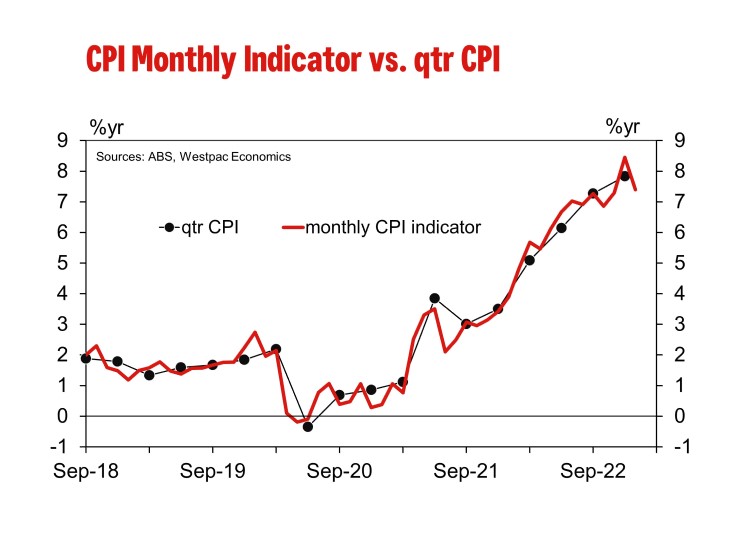
The Monthly CPI Indicator rose 7.4% in the year to January compared to Westpac’s 7.9%yr forecast and the market’s 8.0%yr.
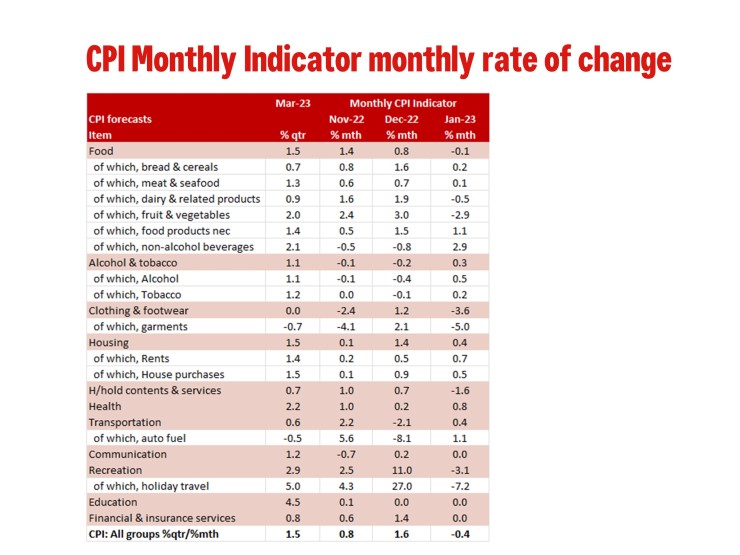
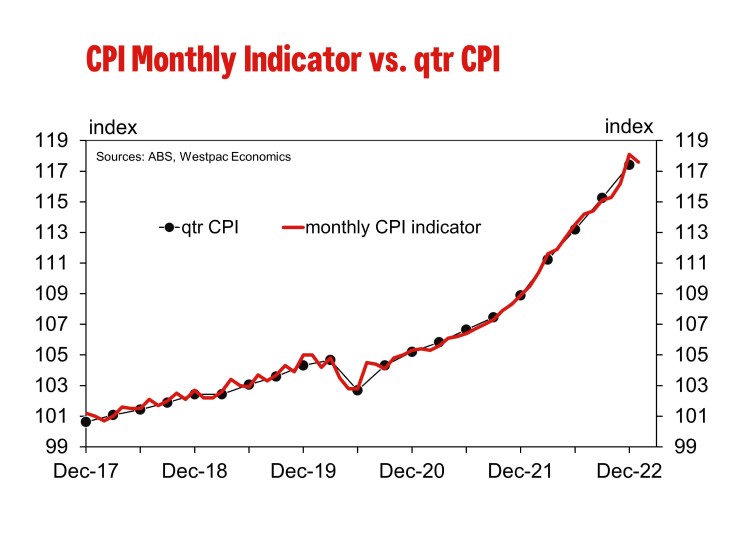
Diving into the detail this was the index fell 0.4% in January compared to 0.1% rise forecast by Westpac; we assume the market median would have been around 0.2% given the 8.0%yr forecast. This is a moderation from the 3.0% rise in December, 2.4% increase in November and a 6.3% decline in October. The Monthly CPI Indicator can be very volatile month to month as it is not a true monthly price index but rather the released of data for the quarterly CPI as it becomes available hence it can be very volatile month to month depending on the timing of the price surveys. This may be way the ABS only reference the annual pace of growth.
The most significant contributions to the annual rise in January were: housing (+9.8%yr), food & non-alcoholic beverages (+8.2%yr) and recreation a& culture (+10.2%yr).
The ABS noted that the annual increase for the housing group in January was lower than December (+10.1%yr) due to a moderation in new dwellings and rents. In monthly terms, both dwelling (+0.5%) and rents (+0.7%) rose in January. However, rents are now growing more strongly than they were a year ago while the increases in dwelling prices are moderating.
Food & non-alcoholic beverages rose 8.2%yr in January, a moderation from the 9.5%yr increase in December. The ABE noted that in the month most food & non-alcoholic beverages prices rose. The main exception was fruit & vegetables which fell 2.3%.
As we expected there was a moderation in price inflation for recreation & cultural with holiday travel & accommodation rising 17.8%yr to January, a moderation from the 29.3%yr pace to December. In January holiday travel & accommodation prices fell 7.2% following a 29.3% increase in December.
Outside of the above contributions to the monthly increase in January worth noting is the 3.6% fall in clothing & footwear on the back of a 5% fall in garments; a 1.1% rise in auto fuel prices and a very modest 0.2% rise in tobacco. Please refer to the included table for a further breakdown on the Monthly CPI indicator and its comparison to our current CPI forecast for Q1.
The ABE no longer publishes an estimation of a Trimmed Mean CPI Indicator as the variation in the timing of price surveys resulted in a meaningful different result from Monthly Trimmed Mean compared to the quarterly Trimmed Mean.
We are processing the Monthly CPI Indicator data to incorporate it into a complete Q1 CPI preview. Our current published inflation forecast for Q1 are 1.5%qtr/7.2%yr for the CPI and 1.3%qtr/6.6%yr for the Trimmed Mean.
First Impressions: Australian Q4 GDP
Australia’s economy expanded by a modest 0.5%, which was softer than anticipated. Conditions were soft in late 2022, with the adverse impacts of high inflation and sharply higher interest rates becoming apparent. Consumer spending grew by only 0.3%, while total domestic demand stalled. .
The Australian economy expanded by a modest 0.5% in the December quarter.
That was softer than anticipated, Westpac 0.8% and market median 0.8%, range (0.4% to 1.0%).
Annual growth is 2.7%. The level of activity is 7.2% above levels prior to the pandemic, at the end of 2019. Note, that Q3 GDP growth was revised up a fraction, to a gain of 0.7% from 0.6%.
Key surprise: The consumer was the key surprise, with only a tepid 0.3% rise in overall spending. Services were the key disappointment, with only a modest rise. Also, income growth was weaker than anticipated and the decline in the household saving ratio was more pronounced.
While nominal gross household income grew by 1.6%, real household disposable income contracted by a hefty -2.2%.
Hours worked: The National Accounts estimate that hours worked expanded by 2%, eclipsing the Labour Force survey estimate of 1.4%, after a rise of 0.5% in Q3 (a result held back by covid related elevated absenteeism). Over the year, hours worked grew by 6.5%.
Consumer spending grew by only 0.3% in the quarter, well short of our expectation, a plus 0.8%.
The ABS report that growth in discretionary spending (+0.4%) slowed to be more in line with essential spending (+0.3%).
The ABS add, discretionary spending was led by hotels, cafes and restaurants (+1.6%) and transport services (+5.7%), reflecting residual post-lockdown demand. Spending in these categories slowed following four consecutive quarters of strong demand.
Other discretionary spending on recreation and culture (-1.4%), clothing and footwear (-2.7%), and furnishings and household equipment (-1.2%) fell as cost-of-living pressures began to weigh on household budgets.
The household saving ratio moved lower still, down from 7.1% to 4.5%, a reading below the “equilibrium”, judged to be around 6%. This ends a period of excess savings, which has been a feature during the pandemic.
Expenditure detail:
Domestic demand stalled in the December quarter, the weakest result outside of a lockdown period since June 2014. This indicates that the economy hit a soft spot at the end of 2022.
Net exports added a hefty 1.1ppts, on a lift in services led 1.1% rise in exports and a pull-back in imports, (-4.3%), albeit they still rose strongly over the year (+12.1%).
Total inventories subtracted -0.5ppts from activity on a correction of non-farm business inventories after a Q3 run-up centred on some one-offs.
Home building activity declined, down by -0.9%,, with a further pull-back in renovations work, -4.2%, more than offsetting a lift in new home building work, +1.4%.
The real estate sector – in the form of Ownership Transfer Costs (turnover in the property sector) - fell a further -6.2% after the -11.2% plunge in Q3 as rapid interest rate rises bite.
Business investment contracted, declining by -0.8%, led lower by a fall in construction work, as well a dip in equipment spending, -0.2%.
Public demand is cresting at a high level, up only 0.2% in both Q3 and Q4, following a -0.5% for Q2. This follows rapid growth up to the March quarter 2022, boosted by the response to the pandemic.
FOMC Will Stay Hawkish as Inflation Remains High
Last year, the US inflation rate was at a 40-year peak while posting the lowest unemployment rate in several decades. The FOMC board has conversely tackled the inflation rates by adopting hawkish policies and increasing interest rates. Today's analysis will examine how the Dollar performs ahead of the ISM Manufacturing PMI release.
US Dollar - DXY
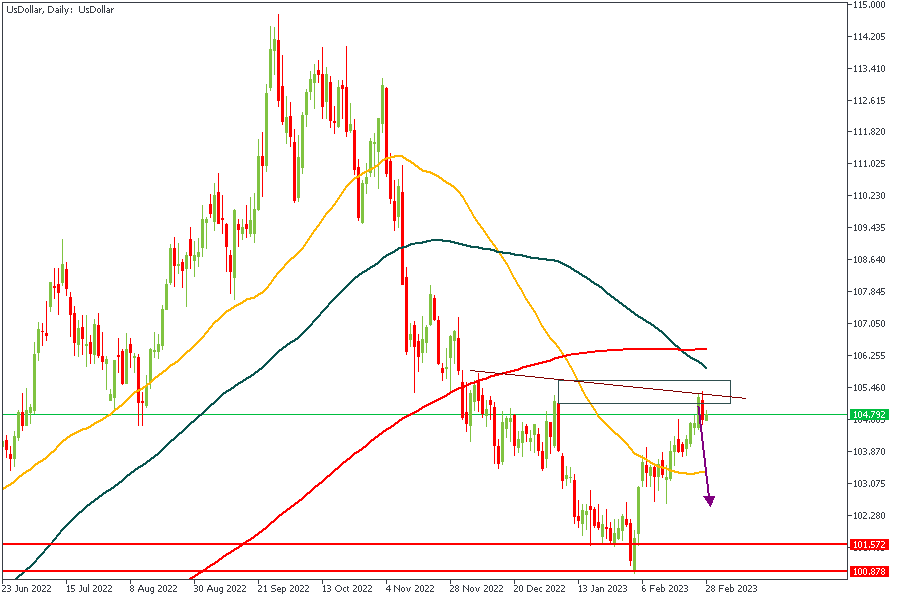
Here on the daily timeframe of the DXY, the price can be seen already reacting to the rally-base-drop supply zone. The 88% of the Fibonacci retracement and the 100-Day moving average were an added confluence for the bearish sentiment. Based on this analysis, we can expect bullish price action from the XXX-USD pairs.
USDCAD
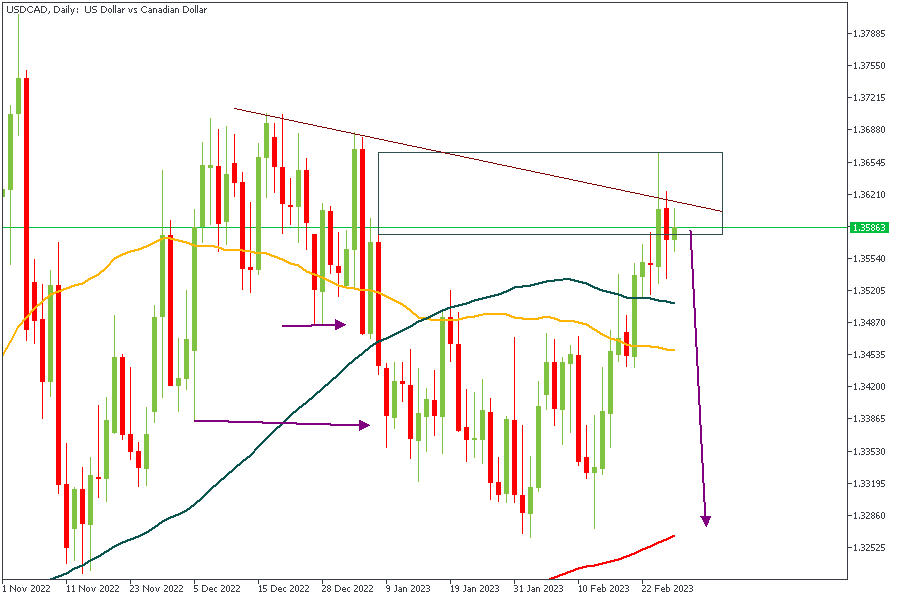
USDCAD has bumped into the supply zone following the bearish structure break at the highlighted horizontal arrows. The 50-Day moving average locates below the 100-Day moving average, indicating a bearish sentiment. The trendline resistance is the third signal for a bearish price movement.
Analysts’ Expectations:
- Direction: Bearish
- Target: 1.32800
- Invalidation: 1.36400
USDJPY
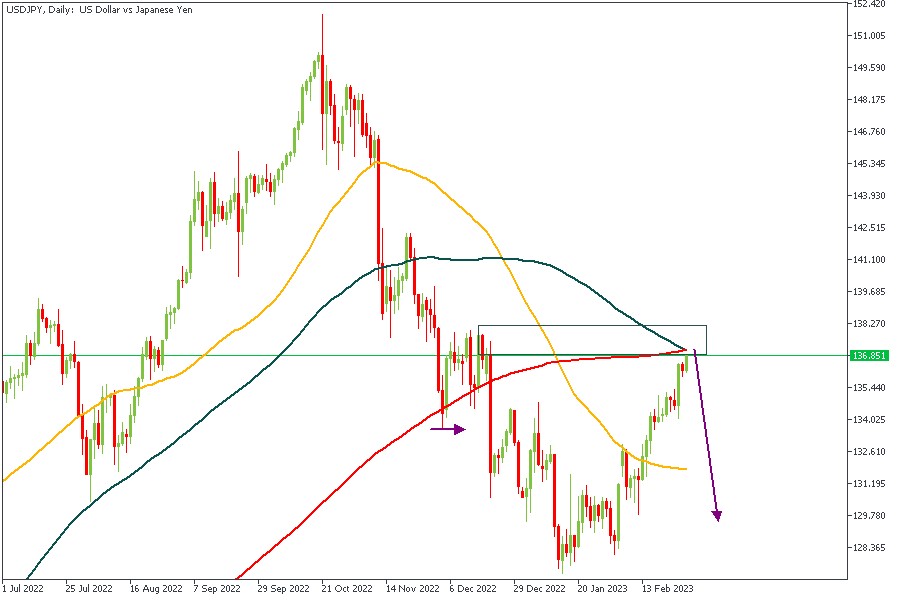
We can see price stalling near the rally-base-drop supply zone in line with the bias formed from the DXY chart. There is also a confluence of factors that indicate a possible bearish sentiment, including the crossing of the 100 and 200 Day moving averages, the 88% Fibonacci retracement level, and the resistance from the two moving averages.
Analysts’ Expectations:
- Direction: Bearish
- Target: 130
- Invalidation: 138.2
USDCHF
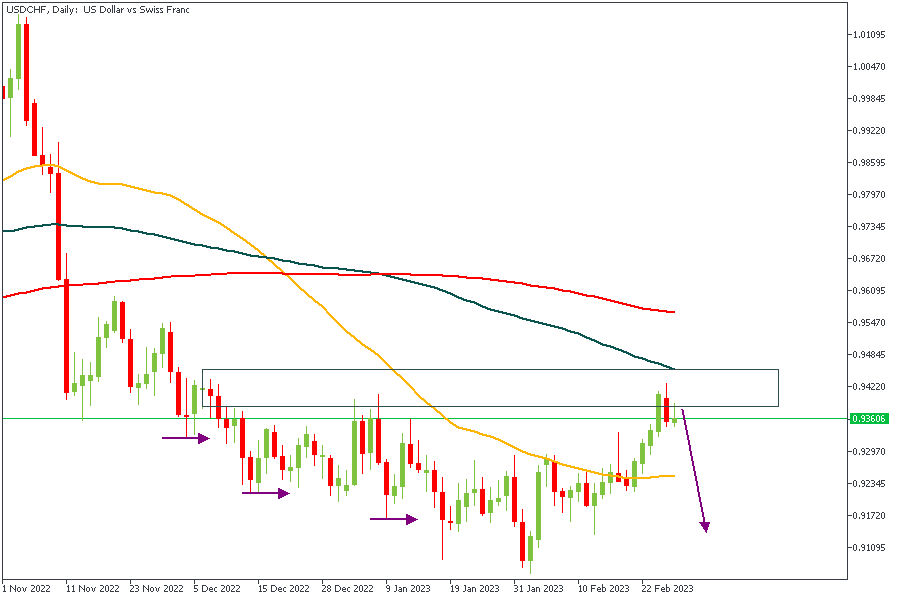
As I noticed above, a weakness in DXY will lead to a bearish reaction on charts of currency pairs with the USD as its Base currency. From a technical standpoint, based on the Daily timeframe of USDCHF, I expect to see some bearish movement based on the confluence of the rally-base-drop supply zone, the 100-Day moving average resistance, and the 88% Fibonacci retracement.
Analysts’ Expectations:
- Direction: Bearish
- Target: 0.91100
- Invalidation: 0.94845
CONCLUSION
The trading of CFDs comes at a risk. Thus, to succeed, you have to manage risks properly. To avoid costly mistakes while you look to trade these opportunities, be sure to do your due diligence and manage your risk appropriately.
NZDCHF Wave Analysis
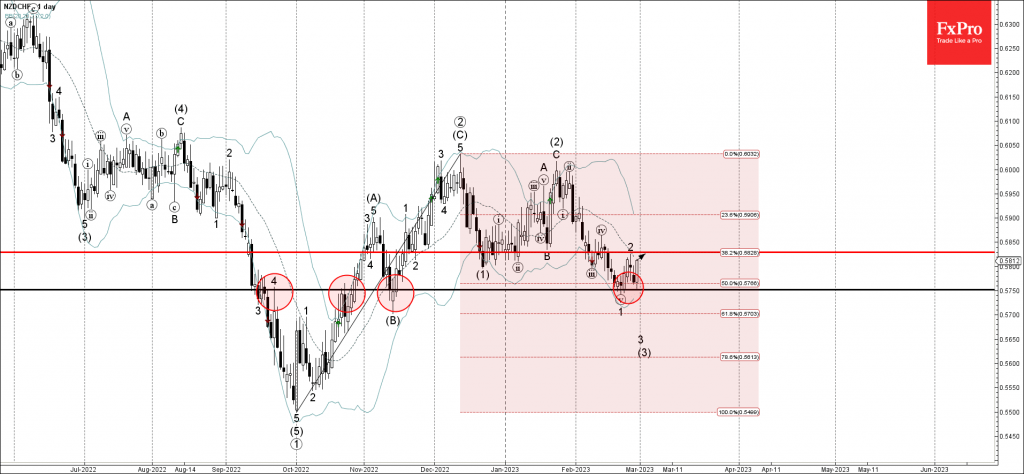
- NZDCHF reversed from support level 0.5750
- Likely to rise to resistance level 0.5830
NZDCHF recently reversed up from the key support level 0.5750 (former resistance from September, which also stopped the previous minor impulse wave 1).
The support level 0.5750 coincided with the 50% Fibonacci correction of the previous upward ABC correction from the start of October.
NZDCHF can be expected to rise further toward the next resistance level 0.5830 (top of the previous wave 2).
AUDCHF Wave Analysis
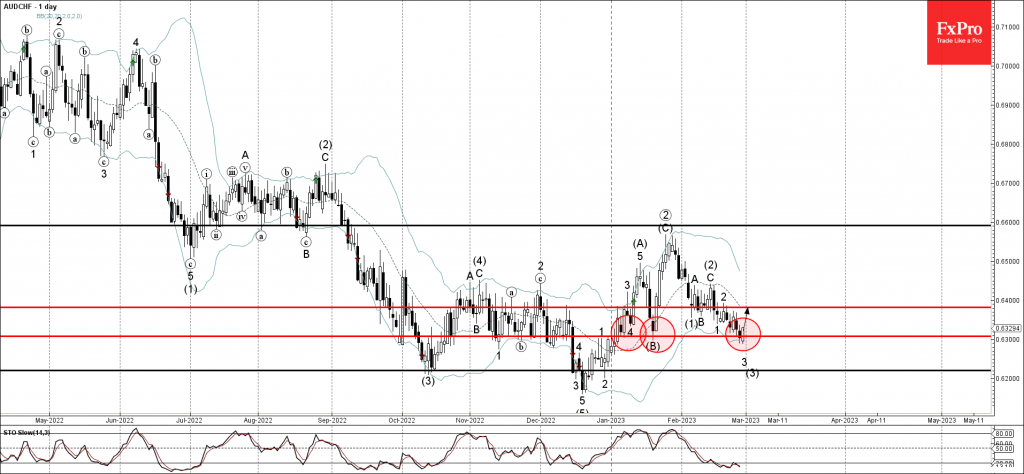
- AUDCHF reversed from support level 0.6300
- Likely to rise to resistance level 0.6380
AUDCHF recently reversed up from the key support level 0.6300 (which has been reversing the price from the end of December).
The upward reversal from the support level 0.6300 is likely to form the daily Bullish Engulfing – which will mark the end of the previous minor impulse wave 3.
Given the oversold daily Stochastic, AUDCHF can be expected to rise further toward the next resistance level 0.6380 (top of the previous minor correction 2).
BoE Mann: No automatic relationship between recessions and bringing inflation down
BoE MPC member Catherine Mann said, "falling natural gas and electricity costs "might be good from the standpoint of making households feel more comfortable."
But, "on the other hand, what they aren't going to spend on energy, they're going to spend on something else... That translates something that I do not control, which is external energy prices, into something that looks a whole lot more like what I'm supposed to control, which is domestically generated inflation."
"A recession is a particularly dramatic way of disciplining the pricing structure of firms, but it's not the only way," Mann said. "I would like to see more on the supply side in order to give us a faster speed limit to work with as a central bank. It's not like there's an automatic relationship between recessions and bringing inflation down."
Sunset Market Commentary
Markets
Today’s trading session started with a bang: national European inflation numbers triggered a fresh sell-off on bond markets. French inflation (EU harmonized) accelerated to 1% m/m with the y/y-reading printing at a new high of 7.2% (vs 7% in January). Details showed positive contribution from all categories, with food prices (1.4% m/m & 14.5% y/y) and energy prices (1.6% m/m & 14% y/y) standing out. Services inflation rose to 0.7% m/m (2.9% y/y). Spanish inflation increased by 1% m/m as well with the y/y-reading picking up from 5.9% to 6.1% (vs 5.7% expected). Underlying core inflation printed at a new high of 7.7% Y/Y. Belgian inflation yesterday also showed record high core inflation (8.28% y/y). Stubbornly high inflation won’t allow central banks to end policy tightening cycles any time soon. On the contrary. ECB chief economist Lane this morning elaborated on the topic. He didn’t zoom in on how high the ECB policy rate peak eventually will be, but said that rates will remain at that level for quite a long-lasting period, adding “a fair number of quarters”. Combining with ECB Villeroy’s earlier (and later downplayed) comments that policy rates would only peak in September, and assuming a continuous tightening pace this implies a policy rate peak of at least 4% which would still be in place by mid-2024. Despite markets’ hawkish repositioning already done of late, that strengthens our view that moves could go further. Guidelines at March Fed & ECB policy meetings (including new forecasts) will be crucial here. German Bunds significantly underperform US Treasuries with yields adding 7 to 8 bps across the curve. The German 10-yr yield breaks above key 2.55%/2.57% resistance (previous cycle peak & 62% retracement on decline between 2008 & 2020). If confirmed, the break in first instance implies more upward potential to 3% (2005 low). 76% retracement (3.38%) and the 2011 top (3.5%) are the next references. US Treasury yields increase by up to 2.5 bps ahead of the US morning releases (including consumer confidence). The fierce bond sell-off pushed European stock markets around 0.5% lower at the start, but equities/risk sentiment again showed resilience. They currently record small gains. The single currency tries to benefit from the situation (yield advantage & risk climate), but its performance is disappointing. EUR/USD changes hands around 1.0620, coming from an intraday low just above 1.0580. Sterling outperformed after EC President von der Leyen and UK PM Sunak presented the Windsor Framework, as solution to fix the Northern-Ireland Protocol in the brexit deal. Sunak now needs to sell the deal to the Northern Irish DUP party. We retain hawkish comments by BoE Mann as well who warns that cheaper energy prices risks pushing up core inflation as households have more income disposable for non-energy spending. EUR/GBP drops from the 0.88 area to currently 0.8760. Next support stands at 0.8722.
News Headlines
Swedish GDP decreased 0.9% Q/Q in Q4 2022. The decline was mainly driven by a decline of capital formation in fixed assets (-0.8%). Household consumption decreased 0.2% Q.Q. Changes in inventories contributed negatively to GDP growth by 0.7% ppts. Government consumption rose a 0.2%. Exports decreased 1% and the contribution of net exports to growth was negligible. Weaker growth figures might complicate the Riksbank policy. The Swedish central bank raised its policy rate by 50 bps to 3% earlier this month and indicated further tightening will be needed as inflation remains unacceptably high. Markets expect another 50 bps increase in April. The weak krone became a factor of importance in the RB’s policy assessment. The krone rebounded from a cycle peak near EUR/SEK 11.40 after the February decision, but cedes ground after the GDP data (11.08 from 11.01).
The National Bank of Hungary left its policy rate unchanged at 13%. The key overnight rate deposit rate stays at 18%. Ahead of the meeting, markets were looking for guidance on when the MNB might start reducing the gap between the overnight rate and the Base rate. The MNB didn’t give any concrete hints but the statement was different from last month. The MPC indicates that ‘maintaining market stability and strengthening monetary policy transmission are also key to achieving price stability. The MNB continues to focus on trend-like developments in financial market conditions. Therefore, the Bank takes into account the persistence of the recent improvement in risk perceptions when setting the conditions of overnight instruments introduced in mid-October’. The forint temporary lost marginal ground on the publication of the policy statement but currently trades little changed near EUR/HUF 378.
US consumer confidence dropped to 102.0, outlook appears considerably more pessimistic
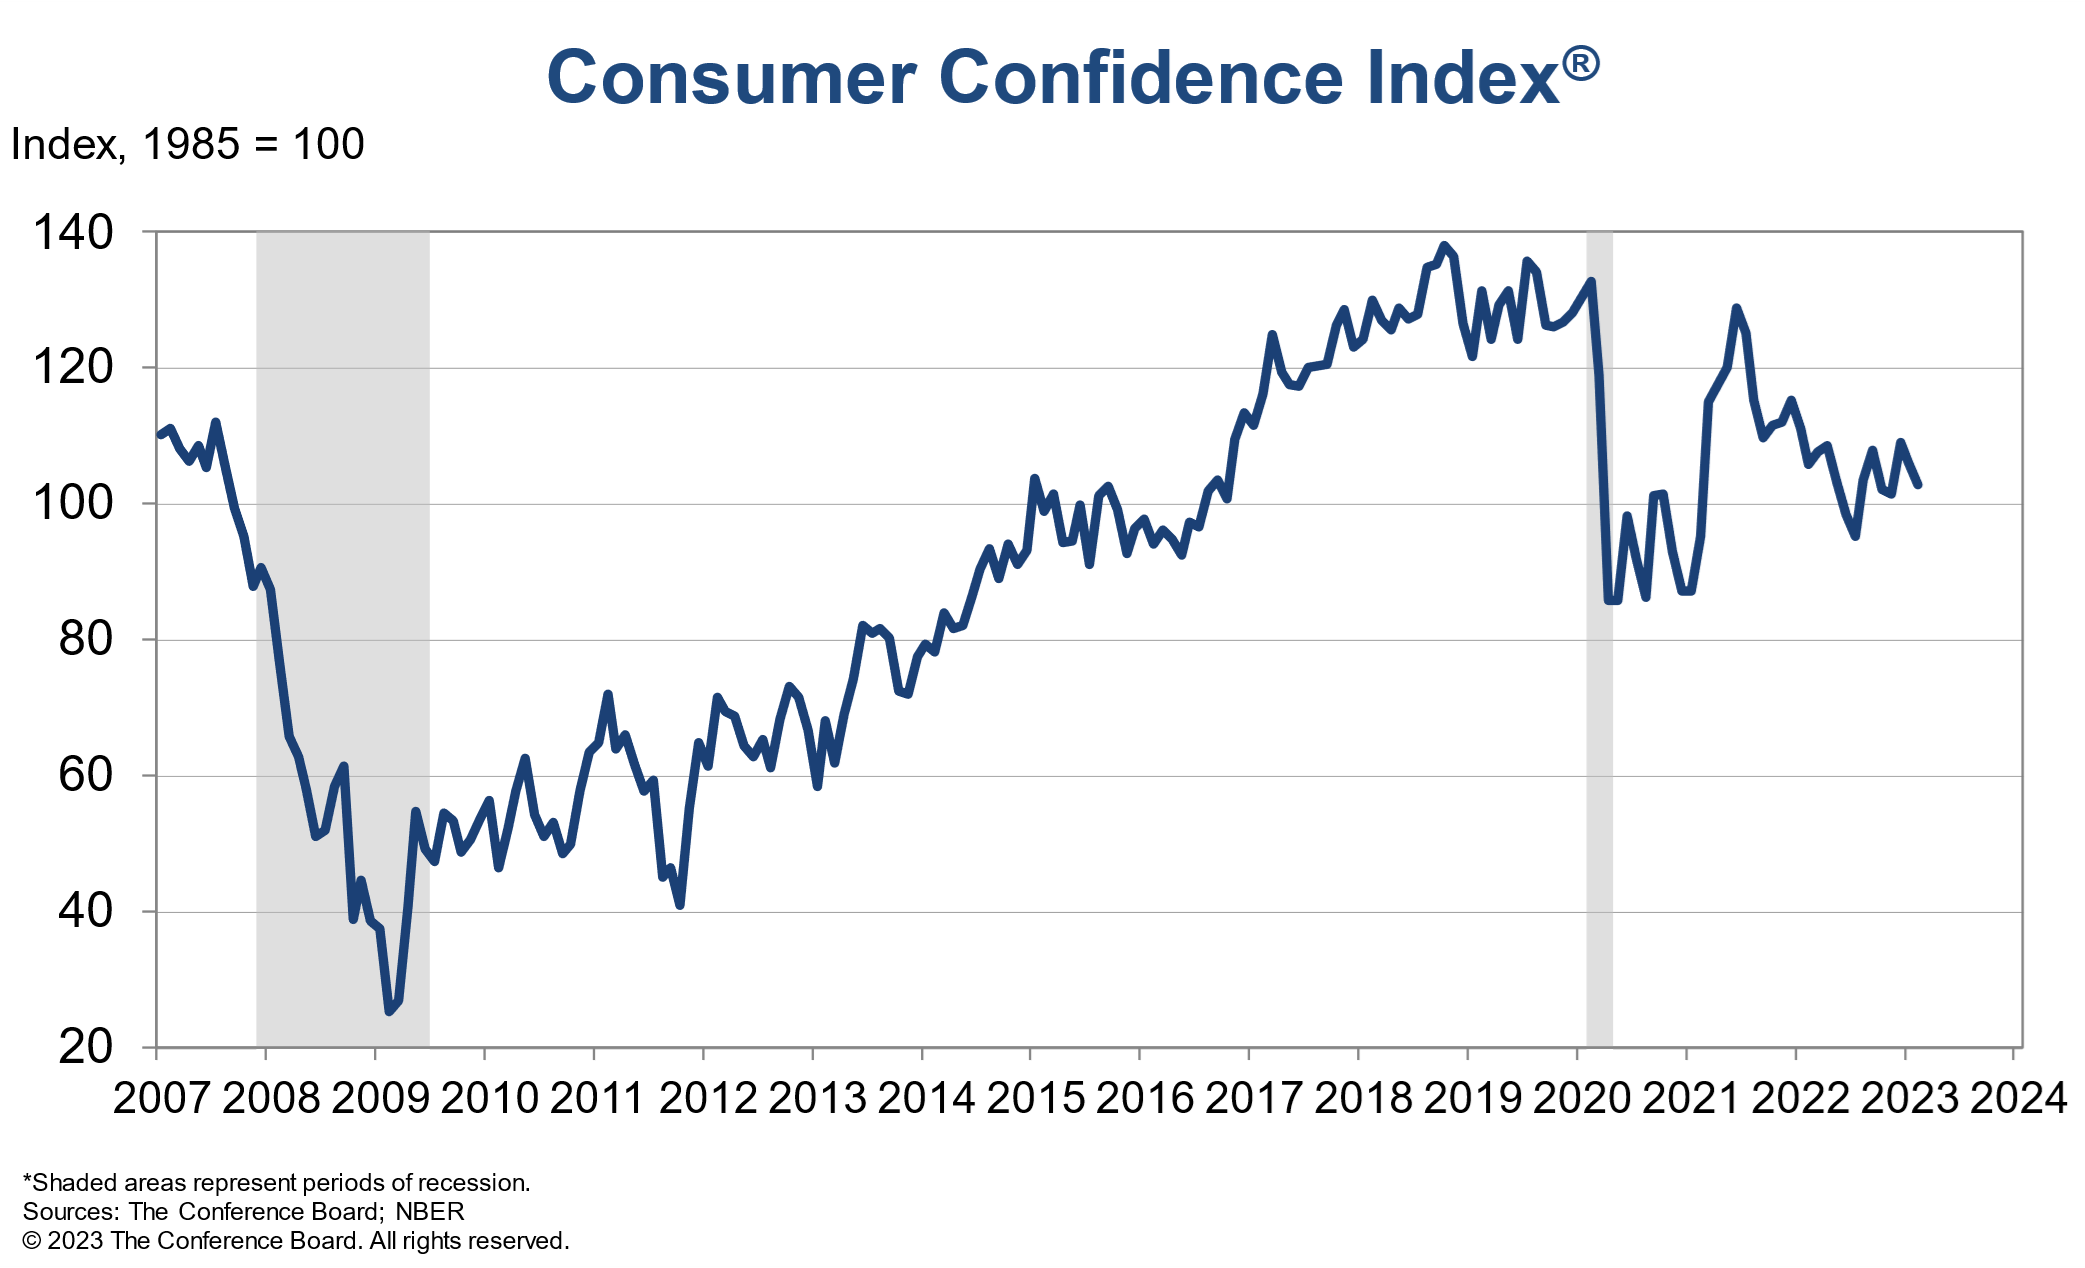
US Conference Board Consumer Confidence dropped from 106.0 to 102.0 in February, below expectation of 108.5. Present Situation Index rose from 151.1 to 152.8. Expectations Index dropped from 76.0 to 69.7.
"Consumer confidence declined again in February. The decrease reflected large drops in confidence for households aged 35 to 54 and for households earning $35,000 or more," said Ataman Ozyildirim, Senior Director, Economics at The Conference Board.
"While consumers' view of current business conditions worsened in February, the Present Situation Index still ticked up slightly based on a more favorable view of the availability of jobs. In fact, the proportion of consumers saying jobs are 'plentiful' climbed to 52.0 percent—back to levels seen in the spring of last year. However, the outlook appears considerably more pessimistic when looking ahead. Expectations for where jobs, incomes, and business conditions are headed over the next six months all fell sharply in February."
"And, while 12-month inflation expectations improved—falling to 6.3 percent from 6.7 percent last month—consumers may be showing early signs of pulling back spending in the face of high prices and rising interest rates. Fewer consumers are planning to purchase homes or autos and they also appear to be scaling back plans to buy major appliances. Vacation intentions also declined in February."
USD/JPY Mid-Day Outlook
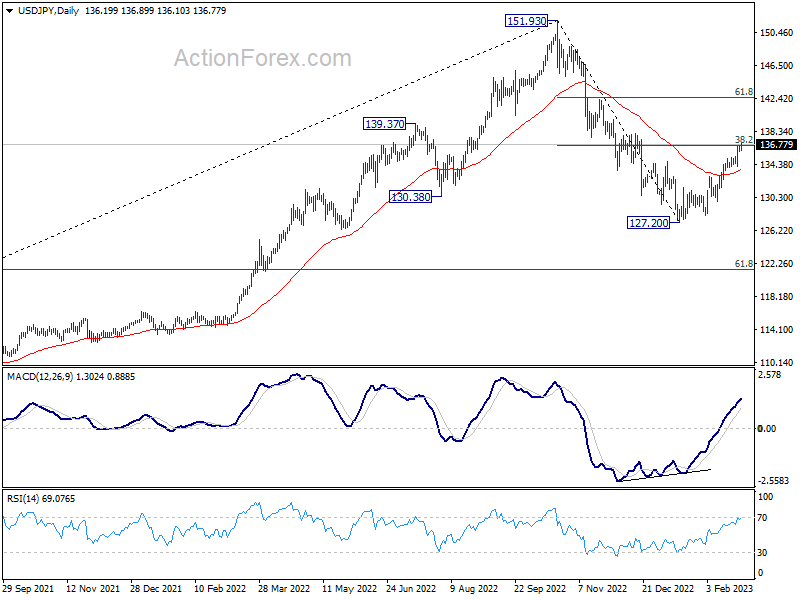
Daily Pivots: (S1) 135.92; (P) 136.23; (R1) 136.55; More...
No change in USD/JPY's outlook as focus stays on 38.2% retracement of 151.93 to 127.20 at 136.64. Rejection by this fibonacci level, followed by break of 134.04 support, will argue that such rebound from 127.20 has completed, and turn bias back to the downside. However, sustained trading above 136.64 will indicate that fall from 151.93 has completed, and bring further rally to 61.8% retracement at 142.48.
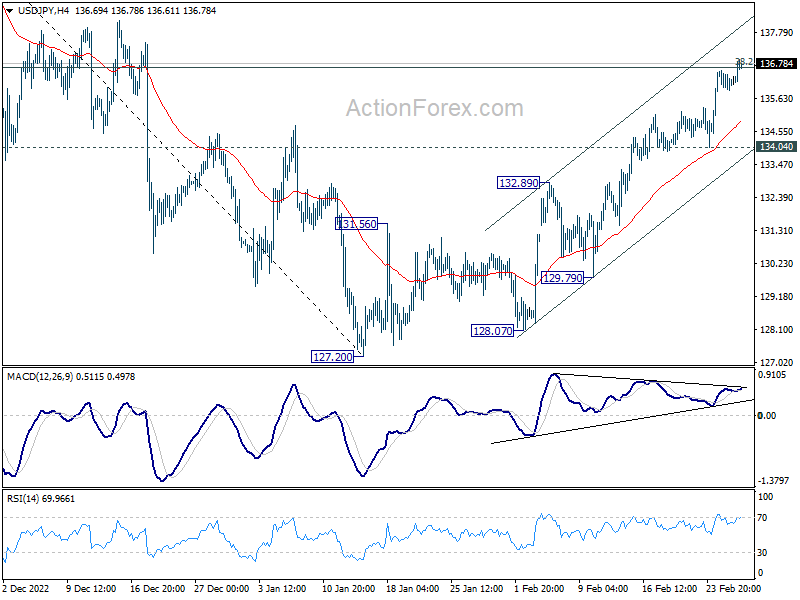
In the bigger picture, focus is now on 38.2% retracement of 151.93 to 127.20 at 136.64. Sustained break there will indicate that price actions from 151.93 medium term are merely a corrective pattern. Such development will maintain long term bullishness. Rejection by 136.64 will, on the downside, extend the fall from 151.93 to 61.8% retracement of 102.58 to 151.93 at 121.43 at a later stage.