Sample Category Title
EUR/GBP Daily Outlook
Daily Pivots: (S1) 0.8763; (P) 0.8788; (R1) 0.8820; More...
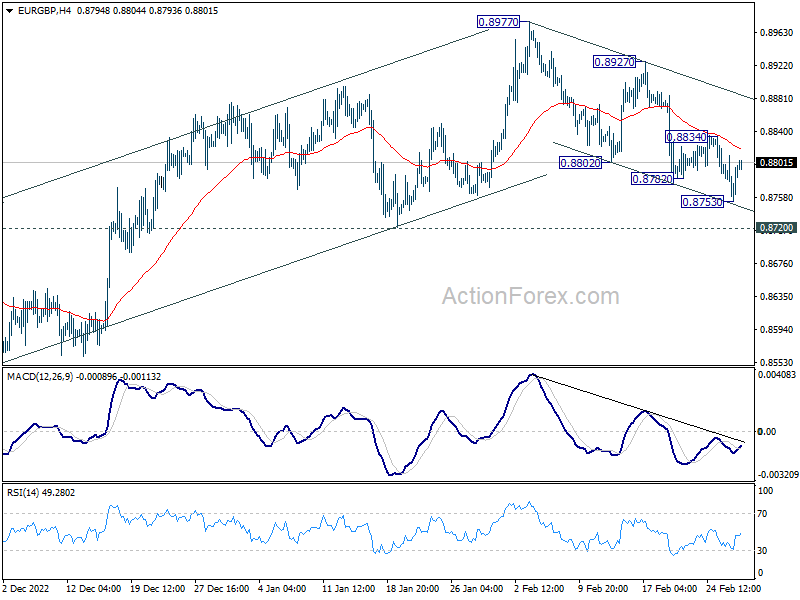
Intraday bias in EUR/GBP is turned neutral again as it recovered after dipping to 0.8753. Further decline is expected with 0.8834 resistance intact. Below 0.8753 will resume the fall form 0.8977 to 0.8720 support. Firm break there should confirm completion of whole rebound from 0.8545, and turn near term outlook bearish for this support. However, break of 0.8834 will dampen this bearish view and turn bias back to the upside for stronger rebound.
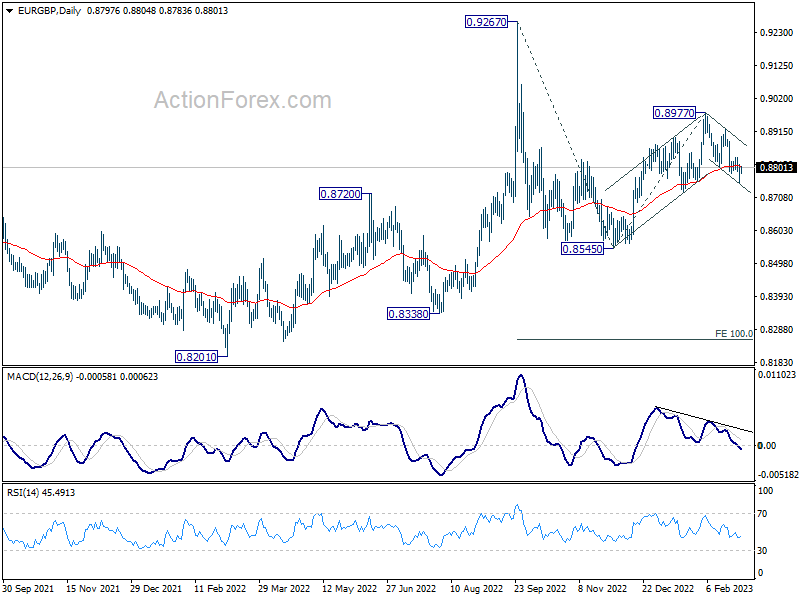
In the bigger picture, current development suggests that fall from 0.9267 (2022 high) is still in progress. Such decline is seen as a leg inside long term range pattern from 0.9499 (2020 high). Break of 0.8545 will target 100% projection of 0.9267 to 0.8545 from 0.8977 at 0.8255. On the other hand, strong rebound from current level will extend the rise from 0.8545 through 0.8977 at a later stage.
EUR/AUD Daily Outlook
Daily Pivots: (S1) 1.5670; (P) 1.5743; (R1) 1.5790; More...
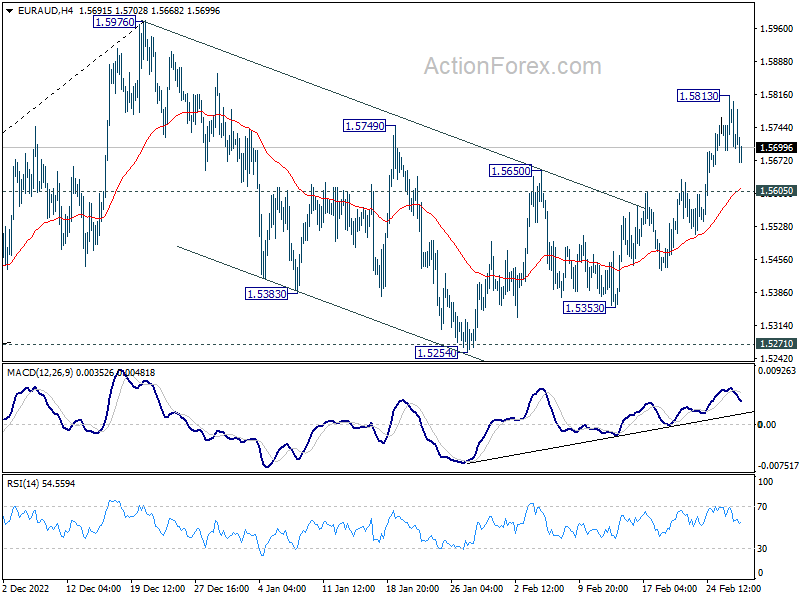
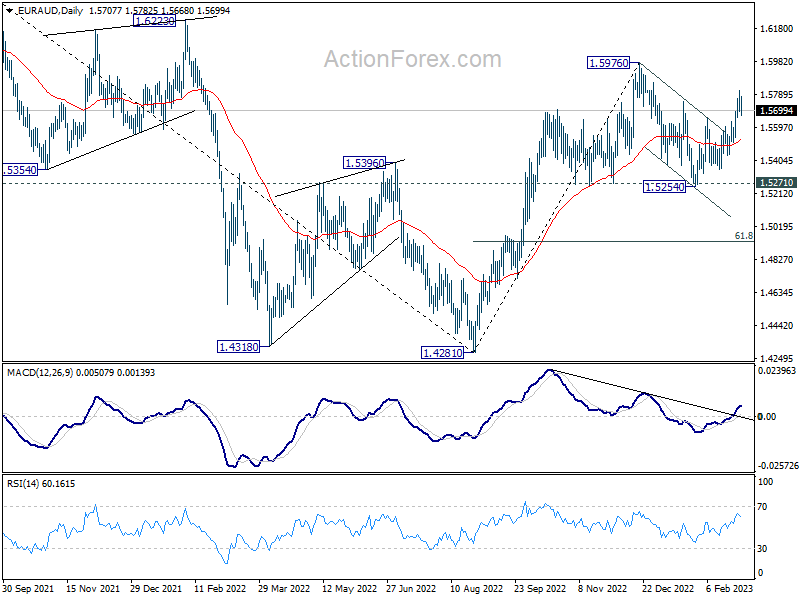
Intraday bias in EUR/AUD is turned neutral first as it retreated after hitting 1.5813. Outlook is unchanged that corrective fall form 1.5976 has completed at 1.5254. Further rally is expected as long as 1.5605 support holds. Above 1.5813 will resume the rebound from 1.5254 to retest 1.5976 high.
In the bigger picture, it's still early to confirm if rise from 1.4281 represents bullish trend reversal. But as long as 1.5271 support holds, such rally is in favor to continue. Break of 1.5976 will target 1.6434 key resistance next. On the other hand, firm break of 1.5271 will retain medium term bearishness instead.
EUR/CHF Daily Outlook
Daily Pivots: (S1) 0.9931; (P) 0.9948; (R1) 0.9982; More....
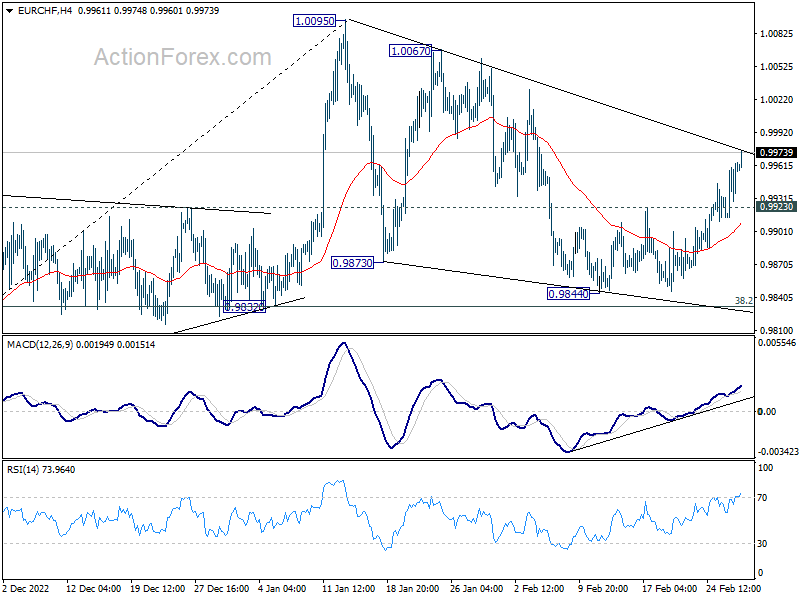
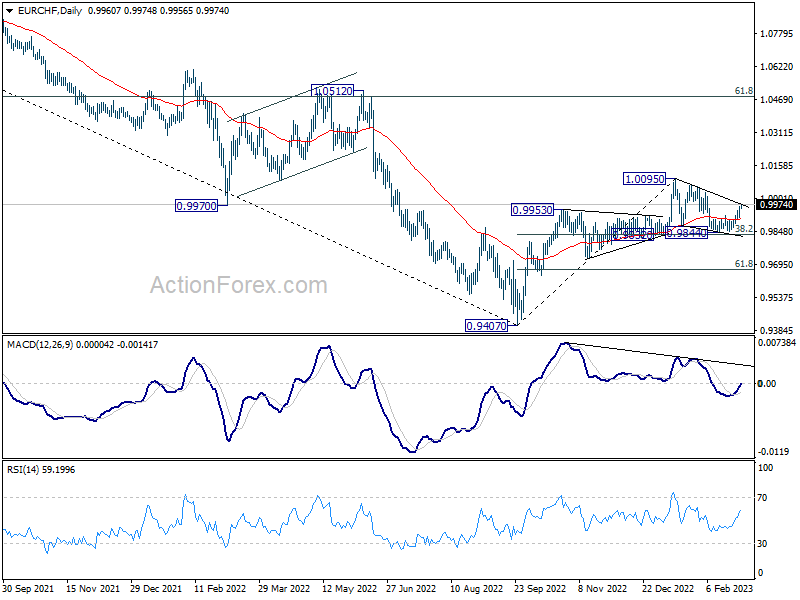
EUR/CHF's rebound from 0.9844 is still in progress and intraday bias stays on the upside. As noted before, corrective pattern from 1.0095 should have completed with three waves down to 0.9844. Sustained break of the falling rend line resistance (now at 0.9974) will add to this bullish cas and bring retest of 1.0095 high. On the downside, below 0.9923 minor support will mix up the outlook and turn intraday bias neutral first.
In the bigger picture, with 0.9832 support intact, rise from 0.9407 (2022 low) is still expected to continue. Break of 1.0095 and sustained trading above 55 week EMA (now at 1.0021) will be a medium term bullish signal, and bring further rally to 1.0505 cluster resistance (2020 low at 1.0505, 61.8% retracement of 1.1149 to 0.9407 at 1.1484). However, firm break of 0.9832 support will revive medium term bearishness and bring retest of 0.9407 low instead.
Hot Inflation Boosts ECB Rate Hike Bets
Uh oh! Inflation in Europe took the wrong direction in February. The data released yesterday printed a record inflation of 7.2% in France and ticked higher to 6.1% in Spain. Both were higher than expected, of course, and cranked up the hawkish European Central Bank (ECB) rate expectations.
For the first time, the market pricing pointed out that the ECB’s deposit rate would reach 4%, 150bp higher than where it stands right now. That means more 50bp hike will be on the mene after the next ECB meeting’s almost certain 50bp hike.
What does that mean for investors?
First, it means higher bond yields, as the hawkish ECB expectations directly impact the bond yields, sending them higher. As such, German, French, Italian and Spanish 10-year yields are now at the highest levels in more than a decade. They are at levels reached during the European debt crisis at the start of 2010s.
Higher yields are good for the euro - even if it won’t necessarily reverse the negative trend against the dollar, it should at least slow the selloff.
But hotter-than-expected inflation is not necessarily good for the European stocks, as higher inflation means higher ECB rates, higher ECB rates mean higher bond yields, higher bond yields mean more expensive financing for companies, more expensive financing for companies means less projects, less manufacturing, less services, and that, in return, means lower revenues for companies.
Though a stronger euro helps companies eke out better profits as a stronger currency makes raw material and energy costs more affordable for European businesses, higher yields could weigh more on the balance than a stronger euro. Therefore, what’s probably next for the Stoxx 600 is a downside correction, following a 23% rally between last October and this February.
Today, we will get hold of the German inflation figures along with the final manufacturing PMI data for the Eurozone countries, and tomorrow morning, the Italian CPI numbers will fall in before the Eurozone flash CPI estimate for February. The expectation is that inflation in the Eurozone may have slowed to 8.2% from 8.6% printed a month ago. Or it may have not slowed as much.
Higher inflation combined with soft growth is the worst possible scenario for stocks.
Slower Aussie inflation, stronger China PMI
Inflation in Australia eased more than expected in January, from last month’s record 8.4% to 7.4% versus 8% expected by analysts. But growth also slowed in Q4.
The Aussie-dollar first dipped then rebounded. The better-than-expected PMI data from China boosted iron ore prices, and helped throw a floor under the Aussie’s selloff, at around the 100-DMA, 0.6740. But clearing support at this level would only take another wave of hawkish Federal Reserve (Fed) pricing, which would boost the dollar appetite and send the pair below the 100-DMA. The downside risks prevail.
Speaking of the Fed expectations
Cooling US house prices for a seventh straight month, and ugly Richmond manufacturing index cooled the hawkish Fed pressures yesterday, but the S&P500 couldn’t hold on to its gains above the 50-DMA, and closed yesterday’s session below this level. As a result, the month of February ended with a 2.7% loss for the S&P500, and with mounting pressure from the bears.
The key support to watch in S&P500 is the 200-DMA, near 3940. There are warnings that a fall below this level could trigger a $50 billion selloff, according to JP Morgan.
Elsewhere, well crude oil jumped yesterday, although the latest API data showed another 6.2 million barrel build last week in the US crude inventories. The strong PMI data from China certainly helped keeping the oil bulls alert, but the 50-DMA offers, a touch below the $78pb, may be hard to clear defying the massive builds in US crude inventories week after week. The more official EIA data is due today, and remember last week, the EIA data was even bigger than the API.
China is Back to Work
Market movers today
German CPI for February will be in focus this morning as CPI for German länder rolls over the screens before the countrywide CPI is released at 14.00CET. Both France and Spain saw upside surprises in CPI inflation yesterday.
In the US it is time for ISM manufacturing for February, which we expect to tick higher following stronger-than-expected US manufacturing PMI released 1½ week ago.
It is PMI day in many European countries, not least the UK and Norway and Sweden. We could see a small pick-up in the numbers as witnessed in many countries in early 2023. It follows a decent decline in energy prices and a lift in Chinese activity after the re-opening of the economy.
The 60 second overview
China: PMI indices rose across the board in China in February and rose by more than expected by consensus. Reopening of the economy has led to a rise in economic activity. The manufacturing gauge increase to 52.6 from 50.1 and thus well into expansionary territory. The non-manufacturing index rose to 56.3 from 54.4 and finally the composite measure was 56.4 - a big increase from 52.9. The Caixin manufacturing PMI confirmed the picture above. It rise to 51.6 from 49.2.
US: Consumer confidence dropped in the US in February after consumers turned sour about their expectations for the future. They remain upbeat about their view on the current situation though.
Equities: Equities lower yesterday in a remarkable cyclical outperformance. This is very interesting as it illustrates quite well the battle between a soft-landing and overheating. On the one side the challenge coming from too high inflation (yesterday France and Spain), lifting yields, hurting the equity risk premia. On the other side the improving macro-outlook lifting the chance of better earnings outlook benefitting the cyclicals the sector the most. Despite the drop in almost all major indices yesterday, materials and financials (driven by banks) outperformed, while utilities were underperforming. We expect the battle between overheating and soft-landing to continue for a while as the job market is still strong, growth will improve from a very low level while this is countered by massive monetary tightening.
In US yesterday, Dow -0.7%, S&P 500 -0.3%, Nasdaq -0.1% and Russell 2000 +0.04%.
Asian markets are higher this morning led by a rally in Chinese H-shares. Optimism was boosted overnight from strong PMI releases, not just in China. The strong macro data from Asia have also resulted in a turnaround in European and US futures, meaning they are now higher after being lower very early morning.
FI: It was again a volatile day in the global bond markets, where the sell-off continued on the back of stronger than expected inflation data from France and Spain. Today, we will get inflation data out of Germany before the aggregate data is released from the Eurozone on Thursday. If inflation data continue to surprise on the upside the repricing of the ECB should continue and thus put more pressure on bond markets.
FX: Yesterday, EUR/USD moved back below 1.06, as USD increased in late trading after EUR initially broadly strengthened on the back of stronger-than-expected inflation prints from Spain and France, which could indicate a relatively strong Euro Area inflation print in the pipeline tomorrow. For the whole of February, USD has appreciated against all G10 peers except SEK. EUR/GBP is hovering around the 0.88 mark, and both SEK and NOK weakened against the EUR trading at 11.07 and 10.98, respectively.
Nordic macro
Norway. We reckon the Norwegian PMI will hold around 50 in February, with continued weak growth in European manufacturing sector probably counteracting optimism in the oil supply sector. Statistics Norway's Q4 confidence survey suggests some downside risk to our forecast.
Sweden. While Swedish manufacturing PMI has dropped a lot alongside global dittos and was down at 46.8 in January, it has moved sideways in recent months. Also of great interest is the subcomponents, where on the positive side price plans and delivery times have moved lower and on the negative side employment has moved lower as well and seems to be on the verge of dropping below the 50 mark.
EUR/USD Daily Outlook
Daily Pivots: (S1) 1.0552; (P) 1.0598; (R1) 1.0623; More...
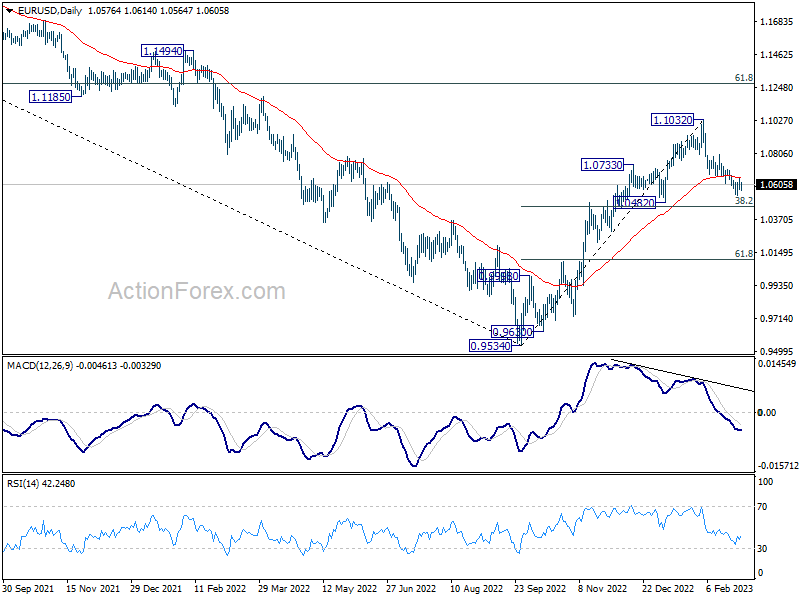
Intraday bias in EUR/USD remains neutral as range trading continues above 1.0532 temporary low. The decline from 1.1032 might still extend lower, but strong support could be seen around 38.2% retracement of 0.9534 to 1.1032 at 1.0463 to bring rebound, at least on first attempt. Break of 1.0668 support turned resistance will turn bias back to the upside for 1.0803 resistance and above. However, sustained break of 1.0463 will carry larger bearish implications.
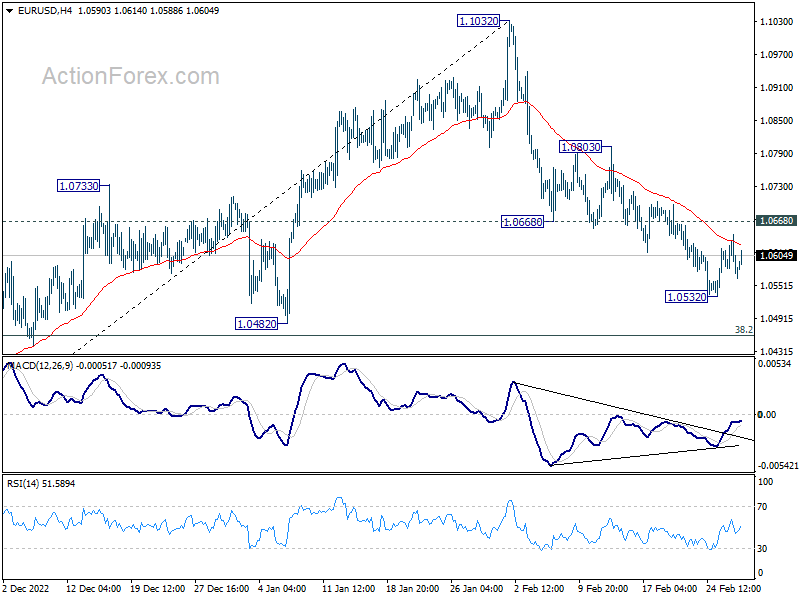
In the bigger picture, as long as 1.0482 support holds, rise from 0.9534 (2022 low) should continue to 61.8% retracement of 1.2348 (2021 high) to 0.9534 at 1.1273. However, sustained break of 1.0482 will bring deeper fall to 61.8% retracement of 0.9534 to 1.1032 at 1.0106, even as a corrective pull back.
GBP/USD Daily Outlook
Daily Pivots: (S1) 1.1980; (P) 1.2061; (R1) 1.2106; More...
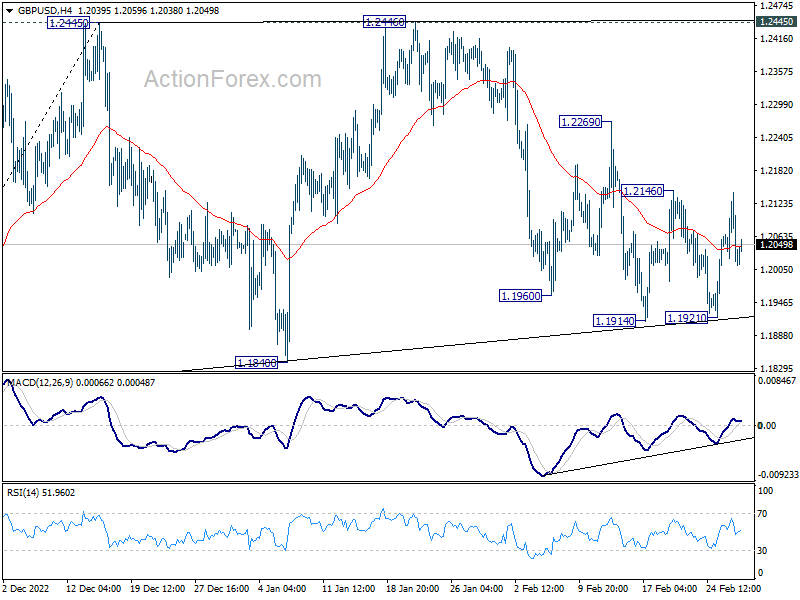
Range trading continues in GBP/USD and intraday bias remains neutral. On the downside, break of 1.1914 will resume the decline from 1.2446 for 1.1840 support and possibly below. On the upside, break of 1.2146 resistance will turn bias back to the upside for further rebound to 1.2269 and above.
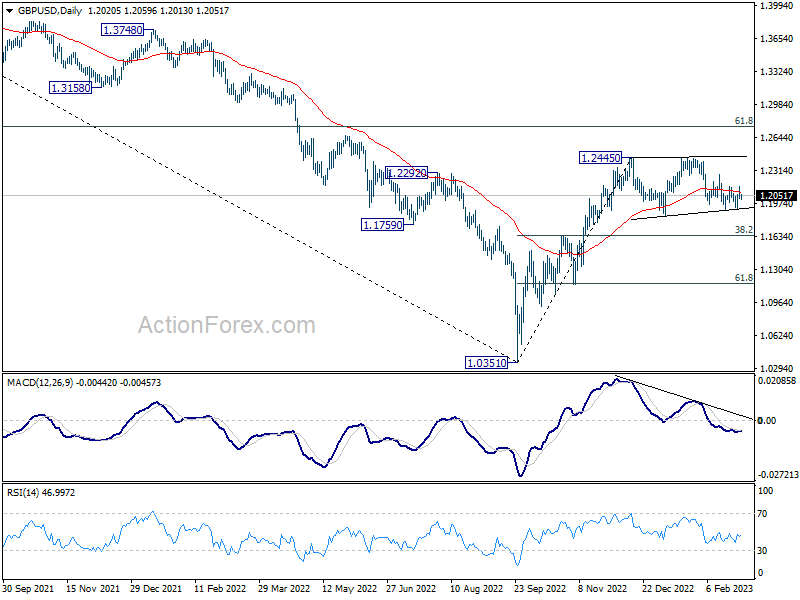
In the bigger picture,as long as 1.1840 support holds, rise from 1.0351 medium term bottom (2022 low) should still continue to 61.8% retracement of 1.4248 (2021 high) to 1.0351 at 1.2759. However, decisive break of 1.1840 will complete a double top pattern (1.2445, 1.2446) after rejection by 55 week EMA (now at 1.2251). Deeper decline should be seen back to 38.2% retracement of 1.0351 to 1.2445 at 1.1645.
USD/CHF Daily Outlook
Daily Pivots: (S1) 0.9368; (P) 0.9396; (R1) 0.9449; More...
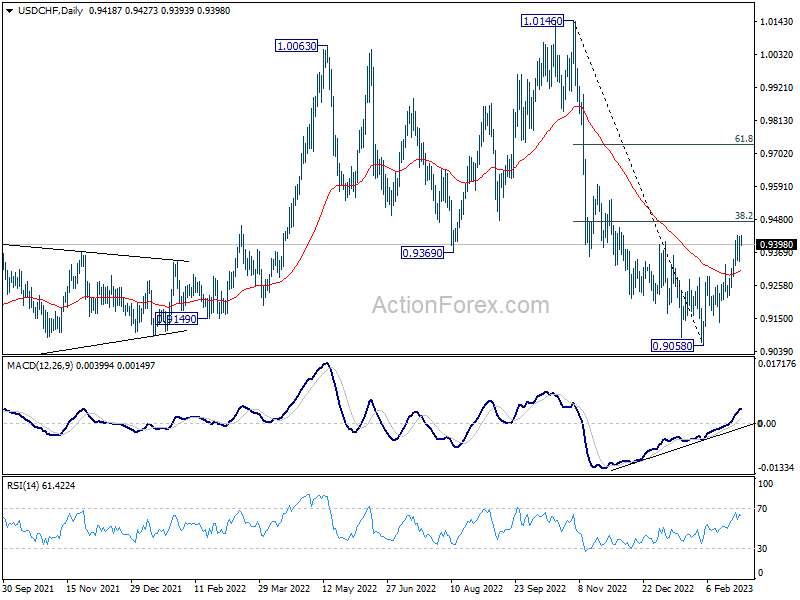
Intraday bias in USD/CHF remains neutral a this point. Break of 0.9428 will resume the rebound form 0.9058. But strong resistance could be seen at 38.2% retracement of 1.0146 to 0.9058 at 0.9474 to limit upside. Break of 0.9289 resistance turned support will indicate completion of the rebound and turn bias back to the downside. However, decisive break of 0.9474 will carry larger bullish implications and target 61.8% retracement at 0.9730.
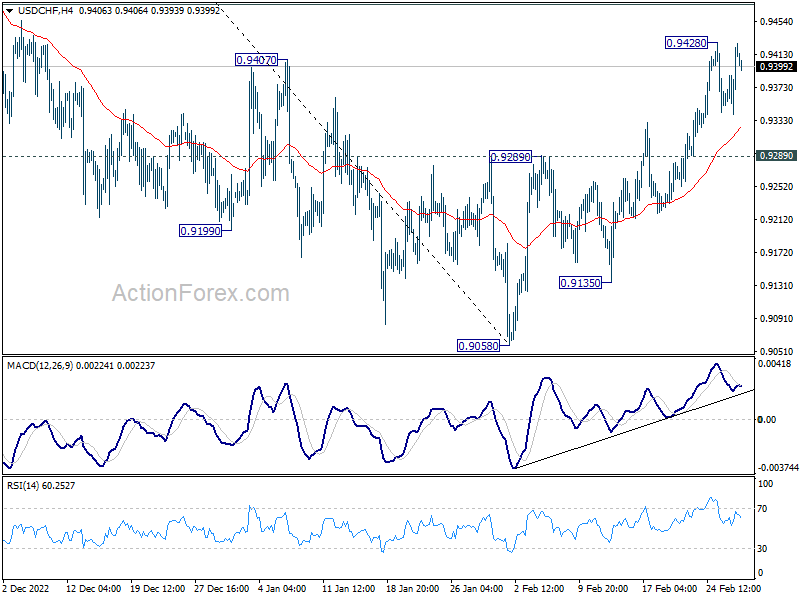
In the bigger picture, decline from 1.0146 is seen as part of a long term sideway pattern. As long as 38.2% retracement of 1.0146 to 0.9058 at 0.9474 holds, another fall is in favor through 0.9058. However, sustained trading above 0.9474 will indicate that the medium term trend has reversed, and open up further rally to 61.8% retracement at 0.9730 and above.
USD/JPY Daily Outlook
Daily Pivots: (S1) 135.68; (P) 136.30; (R1) 136.86; More...
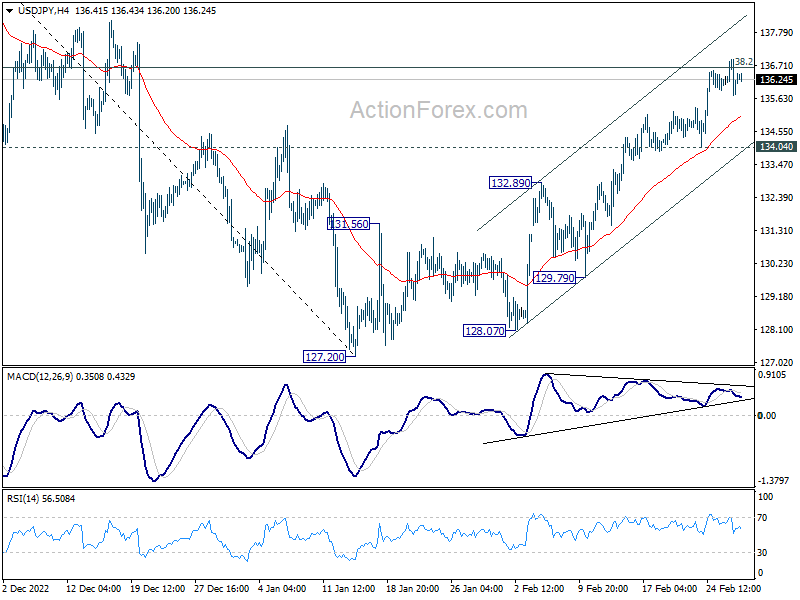
Intraday bias in USD/JPY is turned neutral first. Focus is staying on 38.2% retracement of 151.93 to 127.20 at 136.64. Rejection by this fibonacci level, followed by break of 134.04 support, will argue that such rebound from 127.20 has completed, and turn bias back to the downside. However, sustained trading above 136.64 will indicate that fall from 151.93 has completed, and bring further rally to 61.8% retracement at 142.48.
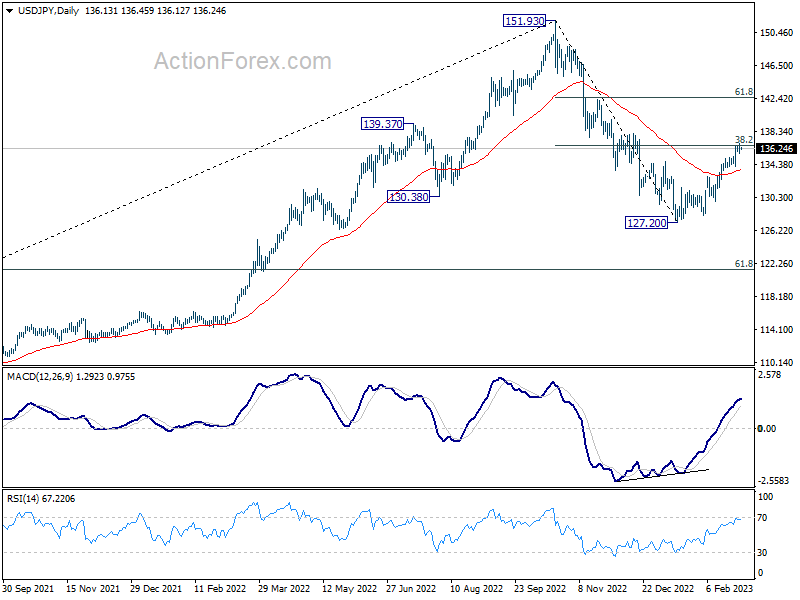
In the bigger picture, focus is now on 38.2% retracement of 151.93 to 127.20 at 136.64. Sustained break there will indicate that price actions from 151.93 medium term are merely a corrective pattern. Such development will maintain long term bullishness. Rejection by 136.64 will, on the downside, extend the fall from 151.93 to 61.8% retracement of 102.58 to 151.93 at 121.43 at a later stage.
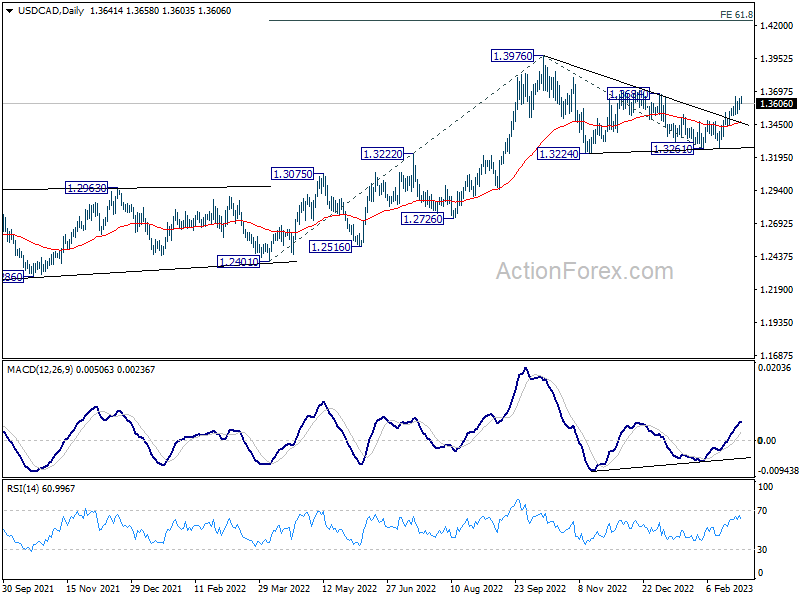
USD/CAD Daily Outlook
Daily Pivots: (S1) 1.3588; (P) 1.3619; (R1) 1.3676; More....
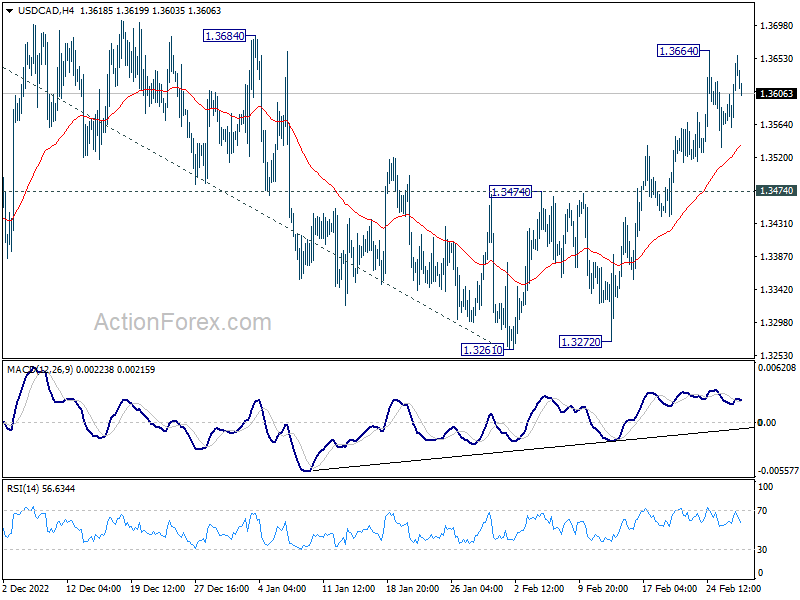
Intraday bias in USD/CAD remains neutral first as consolidation from 1.3664 temporary top is extending. Further rally is in favor as long as 1.3474 resistance turned support holds. Break of 1.3664 will resume the rise from 1.3261. Sustained trading above 1.3684 will confirm that corrective pattern from 1.3976 has completed, and bring retest of this high.
In the bigger picture, outlook stays bullish with 1.3222 cluster support (38.2% retracement of 1.2005 to 1.3976 at 1.3223) intact. Break of 1.3976 resistance will resume larger up trend from 1.2005 (2021 low) to 61.8% projection of 1.2401 to 1.3976 from 1.3261 at 1.4234.