Sample Category Title
GBP/CHF accelerate on UK/EU agreement, ready for medium term range breakout
Sterling's rally is accelerating today with sentiment lifted by the Windsor Framework as agreed between the UK and EU regarding the handling of Ireland/Northern Ireland.
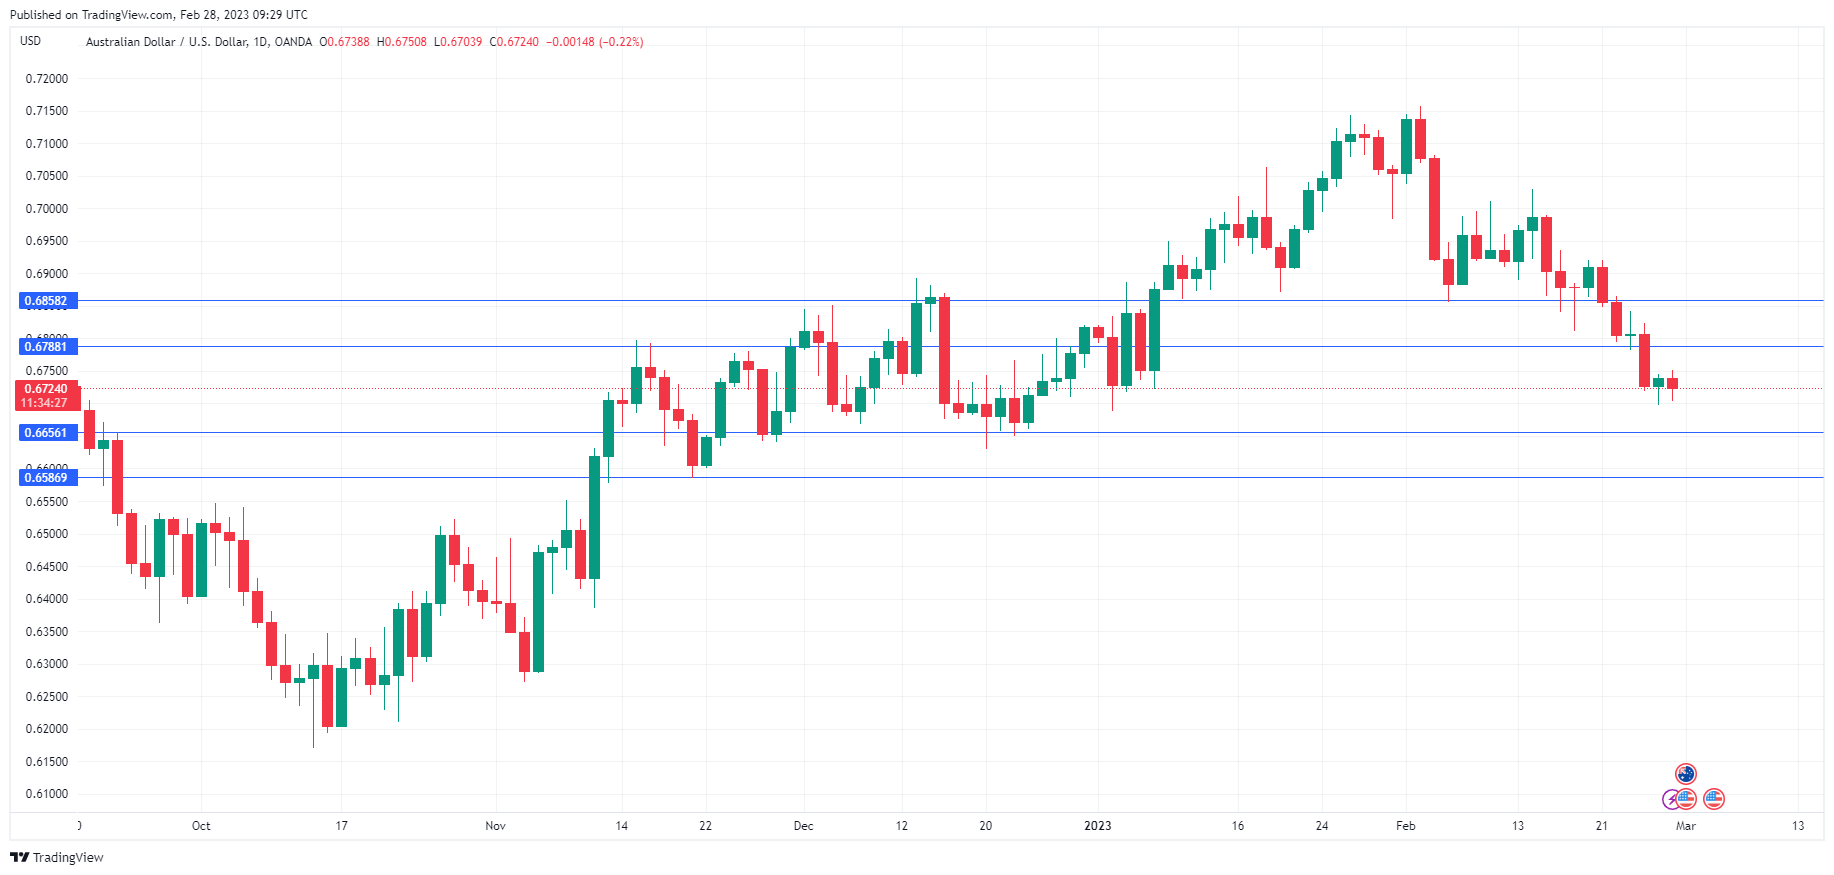
GBP/CHF's rise from 1.1072 accelerated to as high as 1.1353 so far. Further rally is expected as long as 1.1243 support holds, to 1.1433 resistance next.
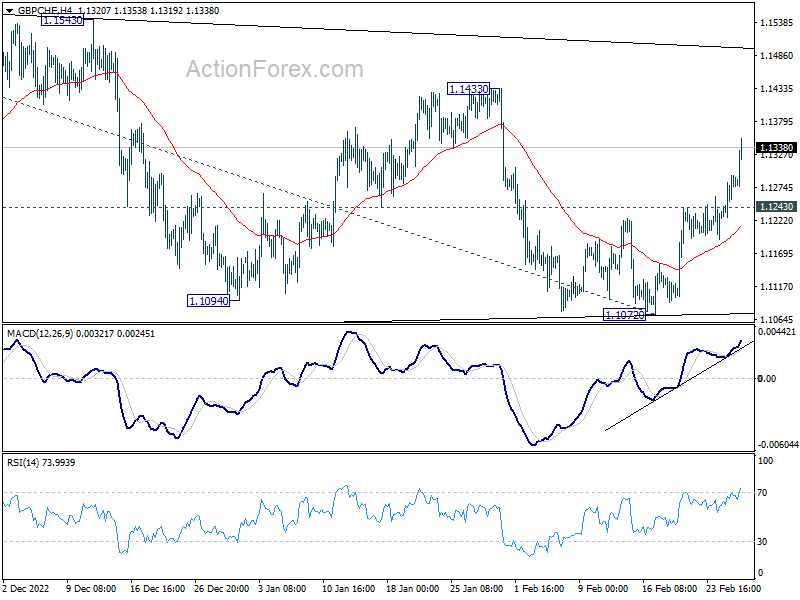
Current development is also inline with the view that the sideway consolidation pattern from 1.1574 has completed at 1.1072. That is, rise from 1.0183 is ready to resume. Firm break of 1.1143 will add to this bullish case, and send GBP/CHF through 1.1574 key resistance. In this case, next target will be 61.8% projection of 1.0183 to 1.1574 from 1.1072 at 1.1932.
AUD/USD Eyes CPI, GDP
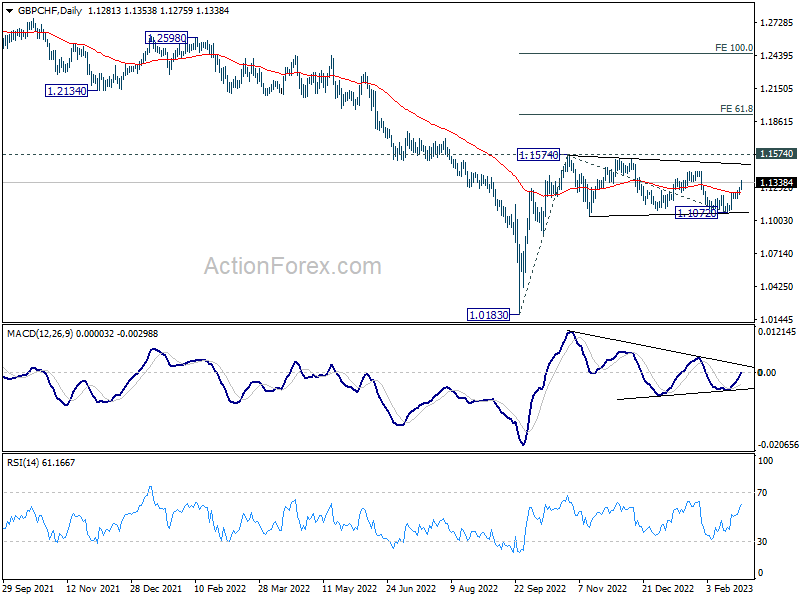
The Australian dollar remains under pressure and has edged lower on Tuesday. AUD/USD dropped below the 0.67 line on Monday for the first time since Jan. 3.
Australian retail sales bounce back
Australian retail sales jumped 1.9% m/m in January, following an upwardly revised 4% decline in December and beating the consensus of 1.5%. The data indicates that consumer demand remains resilient despite rising interest rates and higher inflation.
For the RBA, the upswing in consumer spending is a sign that the economy can continue to bear higher rates. The central bank has hiked some 325 basis points since May 2022 in a bid to curb inflation. The cash rate is currently at 3.35% and the markets have priced in a peak rate of 4.3%, with four rate hikes expected before the end of the year – one more than what is expected for the Fed. The RBA meets on March 7 and is widely expected to raise rates by 25 basis points.
Wednesday could be a busy day for the Australian dollar, as Australia releases inflation and GDP reports. Inflation for January is expected to ease to 7.9% y/y, following an 8.4% gain in December. GDP for the fourth quarter is projected to slow to 2.7% y/y, after a robust gain of 5.9% in Q3. A decline in inflation and in GDP would indicate that high interest rates are having their intended effect and slowing economic activity. The question is whether the RBA will be able to guide the slowing economy to a soft landing and avoid a recession.
In the US, a recent string of strong numbers has raised speculation that the Fed could raise interest rates as high as 6%. The unseasonably warm weather in January may have played a part in the better-than-expected numbers and we’ll have to see if the positive data repeats itself in February. The markets have shifted their stance from a final rate hike in March with rate cuts late in the year to pricing in three more rate hikes in 2023. If upcoming inflation, employment and consumer spending reports point to a weaker economy, we can expect the markets to revert to pricing in a dovish pivot by the Federal Reserve.
AUD/USD Technical
- AUD/USD has support at 0.6656 and 0.6586
- There is resistance at 0.6788 and 0.6858
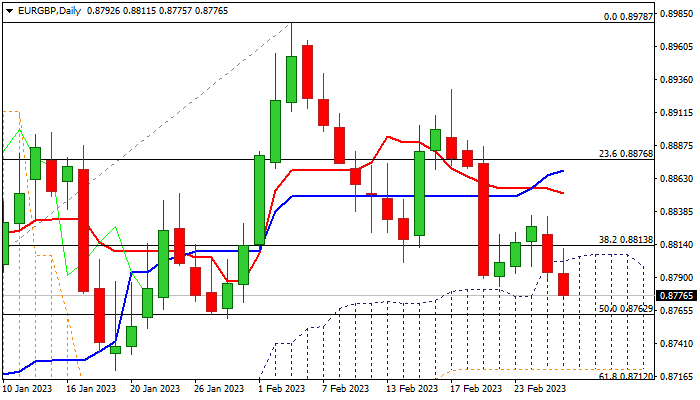
EUR/GBP: Bears Accelerate and Look for Test of 2023 Low
The cross remains firmly in red on Tuesday and extends weakness into second straight day, falling deeper into thick daily cloud (spanned between 0.8805 and 0.8722).
Fresh dip cracked initial support at 0.8783 (Feb 22 low), with firm break here to open way for test of pivotal support at 0.8760 zone (50% retracement of 0.8547/0.8978 / Jan 27/30 higher base), loss of which would risk test of key levels at 0.8721/12 (Jan low / Fibo 61.8%).
Bears also broke below the neckline of the Head and Shoulders pattern on daily chart, as daily moving averages (10/20/30/55) turned to bearish setup and 14-d momentum remains in the negative territory.
Broken daily cloud top reverted to solid resistance, which should keep the upside protected and maintain bearish near-term structure.
Res: 0.8805; 0.8835; 0.8852; 0.8869.
Sup: 0.8760; 0.8721; 0.8712; 0.8661.
Elliott Wave Forecast: USD/JPY Approaching Resistance
There were some BOJ comments in Asia regarding inflation but nothing significant. However, they have to plan different scenarios regarding policy, so we clearly should not be shocked if they change their actions after April if inflation will keep rising. I still think that USDJPY will hit resistance, but for now that's not visible on the charts yet. We see new intraday five-wave cycle in a bullish mode that can be targeting 137.50. However, big level goes back to 138; that goes back to mid December where we see big gap when looking at JPY futures. For more details on this one check our video below in which we also covered other assets.
https://www.youtube.com/watch?v=hMKTCECQvJ8&t=2230s
Risk Sentiment Wavers On Fed Fears
Asian shares were a mixed bag on Tuesday as fears over rising U.S. interest rates hit overall sentiment in the region. European futures are pointing to a positive open this morning, tracking the modest gains on Wall Street overnight. However, a sense of caution continues to linger across financial markets as concerns over further interest rate hikes cap risk appetite. In the FX space, the dollar stabilised during earlier trade appreciating against every single G10 currency. Gold remains shaky, vulnerable, and heading for its worst month since mid-2021 thanks to a hawkish Fed. After sliding roughly 1% in the previous session, oil prices have inched up today amid hopes of a strong economic rebound in China brightening the demand outlook.
Overnight, Australian retail sales rebounded in January, growing 1.9% which beat market expectations of a 1.5% rise. The data suggests that households are still spending despite rising interest rates and soaring inflation. Such a development could place more pressure on the RBA to remain hawkish, fuelling fears around the growth outlook. It is worth keeping in mind that concerns remain elevated over strong price pressures and slowing economic growth in the face of rising interest rates. The aussie has weakened against every G10 currency this month, shedding over 5% against the dollar. Prices in AUDUSD are under pressure with a breakdown below 0.6700 opening the doors to lower levels.
Dollar dominates in February
It has been a positive month for the dollar, halting a run of four straight months of declines.
Incredibly positive jobs data, sticky inflation figures, and hawkish comments from Fed officials have injected the dollar with renewed confidence. As market expectations intensified over US rates remaining higher for longer, this boosted buying sentiment towards the dollar. The peak, terminal rate for Fed funds is now near 5.40%, up from around 4.90% in January. The key question is whether the positive momentum will roll over into the new month when we get fresh rate decisions from all the major central banks, including the FOMC meeting on March 22. Given how the dollar remains highly data dependent, there could be more volatility in the coming weeks.
Looking at the technical picture, the Dollar Index (DXY) remains bullish on the daily charts as there have been a series of higher highs and higher lows, giving us a bullish price channel. Should 104.30 prove to be reliable support, prices could test the next key level of interest at 105.50.
Commodity spotlight - Gold
It has been a rough month for gold with the precious metal losing over 6% of its value, as at the time of writing. This would be its worst month since mid-2021.
Gold has stood little chance against an appreciating dollar and rising Treasury yields as expectations have intensified over the Fed keeping rates higher for longer. With Fed hawks currently in a position of power, this could signal further downside for gold in the short to medium term.
Looking at the precious metal from a technical view, the bearish engulfing candlestick pattern on the monthly timeframe could signal a decline below $1800. It is worth keeping in mind that the 200-day Simple Moving Average can be found just below this psychological support level at $1776.
GBPUSD Extends Sideways Pattern Between SMAs
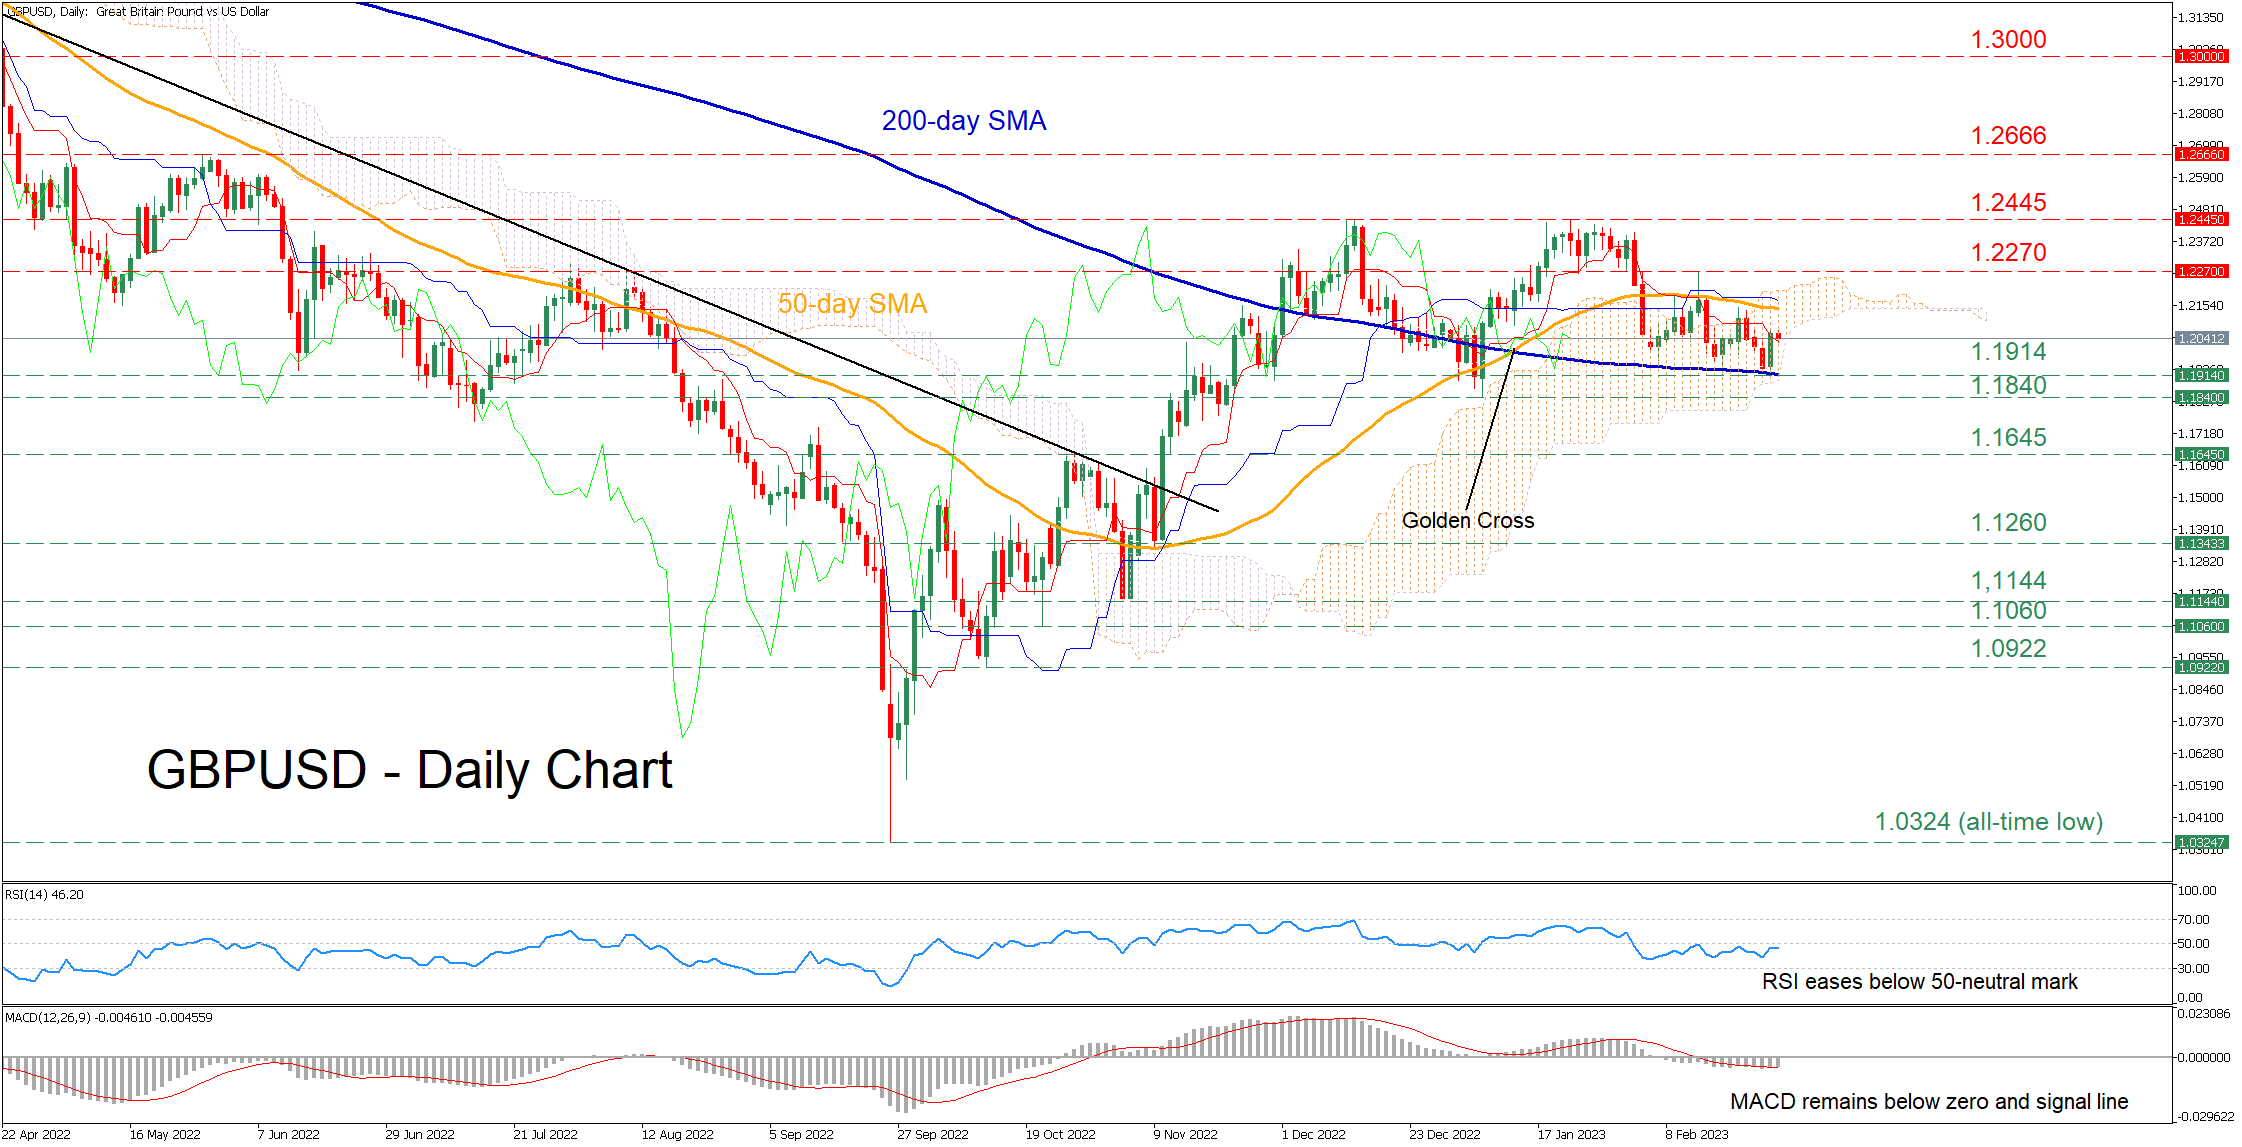
GBPUSD has been edging higher since September when it found its feet at the all-time low of 1.0324. However, this latest rebound seems to be fading after being rejected twice at the 1.2445 region, with the price remaining stuck in a tight range formed by its 50- and 200-day simple moving averages (SMAs).
Despite the pair’s rangebound pattern, the short-term oscillators are indicating that near-term risks remain tilted to the downside. Specifically, the RSI is pointing downwards after failing to cross above the 50-neutral mark, while the MACD histogram is currently below both zero and its red signal line.
To the downside, the congested region that includes the 200-day SMA and the recent low of 1.1914, which has rejected further declines three times in the past two weeks, could act as the first line of defence. Should that floor collapse, the price might test the January low of 1.1840. Even lower, further declines could cease at the October resistance of 1.1645, which could act as support in the future.
Alternatively, should buyers re-emerge and push the price above its 50-day SMA, initial resistance could be found at the recent peak of 1.2270. Breaking above that zone, the price may ascend to test the crucial 1.2445 territory, which capped the pair’s upside twice in the past three months. A break above that zone could turn the spotlight to the May high of 1.2666.
In brief, GBPUSD continues to fluctuate within a tight trading zone, with its 50- and 200-day SMAs acting as an upper and a lower limit, respectively. Therefore, a break above or below this sideways pattern is likely to be followed by a significant move in the same direction.
EURGBP Returns to February’s Low; Caution Remains
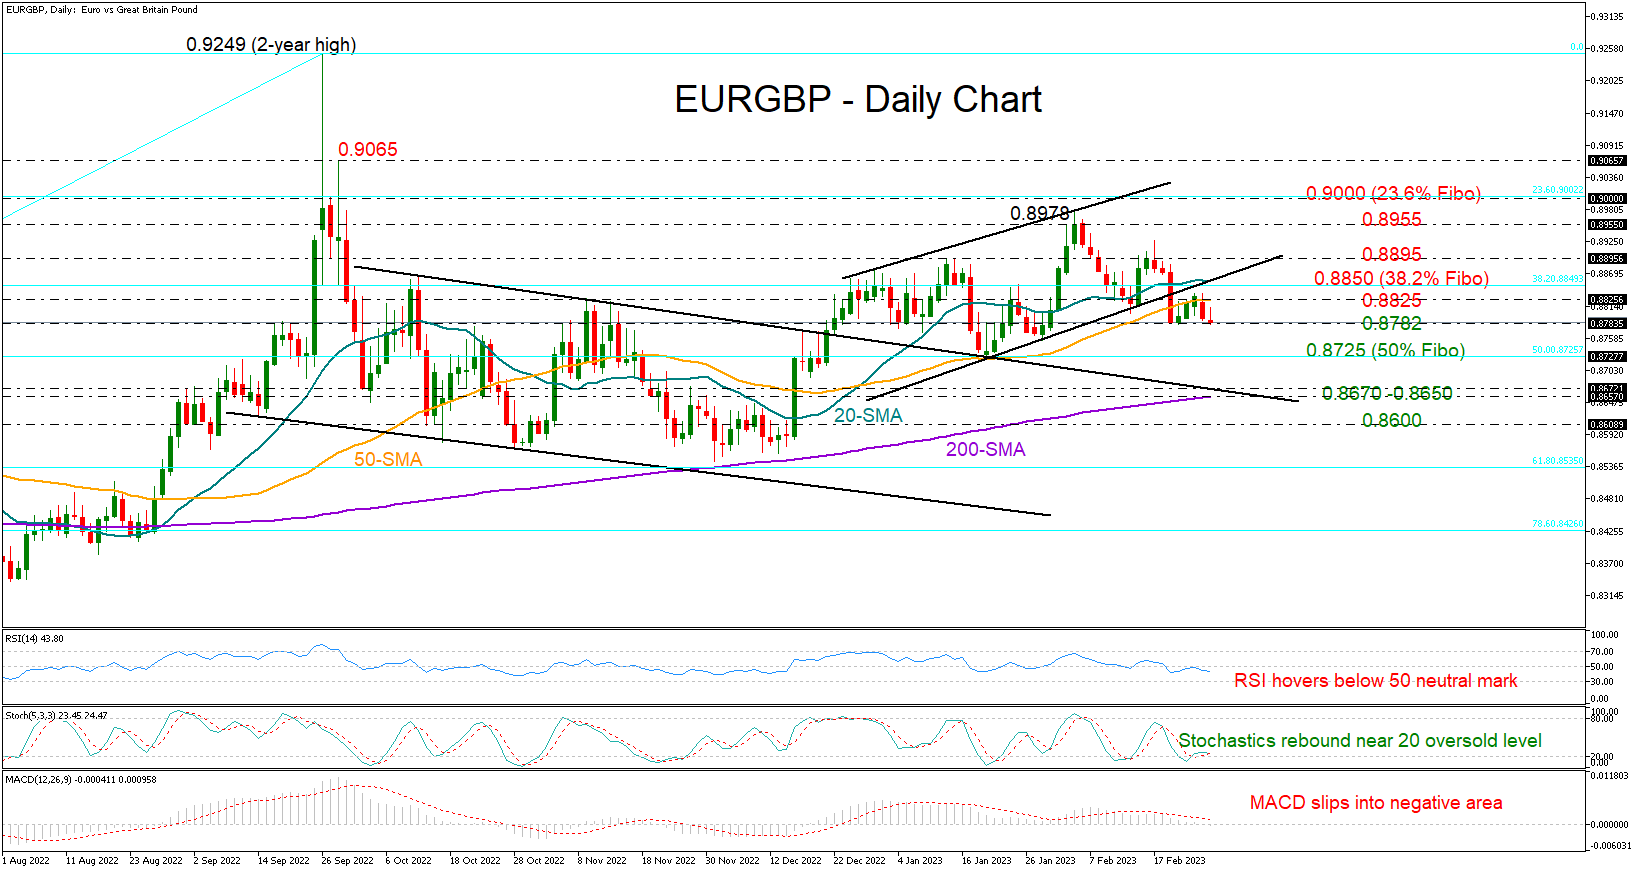
EURGBP pulled below its 50-day simple moving average (SMA) at 0.8820, following encouraging headlines that the UK and the EU have found a new deal to replace the problematic Northern Ireland Protocol, which caused severe disagreements between the two sides.
The downside correction, however, was not strong enough to violate February’s low of 0.8782, providing a ray of hope that the pair may switch back to recovery mode soon. That said, the technical indicators are not generating clear bullish signals yet. Despite the soft upturn in the Stochastic oscillator, the RSI is still hovering slightly below its 50 neutral mark, while the MACD has slipped into the negative region, mirroring persisting selling interest in the market.
Given last week’s bearish channel breakout, the pair might be subject to fresh downside pressures. A decisive close below February’s floor of 0.8782 could intensify selling forces towards January’s trough of 0.8752, where the 50% Fibonacci retracement of the former 0.8201-0.9249 uptrend is located. Another move lower could clear the way towards the constraining descending line from October and the 200-day SMA both seen within the 0.8670-0.8650 zone.
On the upside, the pair keeps facing resistance around its 50-day SMA at 0.8825, while the 0.8850 zone, where the 20-day SMA, the 38.2% Fibonacci level, and the channel’s lower boundary are positioned, may prove a tough obstacle too. Then, a decisive close above the 0.8895 bar will be required for the pair to climb towards February’s resistance zone of 0.8955-0.8978.
In short, EURGBP is still at risk of bearish continuation to 0.8725 despite its resilience above February’s low of 0.8782.
NIKKEI (Japan225) – Found Support From Equal Legs Area
Hello Traders, in this article we will see how the NIKKEI ( JAPAN225 ) index has found support from equal legs area. Here at Elliott Wave Forecast we have developed a system that allows us to define areas of the market in which buyers and seller agree to a reaction. These are high frequency areas in which gives us at least an 85% chance of a 3 waves reaction from these areas. As soon as we can project an equal legs area we present it into our charts and our members know what they can expect. Nikkei has been trading within cycle from 02.06.2023 to complete its B leg lower. Consequently, having it’s first leg lower and connector within the corrective bounce we have presented the equal legs area. Let’s see the 1 hour update we presented to members from 02.22.2023 New York update.
NIKKEI 1 Hour New York update 02.22.2023
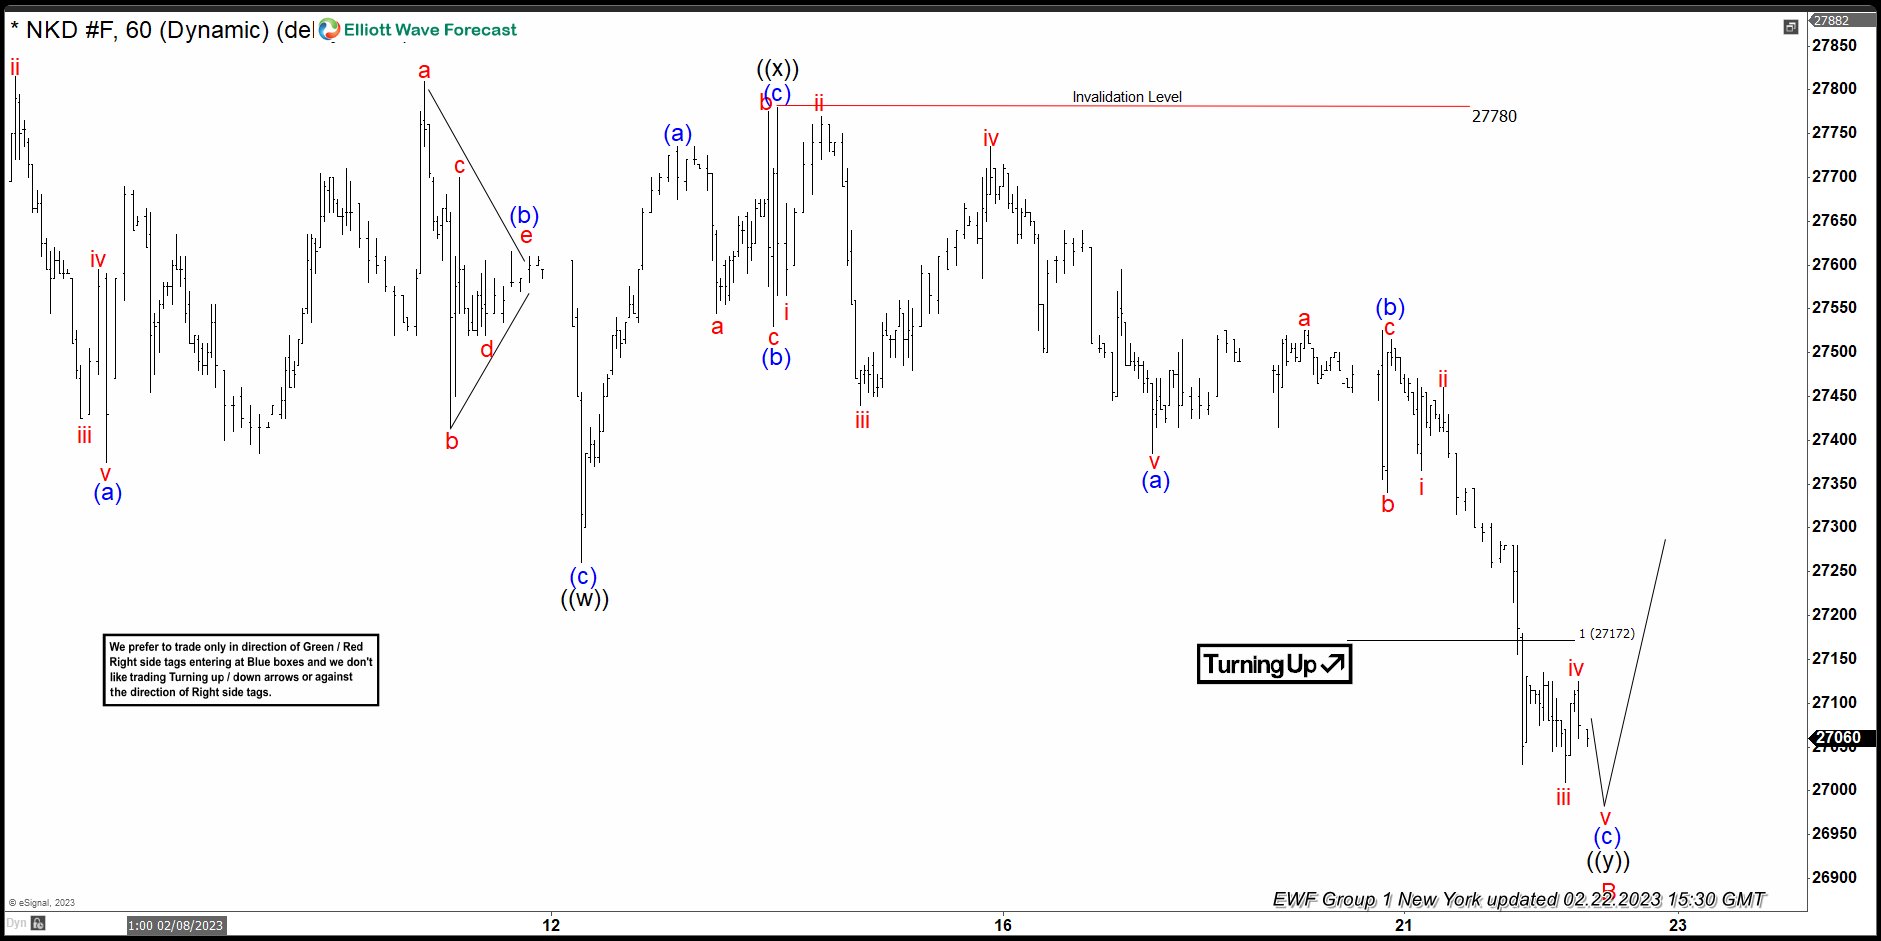
As we can see at that time we were within equal legs area of 27172 – 26790 area in which we were expecting a minimum of 3 waves bounce higher at least. Traders have a defined entry level with a defined Stop Loss at this point. As it is highly important to have a proper risk management system that allows you to enter and exit the market at all times. Next let’s have a look at the aftermath after the update. We will check the latest Asia update from 02.28.2023.
NIKKEI 1 Hour Asia Update 02.28.2023
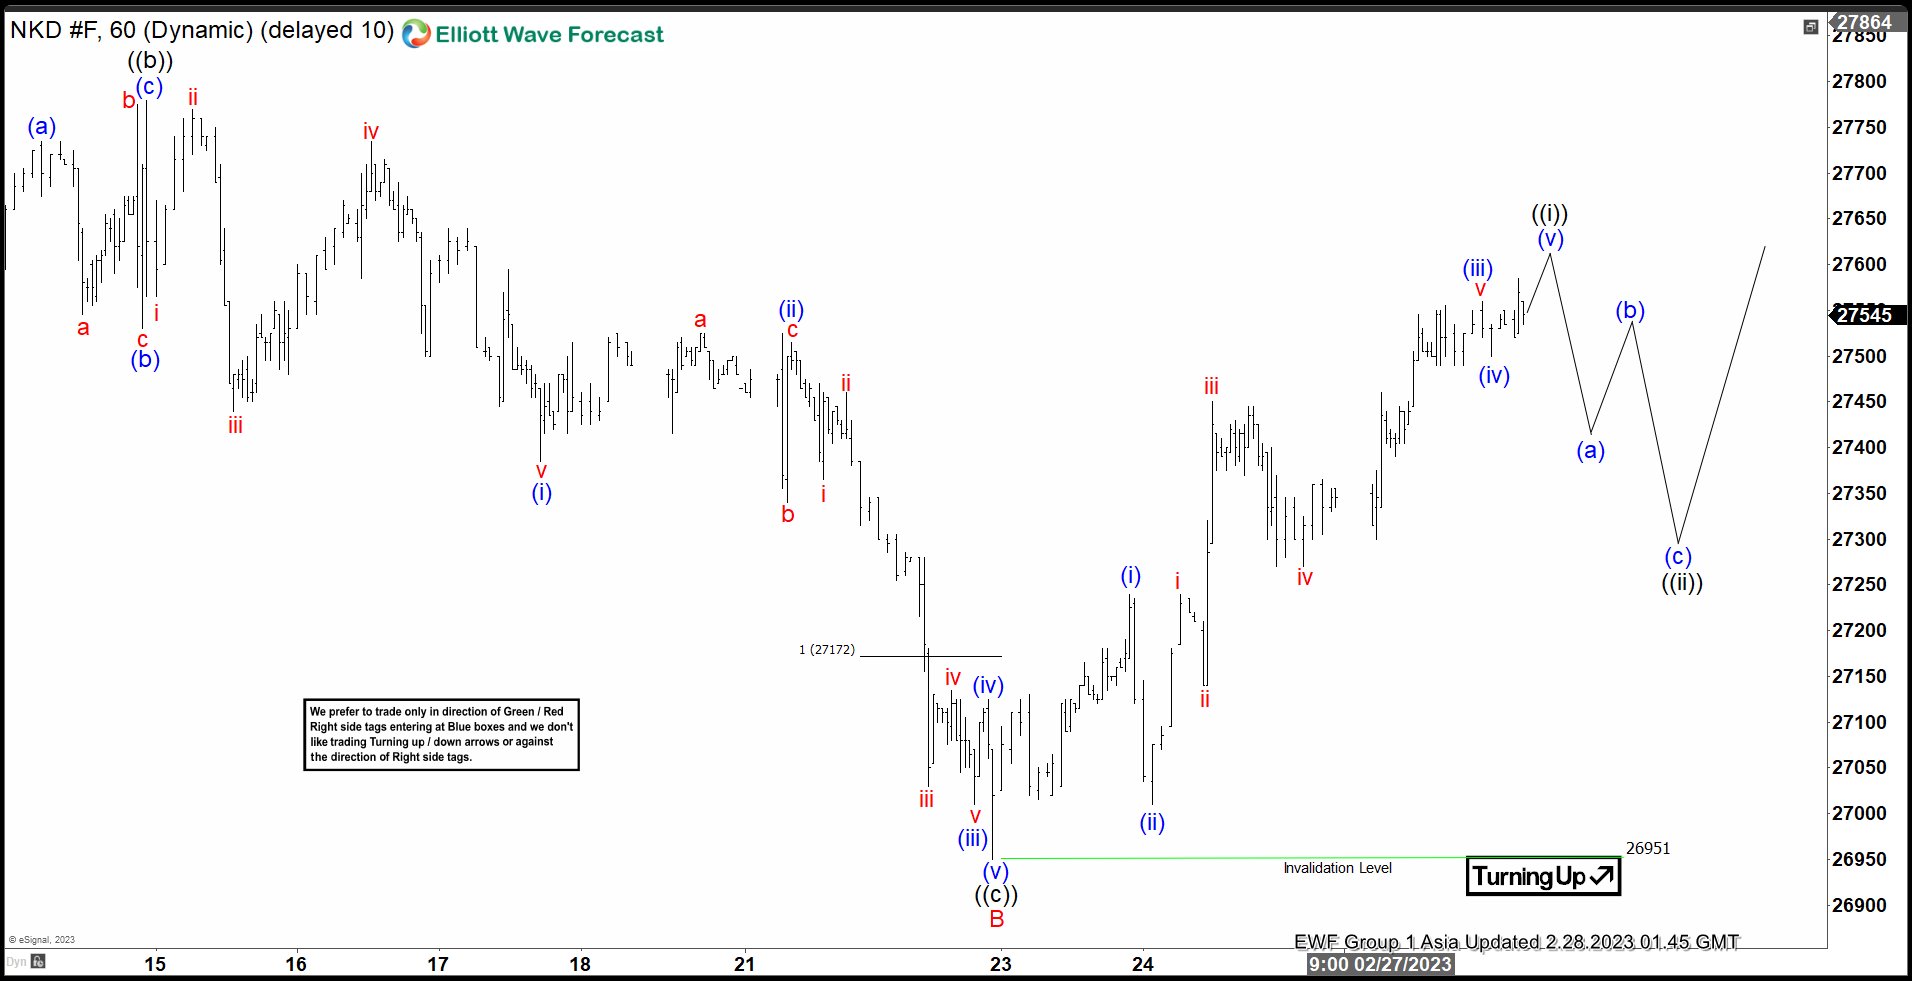
It has reacted as we were expecting within it’ possible first leg up within wave ((i)). We can subdivide it into 5 waves in blue with internal waves in red as presented in the chart. What we can expect next from the instrument is to provide us with a 3 waves pullback within wave ((ii)) before finding more support to continue higher in wave ((iii)). NIKKEI belong to our Group 1 instruments amongst other Indices such as the SPX, FTSE, DOW JONES.
Crypto Market Bides Its Time
Market Picture
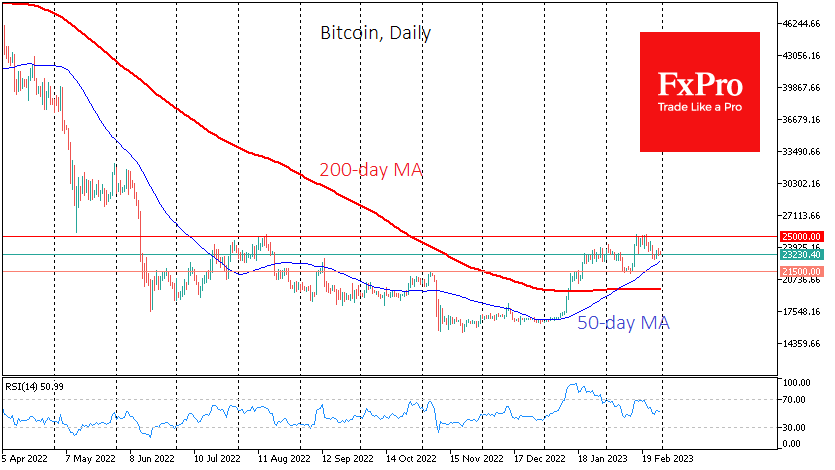
Over the past 24 hours, Bitcoin has fallen 0.25% to $23.4K. The total capitalisation of the crypto market has fallen 0.3% to $1.07 trillion. The slight decline came despite a rebound in global stock indices. The crypto market has seen minimal changes since the start of the day, indicating a wait-and-see attitude.
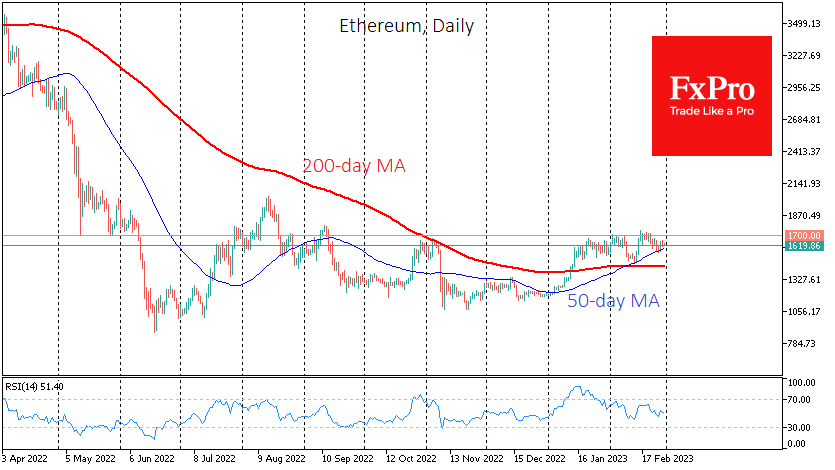
The short-term technical picture is bullish for Bitcoin, with the price above its 50-day average and near late January’s local highs. Ethereum’s uptrending 50-day twice acted as support in February. Resistance since last October remains at the 1700 level. ETHUSD is selling off from here.
According to CoinShares, investments in cryptocurrencies decreased by $2 mln last week, the third consecutive week of declines. Investments in bitcoin fell by $12 mln and Ethereum by $0.2 mln. Investments in funds that allow shorts on bitcoin increased by $10 mln.
Over the past few weeks, Santiment has seen a slowdown in bitcoin whales’ activity. There has also been a decrease in activity among mid-sized addresses controlling between 10 and 100 BTC.
News background
Michaël van de Poppe, Eight platform founder, remains bullish, saying the bear phase is over, and Bitcoin is about to break out.
According to IntoTheBlock, 39% of Ethereum’s total supply is concentrated on the balance sheets of a limited number of addresses. This starkly contrasts Bitcoin, where whales account for no more than 11% of the total.
The ongoing cryptocurrency crisis and tighter regulation have had no impact on interest in digital assets. According to Morning Consult, 20% of US adults (over 50 million people) own cryptocurrencies.
Dollar Index: Dollar Remains Overall Bullish on Hawkish Fed
The US dollar regained traction in early Tuesday’s trading, following a pullback on Monday, which signaled a partial profit taking after 0.8% rally last Friday.
The US currency keeps firm tone against the basket of its major peers, boosted by expectations that the US Federal Reserve would continue to raise interest rates more than initially expected, which resulted in dollar’s strong rally in past four weeks.
Recent solid economic data from the US signal that the economy is resilient and fuels Fed’s hawkish stance, with revised expectations that Fed funds rate would peak just above 5.4% in the third quarter.
The US policymakers see the inflation still high, despite the price pressures eased in past few months and their primary task is to put it under control and push towards the central bank’s 2% target.
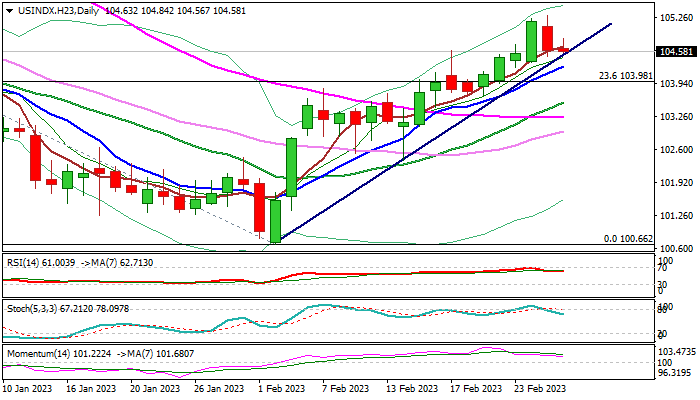
Technical studies on daily chart are predominantly bullish, with the price action continuing to hold above initial support – bull-trendline drawn off 100.66 (2023 low, posted on Feb 2) and focusing pivotal barriers at 105.40/53 (Jan 6 high / top of rising weekly cloud), violation of which would open way towards next targets at 106.03/33 (Fibo 38.2% retracement of 114.72/100.66 bear-leg/daily cloud top/200DMA).
Formation of reversal pattern on monthly chart as the dollar index is on track for the first monthly gain (around 2.7%) after a steep fall in past four months, adds to bullish signals, although reversal pattern requires confirmation on break above key barrier at 106.03 (Fibo 38.2% of 114.72/100.66, reinforced by 10MMA).
On the other hand, weekly studies show overbought stochastic and 14-period momentum still in the negative territory, warning that larger bulls may hold in prolonged consolidation before extending higher. The action should find solid supports at 104.37/20 zone (rising daily Tenkan-sen / Fibo 23.6% of 100.66/105.30) to keep larger bulls intact, while loss of these supports would put bulls on hold for deeper correction.
Res: 104.84; 105.40; 105.53; 106.03.
Sup: 104.37; 103.98; 103.54; 102.98.