Sample Category Title
Gold Tests Cloud Bottom as It Slumps to 2-Month Low
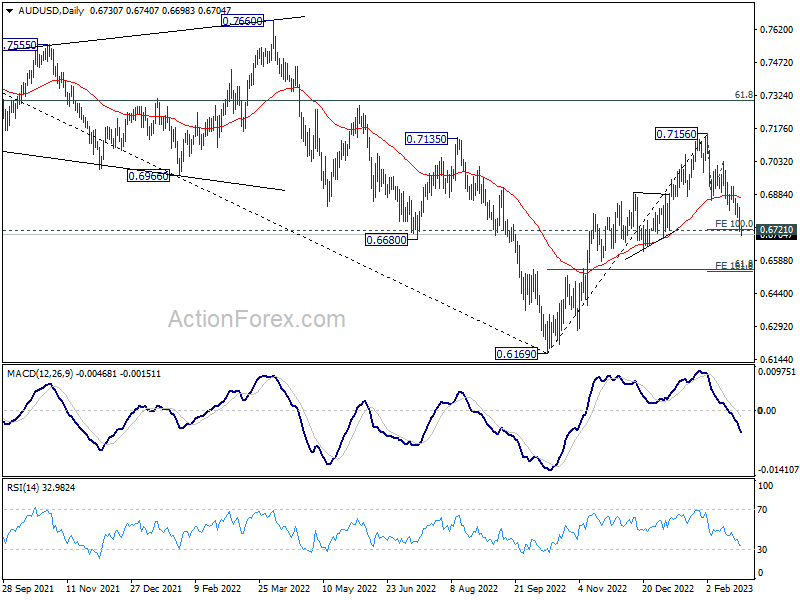
Gold is extending its decline on Monday, brushing a two-month low of 1,806.45 and testing the bottom of the Ichimoku cloud. The momentum indicators point to further losses in the near term. The RSI has just reached the 30 oversold level, while the %K and %D lines of the stochastic oscillator have both slipped into their respective oversold zone.
This could be an indication that the selloff has gone too far and a near-term upside correction is on the cards, though, the RSI still has some further downside scope and there is yet to be a bullish cross within the stochastics to confirm a reversal.
But should the cloud bottom in the 1,800 area hold as support, the price could turn upwards and head for the 38.2% Fibonacci retracement level of the September 2022-February 2023 uptrend at 1,827.90. A break higher would turn attention to the 50-day simple moving average (SMA) near 1,865, while not too far north is the 23.6% Fibonacci of 1,878.26, which overlaps with the cloud top.
Should the bulls manage to crack above the cloud top, they could then aim for the ascending trendline. Crossing above it would help restore the longer-term bullish structure.
However, if the price breaches the cloud bottom, this would likely increase the downside pressure, setting up a major battle zone for the bears between the 50% Fibonacci of 1,787.19 and the 200-day SMA at 1,776.
A drop lower would bring into view the next big test at the 61.8% Fibonacci of 1,746.48.
In brief, the bulls still stand a chance of restoring the uptrend if they’re able to bounce off the cloud bottom and rally back up towards the ascending trendline. But if gold suffers further losses and falls towards its 200-day SMA, the bullish longer-term outlook, which at the moment is on the verge of becoming neural, would be at further risk and could even turn negative.
Money Markets Raised Fed Terminal Rate to 5.4%
Markets
Core bonds tumbled on Friday. US yields soared 4.5 to 12.7 bps with the front end underperforming. The 2y yield (+11.7 bps) took out the November cycle high (4.799%) to close the week at a new one (4.81%). The 10y variant (3.942%) tested recent highs in an attempt to take out the 3.947% resistance level (61.8% recovery on the Oct ’22-Jan ’23 correction). German rates’ advance was similar: 4.9 bps to 11.7 bps across the curve with the 2y tenor surpassing the 3% barrier for the first time since 2008 and the 10y (2.537 close) flirting with the previous cycle high at 2.57%. Bonds came under pressure soon in the European session, pressured by ECB’s Nagel hawkish comments on the sidelines of the G20 summit. Much stronger-than-expected US PCE deflators, spending and housing data accelerated the downfall. Bullard reiterated the case for moving quickly to shield the Fed’s credibility in a panel interview later on. Money markets meanwhile raised the terminal rate to 5.4%. Their base case is 3x25 bps but odds for a 50 bps March rate hike are slowly increasing. The sell-off in core bonds spilled over into equity markets. European stocks dropped almost 2% (EuroStoxx50, losing the ST upward sloping trend channel and 4197 support) while Wall Street fell between 1.02-1.69%. The dollar gained. DXY rose from 104.59 to 105.21. EUR/USD fell deeper sub 1.06 to 1.0548, eying support at 1.0479/84. USD/JPY tackled resistance from recent highs around 135 to close at 136.48. EUR/GBP quickly aborted a test of 0.88 as sentiment deteriorated. Yet damage remained limited thanks to surging yields in the UK too, settling eventually at around 0.883. The pound tried another comeback in early Asian dealings this morning. It’s probably inspired on rumours that UK PM Sunak will announce a post-Brexit settlement for Northern Ireland Monday afternoon, three years after the withdrawal agreement was made. The moody sentiment is capping sterling’s potential though. Other currencies including the dollar and the yen are better bid. In his second confirmation hearing before parliament today, BoJ-governor nominee Ueda stuck to the balanced approach followed on Friday. Japan’s 10y yield meanwhile continues to trade above the 0.5% cap. US/German core bonds trade with a slight easing bias, keeping yields close to the technical resistance levels mentioned above. The US dollar continues on Friday’s path too as European stock futures pared marginal gains going into the European open. Today’s economic calendar contains US durable goods orders and the EC’s economic confidence for the euro area. That may not be enough to force technical breaks in yields and the dollar (yet) with more important data due later this week (US ISM’s, European CPI).
News and views
New Zealand volume-based retail sales fell by 4% in Q4 2022 compared with Q4 2021. Decreased volumes of retail sales were seen in the hardware, building, and garden supplies industry, down 15%, and in the motor vehicles and parts industry, down 10%. COVID-19 restrictions have influenced changes in sales patterns in many retail industries over the last few years. Building supplies and vehicle sales fell, but are reflective of a decline in peak sales during lockdowns (Q4 2021). On the other hand, sales volumes grew in the hospitality sector, with food and beverage services up 14%, while accommodation services were up 28% (lifting of border restrictions). Adjusted for inflation, retail sales fell by 0.6% Q/Q (vs +0.2% expected) following an upwardly revised 0.6% Q/Q growth in Q3. In other local news, Reserve Bank of New Zealand chief economist Conway delivered a rather hawkish speech, warning that higher interest rates are still needed to cool the economy (cash rate 5.5% from the middle of the year; suggesting 3 consecutive 25 bps rate hikes from now). The kiwi dollar is unable to fight a strong greenback with NZD/USD losing the neckline of a double top formation at 0.62.
Poland’s largest oil company (PKN Orlen) has unexpectedly stopped receiving Russian oil via the Northern Druzhba pipeline. Russian oil accounts for about 10% of Polish supplies after the country for a large part switched to alternatives last year. It’s the country’s aim to redirect these final flows as well. Orlen said that consumers won’t be impacted by the halt. The Southern Druzhba pipeline, running through Ukraine, Hungary, Slovakia and the Czech Republic was operating normally.
Bye Bye Stock Rally
The week starts on a cautious note, as the Federal Reserve (Fed) rate hike expectations intensify the selloff in global stocks and bonds, while pushing the US dollar higher against most majors.
Friday’s US PCE data was bad. We knew, from the earlier releases that US inflation wouldn’t slow as much as expected, but Friday’s PCE data showed that not only inflation didn’t slow in January, but headline figure ticked higher to 5.4% from 5.3% printed a month earlier, and core inflation ticked higher to 4.7% from 4.6% printed a month earlier. The latter fueled the Fed hike expectations, because a slower-than-expected easing in inflation is one thing, but rebound in inflation is another thing. And the latter is much less cool for the Fed, and the Fed expectations. A rebound in inflation is the worst nightmare for the Fed.
And if the PCE drama was not enough, personal spending surged 1.8% in January, the strongest burst since March 2021, and the University of Michigan’s consumer sentiment index hit a 13-month high this month. It’s still much lower than the pre-pandemic levels, yes, but it also means that it has ways to recover.
In summary, the tight US jobs data, strong spending and improved sentiment may sound nice to you, but it sounds horrendous to the Fed. A new study that was presented at a conference in New York on Friday now suggests that the Fed should maybe hike rates all the way up to 6.5% to win its battle against inflation in the US.
As a result, the US 2-year yield is pushing above the 4.80% mark, the 10-year yield is flirting with the 4% mark. Activity on Fed funds futures now assesses just slightly less than 30% probability for a 50bp hike at the FOMC’s March meeting. This probability is up from below 10% at the start of this month.
The S&P500 slipped below the 50-DMA (3980) and tested the 200-DMA (3940) to the downside, and closed what was the worst trading week since the start of the year 2.7% down, and below the 4000 psychological mark. Nasdaq, on the other hand, pulled out the major 38.2% Fibonacci support on the latest rally, tested its own 200-DMA to the downside, and closed the week in the bearish consolidation zone and below the 12’000 psychological mark.
And all indicators point at a deeper selloff as long as the higher Fed discussions remain heated.
FX and commo
It becomes increasingly clear that we will see a pause in the USD downside correction. The US dollar index is now clearly headed higher.
In EURUSD, a further fall to and below 1.05 is just a matter of time, and the last support to the September to February rally stands near 1.0470, if cleared will send the pair into the medium term bearish consolidation zone, with prospect of further fall to 1.02-1.03 range.
And a softer euro will then make the energy imports more expensive for the Europeans yet again, and spur the European Central Bank (ECB) rate hike expectations.
Hawkish ECB bets will certainly not do much to tame the strong-USD-led inflation, but a more aggressive policy rate response from the ECB would be bad for European businesses, and weigh on European stocks.
Rising US yields and the stronger US dollar hint at further decline in gold prices, as well. Gold cleared a key Fibonacci support, the 38.2% retracement on the November to February rally, and starts this week in the bearish consolidation zone, with the next natural target for the bears standing at $1775, the 200-DMA.
Crude oil continues struggling. Oil bulls never really bought the Chinese reopening story, nor the sharp decline in Russian output. But they might well play the rising recession odds that come along with the tighter central bank policies around the world. As such, sellers are certainly waiting to sell US crude into the 50-DMA, a touch below the $78 per barrel.
Copper futures, on the other hand, sank below their 50-DMA for the first time since November in COMEX, as the higher rate prospects weigh on copper appetite, which is a good gauge of global growth.
Finally?
In Europe, Britain’s Rishi Sunak and EU’s Ursula von der Leyen will meet today to finalize the Northern Ireland drama, which could soften barriers in a country that is willing to remain half seated in Europe and half seated in the United Kingdom, while the UK and Europe part ways. There is however little chance today's annoucement, if any, solves the problem entirely. DUP is expected to oppose.
Mr. Sunak was expected to make an announcement last week. He didn’t. And even if it did, I am not sure it would change the course of sterling. The pound is now below 1.20 against the US dollar as a result of a broadly stronger greenback, and is about to slip below the 200-DMA. Further retreat to 1.1650/1.17 band is on the cards.
Inflation Fears Linger
Market movers today
Focus this week will turn to euro area Flash HICP inflation for February on Thursday. US ISM manufacturing and Chinese PMI for February will provide more information on the turn higher of the global PMI cycle. We look for a lift in both.
Today, we'll get euro area sentiment indicators from the EU Commission as well US durable goods orders and pending home sales.
In the Nordics we get retail sales in both Norway and Sweden today.
The 60 second overview
US inflation: While the strong leading indicators eased recession fears last week, inflation risks remain elevated. According to some of Fed's favourite gauges, US inflation took off again last month, upending optimism that the peak has been reached. The headline PCE deflator rose 0.6% m/m, with the annual rate picking up to 5.4% from a revised 5.3%. More worrying, the core gauge accelerated to 4.7% from a revised 4.6%. The sources of the pick-up - income and spending growth - remained healthy last month. Equities dropped, treasury yields jumped and the dollar strengthened after the PCE report. The two-year yield rose to 4.8%, the highest since 2007, and Fed swaps are fully pricing in rate hikes in March, May and June. Bets on the peak rate rose to about 5.4% by July.
War in Ukraine: Russia's war on Ukraine reached the one-year mark. China called for a cease-fire between Russia and Ukraine in a position paper on ending the war that offered some reprieve to Moscow, but was quickly dismissed by Kyiv's allies. In our view, talks about peace are highly premature as neither of the sides of the conflict has shown any willingness to compromise on their original military objectives (read more in Research Russia-Ukraine: One year since Russia's invasion - Europe faces three changes as it settles into new reality, 17 February).
Germany: The German economy shrank 0.4% q/q in Q4 22, double the decline of the previous estimate. Falls in capital investment and private consumption were primarily to blame. The German two-year yield climbed above 3% for the first time since 2008. Meanwhile, Bundesbank President Nagel warned that ECB may need to deliver significant rate hikes in the second quarter as well.
Equities: Equities down on Friday as another set of inflation data fuelled the overheating fear. On the surface it could have looked like a classic defensive rotation but looking closer at the S&P500 performance, materials and banks were the two best performing sectors. As the stronger than expected inflation data comes with improving macro outlook, we see only a slightly defensive rotation. Please also note this comes after three months of massive cyclical outperformance. In US last Friday, Dow -1.0%, S&P 500 -1.1%, Nasdaq -1.7% and Russell 2000 -0.9%. Asian markets are lower this morning while European and US futures are slightly higher.
FI: European rates continue its volatile trading sessions as markets assess the monetary policy tightening needed. On Friday, Bunds sold off by 7bp, in what can largely be considered normal 1d change, amid US core PCE inflation coming in slightly higher than anticipated. Intra euro area spreads saw minor changes to Germany. The policy peak in ECB is now priced for a 3.81% deposit rate peak, which is setting new highs as markets have added 22bp in the past two weeks. On Friday, the 2y Schatz rose above 3% for the first time since 2008. Focus this week is on the euro area inflation data and the ECB minutes. ECB will commence its end to full APP reinvestments as of 1 March.
FX: Last week, rising US Treasury yields - especially in the front-end of the curve - set the tone generally in markets on the back of a re-acceleration in inflation data. The tightening of financial conditions favoured the USD, which broadly appreciated and sent EUR/USD below 1.05. GBP also had a strong week with EUR/GBP testing the 0.88 mark (however, edged higher since). On the other hand, rising yields had a negative impact on JPY and CHF, and deteriorating risk sentiment led to AUD depreciation against the USD.
Credit: iTraxx Main traded slightly tighter on Friday and closed 4bp tighter than the week before at 77bp, while Xover widened 14bp during the week to close at 420bp. Friday saw a bit of issuance in the low-beta segment with UK drug maker AstraZeneca placing a EUR dual tranche. Overall, however, last week was not too busy with EUR corporate issuance totalling EUR9.4bn and financial issuance (excluding covereds) at EUR3.0bn.
Nordic macro
Norwegian retail sales fell 3.6% in December, largely as a result of Black Week bringing some Christmas trading forward to November. Card data from BankAxept suggests that spending was relatively healthy in January, so we expect retail sales to climb at least 2.0% m/m (s.a.), but the underlying trend would still be down.
In Sweden, the week starts off with some interesting household-related data with household lending and retail sales, both for January. Swedish household mortgage lending came to a virtual standstill in December looking at seasonally adjusted monthly changes. Although there has been some recovery in property prices in January we doubt that that has pushed lending higher again as turnover remains very low. The plunge in retail sales may have decelerated in January as suggested by Swedbank card transactions data. That said, the same data suggests volume drop accelerated again in February. Hence, there is no obvious reason to assume the worst is passed yet.
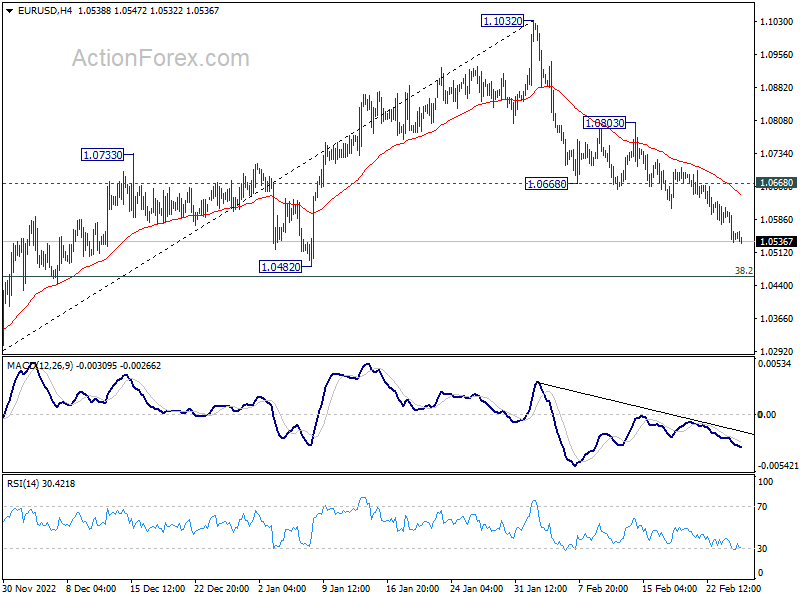
EUR/USD Daily Outlook
Daily Pivots: (S1) 1.0516; (P) 1.0566; (R1) 1.0595; More...
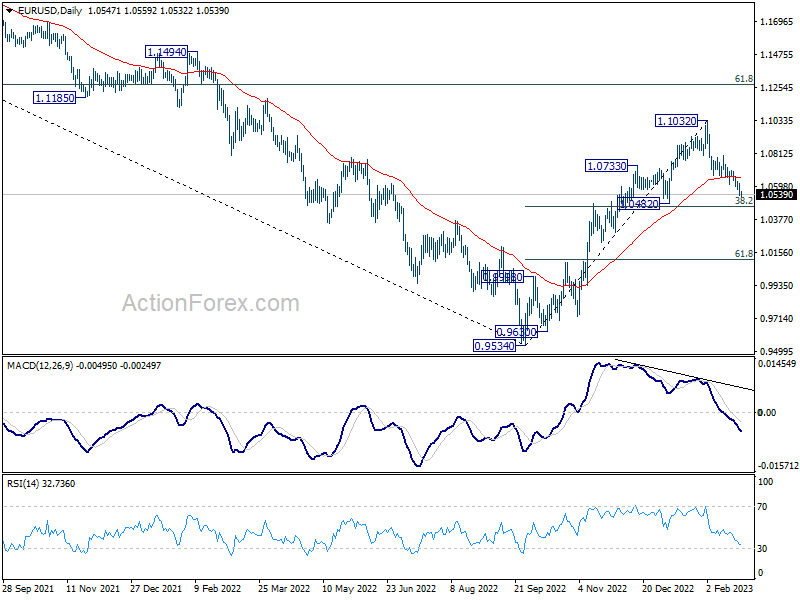
Intraday bias in EUR/USD remains on the downside at this point. Fall from 1.1032 is in progress for 38.2% retracement of 0.9534 to 1.1032 at 1.0463. Strong support could be seen around there to bring rebound, at least on first attempt. Break of 1.0668 support turned resistance will turn bias back to the upside for 1.0803 resistance and above. However, sustained break of 1.0463 will carry larger bearish implications.
In the bigger picture, as long as 1.0482 support holds, rise from 0.9534 (2022 low) should continue to 61.8% retracement of 1.2348 (2021 high) to 0.9534 at 1.1273. However, sustained break of 1.0482 will bring deeper fall to 61.8% retracement of 0.9534 to 1.1032 at 1.0106, even as a corrective pull back.
GBP/USD Daily Outlook
Daily Pivots: (S1) 1.1899; (P) 1.1971; (R1) 1.2012; More...
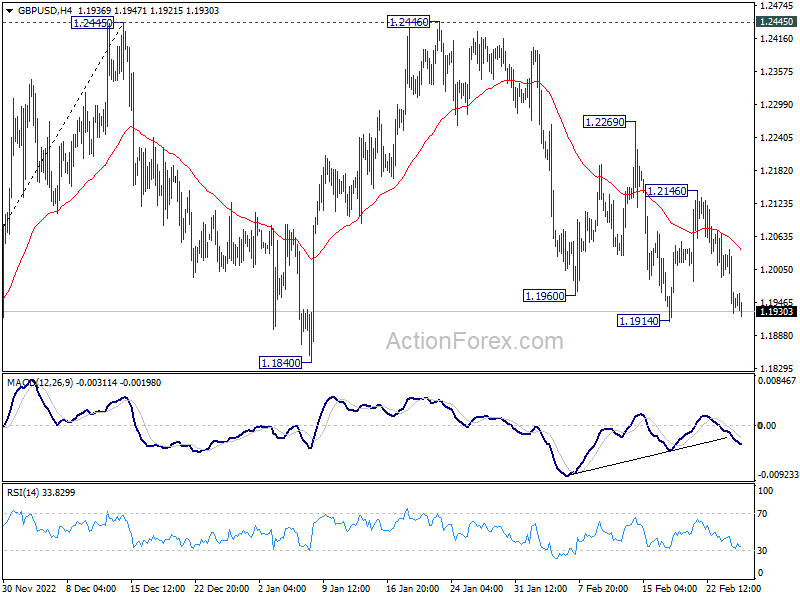
Intraday bias in GBP/USD is mildly on the downside with focus on 1.1914 support. Firm break there will resume the decline from 1.2446 for 1.1840 support and possibly below. On the upside, break of 1.2146 resistance will turn bias back to the upside for further rebound to 1.2269 and above.
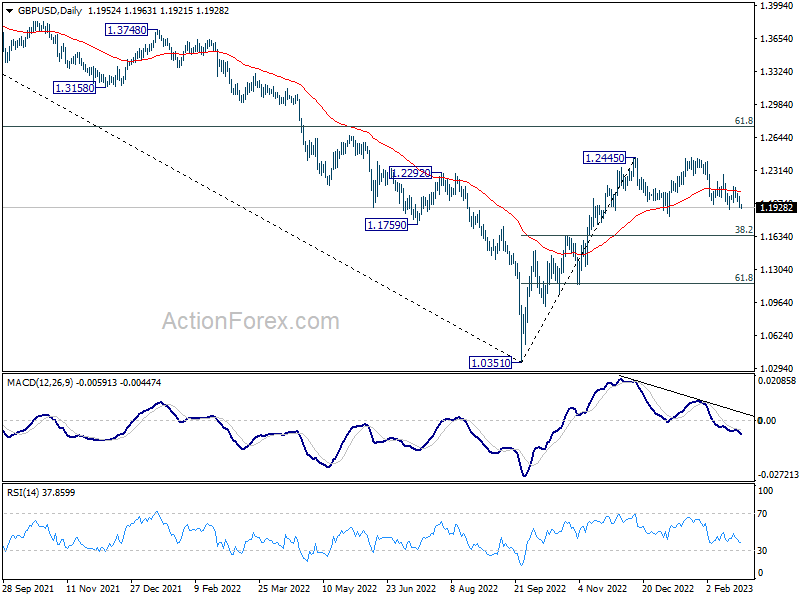
In the bigger picture,as long as 1.1840 support holds, rise from 1.0351 medium term bottom (2022 low) should still continue to 61.8% retracement of 1.4248 (2021 high) to 1.0351 at 1.2759. However, decisive break of 1.1840 will complete a double top pattern (1.2445, 1.2446) after rejection by 55 week EMA (now at 1.2251). Deeper decline should be seen back to 38.2% retracement of 1.0351 to 1.2445 at 1.1645.
USD/CHF Daily Outlook
Daily Pivots: (S1) 0.9354; (P) 0.9383; (R1) 0.9441; More...
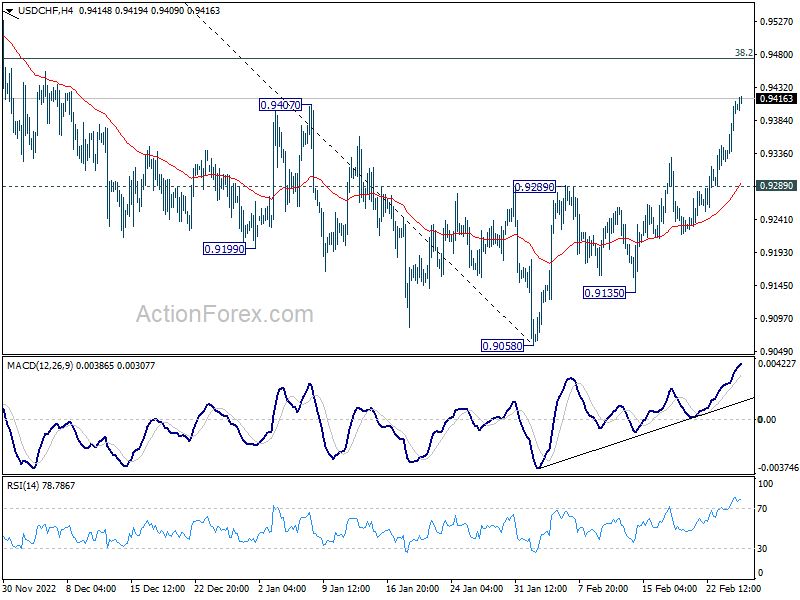
Intraday bias in USD/CHF remains on the upside for 38.2% retracement of 1.0146 to 0.9058 at 0.9474. Decisive break there will carry larger bullish implications and target 61.8% retracement at 0.9730. On the downside, break of 0.9289 resistance turned support is needed to indicate completion of the rebound. Otherwise, further rally will remain in favor in case of retreat.
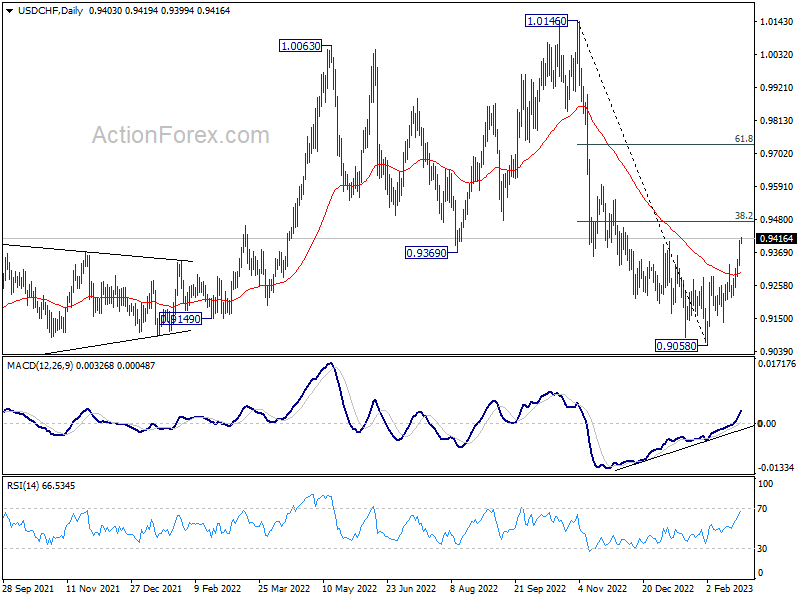
In the bigger picture, decline from 1.0146 is seen as part of a long term sideway pattern. As long as 38.2% retracement of 1.0146 to 0.9058 at 0.9474 holds, another fall is in favor through 0.9058. However, sustained trading above 0.9474 will indicate that the medium term trend has reversed, and open up further rally to 61.8% retracement at 0.9730 and above.
USD/JPY Daily Outlook
Daily Pivots: (S1) 134.87; (P) 135.69; (R1) 137.33; More...
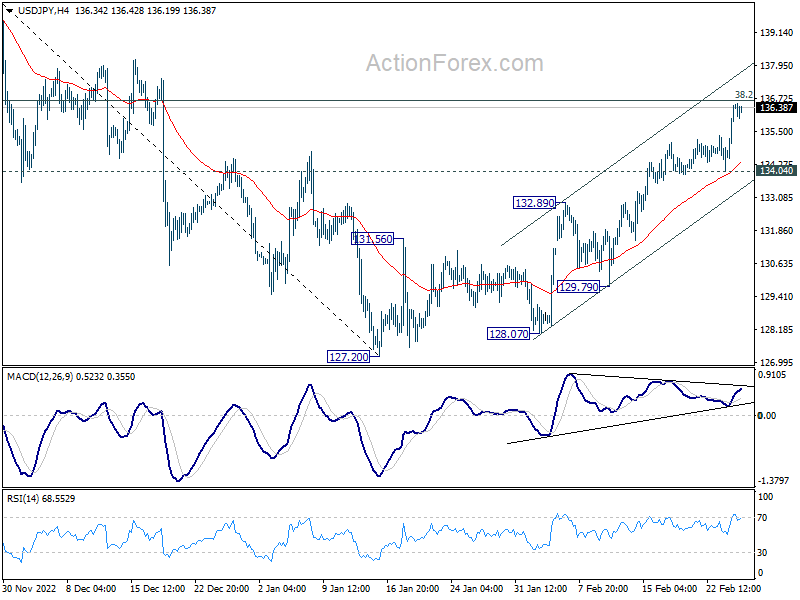
Intraday bias in USD/JPY remains on the upside as rise from 127.20 is in progress. Immediate focus is on 38.2% retracement of 151.93 to 127.20 at 136.64. Rejection by this fibonacci level, followed by break of 134.04 support, will argue that such rebound from 127.20 has completed, and turn bias back to the downside. However, sustained trading above 136.64 will indicate that fall from 151.93 has completed, and bring further rally to 61.8% retracement at 142.48.
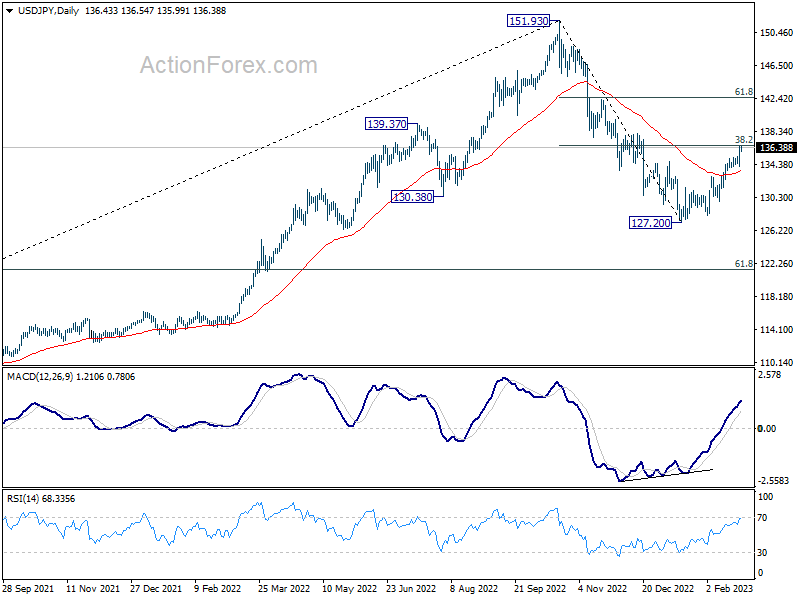
In the bigger picture, focus is now on 38.2% retracement of 151.93 to 127.20 at 136.64. Sustained break there will indicate that price actions from 151.93 medium term are merely a corrective pattern. Such development will maintain long term bullishness. Rejection by 136.64 will, on the downside, extend the fall from 151.93 to 61.8% retracement of 102.58 to 151.93 at 121.43 at a later stage.
USD/CAD Daily Outlook
Daily Pivots: (S1) 1.3534; (P) 1.3600; (R1) 1.3672; More....
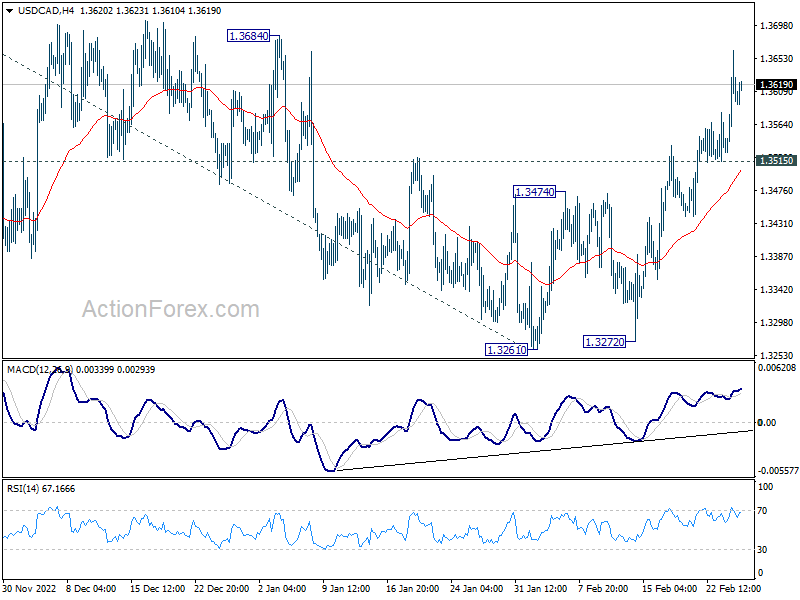
USD/CAD's rally from 1.3261 is in progress and intraday bias stays on the upside for 1.3684 resistance. As noted before, corrective pattern from 1.3976 should have completed at 1.3261. Firm break of 1.3684 will bring retest of 1.3976 high. In case of retreat, further rally will remain in favor as long as 1.3515 support holds.
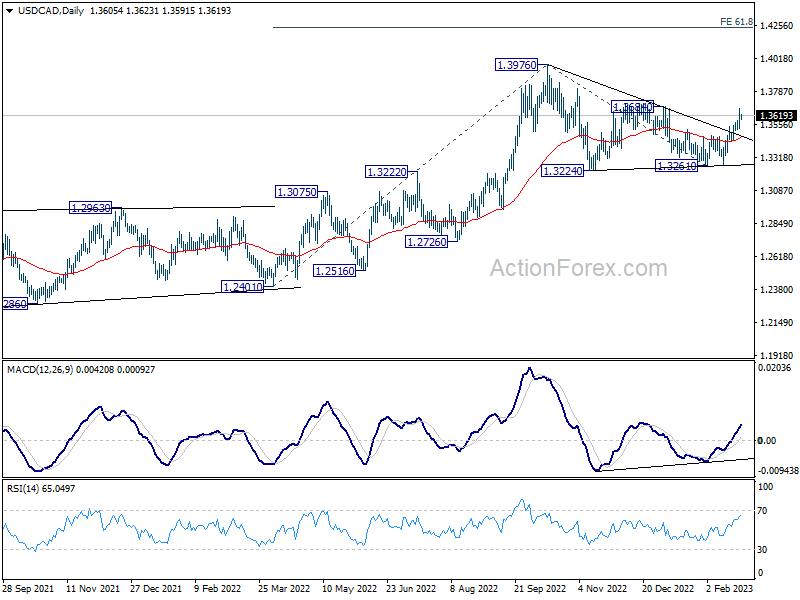
In the bigger picture, outlook stays bullish with 1.3222 cluster support (38.2% retracement of 1.2005 to 1.3976 at 1.3223) intact. Break of 1.3976 resistance will resume larger up trend from 1.2005 (2021 low) to 61.8% projection of 1.2401 to 1.3976 from 1.3261 at 1.4234.
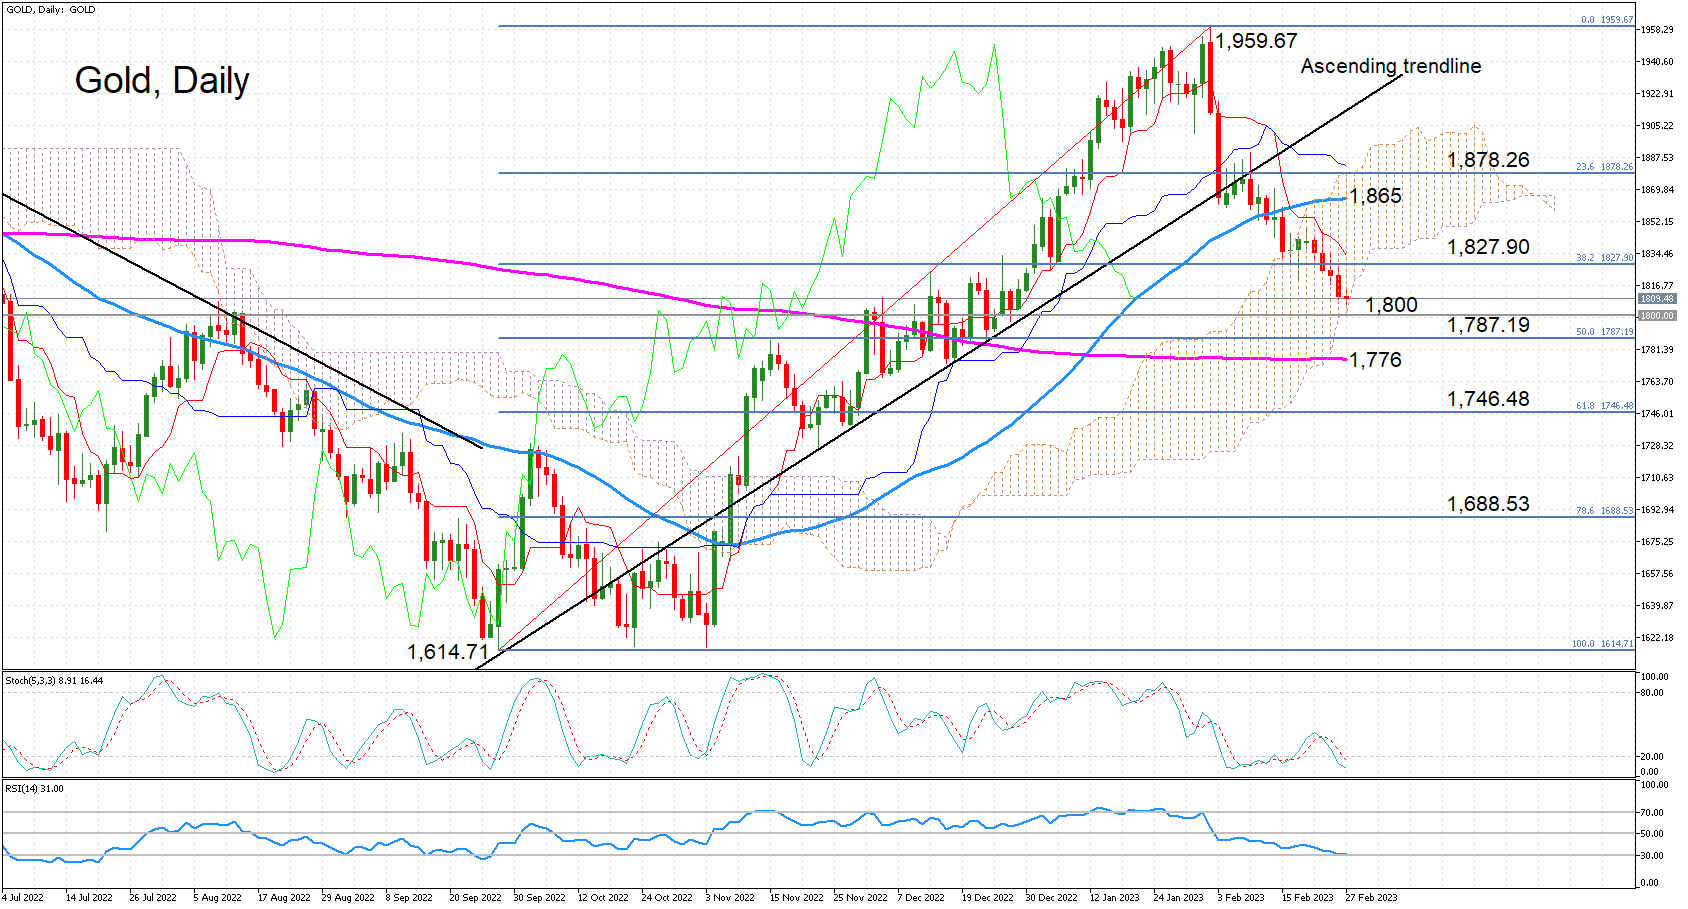
AUD/USD Daily Report
Daily Pivots: (S1) 0.6688; (P) 0.6756; (R1) 0.6793; More...
AUD/USD's fall from 0.7156 continues today and breaks 0.6721 support. Current development argues that near term trend could be reversing. Intraday bias stays on the downside. Deeper decline would be seen to 161.8% projection of of 0.6854 to 0.7028 from 0.6854 at 0.6539. On the upside, break of 0.6854 support turned resistance is needed to indicate completion of the fall, or risk will stay on the downside in case of recovery.
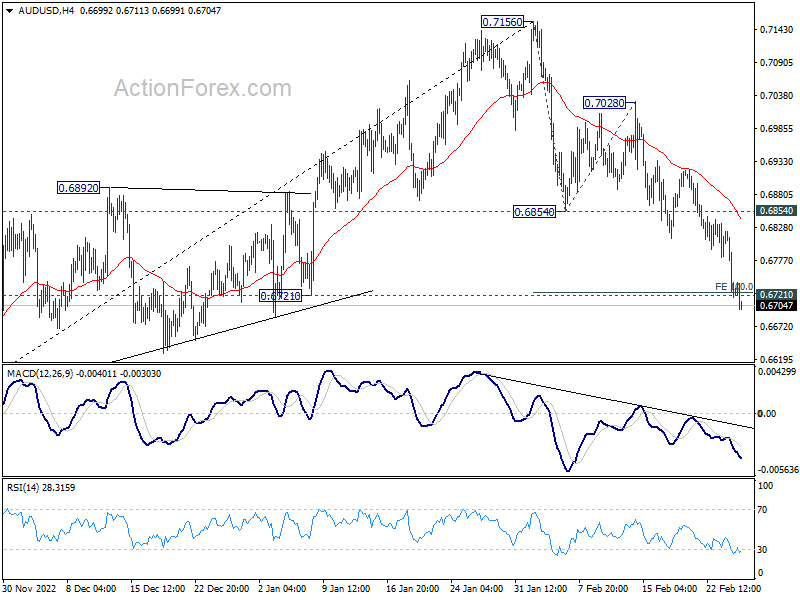
In the bigger picture, focus is now on 0.6721 structural support. Sustained break there will argue that whole rise from 0.6169 (2022 low) has completed at 0.7156, after rejection by 55 month EMA (now at 0.7179). Deeper decline would then be see back to 61.8% retracement of 0.6169 to 0.7156 at 0.6546, even as a corrective fall. Nevertheless, strong rebound from current level will retain medium term bullishness for another rise through 0.7156 later.