Sample Category Title
Dollar Jumped on Fed Bets, Next Few Weeks Crucial
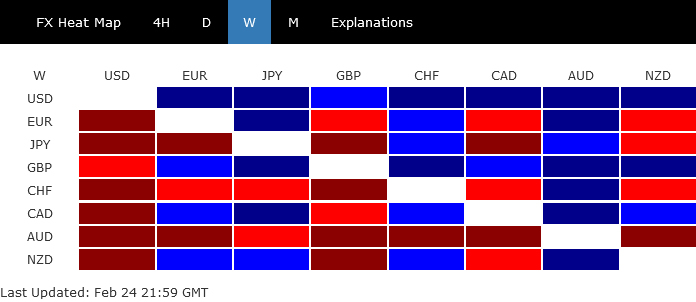
Dollar rose broadly last week and ended as the strongest one, as markets added bets on a higher Fed terminal rate after re-acceleration in inflation data. Sterling ended as second after strong services data, which also supported Euro, while Canadian was the third after higher than expected inflation reading. Aussie was the worst performer on deteriorating risk sentiment, followed by Yen and Swiss Franc on rising benchmark yields.
So far, the pull back in stock indexes was not disastrous. Rebound in the Dollar index could still be a corrective move. But first few weeks in March would be crucial. Technically, the next moves should decide the overall tone for the rest of the first half, for stocks, yields, and forex.
Strong data dashed Fed's disinflation hope
January data from the US released last week showed both headline and core PCE inflation reaccelerated, dashing hope of continuation of the disinflation process. While there were talks that Fed could revert to 50bps rate hike at next meeting, they're not much translated to market pricing yet. There are still a lot of important data between now and March 22, including ISMs next week, NFP the week after, and then CPI and retail sales two weeks from now. Traders might find it still a bit early to bet on Fed pushing the panic button.
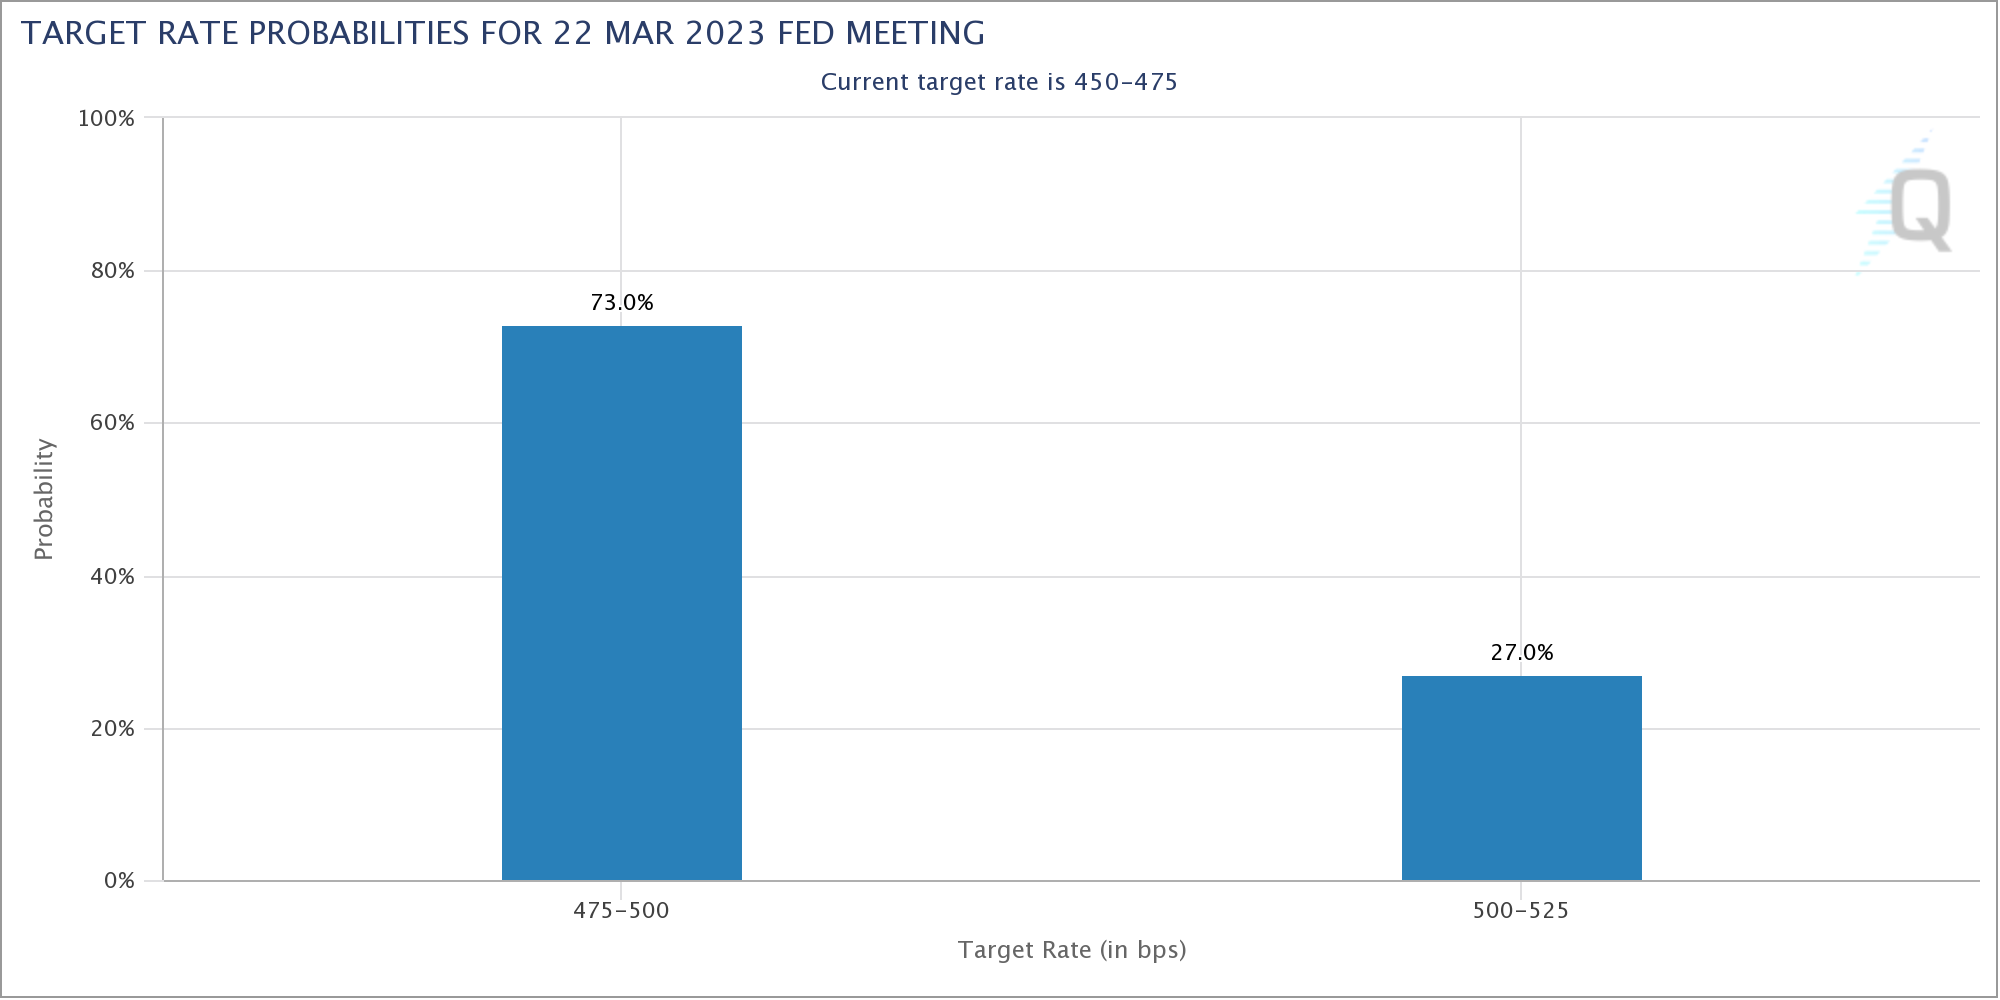
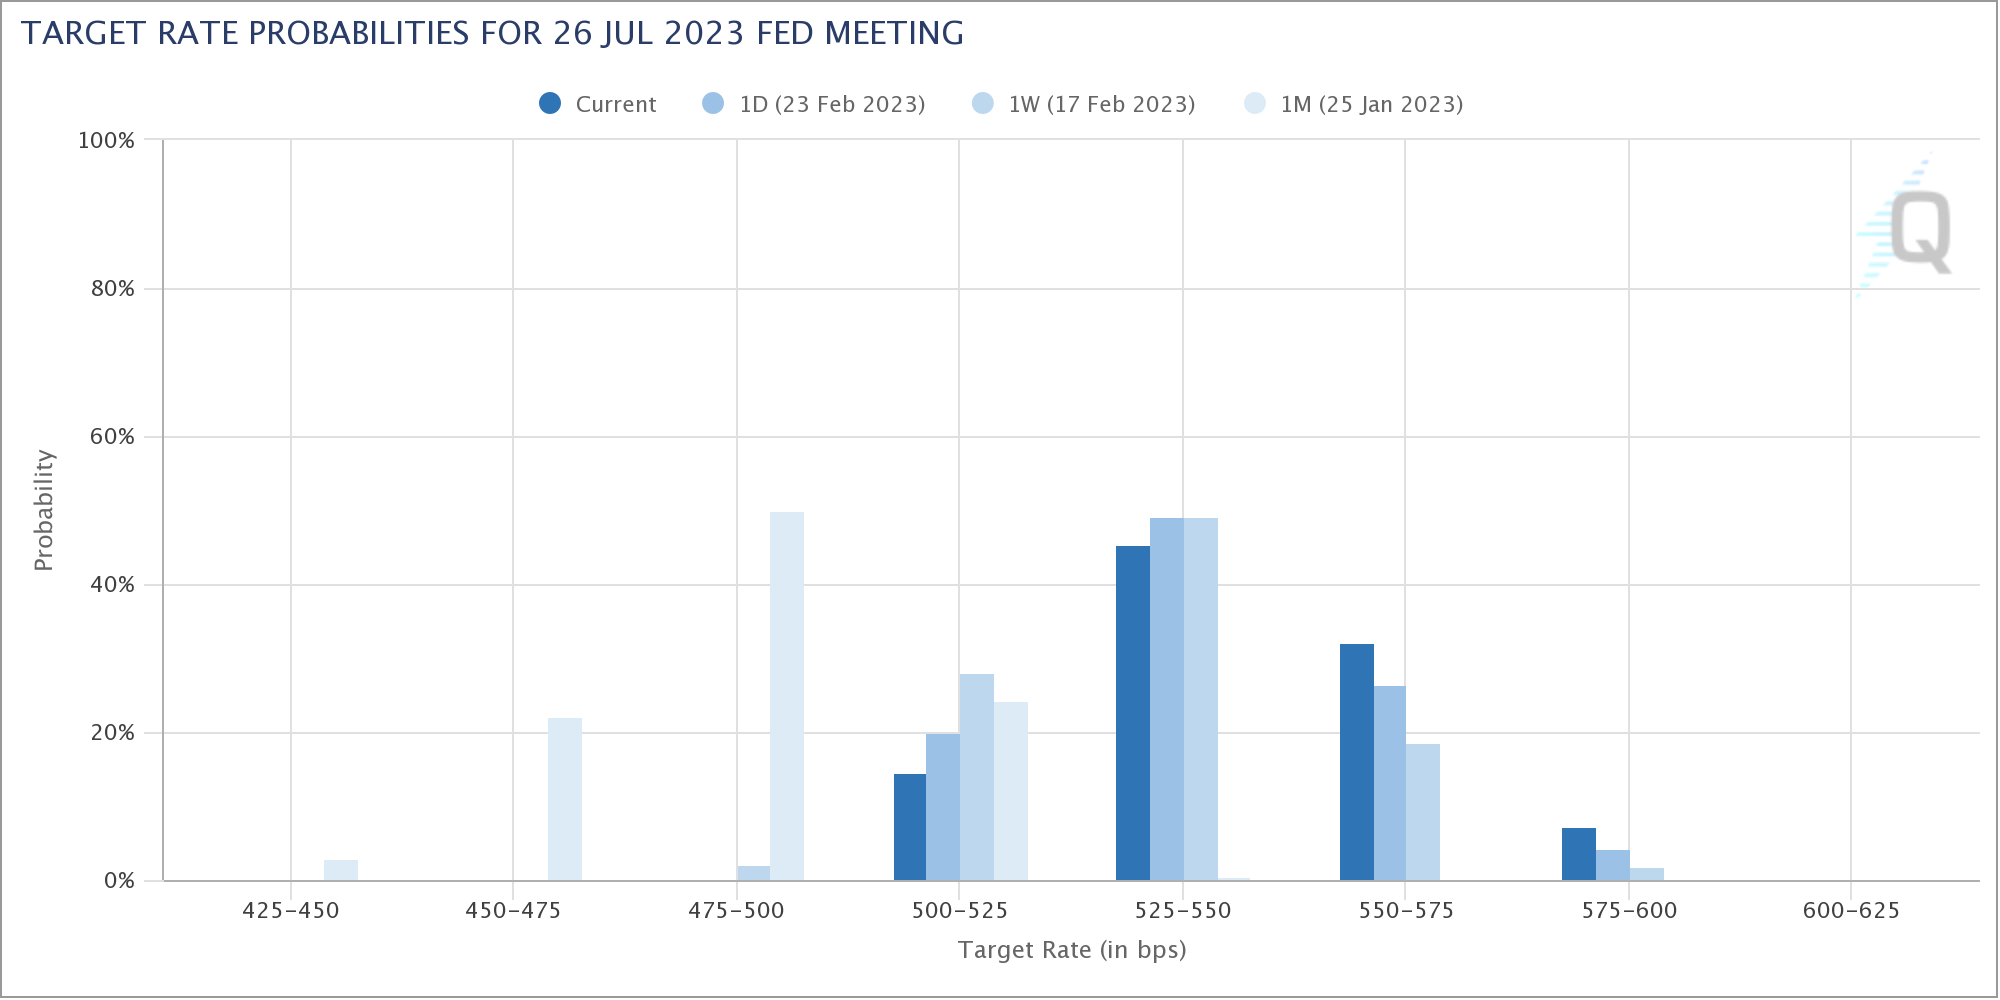
As indicated by Fed fund futures, there is still 73% chance of another 25bps hike in March to 4.75-5.00%, just 27% chance of a 50bps hike. What's more important is that markets are pricing in nearly 40% chance of one more hike in July to 5.50-5.75%, i.e. a higher terminal rate, comparing to just 20% a week ago and 0% a month ago. Pricing for July should be watched together with March in the coming weeks.
Meanwhile, economic data from some other countries were also supportive to more tightening. PMI data from Eurozone and the UK indicated that service sectors picked up much momentum in February, and are leading the economies out of recession risk.
As for ECB, a 50bps hike in March is a done deal and terminal rate would be reached in summer. Questions are whether rate will peak at the beginning or the end of summer, and what will happen in between. For now, an expectation of 3.75% peak of the main refinancing rate, i.e. one more 25bps hike after March, looks like an under-estimate. Meanwhile, BoE's tightening should continue in March, probably with a slower pace of 25bps to 4.25%. May's decision for BoE is uncertain.
While inflation in Canada slowed, the readings were stronger than expected. One month of data will certainly not pull BoC out of the pause. Also, February job data will only be released after March 8 BoC meeting. Yet, there is no guarantee that the next move after the pause, no matter how long, is a cut. Indeed, markets are pricing in the chance of one more hike this year, before a another pause and then a cut by the end of next year.
US stocks closed lower, but not disastrous (...yet?)
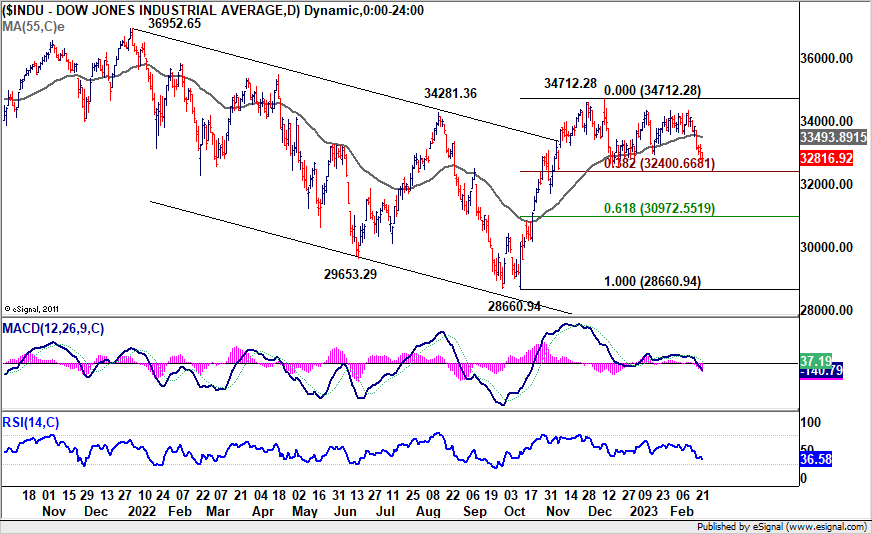
US stocks closed deeply lower last week but overall development was not disastrous yet. DOW is still holding in range for now and the price actions from 34712.28 could still be just a sideway consolidation pattern. As long as 38.2% retracement of 28600.94 to 34712.28 at 32400.66 holds, rise from 28660.94 should resume sooner rather than later. However, firm break of 32400.66 will at least bring deeper fall to 61.8% retracement at 30972.55, with risk of resuming whole down trend from 36952.65 high.
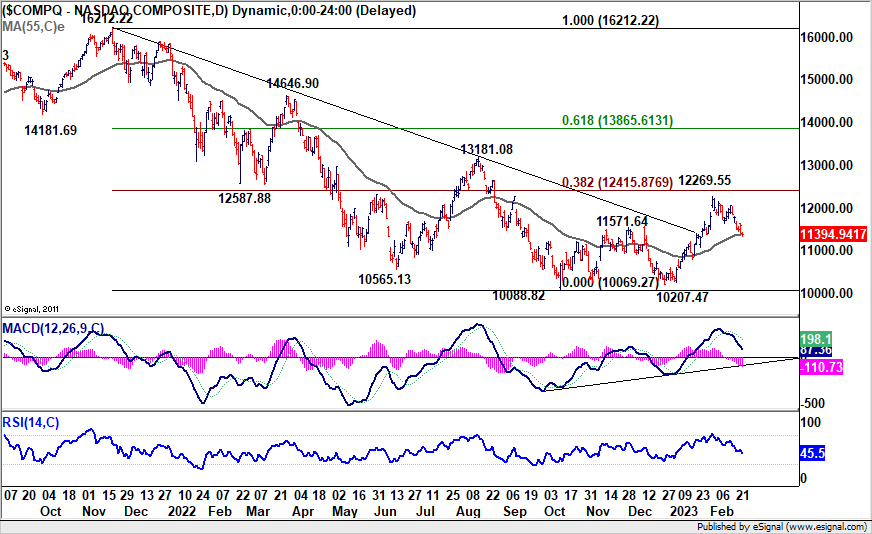
NASDAQ is currently trying to draw support from 55 day EMA (now at 11374.29). Rebound from current level will maintain near term bullishness, for at least one more take on 38.2% retracement of 16212.22 to 10207.47 at 12415.87. However, sustained break of 55 day EMA will raise the chance of resuming larger down trend from 16212.22.
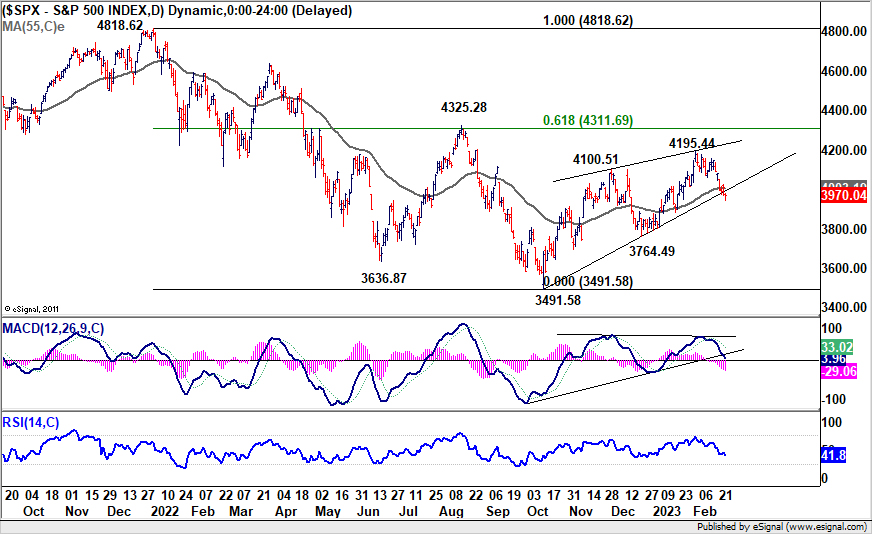
Development in S&P 500 is relatively more bearish, with break of 55 day EMA (now at 4003.19) and trendline support. Deeper decline towards 3764.49 will raise the chance that rebound from 3491.58 has completed with three waves up to 4195.44. Further break there could also set the stage for resuming the down trend from 4818.62 high. Let's see if SPX's dip was an overreaction (relative to DOW and NASDAQ), or an early warning.
10-year yield heading back to 4.333 high
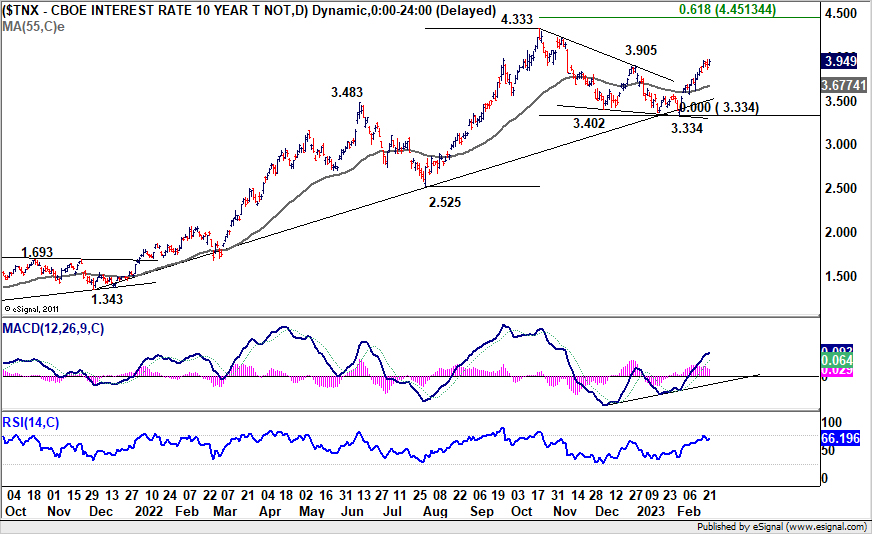
US 10-year yield finally broke through 3.905 near term resistance last week. The development affirmed that whole correction from 4.333 has completed with three waves down to 3.373. Further rise is now expected as long as 55 day EMA (now at 3.677) holds. Retest of 4.333 high would be seen next. A break there is not envisaged for now, but even in that case, strong resistance should be seen from 61.8% projection of 2.525 to 4.333 from 3.334 at 4.451 to limit upside.
Dollar index extended rebound, still seen as a corrective rise
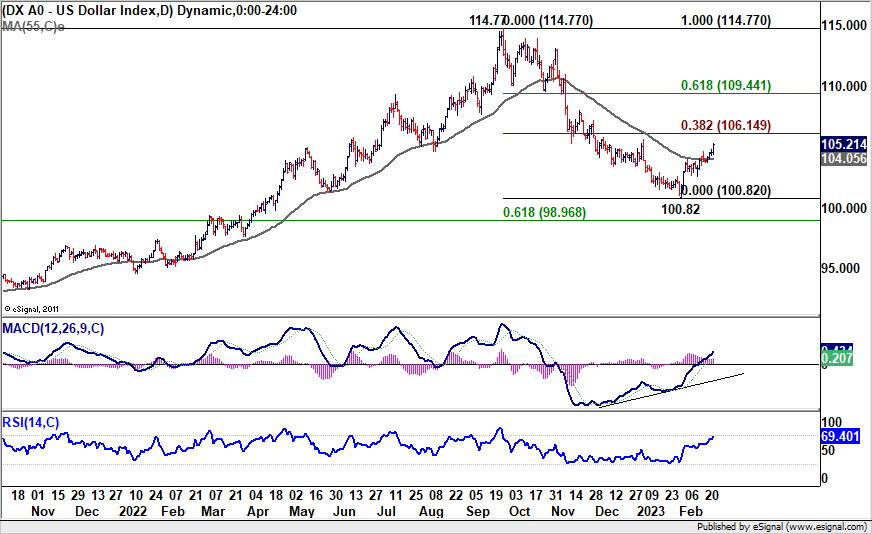
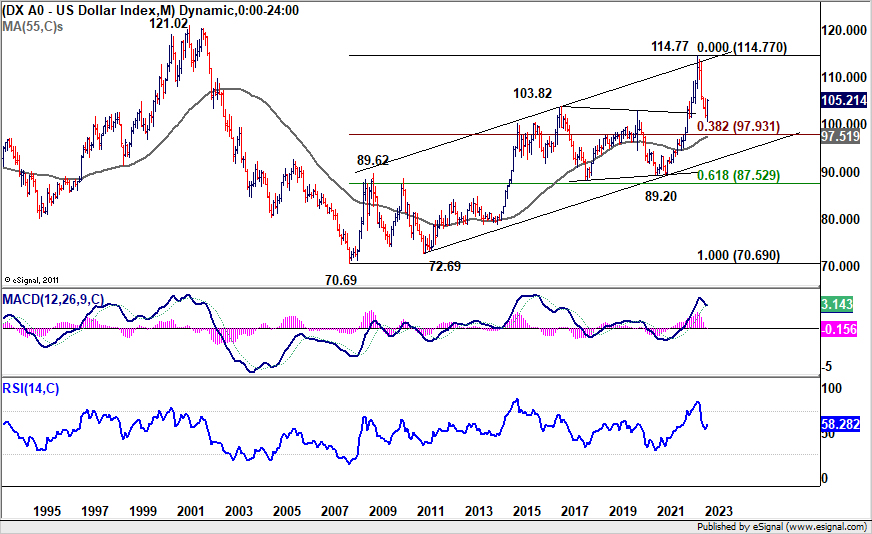
Dollar index's rebound from 100.82 continued last week as expected, but slight acceleration is a surprise. For now, such rise is still seen as a corrective move only. Strong resistance could be seen from 38.2% retracement of 114.77 to 100.82 at 106.14 to limit upside. Firm break of 55 day EMA (now at 104.05) will bring retest of 100.82 low.
However, decisive break of 106.14 will raise the chance of trend reversal, and bring stronger rally back to 61.8% retracement at 109.44 at least. If happens, that would most likely mean a turn in overall risk sentiment, with the bearish scenario in US stocks as mentioned above playing out. Also, that might be accompanied by strong break of 4.451 projection level in 10-year yield.
Gold extended decline, a hint on more Dollar upside?
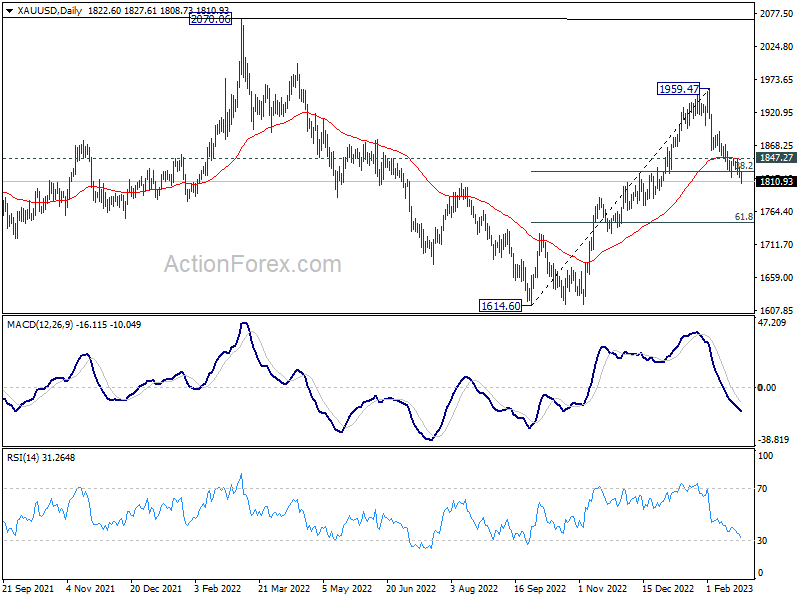
Gold's development would be used as a gauge on Dollar as usual. Decline from 1959.47 extended last week and the rejection by 55 day EMA is a sign of bearishness. Sustained trading below 38.2% retracement of 1614.50 to 1959.47 at 1827.72 will raise the chance of near term reversal and bring deeper fall to 61.8% retracement at 1746.34 and possibly below. Such bearish development could be accompanied by break firm break of 106.14 fibonacci support in Dollar Index mentioned above.
On the other hand, rebound from current level, followed by break of 1847.27 resistance, will revive near term bullishness and bring stronger rebound back towards 1959.47 high. That could be accompanied by Dollar Index's rejection by 106.14.
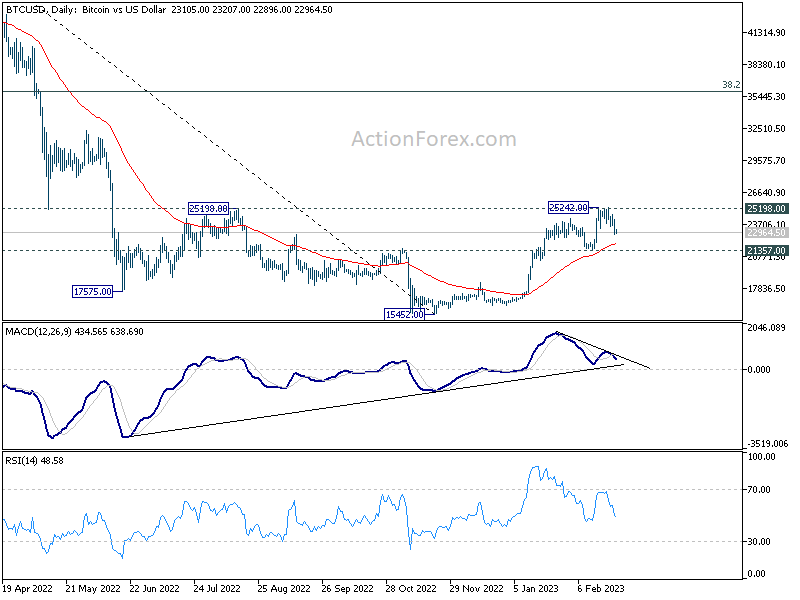
Bitcoin still struggling to break through 25198 resistance
Development in Bitcoin will also be used as a gauge to overall risk sentiment. For now, Bitcoin has yet to overcome 25198 resistance firmly. It had indeed retreated from there. But downside is support well above 21357 support so far. Thus, near term bullishness is maintained for breaking through 25198/242 soon.
However, firm break of 21357 would indicate the rebound from 15452 has completed and risk deeper fall back to retest this low. That, if happens, could be accompanied by deeper selloff in NASDAQ back towards 10088.82 low.
AUD/USD Weekly Report
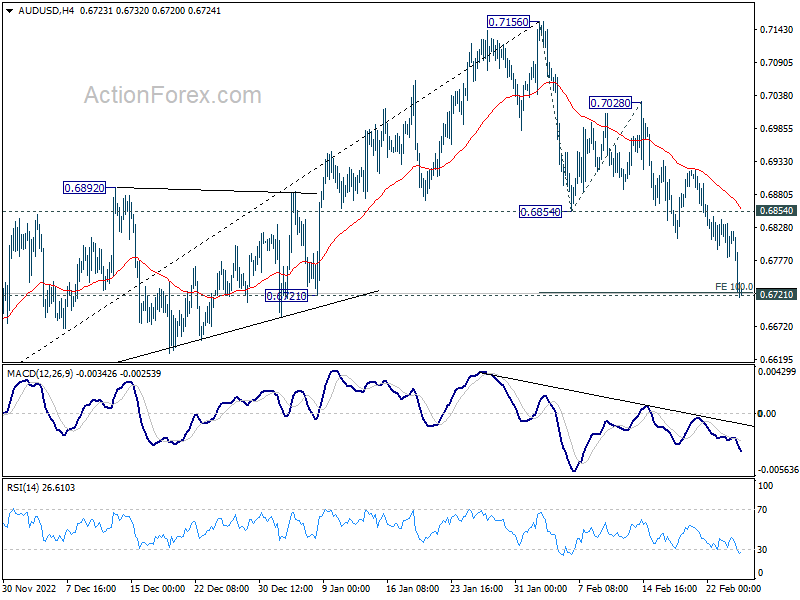
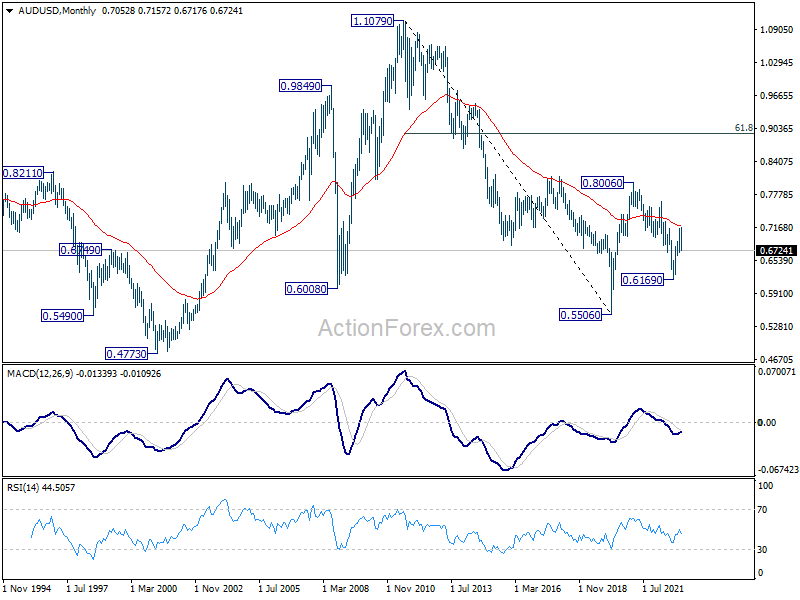
AUD/USD's decline from 0.7156 continued last week and accelerated to as low as 1.6716. There is no sign of bottoming yet. Immediate focus is on 0.6721 support this week. Decisive break there will carry larger bearish implication. Next target is 161.8% projection of of 0.6854 to 0.7028 from 0.6854 at 0.6539. On the upside, break of 0.6854 support turned resistance will argue that the pull back has completed, and turn bias back to the upside.
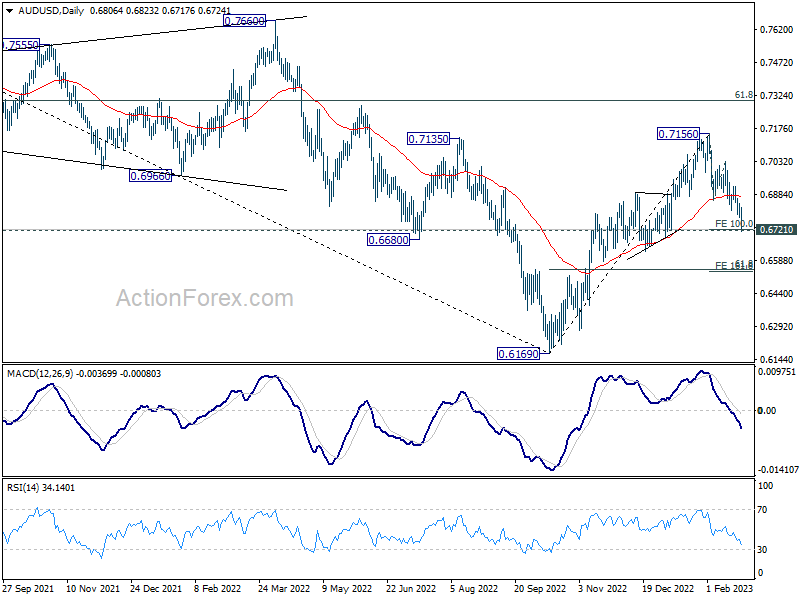
In the bigger picture, focus is now on 0.6721 structural support. Sustained break there will argue that whole rise from 0.6169 (2022 low) has completed at 0.7156, after rejection by 55 month EMA (now at 0.7179). Deeper decline would then be see back to 61.8% retracement of 0.6169 to 0.7156 at 0.6546, even as a corrective fall. Nevertheless, strong rebound from current level will retain medium term bullishness for another rise through 0.7156 later.
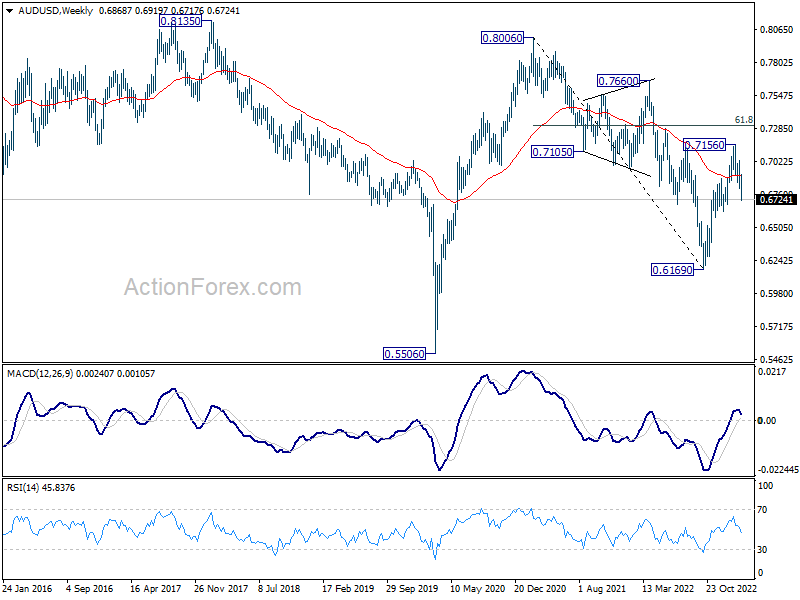
In the long term picture, initial rejection by 55 month EMA (now at 0.7179) retains long term bearishness. That is, down trend from 1.1079 (2011 high) could still resume through 0.5506 (2020 low) on resumption.
EUR/USD Weekly Outlook
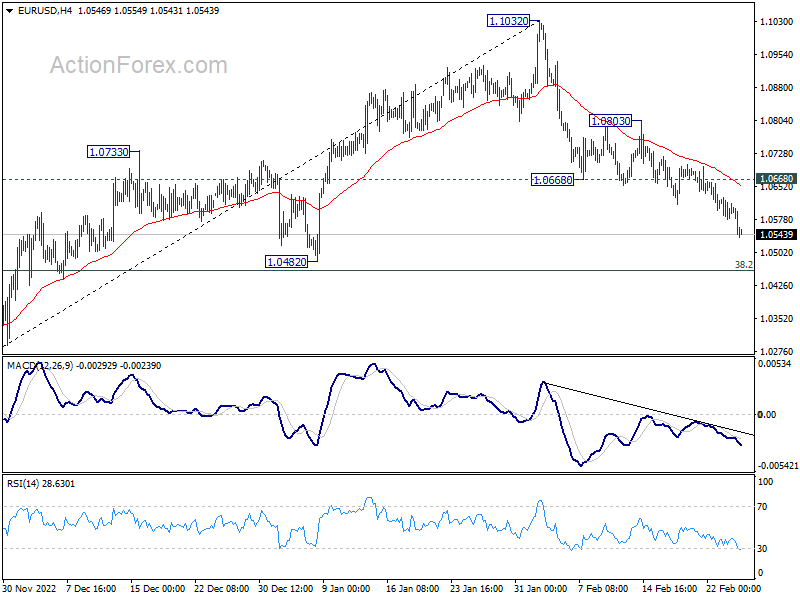
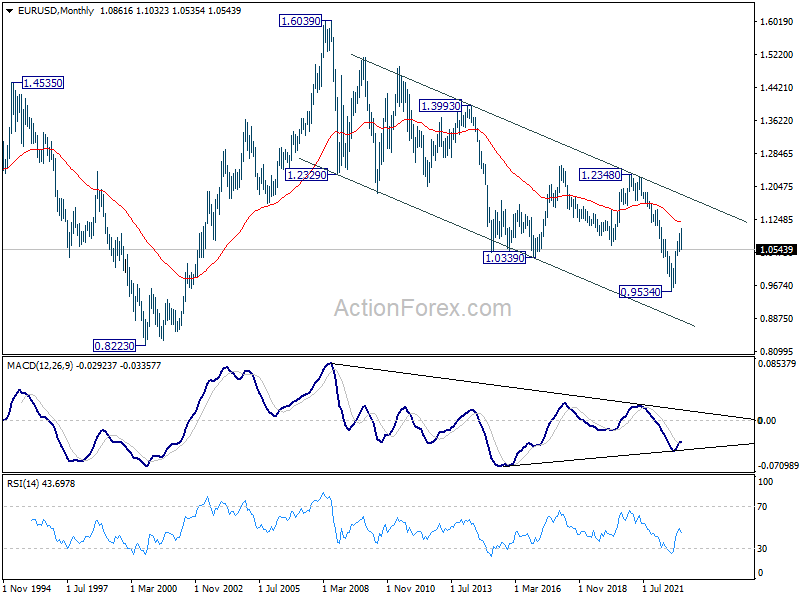
EUR/USD's decline from 1.1032 continued last week and hit as low as 1.0535. Initial bias stays on the downside this week for 38.2% retracement of 0.9534 to 1.1032 at 1.0463. Strong support could be seen around there to bring rebound, at least on first attempt. Break of 1.0668 support turned resistance will turn bias back to the upside for 1.0803 resistance and above. However, sustained break of 1.0463 will carry larger bearish implications.
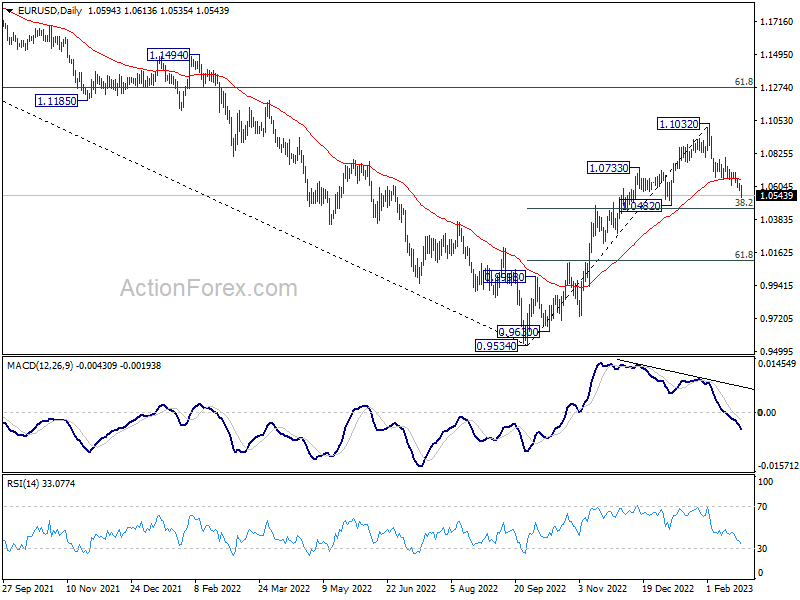
In the bigger picture, as long as 1.0482 support holds, rise from 0.9534 (2022 low) should continue to 61.8% retracement of 1.2348 (2021 high) to 0.9534 at 1.1273. However, sustained break of 1.0482 will bring deeper fall to 61.8% retracement of 0.9534 to 1.1032 at 1.0106, even as a corrective pull back.
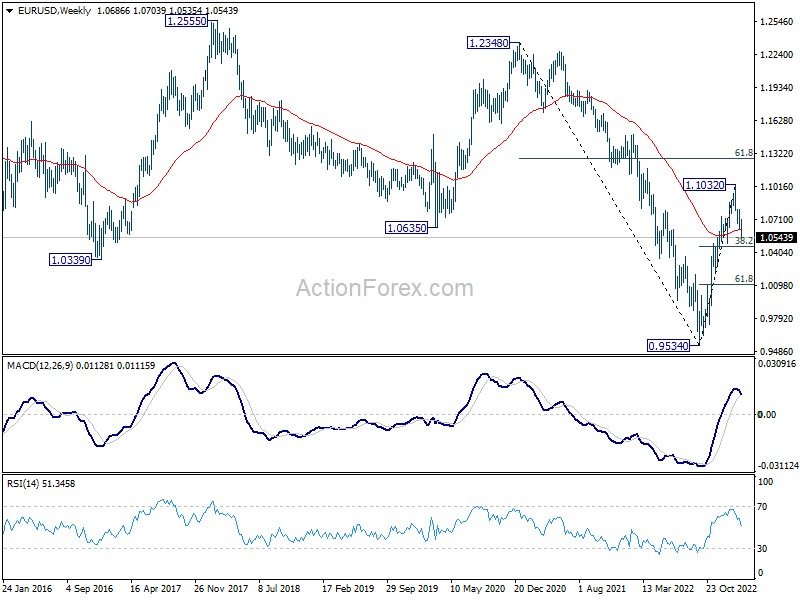
In the long term picture, while it's too early to call for long term trend reversal at this point, the strong break of 1.0635 support turned resistance (2020 low) should at least turn outlook neutral. Focus will turn to 55 month EMA (now at 1.1208). Rejection by this EMA will revive long term bearishness.
USD/JPY Weekly Outlook
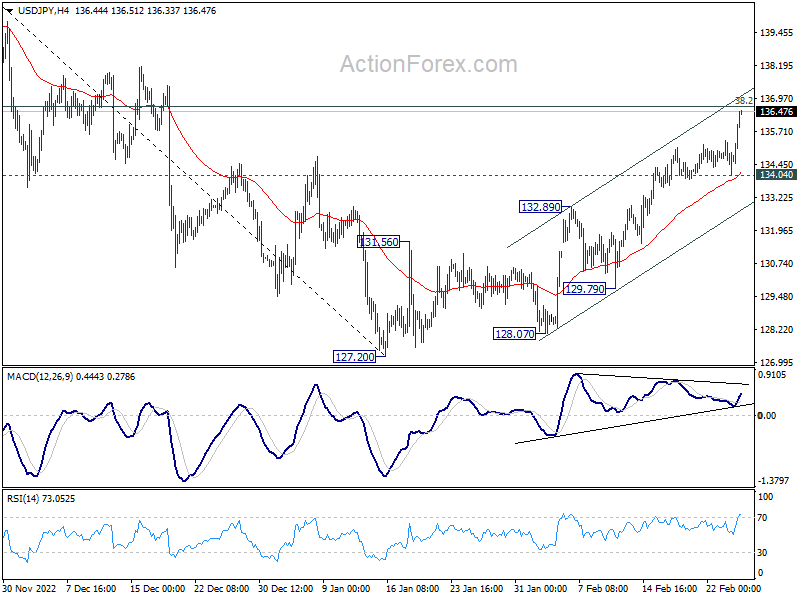
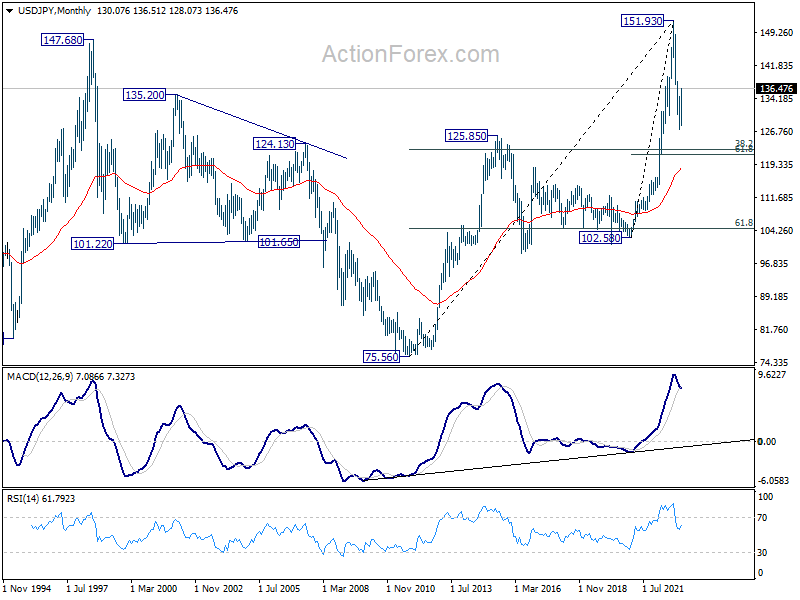
USD/JPY's rally from 127.20 accelerated to as high as 136.51. Initial bias remains on the upside this week with focus on 38.2% retracement of 151.93 to 127.20 at 136.64. Rejection by this fibonacci level, followed by break of 134.04 support, will argue that such rebound from 127.20 has completed, and turn bias back to the downside for 55 day EMA (now at 133.45) and below. However, sustained trading above 136.64 will indicate that fall from 151.93 has completed, and bring further rally to 61.8% retracement at 142.48.
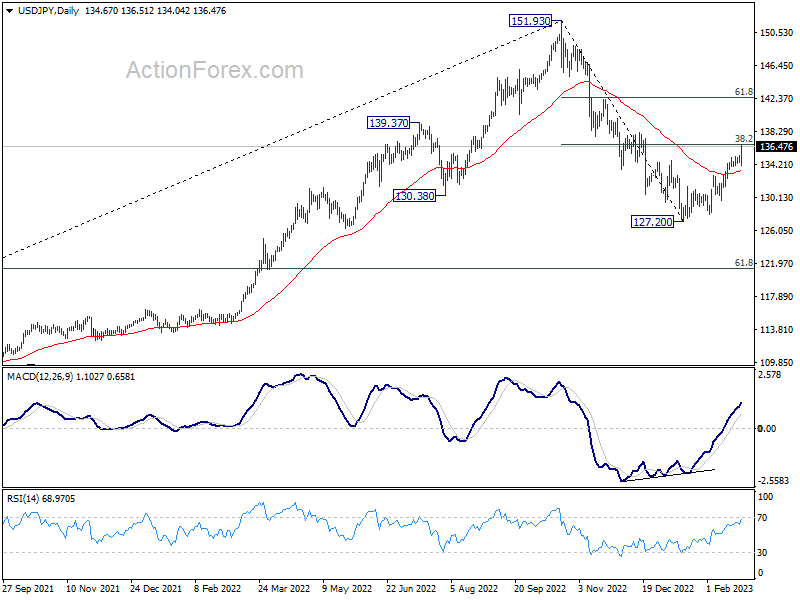
In the bigger picture, focus is now on 38.2% retracement of 151.93 to 127.20 at 136.64. Sustained break there will indicate that price actions from 151.93 medium term are merely a corrective pattern. Such development will maintain long term bullishness. Rejection by 136.64 will, on the downside, extend the fall from 151.93 to 61.8% retracement of 102.58 to 151.93 at 121.43 at a later stage.
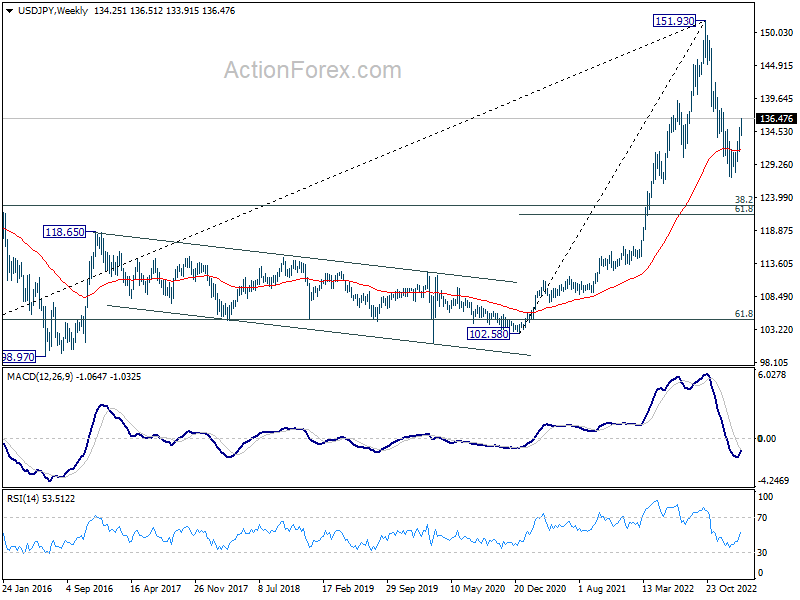
In the long term picture, 151.93 looks increasingly likely a major top. But it's too early to call for long term bearish reversal at this point. Rebound from around 38.2% retracement of 75.56 to 151.93 at 122.75 will keep the case open for price action from 151.93 to be just a corrective pattern.
GBP/USD Weekly Outlook
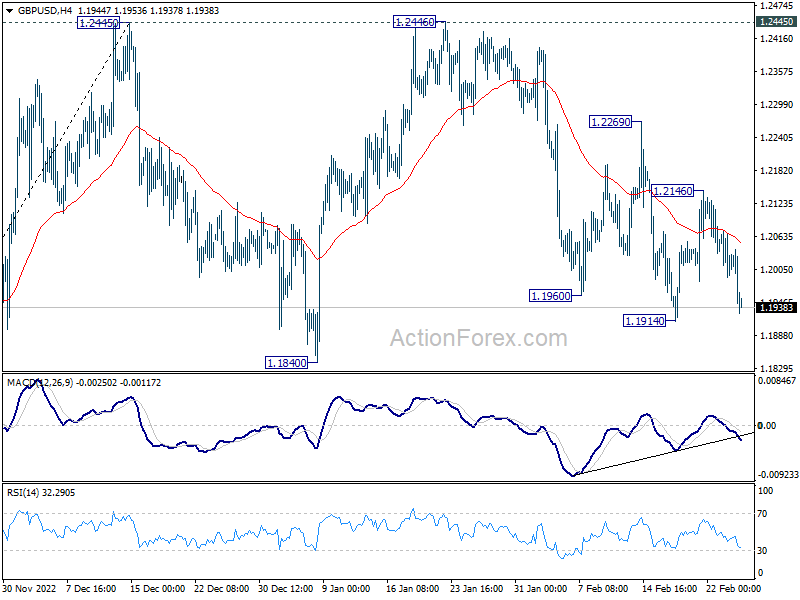
GBP/USD reversed after rebounding to 1.2146 last week and stayed below falling 55 day EMA. Near term outlook remains bearish with initial focus on 1.1914 support this week. Firm break there will resume the decline from 1.2446 for 1.1840 support and possibly below. On the upside, break of 1.2146 resistance will turn bias back to the upside for further rebound to 1.2269 and above.
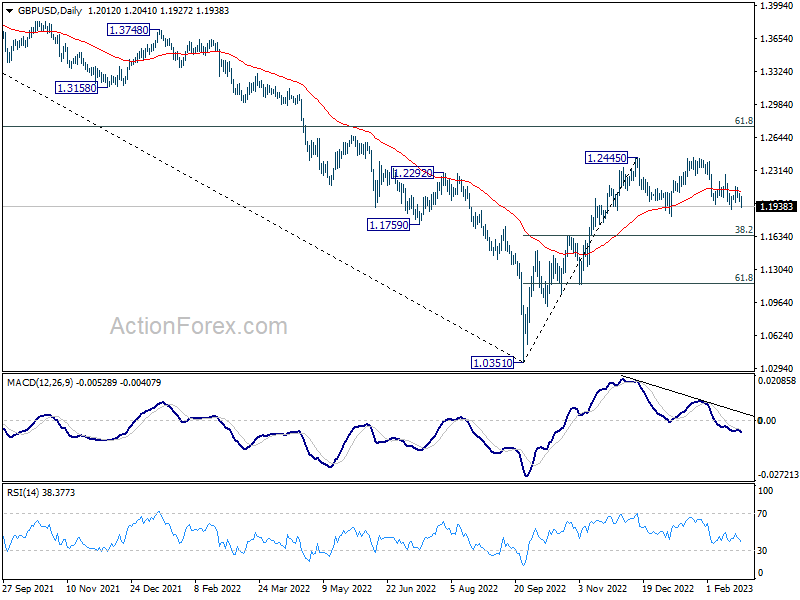
In the bigger picture,as long as 1.1840 support holds, rise from 1.0351 medium term bottom (2022 low) should still continue to 61.8% retracement of 1.4248 (2021 high) to 1.0351 at 1.2759. However, decisive break of 1.1840 will complete a double top pattern (1.2445, 1.2446) after rejection by 55 week EMA (now at 1.2251). Deeper decline should be seen back to 38.2% retracement of 1.0351 to 1.2445 at 1.1645.
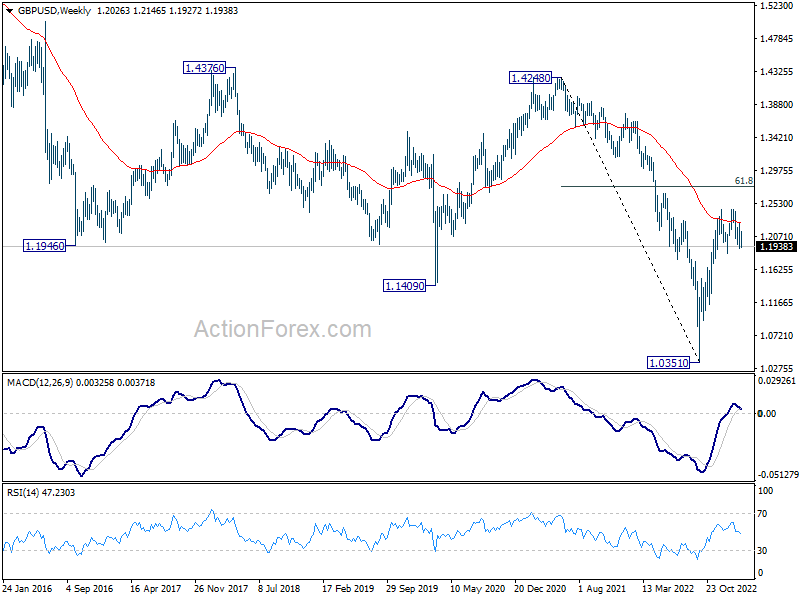
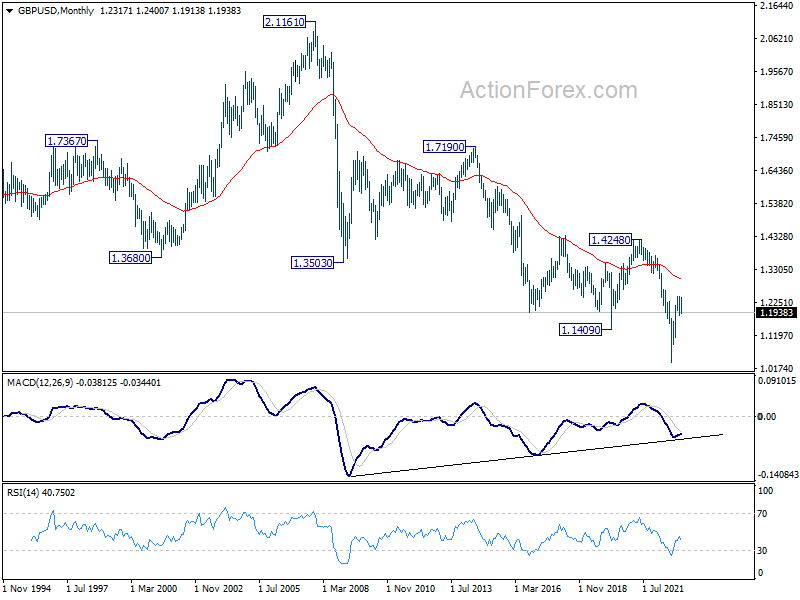
In the longer term picture, as long as 1.4248 resistance holds (2021 high), long term outlook will remain neutral at best. Down trend from 2.1161 (2007) could still resume for another low through 1.0351 at a later stage.
USD/CHF Weekly Outlook
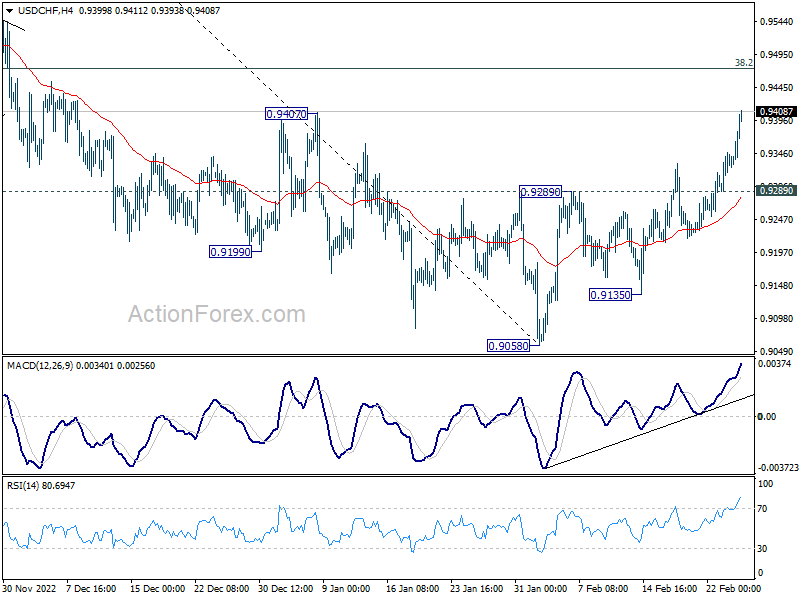
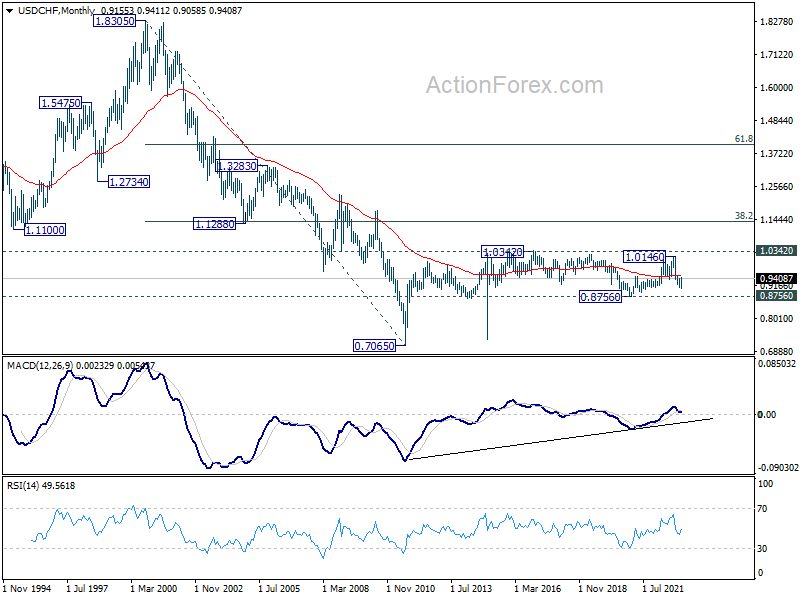
USD/CHF's rise from 0.9058 continued last week and hit as high as 0.9411. Initial bias stays on the upside this week for 38.2% retracement of 1.0146 to 0.9058 at 0.9474. On the downside, break of 0.9289 resistance turned support is needed to indicate completion of the rebound. Otherwise, further rally will remain in favor in case of retreat.
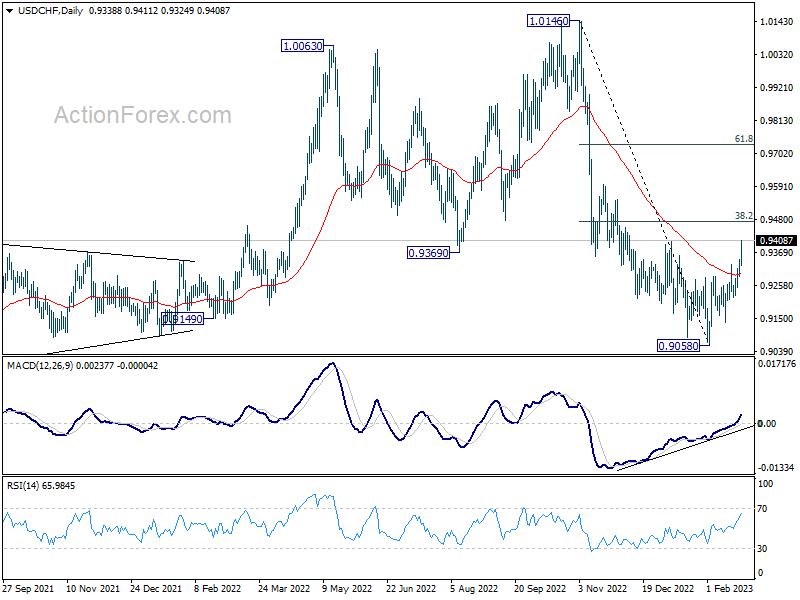
In the bigger picture, decline from 1.0146 is seen as part of a long term sideway pattern. As long as 38.2% retracement of 1.0146 to 0.9058 at 0.9474 holds, another fall is in favor through 0.9058. However, sustained trading above 0.9474 will indicate that the medium term trend has reversed, and open up further rally to 61.8% retracement at 0.9730 and above.
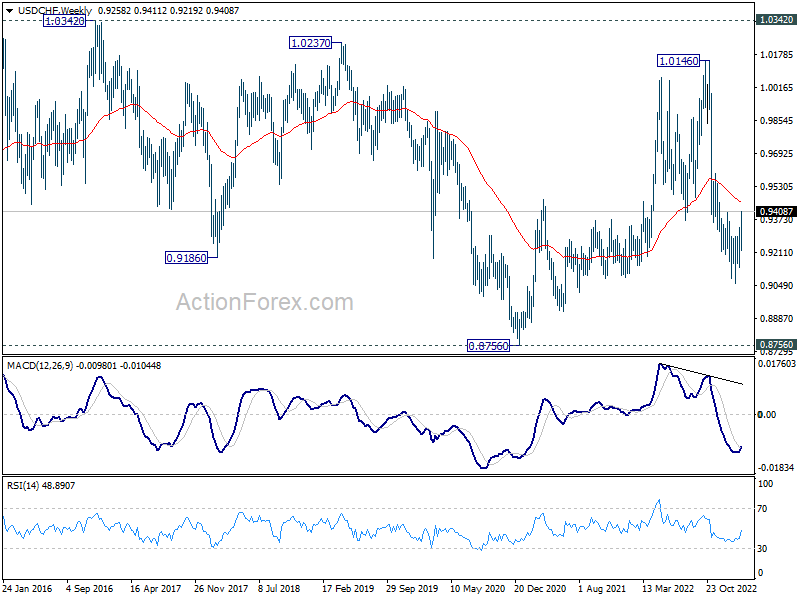
In the long term picture, long term sideway pattern from 1.0342 (2016 high) is extending. Overall, range trading should continue until further development.
AUD/USD Weekly Report
AUD/USD's decline from 0.7156 continued last week and accelerated to as low as 1.6716. There is no sign of bottoming yet. Immediate focus is on 0.6721 support this week. Decisive break there will carry larger bearish implication. Next target is 161.8% projection of of 0.6854 to 0.7028 from 0.6854 at 0.6539. On the upside, break of 0.6854 support turned resistance will argue that the pull back has completed, and turn bias back to the upside.
In the bigger picture, focus is now on 0.6721 structural support. Sustained break there will argue that whole rise from 0.6169 (2022 low) has completed at 0.7156, after rejection by 55 month EMA (now at 0.7179). Deeper decline would then be see back to 61.8% retracement of 0.6169 to 0.7156 at 0.6546, even as a corrective fall. Nevertheless, strong rebound from current level will retain medium term bullishness for another rise through 0.7156 later.
In the long term picture, initial rejection by 55 month EMA (now at 0.7179) retains long term bearishness. That is, down trend from 1.1079 (2011 high) could still resume through 0.5506 (2020 low) on resumption.
USD/CAD Weekly Outlook
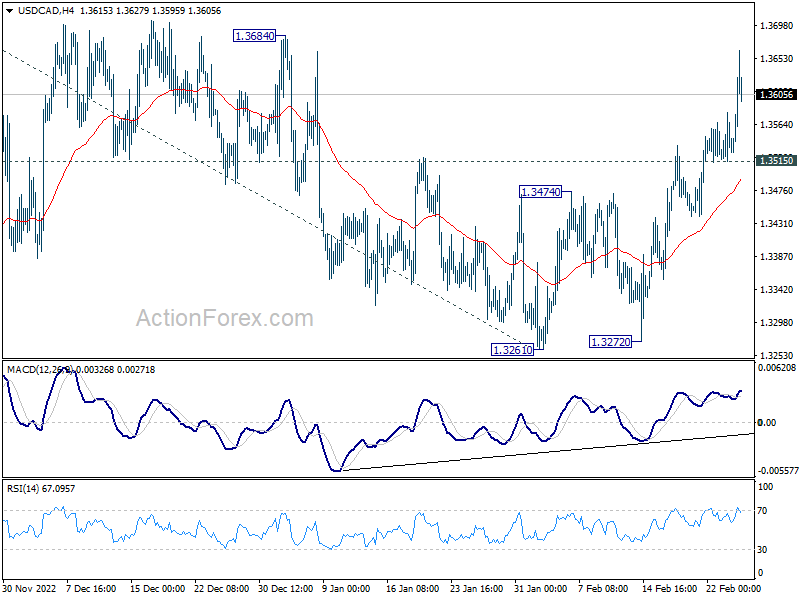
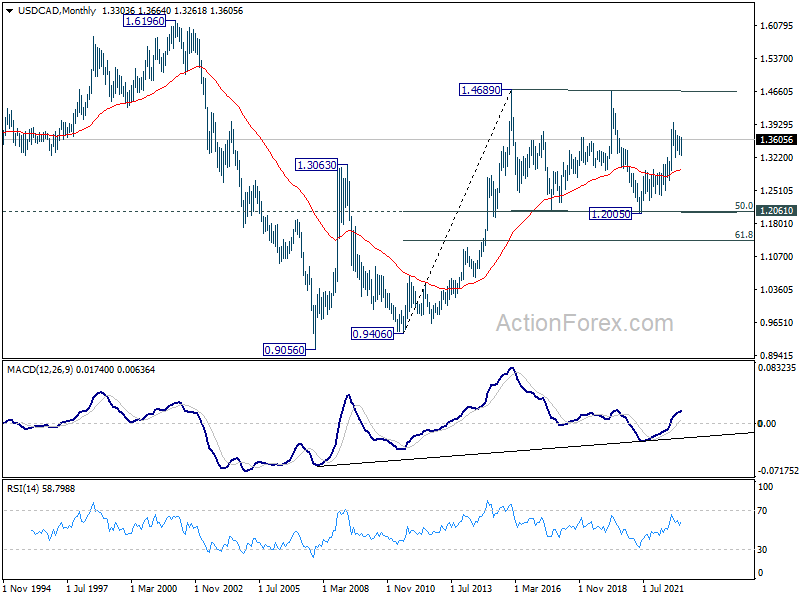
USD/CAD's rally continued last week and reached as high as 1.3664. Initial bias stays on the upside this week. Corrective pattern from 1.3976 should have completed at 1.3261. Firm break of 1..3684 resistance will bring retest of 1.3976. In case of retreat, further rally will remain in favor as long as 1.3515 support holds.
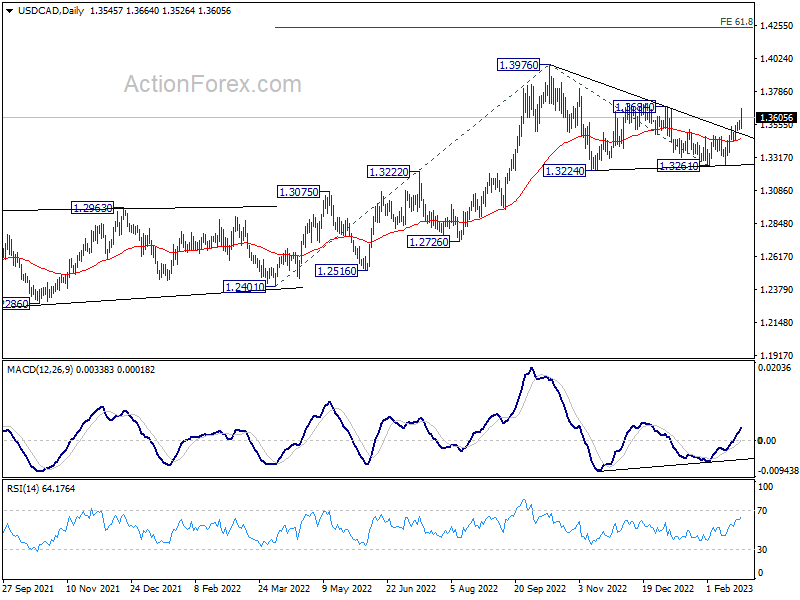
In the bigger picture, outlook stays bullish with 1.3222 cluster support (38.2% retracement of 1.2005 to 1.3976 at 1.3223) intact. Break of 1.3976 resistance will resume larger up trend from 1.2005 (2021 low) to 61.8% projection of 1.2401 to 1.3976 from 1.3261 at 1.4234.
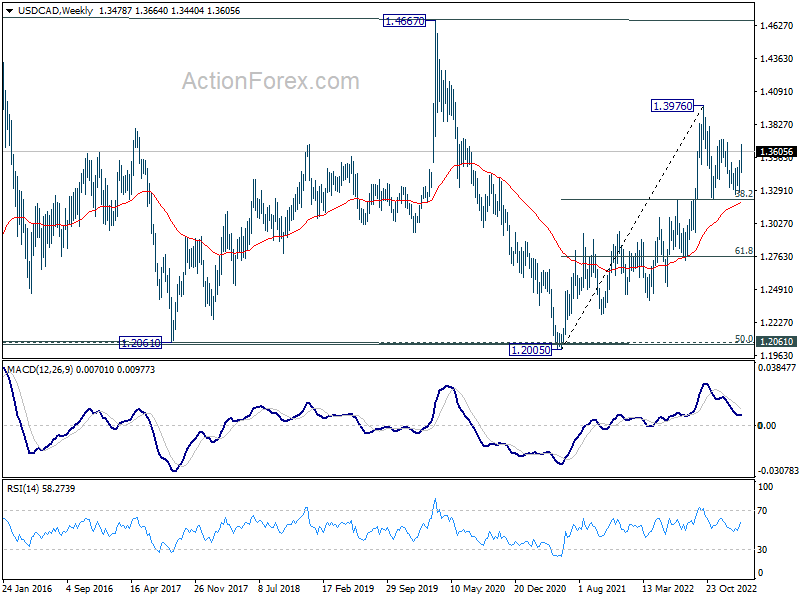
In the longer term picture, price actions from 1.4689 (2016 high) are seen as a consolidation pattern only, which might have completed at 1.2005. That is, up trend from 0.9506 (2007 low) is expected to resume at a later stage. This will remain the favored case as 55 month EMA (now at 1.2971) holds.
GBP/JPY Weekly Outlook
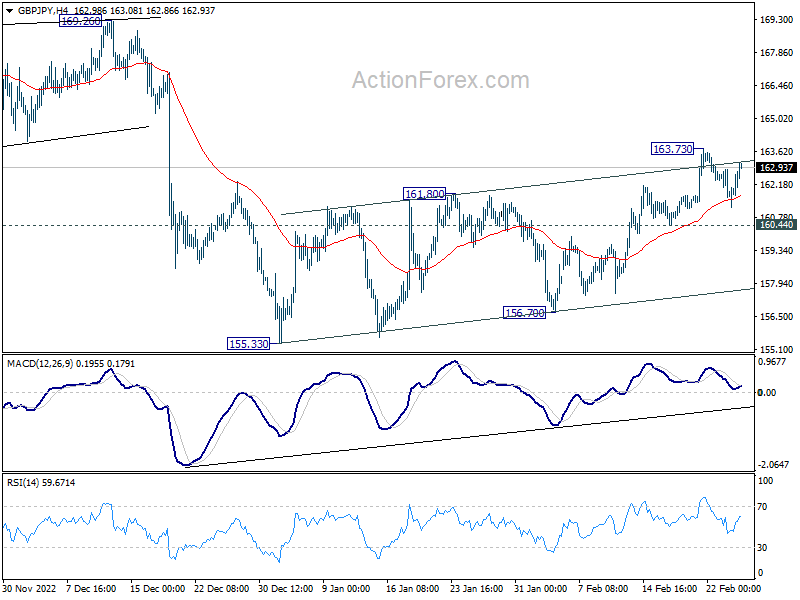
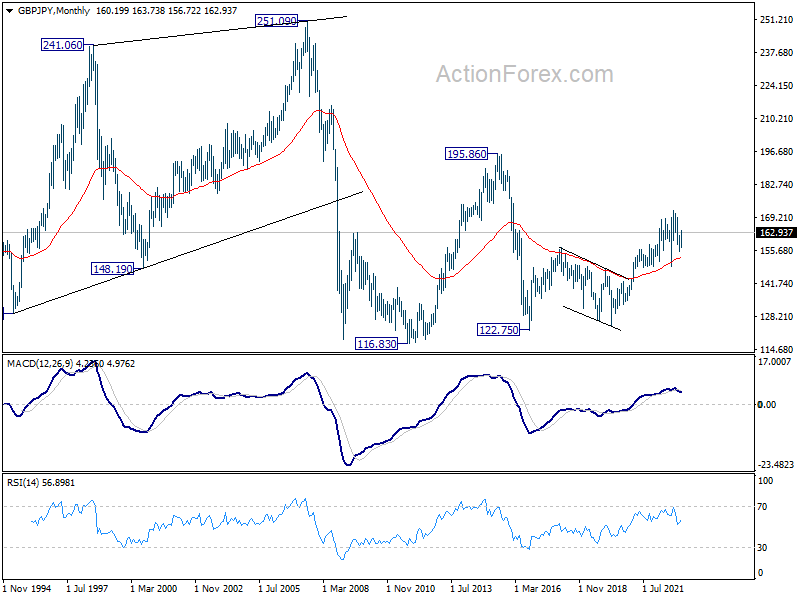
GBP/JPY rose to 163.73 last week but retreated since then. Initial bias is neutral this week first. For now, the favored case is that correction from 172.11 has completed at 155.33 already. Above 163.73 will resume the rise from 155.33 to 169.26/172.11 resistance zone. However, break of 160.44 minor support will dampen this case and bring retest of 155.33 low instead.
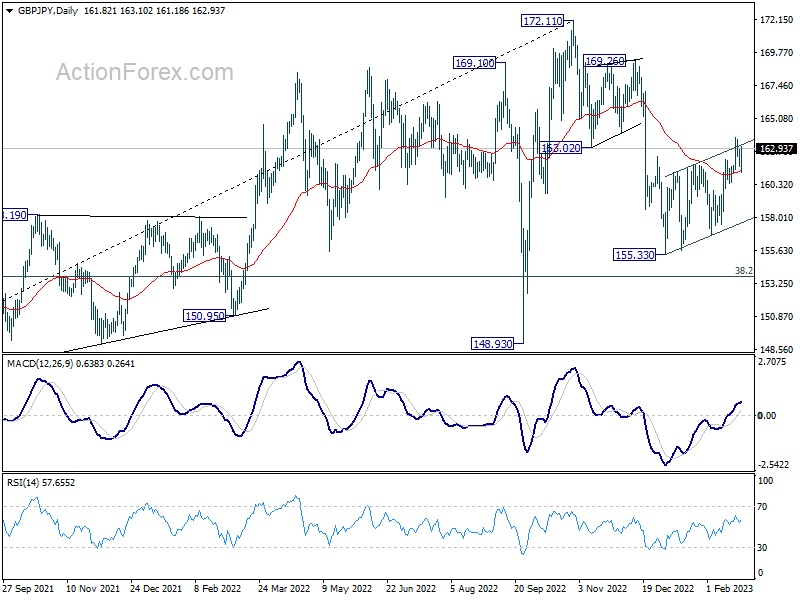
In the bigger picture, corrective decline from 172.11 medium term should have completed at 155.33. With 38.2% retracement of 123.94 (2020 low) to 172.11 (2022 high) at 153.70 intact, medium term bullishness is retained. That is, larger up trend from 123.94 (2020 low) is still in progress. Break of 172.11 high to resume such up trend is expected at a later stage.
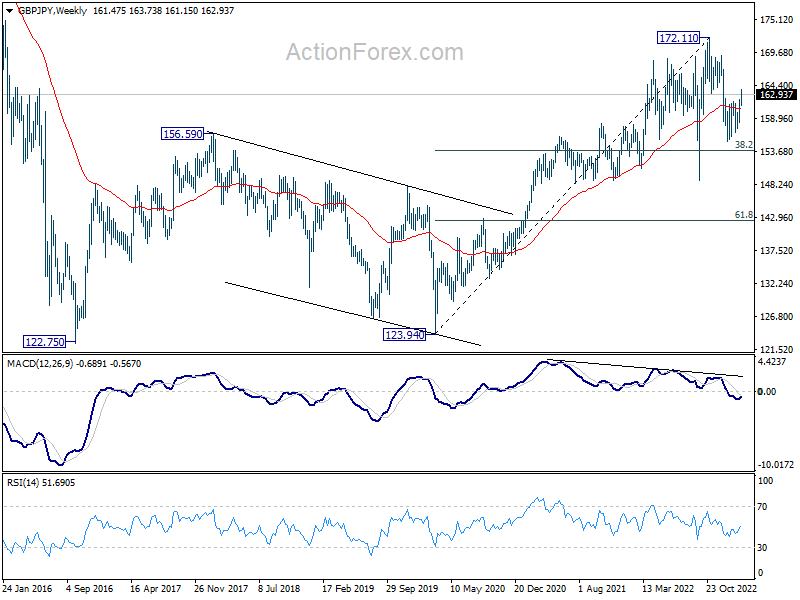
In the longer term picture, as long as 55 month EMA (now at 152.76) holds, rise from 122.75 could still extend higher at a later stage to 195.86 (2015 high).
EUR/JPY Weekly Outlook
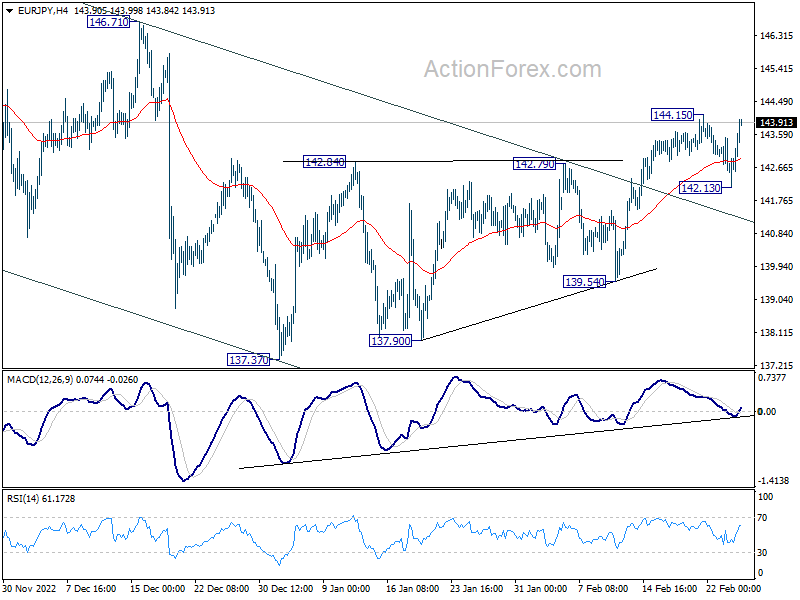
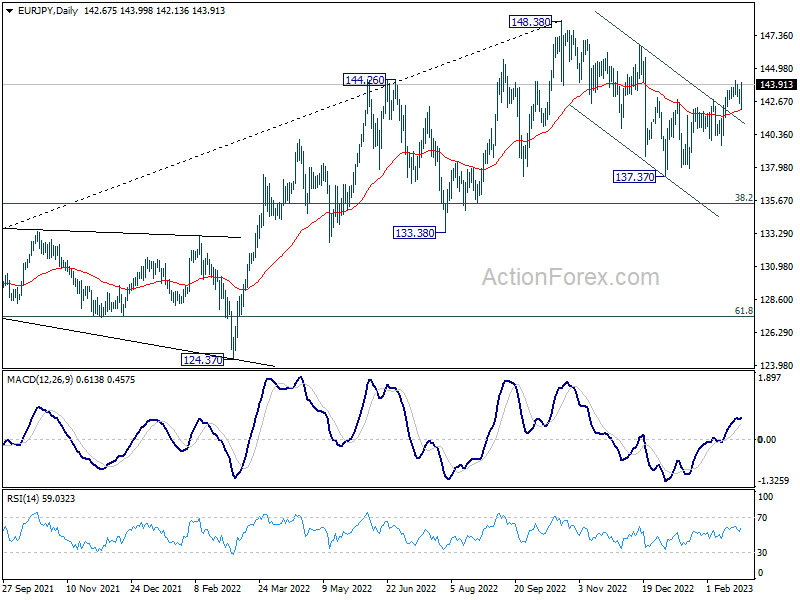
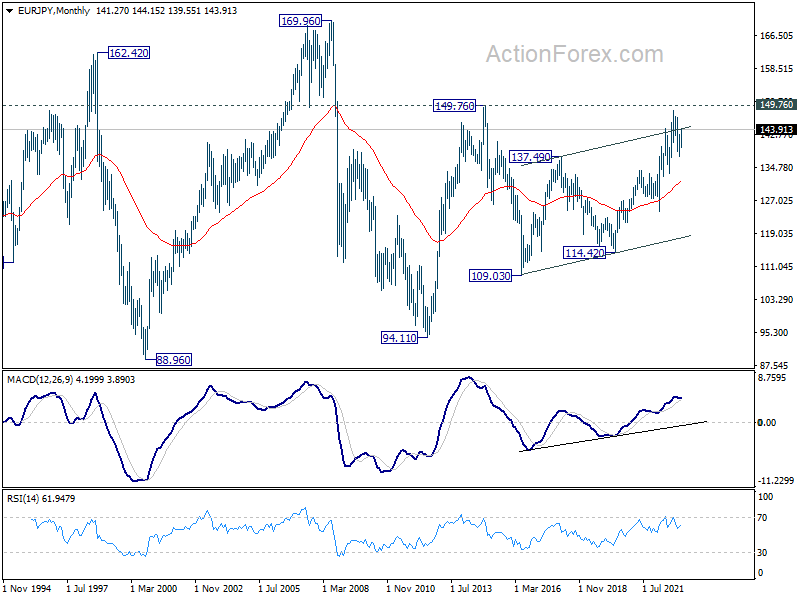
EUR/JPY retreated after hitting 144.15 last week. Initial bias stays neutral this week first. Outlook is unchanged that corrective fall from1 48.38 has completed at 137.37 already. Above 144.15 will resume the rally form 137.37 to retest 148.38 high. Nevertheless, break of 142.13 and sustained trading below 55 day EMA (now at 142.08) will dampen this bullish view and bring deeper fall back towards 137.37 low.
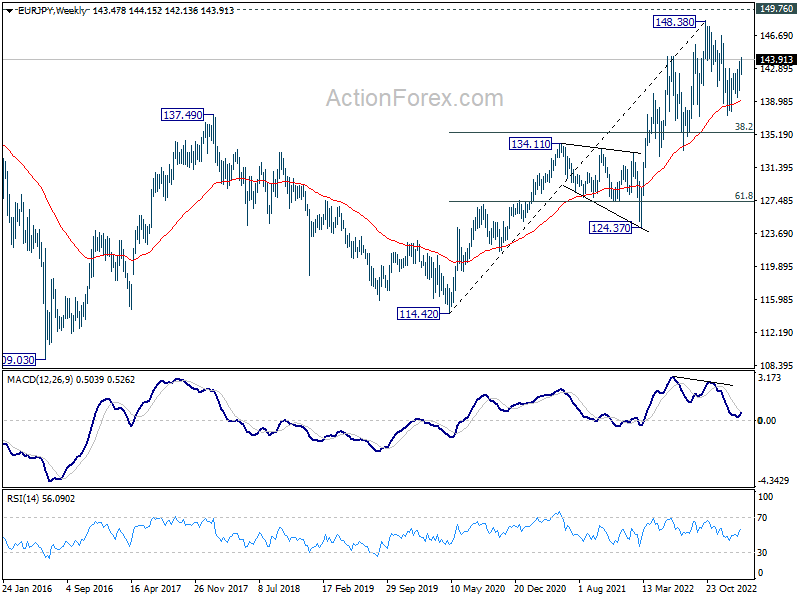
In the bigger picture, as long as 55 week EMA (now at 139.21) holds, larger up trend from 114.42 (2020 low) is still in progress for 149.76 long term resistance. However, firm break of 55 week EMA will bring deeper fall to 38.2% retracement of 114.42 to 148.38 at 135.40. Sustained break there will raise the chance of trend reversal, and target 61.8% retracement at 127.39.
In the long term picture, outlook will stay bullish as long as 134.11 resistance turned support holds (2021 high). Sustained break of 149.76 (2014 high) will open up further rally, as resumption of the rise from 94.11 (2012 low), towards 169.96 (2008 high).
EUR/GBP Weekly Outlook
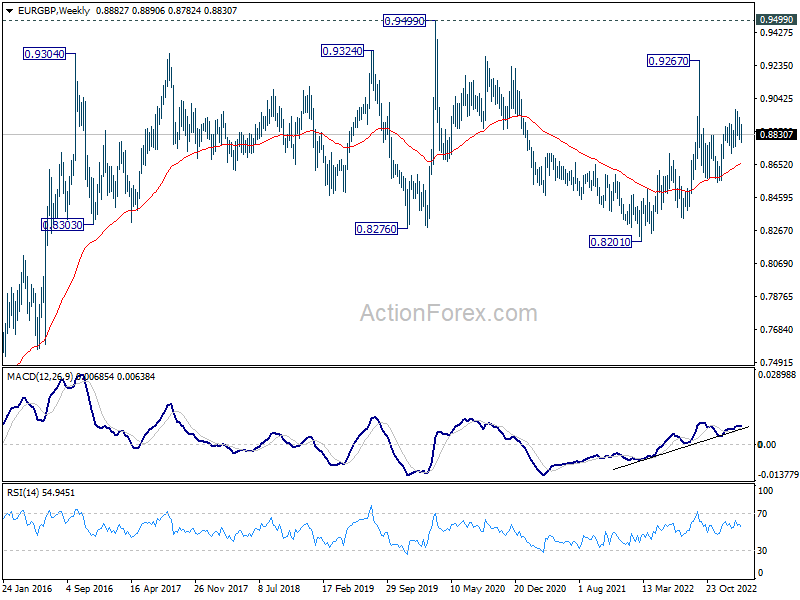
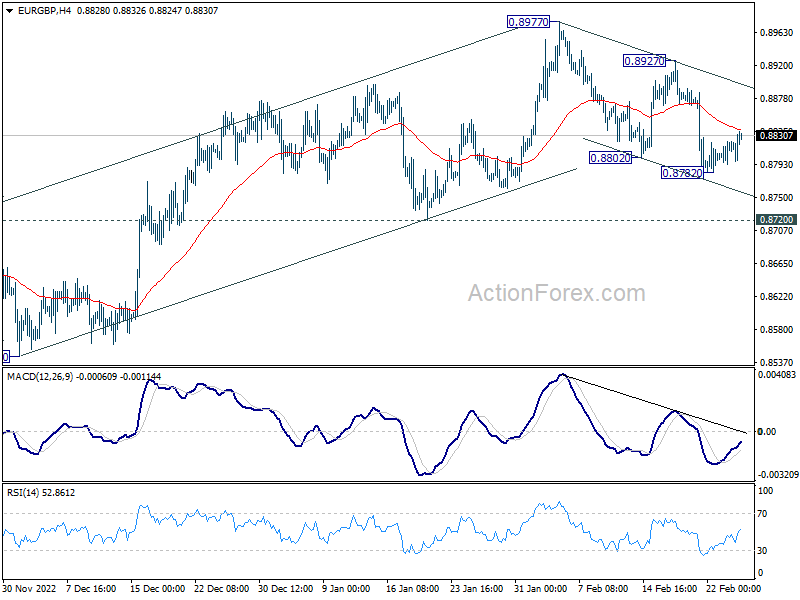
EUR/GBP's fall from 0.8977 resumed last week but recovered after hitting 0.8782. Initial bias is neutral this week first. Another decline is mildly in favor as long as 0.8927 resistance holds. Below 0.8782 will target 0.8720 support. On the upside, break of 0.8927 will revive near term bullishness and bring retest of 0.8977 high.
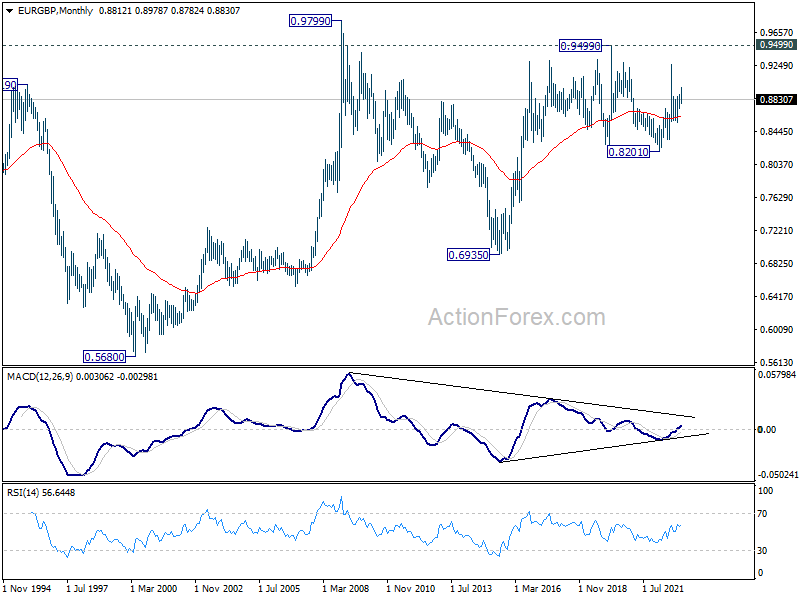
In the bigger picture, focus is back on 55 day EMA (now at 0.8807). Sustained trading below there will argue that fall from 0.9267 is in progress. Such decline is seen as a leg inside long term range pattern from 0.9499 (2020 high). Break of 0.8545 will pave the way back to 0.8201 (2022 low). On the other hand, strong rebound from current level will extend the rise from 0.8545 through 0.8977 at a later stage.
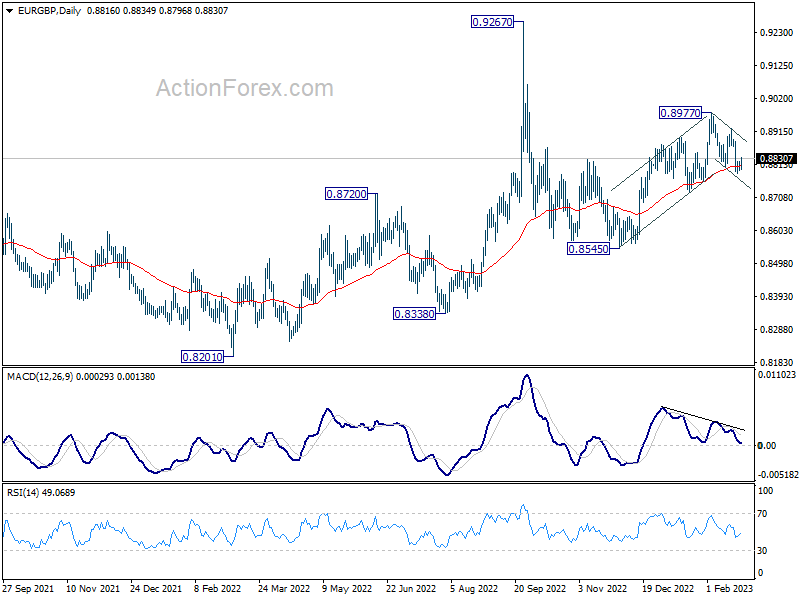
In the long term picture, long term range pattern is extending. But rise from 0.6935 (2015 low) is expected to extend at a later stage, to 0.9799 (2009 high).