Sample Category Title
EUR/CHF Daily Outlook
Daily Pivots: (S1) 0.9850; (P) 0.9876; (R1) 0.9905; More....
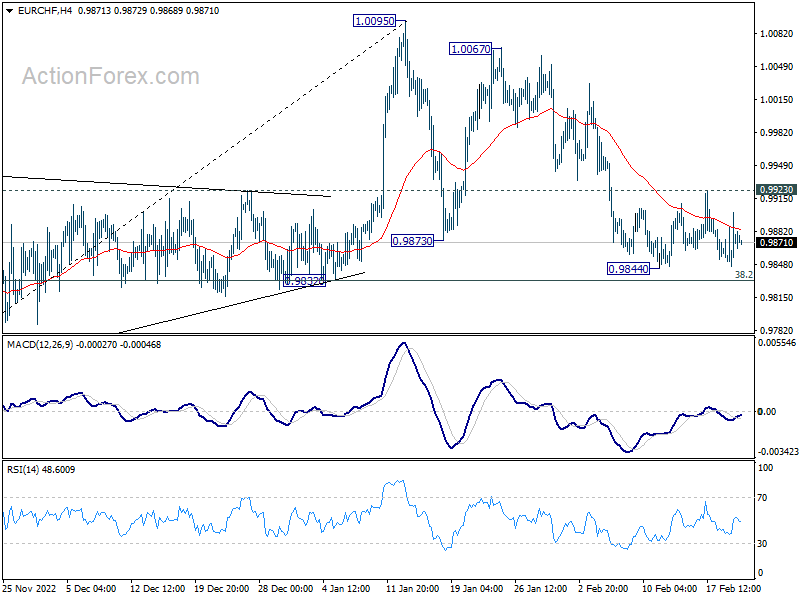
Intraday bias in EUR/CHF remains neutral and outlook is unchanged. In case of another fall, downside should be contained by 38.2% retracement of 0.9407 to 1.0095 at 0.9832, to complete the corrective pattern from 1.0095. Break of 0.9923 will turn bias back to the upside for stronger rebound towards 1.0067/0095 resistance zone.
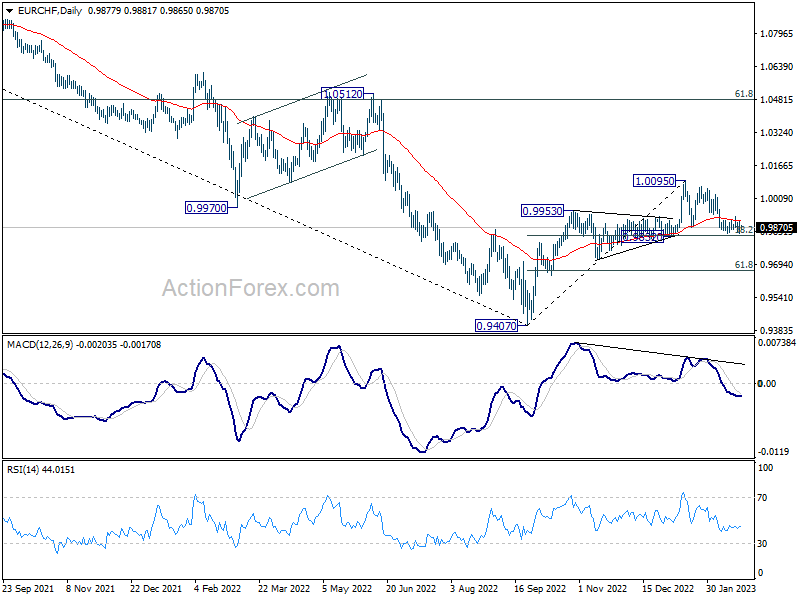
In the bigger picture, the rejection by 55 week EMA (now at 1.0025) mixed up the outlook. On the upside, sustained trading above 55 week EMA will raise the chance of bullish trend reversal. Rise from 0.9407 should then target 1.0505 cluster resistance (2020 low at 1.0505, 61.8% retracement of 1.1149 to 0.9407 at 1.1484). However, firm break of 0.9832 support will revive medium term bearishness and bring retest of 0.9407 low instead.
EUR/USD Daily Outlook
Daily Pivots: (S1) 1.0623; (P) 1.0661; (R1) 1.0683; More...
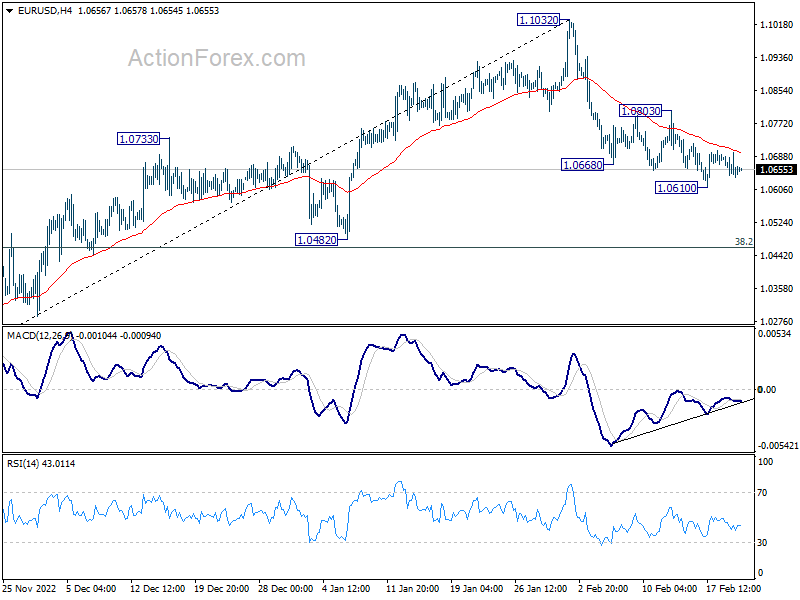
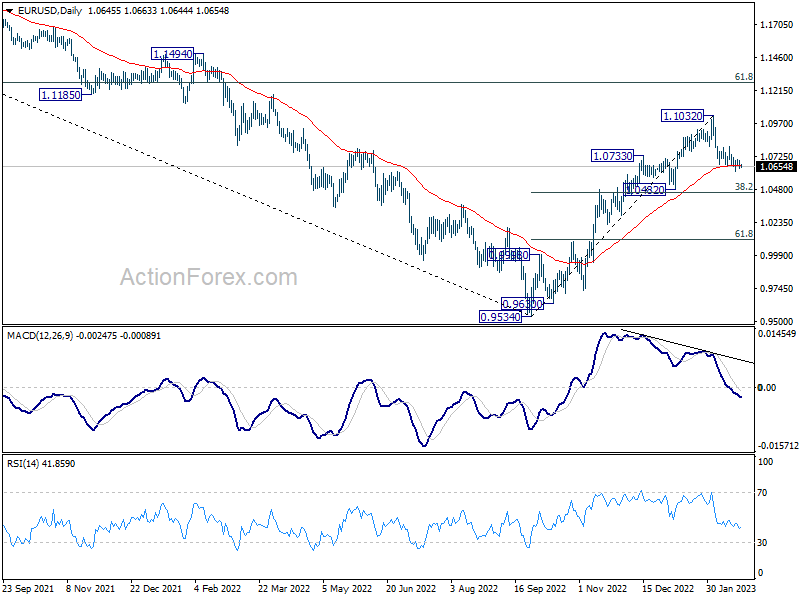
Outlook in EUR/USD remains unchanged. Intraday bias remains neutral and further decline is in favor with 1.0803 resistance intact. On the downside, break of 1.0610 will resume the corrective fall from 1.1032 and 38.2% retracement of 0.9534 to 1.1032 at 1.0463. Strong support should be seen around there to bring rebound, at least on first attempt.
In the bigger picture, the rally from 0.9534 low (2022 low) is a medium term up trend rather than a correction. Further rise is in favor to 61.8% retracement of 1.2348 (2021 high) to 0.9534 at 1.1273 next. This will remain the favored case as long as 1.0482 support holds.
GBP/USD Daily Outlook
Daily Pivots: (S1) 1.2017; (P) 1.2082; (R1) 1.2177; More...
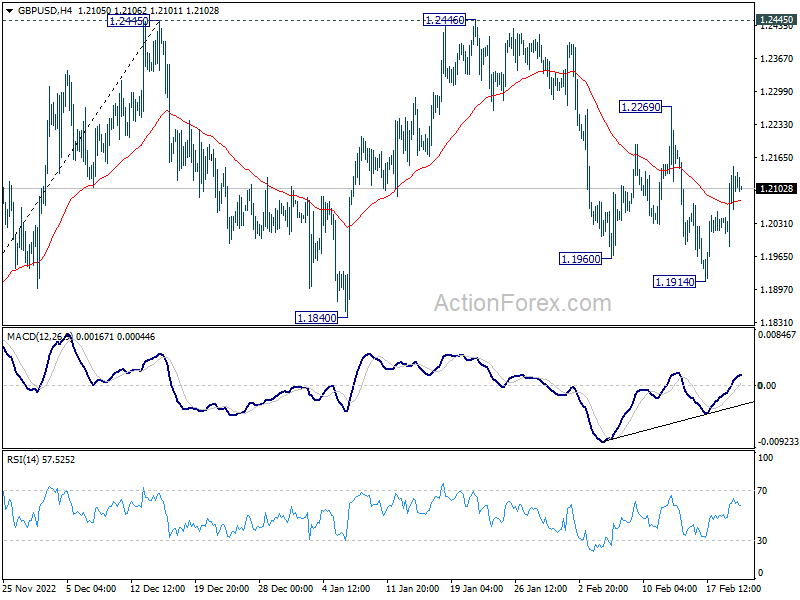
Intraday bias in GBP/USD remains neutral first. Another fall could be seen as long as 1.2269 resistance holds. ON the downside, break of 1.1914 will resume the fall from 1.2446, as the third leg of the corrective pattern from 1.2445, to 1.1840 support and possibly below. Nevertheless, firm break of 1.2269 will bring retest of 1.2445/6 resistance.
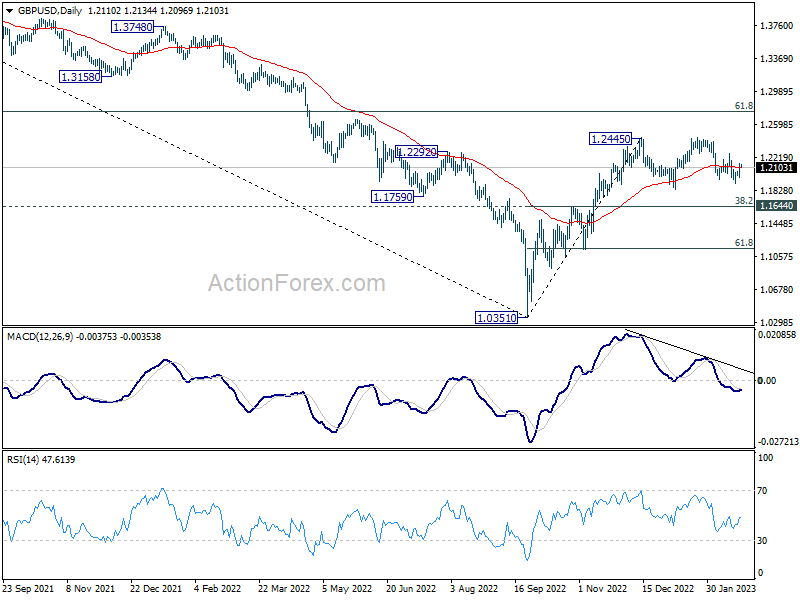
In the bigger picture, rise from 1.0351 medium term bottom is at least correcting whole down trend from 1.4248 (2021 high). Further rise is expected as long as 1.1644 resistance turned support holds. Next target is 61.8% retracement of 1.4248 to 1.0351 at 1.2759. Sustained break there will pave the way back to 1.4248.
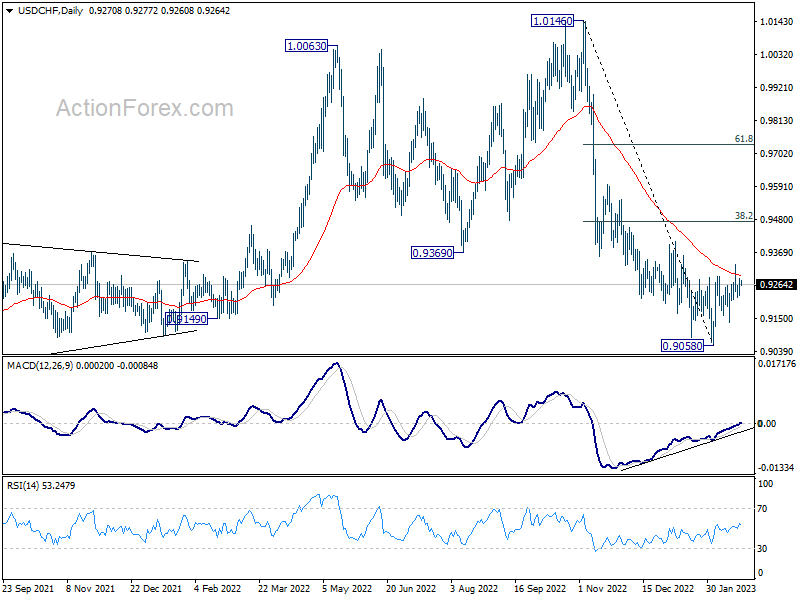
USD/CHF Daily Outlook
Daily Pivots: (S1) 0.9246; (P) 0.9265; (R1) 0.9296; More...
Range trading continues in USD/CHF and intraday bias stays neutral. On the upside, break of 0.9331 will resume the rebound from 0.9058 to 38.2% retracement of 1.0146 to 0.9058 at 0.9474. However, break of 0.9135 will indicate that the rebound has completed and bring retest of 0.9058 low.
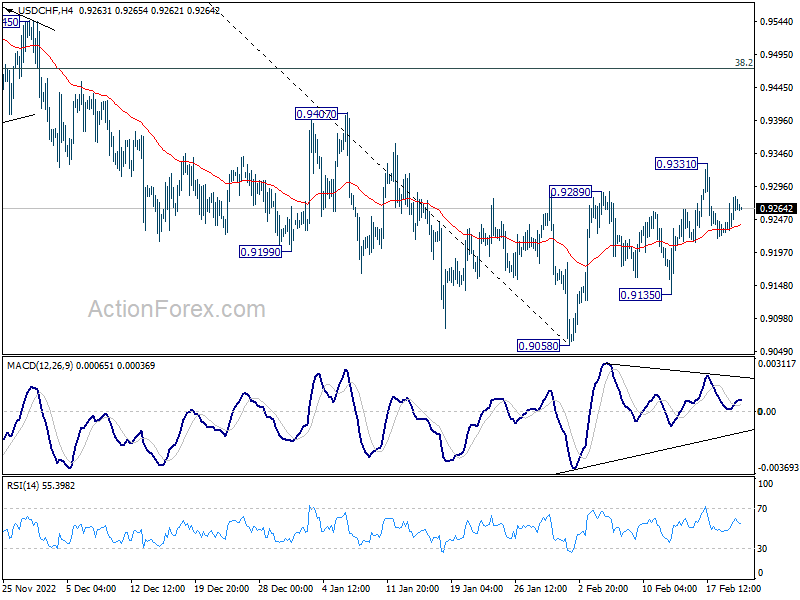
In the bigger picture, decline from 1.0146 is seen as part of a long term sideway pattern. As long as 38.2% retracement of 1.0146 to 0.9058 at 0.9474 holds, another fall is in favor through 0.9058. However, sustained trading above 0.9474 will indicate that the medium term trend has reversed, and open up further rally to 1.0146 again.
USD/JPY Daily Outlook
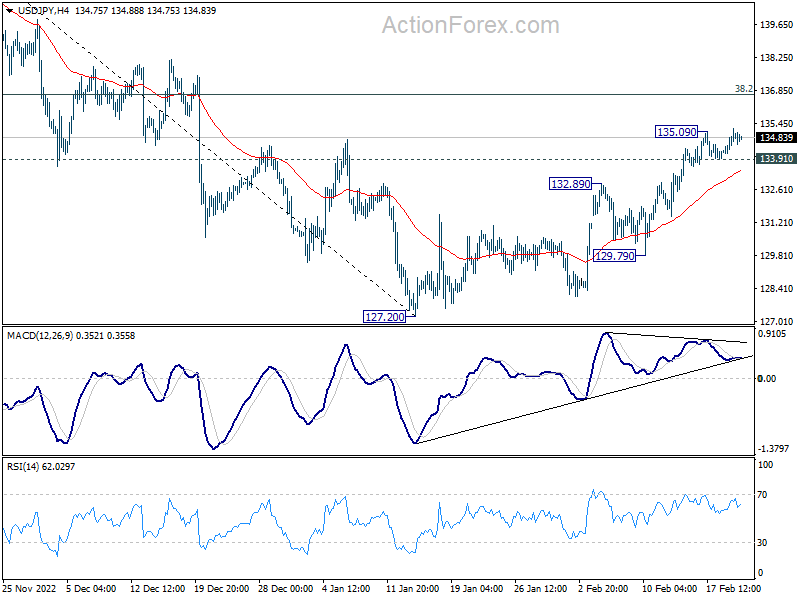
Daily Pivots: (S1) 134.48; (P) 134.85; (R1) 135.40; More...
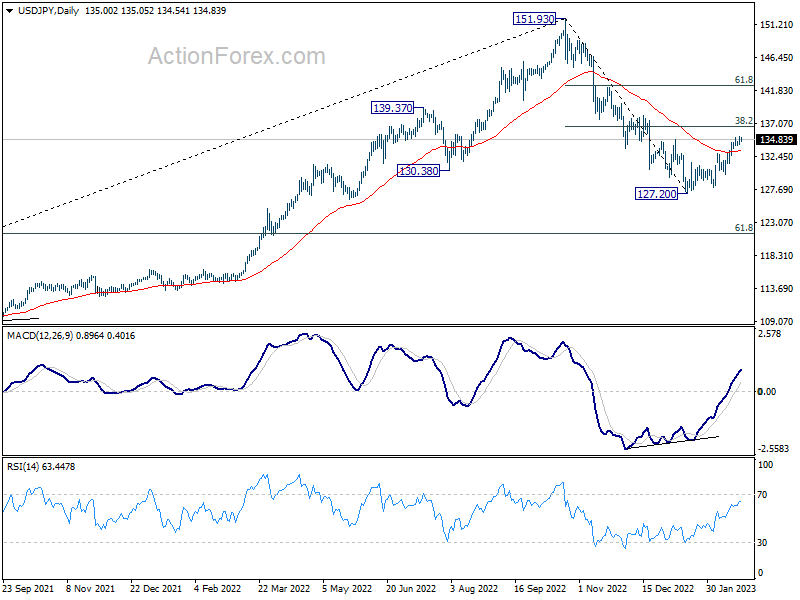
USD/JPY is trying to resume after brief consolidation and intraday bias is back on the upside. Rebound from 127.20 would target 38.2% retracement of 151.93 to 127.20 at 136.64. Strong resistance could be seen there to complete the corrective rebound. On the downside, break of 133.91 minor support will turn bias back to the downside for 129.79/132,89 support zone.
In the bigger picture, prior break of 55 week EMA (now at 131.54) raises the chance of medium term bearish reversal, but that's not confirmed yet. Strong rebound from current level, followed by sustained break of 38.2% retracement of 151.93 to 127.20 at 136.64 will argue that price actions from 151.93 is merely a corrective pattern. However, rejection by 136.64 will solidify medium term bearishness for 61.8% retracement of 102.58 to 151.93 at 121.43 and 38.2% retracement of 75.56 to 151.93 at 122.75.
AUD/USD Daily Report
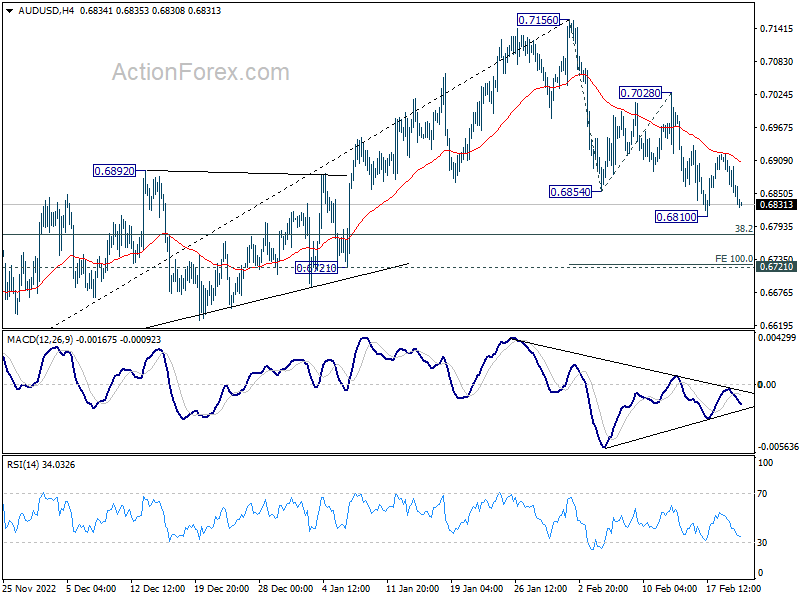
Daily Pivots: (S1) 0.6835; (P) 0.6868; (R1) 0.6887; More...
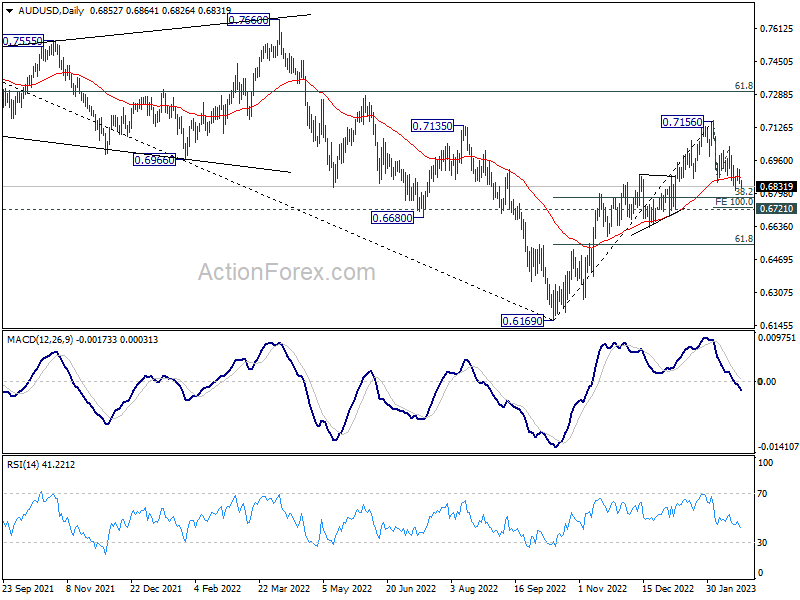
Intraday bias in AUD/USD remains neutral and risk stays mildly on the downside with 0.7028 resistance intact. On the downside, break of 0.6180 will resume the corrective fall from 0.7156, and target 100% projection of 0.6854 to 0.7028 from 0.6854 at 0.6736, which is close to 0.6721 key structural support. Strong support is expected there to bring rebound.
In the bigger picture, corrective decline from 0.8006 (2021 high) should have completed with three waves down to 0.6169 (2022 low). Further rally should be seen to 61.8% retracement of 0.8006 to 0.6169 at 0.7304. Sustained break there will pave the way to retest 0.8006. This will now remain the favored case as long as 0.6721 support holds.
Technical Outlook and Review
USD/JPY:
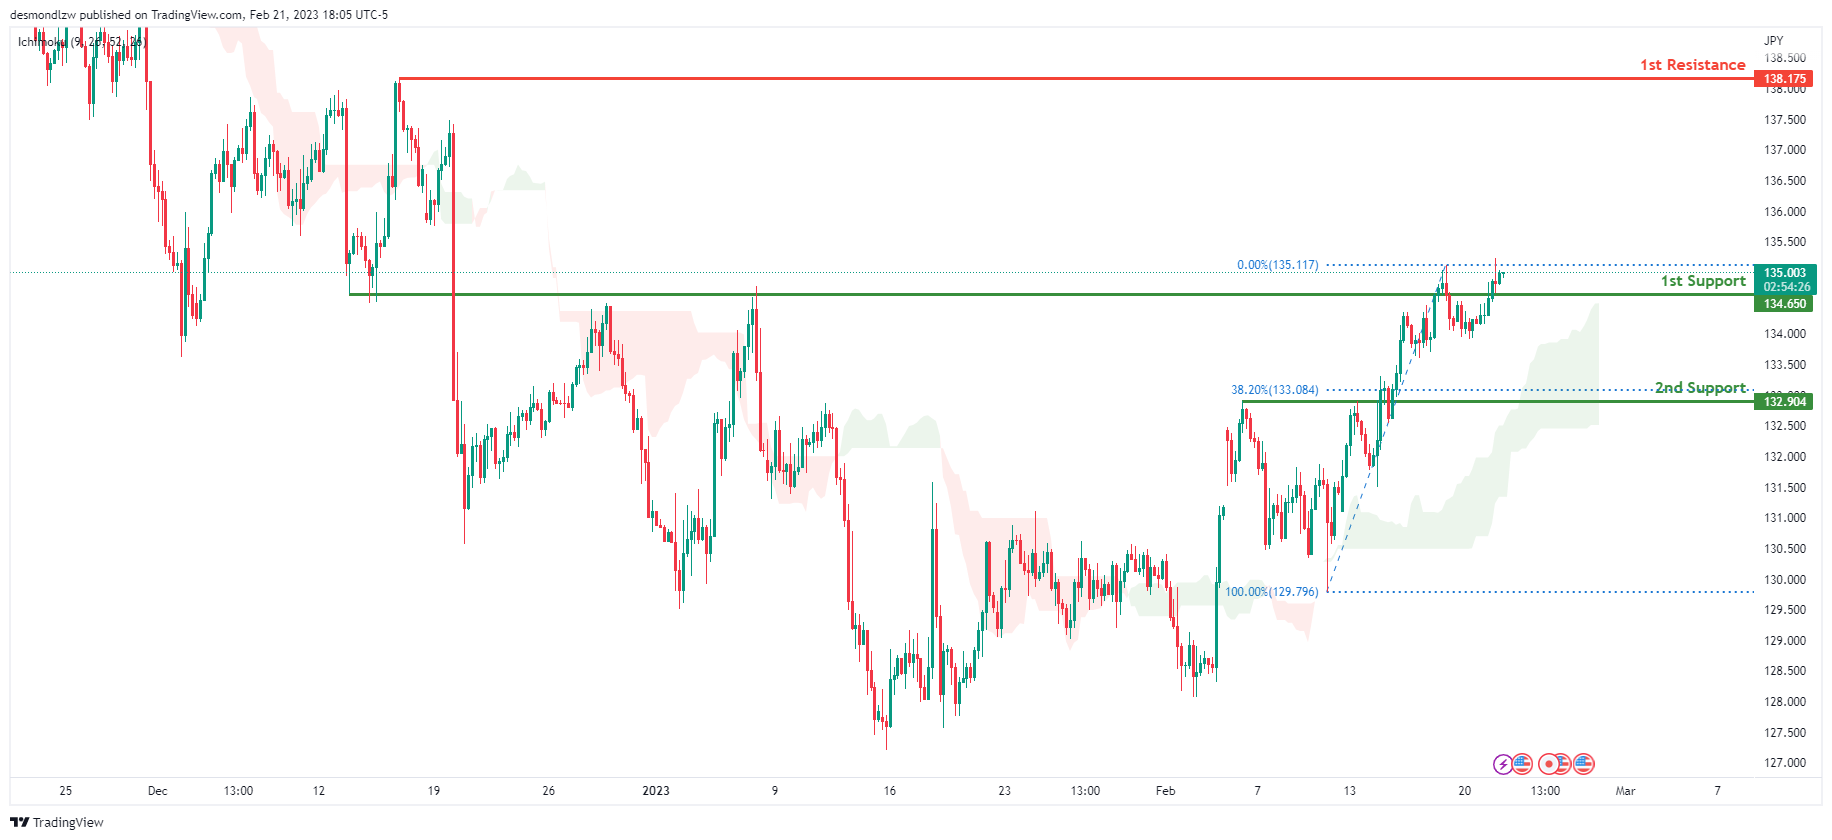
Looking at the H4 chart, my overall bias for USDJPY is bullish due to the current price being above the Ichimoku cloud, indicating a bullish market. If this bullish momentum continues, expect the price to continue heading towards the 1st resistance at 138.175, where the previous swing high is.
In an alternate scenario, price could possibly head back down to break the 1st support at 134.650, where the overlap support is before heading towards the 2nd support at 132.904, where the overlap support and 38.2% Fibonacci line is.
Areas of consideration:
- H4 time frame, 1st resistance at 138.175
- H4 time frame, 1st support at 134.650
- H4 time frame, 2nd support at 132.904
DXY:
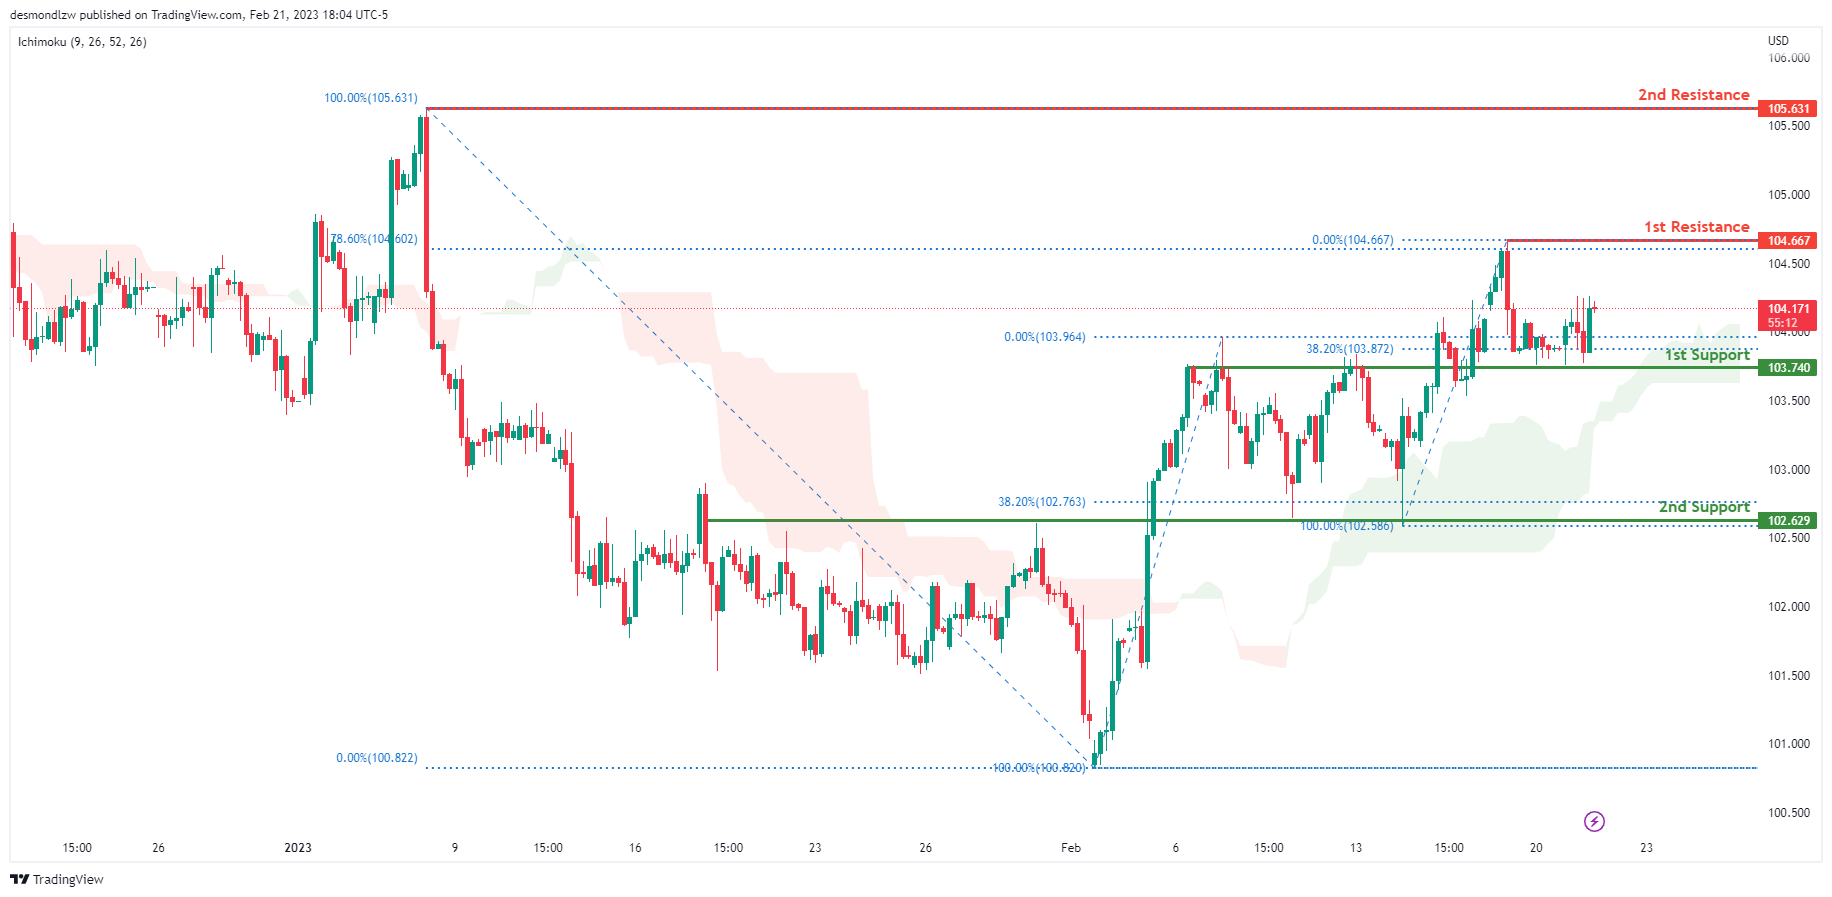
Looking at the H4 chart, my overall bias for DXY is bullish due to the current price crossing above the Ichimoku cloud, indicating a bullish market. If this bullish momentum continues, expect the price to possibly continue heading towards the 1st resistance at 104.667, where the recent high and 78.6% Fibonacci line is.
In an alternative scenario, price could head back down to retest the 1st support at 103.740, where the overlap support and 38.2% Fibonacci line is.
Areas of consideration:
- H4 time frame, 1st resistance at 104.667
- H4 time frame, 1st support at 103.740
EUR/USD:
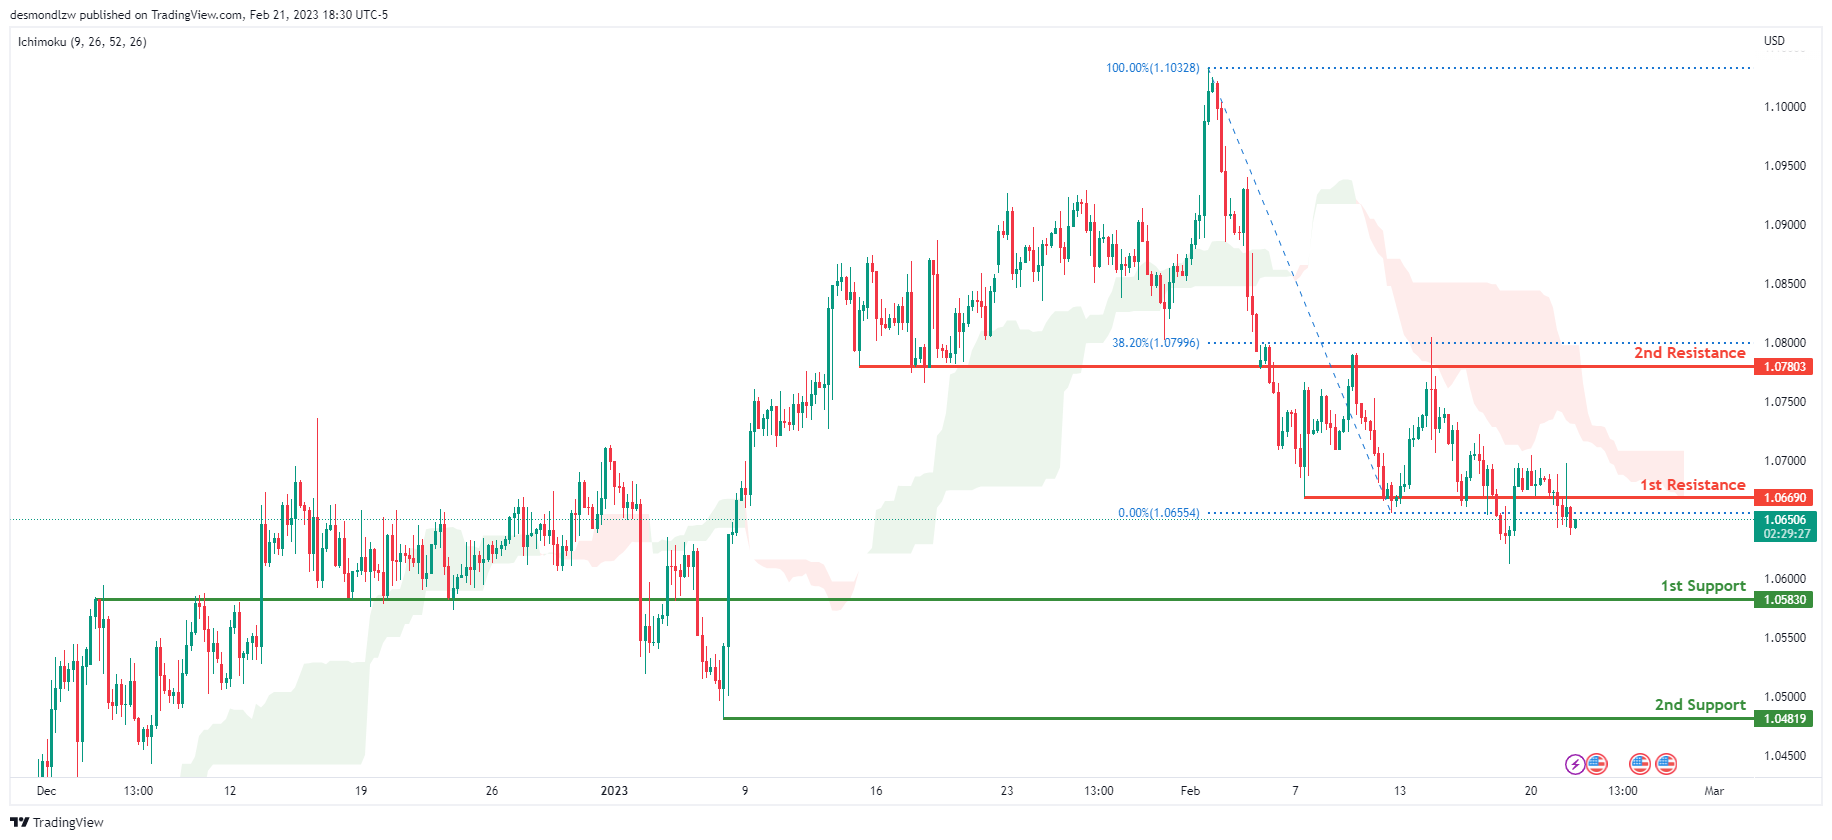
Looking at the H4 chart, my overall bias for EURUSD is bearish due to the current price crossing below the Ichimoku cloud, indicating a bearish market structure. If this bearish momentum continues, expect the price to head towards the 1st support at 1.05830 which is the overlap support.
In an alternate scenario, price could possibly head back up to retest the 1st resistance at 1.06690, where the overlap support is.
Areas of consideration :
- H4 1st resistance at 1.06690
- H4 1st support at 1.05830
GBP/USD:
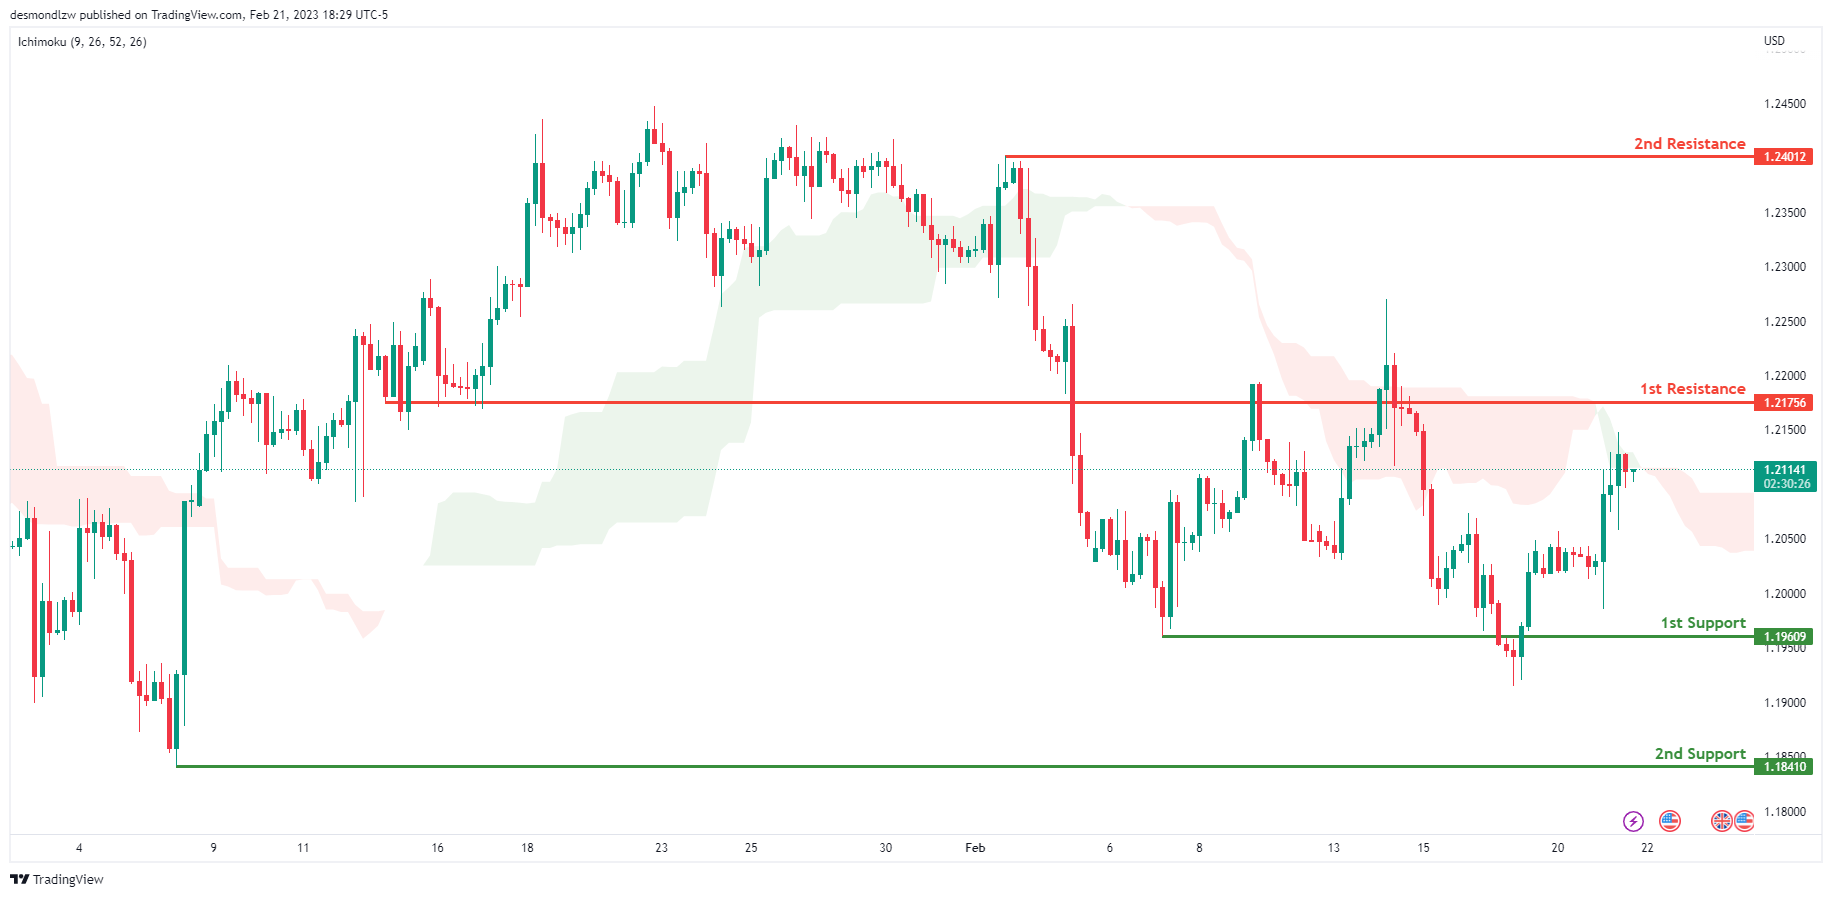
Looking at the H4 chart, my overall bias for GBPUSD is bearish due to the current price crossing below the Ichimoku cloud, indicating a bearish market. If this bearish momentum continues, expect the price to possibly break the 1st support at 1.19609, where the recent swing low is, before heading towards the 2nd support at 1.18410, where the previous swing low is.
In an alternate scenario, price could head back up to retest the 1st resistance line at 1.21756 where the overlap resistance is.
Areas of consideration:
- H4 1st resistance at 1.21756
- H4 1st support at 1.19609
- H4 2nd support at 1.18410
USD/CHF:
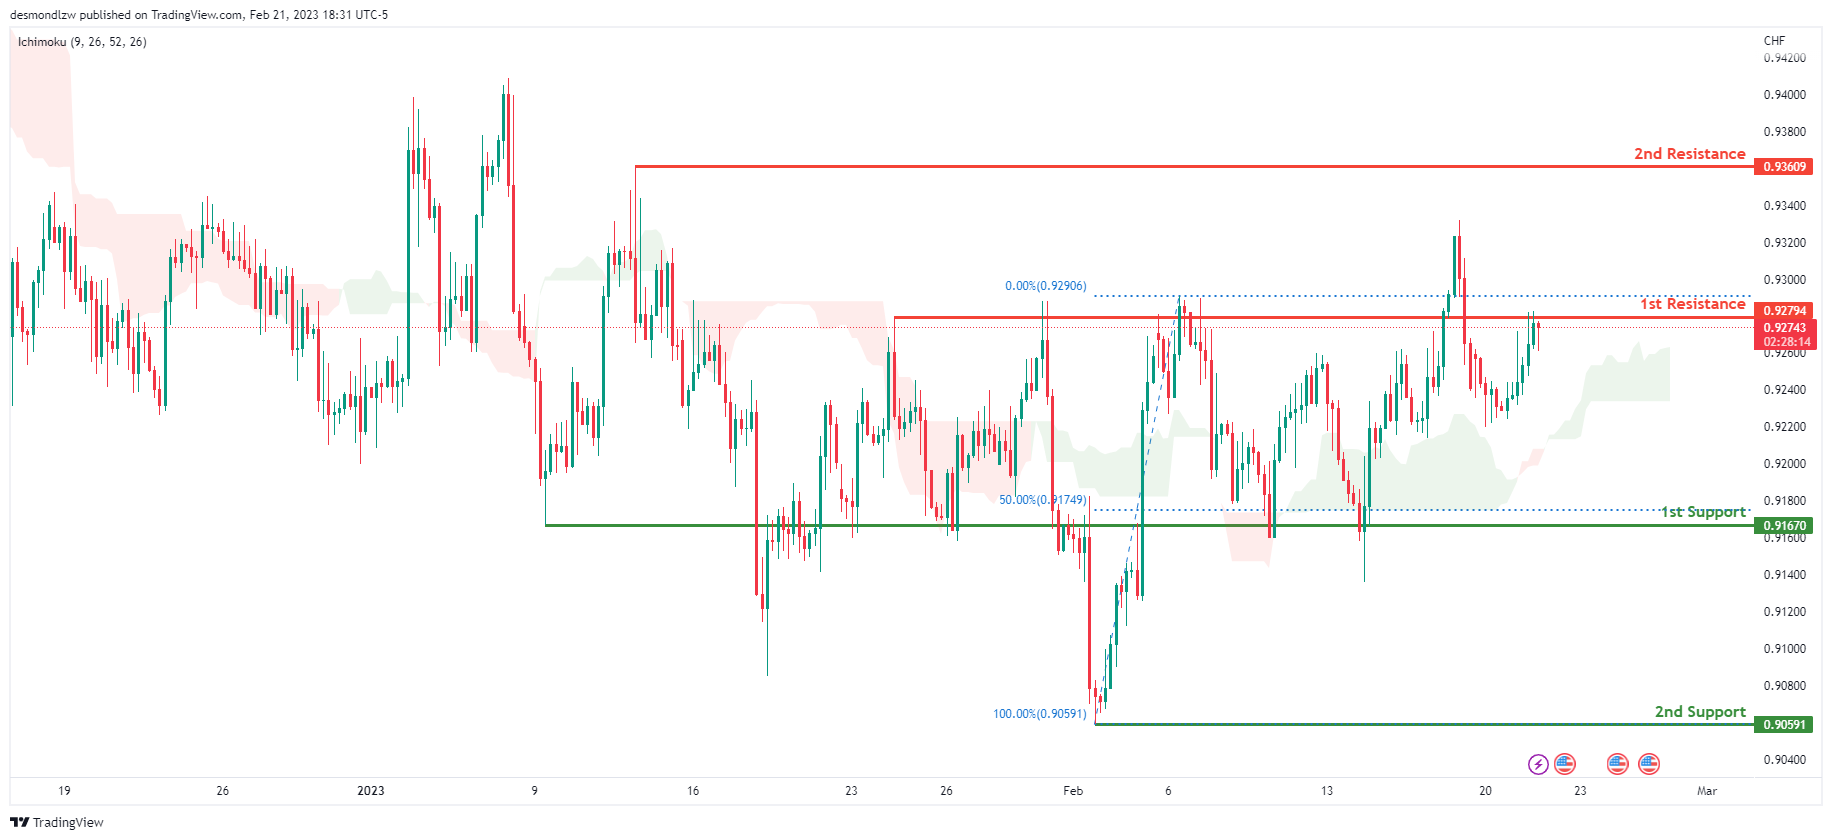
Looking at the H4 chart, my overall bias for USDCHF is bullish due to the current price being above the Ichimoku cloud, indicating a bullish market. If the current bullish trend continues, expect the price to possibly break the 1st resistance at 0.92794, where the previous swing high is, before heading towards the 2nd resistance at 0.93609 where the intermediate high is.
In an alternative scenario, price could possibly head back down to retest the 1st support at 0.91670, where the recent swing low and 50% Fibonacci line is.
Areas of consideration
- H4 1st support at 0.91670
- H4 1st resistance at 0.92794
- H4 2nd resistance at 0.93609
XAU/USD (GOLD):
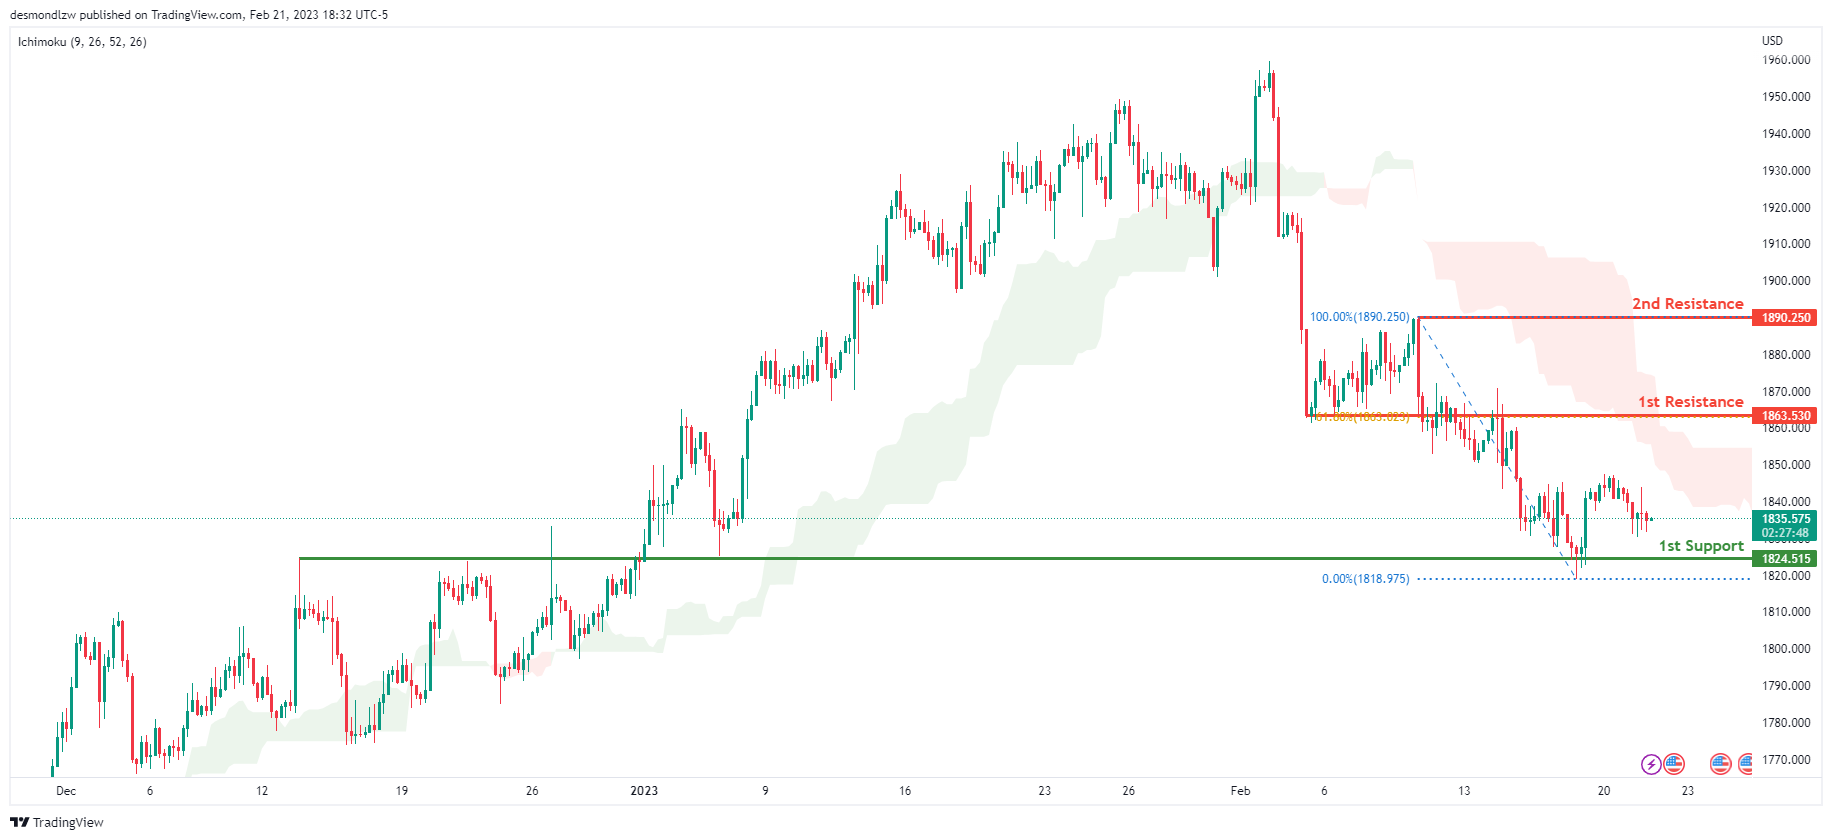
Looking at the H4 chart, my overall bias for XAUUSD is bearish due to the current price being below the Ichimoku cloud, indicating a bearish market. If this bearish momentum continues, expect the price to possibly continue heading towards the 1st support at 1824.515 where the overlap support is.
In an alternative scenario, price could possibly head back up to retest the 1st resistance at 1863.530, where the overlap resistance and 61.8% Fibonacci line is.
Areas of consideration:
- H4 time frame, 1st resistance at 1863.530
- H4 time frame, 1st support at 1824.515
AUD/USD:
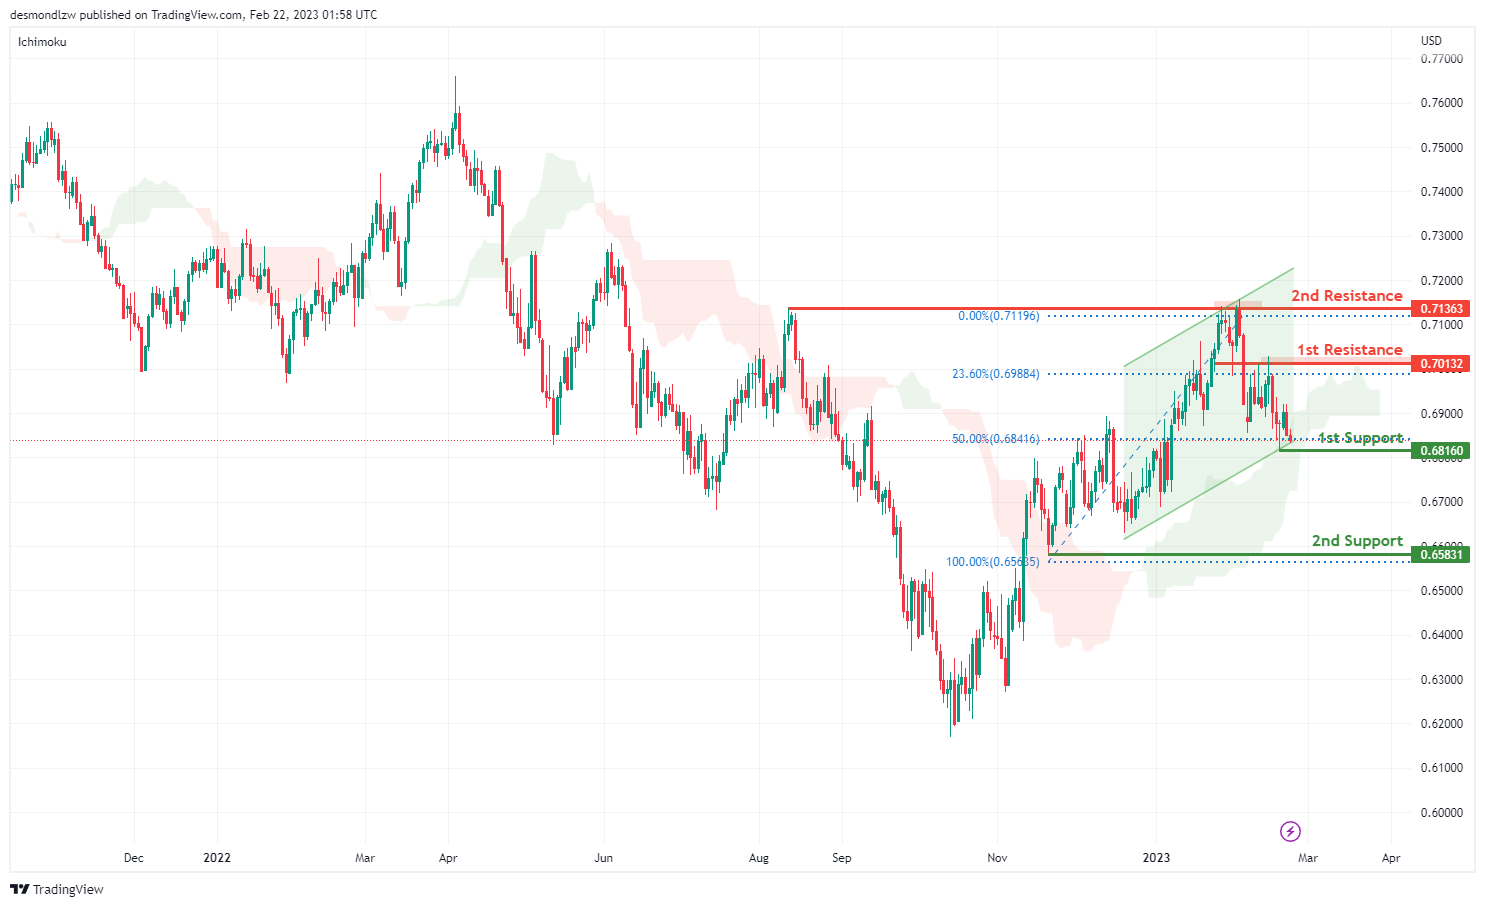
Looking at the H4 chart, my overall bias for AUDUSD is slightly bullish due to the current price being above the Ichimoku cloud, and there is an ascending channel, indicating a bullish market.
The price could possibly go up towards the 1st resistance level at 0.70132 which is the recent swing high and in line with the 23.6% Fibonacci retracement. There is 2nd resistance at 0.71363 which is the previous swing high.
In an alternate scenario, the price could possibly down towards the The 1st support is at 0.68160 which is the recent swing high and in line with the 50% Fibonacci retracement. The 2nd support is at 0.65831 which is the recent swing low.
Areas of consideration
- H4. 2nd resistance at 0.71363
- H4. 1st resistance at 0.70132
- H4, 1st support at 0.68160
- H4, 2nd support at 0.65831
NZD/USD:
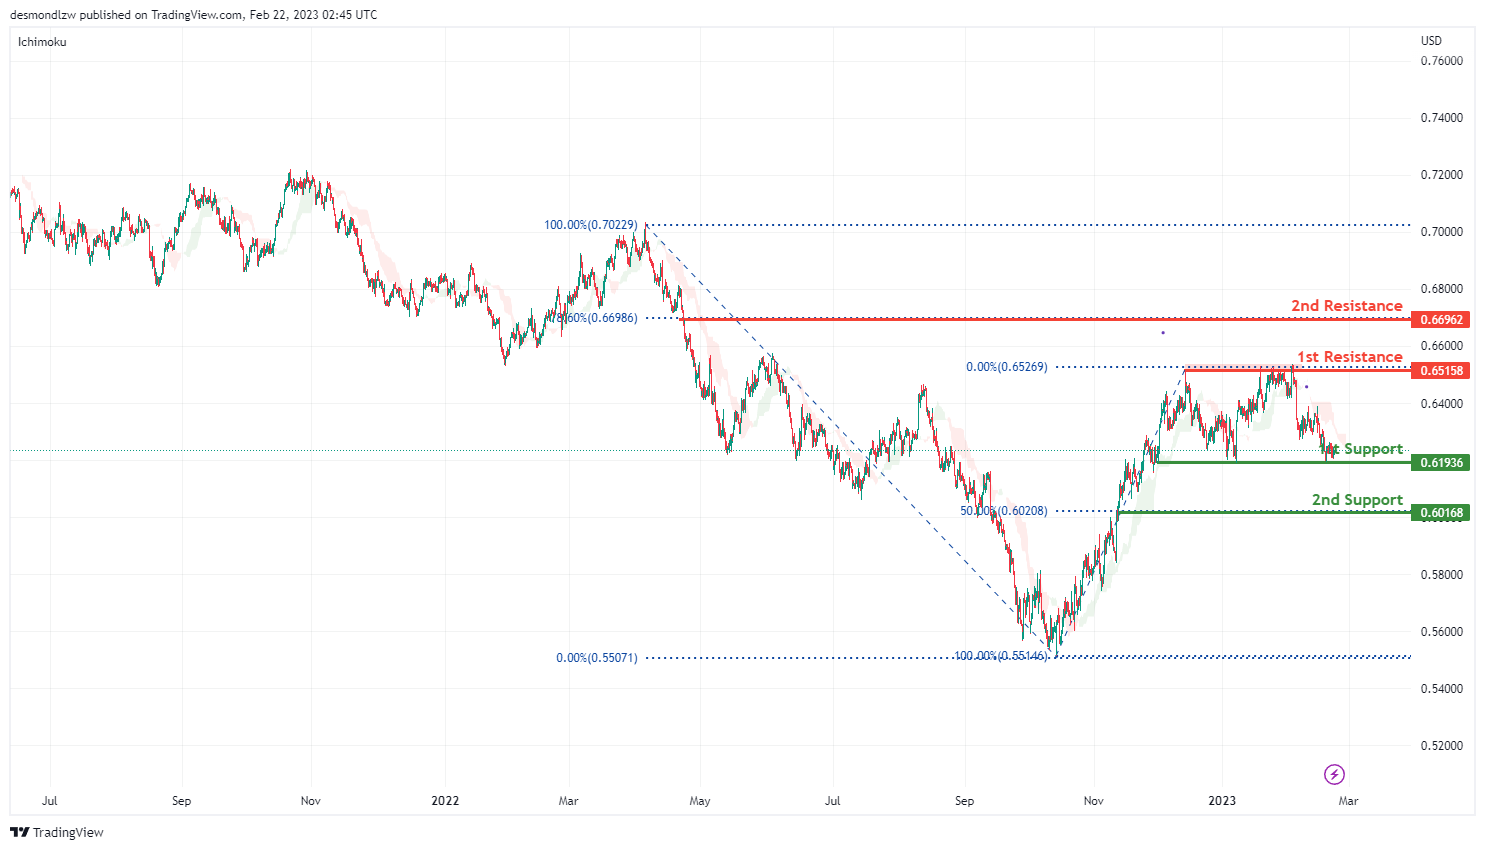
Looking at the H4 chart, my overall bias for NZDUSD is bearish, as the current price is below the Ichimoku Cloud. Expecting the price go down towards the 1st support at 0.61936 which is the overlap swing low. The 2nd support is at 0.60168 where the 50% Fibonacci line is.
In an alternate scenario, price could possibly go up towards the 1st resistance level at 0.65158 which is the recent overlap swing high and in line with 61,8% Fibonacci retracement. There is a 2nd resistance at 0.66962 where the 78.6% Fibonacci line is.
Areas of consideration:
- H4 time frame, 2nd resistance at 0.66962
- H4 time frame, 1st resistance at 0.65158
- H4 time frame, 1st support at 0.61936
- H4 time frame, 2nd support at 0.60168
USD/CAD:
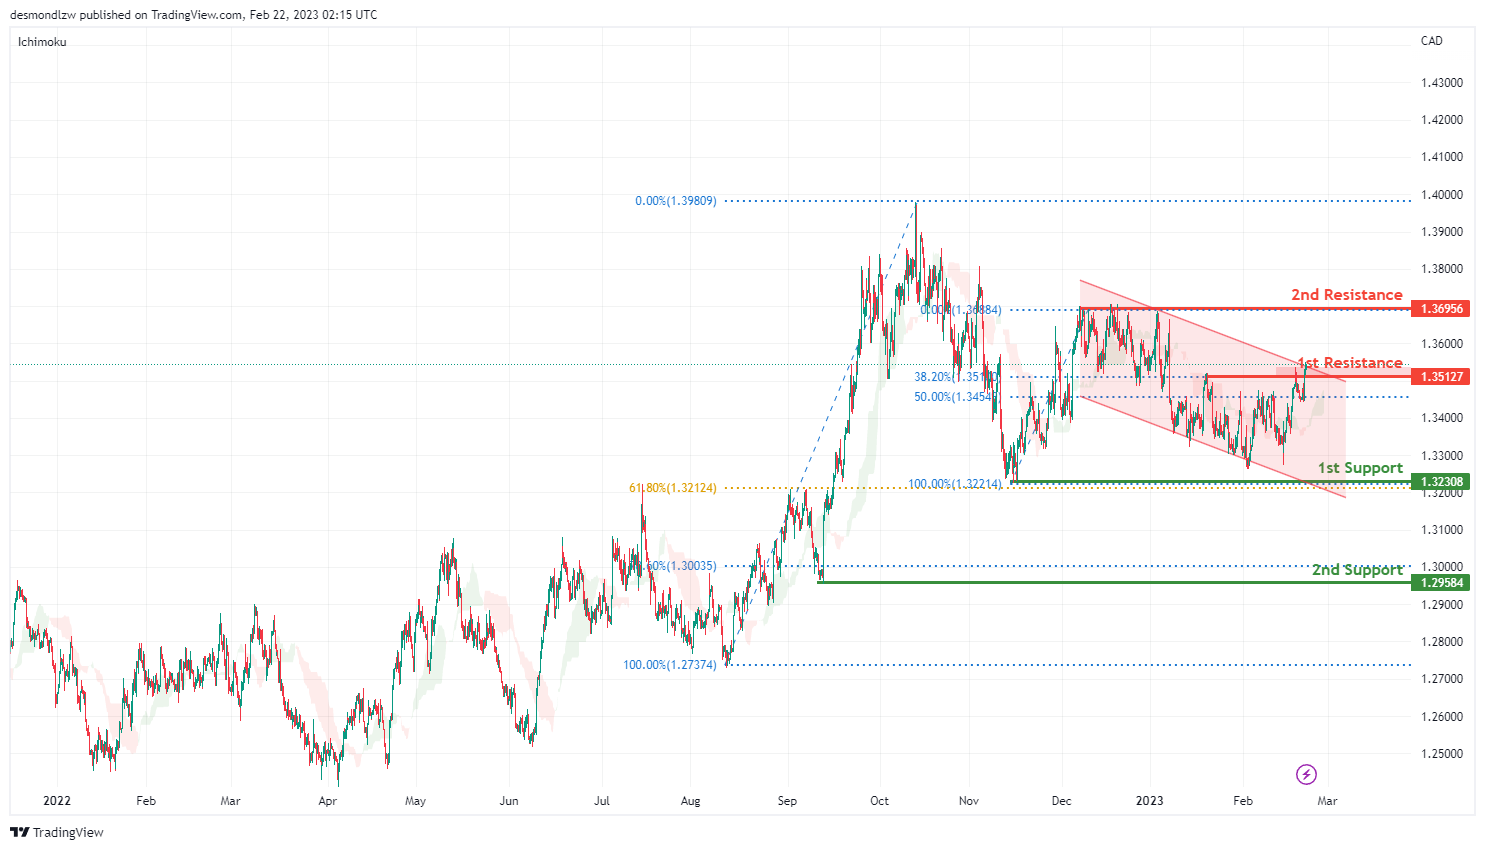
Looking at the H4 chart, my overall bias for USDCAD is bullish , as the current price is above the Ichimoku cloud and try to break the upper level of the descending channel. Expecting the current price to possibly break the 1st resistance at 1.35127 which is the recent swing high and in line with 38.2% Fibonacci retracement, before it heading to the 2nd resistance at 1.36956 which is the overlap previous swing high.
In an alternative scenario, the price could possibly drop to the 1st support at 1.32308 which is the previous swing low and also in line with the 61.8% Fibonacci retracement. The 2nd support is at 1.29584 where the 78.6% Fibonacci line is .
Areas of consideration:
- H4 time frame, 2nd resistance at 1.36956
- H4 time frame, 1st resistance at 1.35127
- H4 time frame, 1st support at 1.32308
- H4 time frame, 2nd support at 1.29584
OIL:
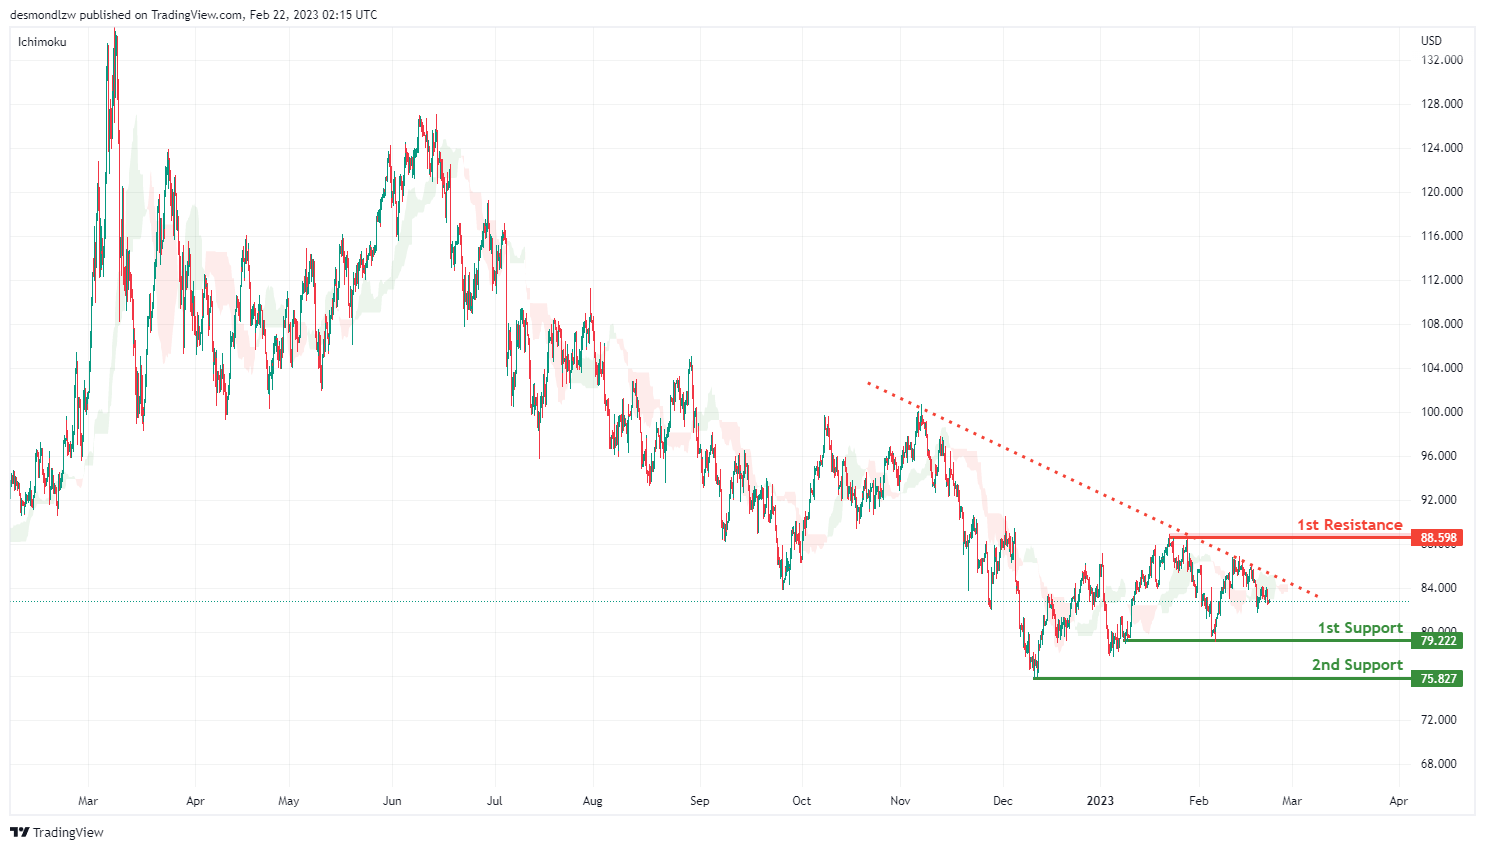
Looking at the H4 chart, my overall bias for BOC is bearish as the current price acrossing the Ichimoku cloud, and there is an descending trend line. Expecting the price to head down towards the 1st support level at 79.222 which is the recent overlap swing low, before the price drops to the 2nd support at 75.827.
In an alternate scenario, the price could possibly head up towards the 1st resistance level at 88.598 which is the recent swing high.
Areas of consideration:
- H4 time frame, 1st resistance at 88.598
- H4 time frame,1st support at 79.587
- H4 time frame, 2nd support at 75.827
Dow Jones Industrial Average:
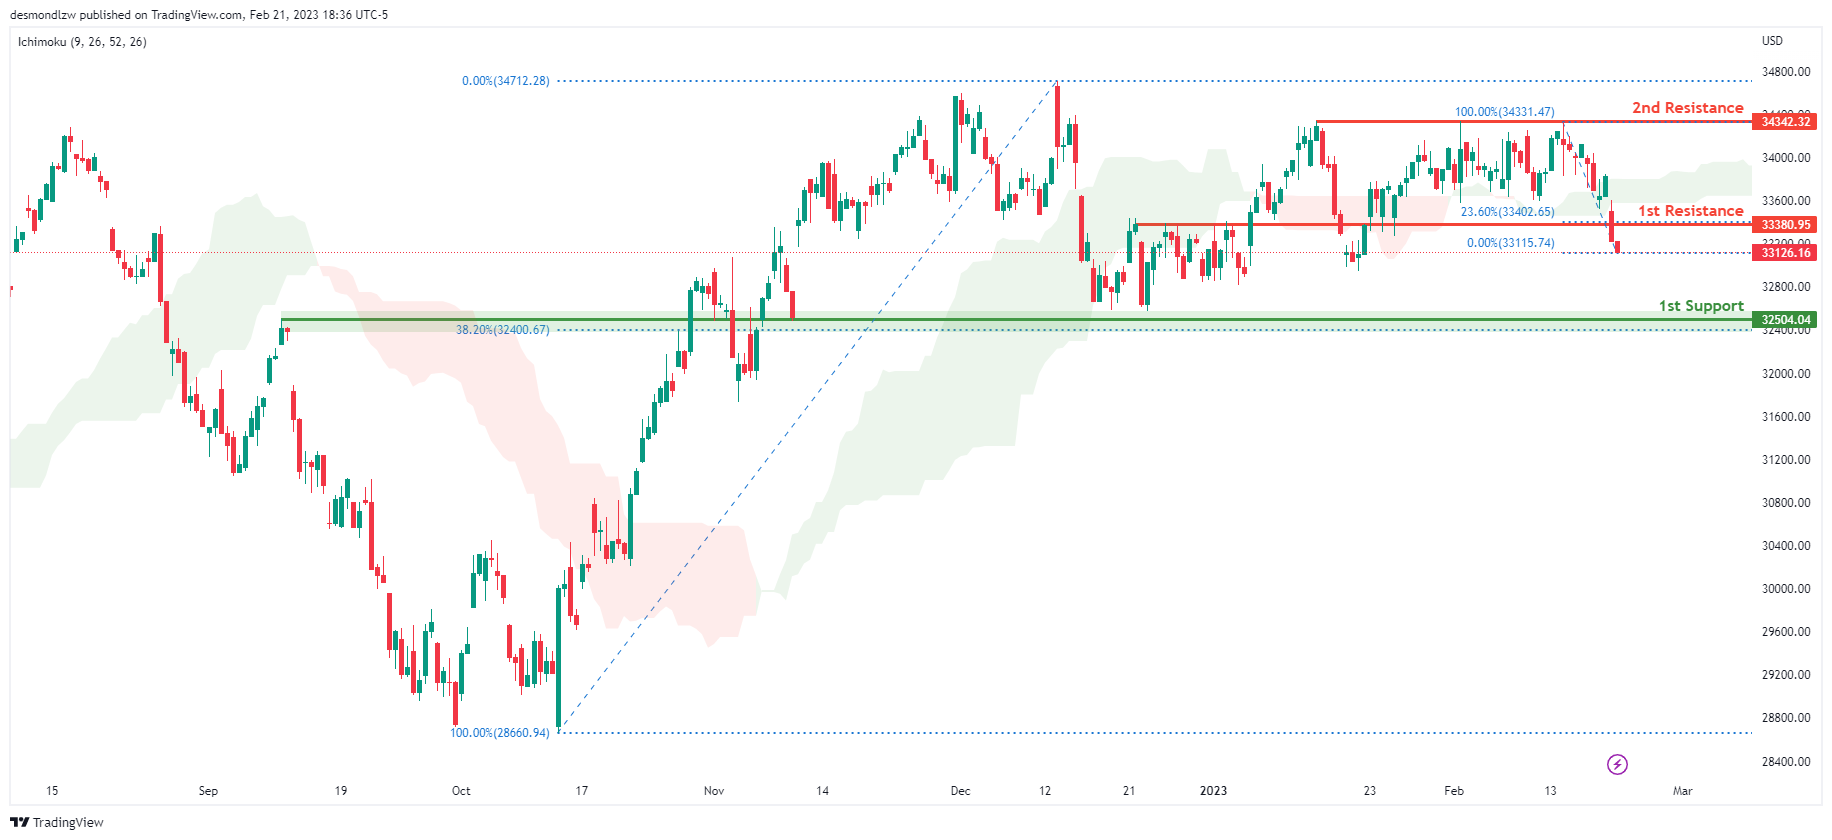
On the H4 chart, the overall bias for DJI is bearish. To add confluence to this, the price is crossing below the Ichimoku cloud which indicates a bearish market. If this bearish momentum continues, expect the price to possibly continue heading towards the 1st support at 32504.04, where the 38.2% Fibonacci line and overlap support is.
In an alternative scenario, price could possibly head back up towards the 1st resistance at 33380.95, where the 23.6% Fibonacci line is.
Areas of consideration:
- H4 time frame, 1st support at 32504.04
- H4 time frame, 1st Resistance at 33380.95
DAX:
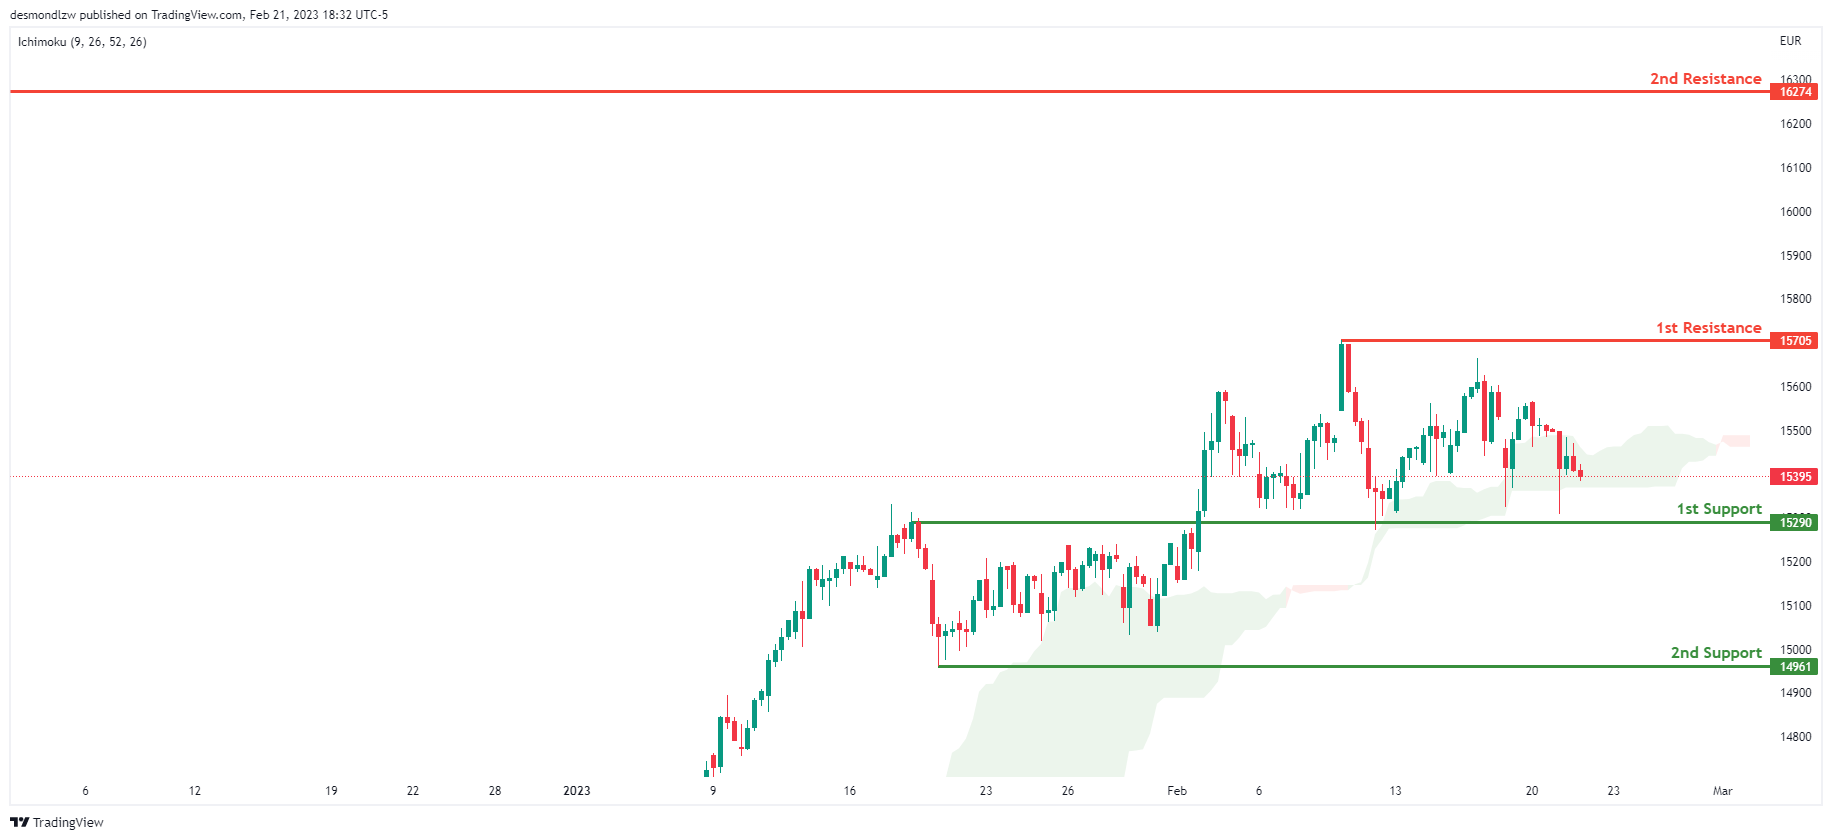
Looking at the H4 chart, my overall bias for DAX is bullish due to the current price crossing above the Ichimoku cloud, indicating a bullish market. If this bullish momentum continues, expect the price to possibly head towards the 1st resistance line at 15705, where the recent high is.
In an alternative scenario, price could possibly head down to retest the 1st support at 15290, where the overlap support is.
Areas of consideration:
- H4 time frame, 1st resistance is at 15705
- H4 time frame, 1st support is at 15290
ETHUSD:
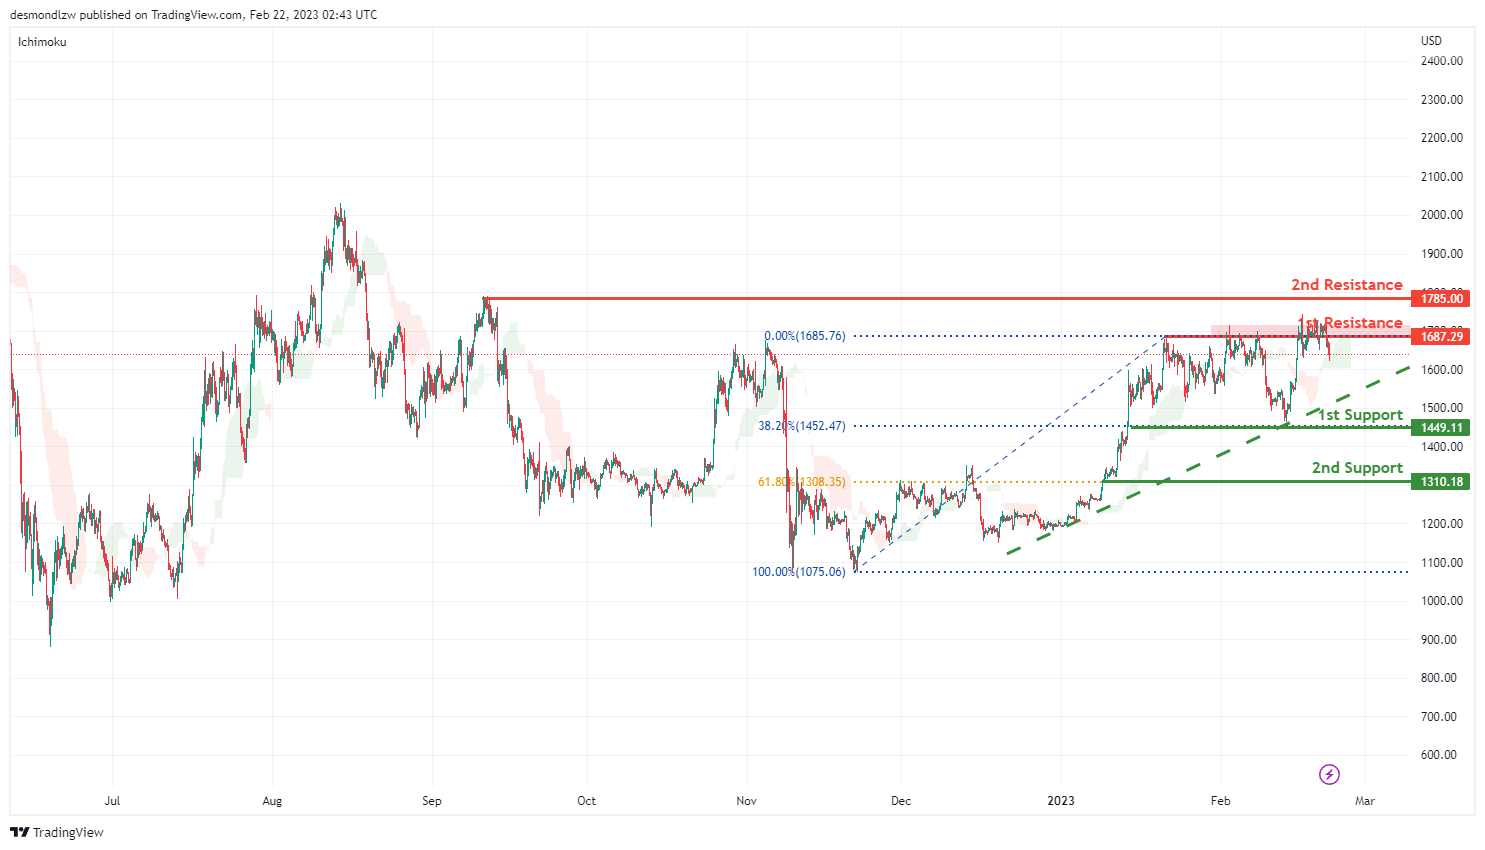
Looking at the H4 chart, my overall bias for ETHUSD is bullish, as there is a strong ascending trend line. The price may go up and break the 1st resistance line at 1685.76 before breaking the 2nd resistance line at 1785.00 which is the previous swing high.
In an alternate scenario, the price may retrace back to the 1st support line at 1449.11 which is in line with 38.2% Fibonacci retracement, before it heads towards the 2nd support at 1310.18 which is in line with 61.8% Fibonacci retracement.
Areas of consideration:
- H4 time frame, 2nd resistance of 1785.00
- H4 time frame, 1st resistance of 1685.76
- H4 time frame, 1st support at 1449.11
- H4 time frame, 2nd support at 1310.18
BTCUSD:
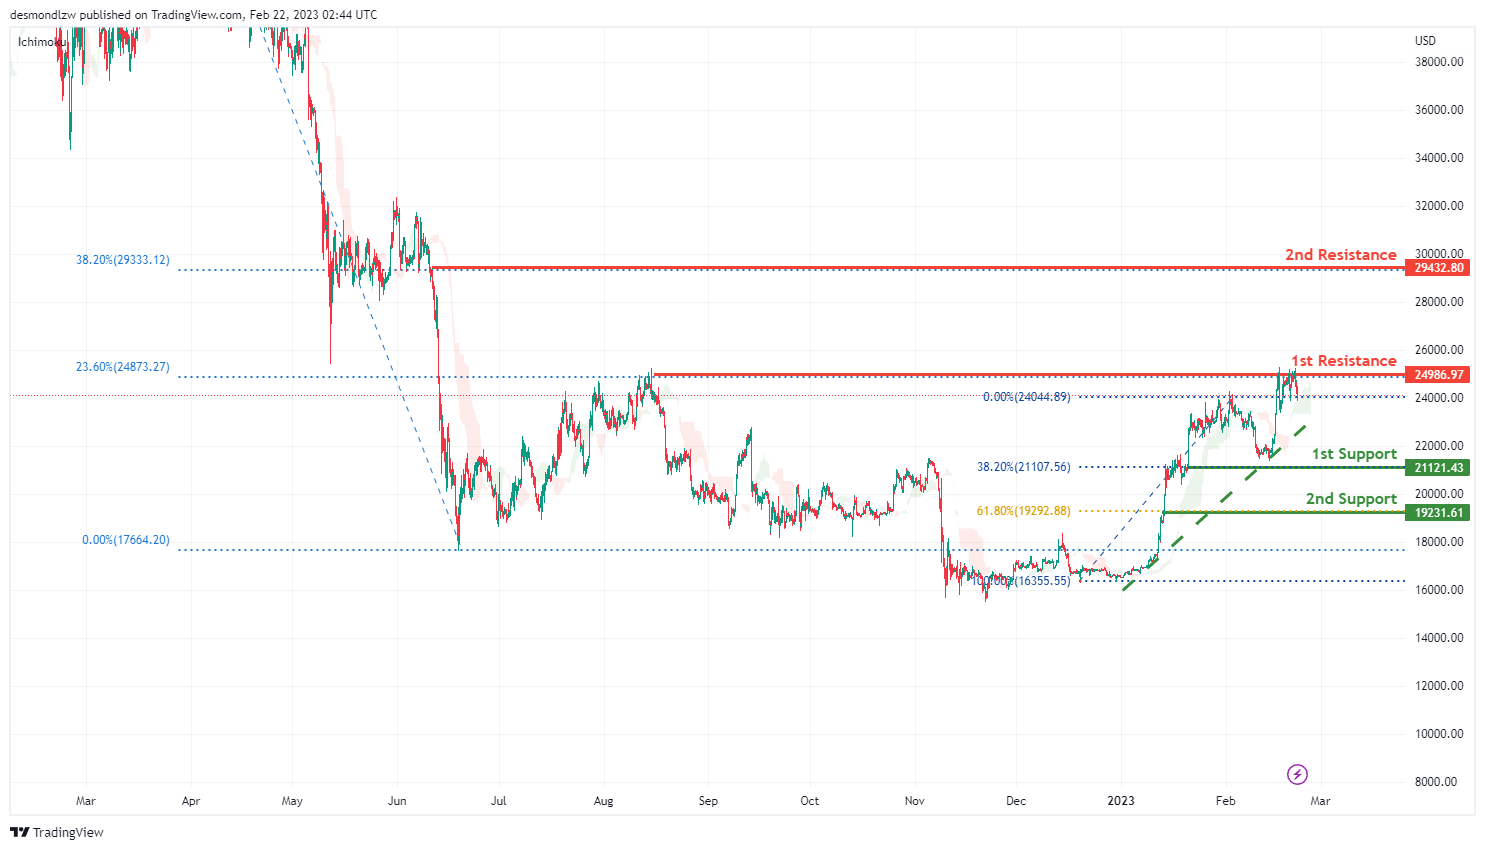
Looking at the H4 chart, my overall bias for BTCUSD is bulllish. As there is an ascending trend line, expect the price could possibly head up to the 1st resistance at 24986.97 which is the overlap recent swing high, before it head up to the 2nd resistance 29432.80 where the 38.2% Fibonacci retracement is.
In an alternate scenario, The price may go down towards the 1st support line at 21121.43 which is in line with 38.2% Fibonacci retracement, before heading down towards the 2nd support at 19231.61 which is in line with 61.8% Fibonacci retracement.
Areas of consideration:
- H4 time frame, 2nd resistance 29432.80
- H4 time frame, 1st resistance 24986.97
- H4 time frame, 1st support at 21121.43
- H4 time frame, 2nd support at 19231.61
S&P 500:
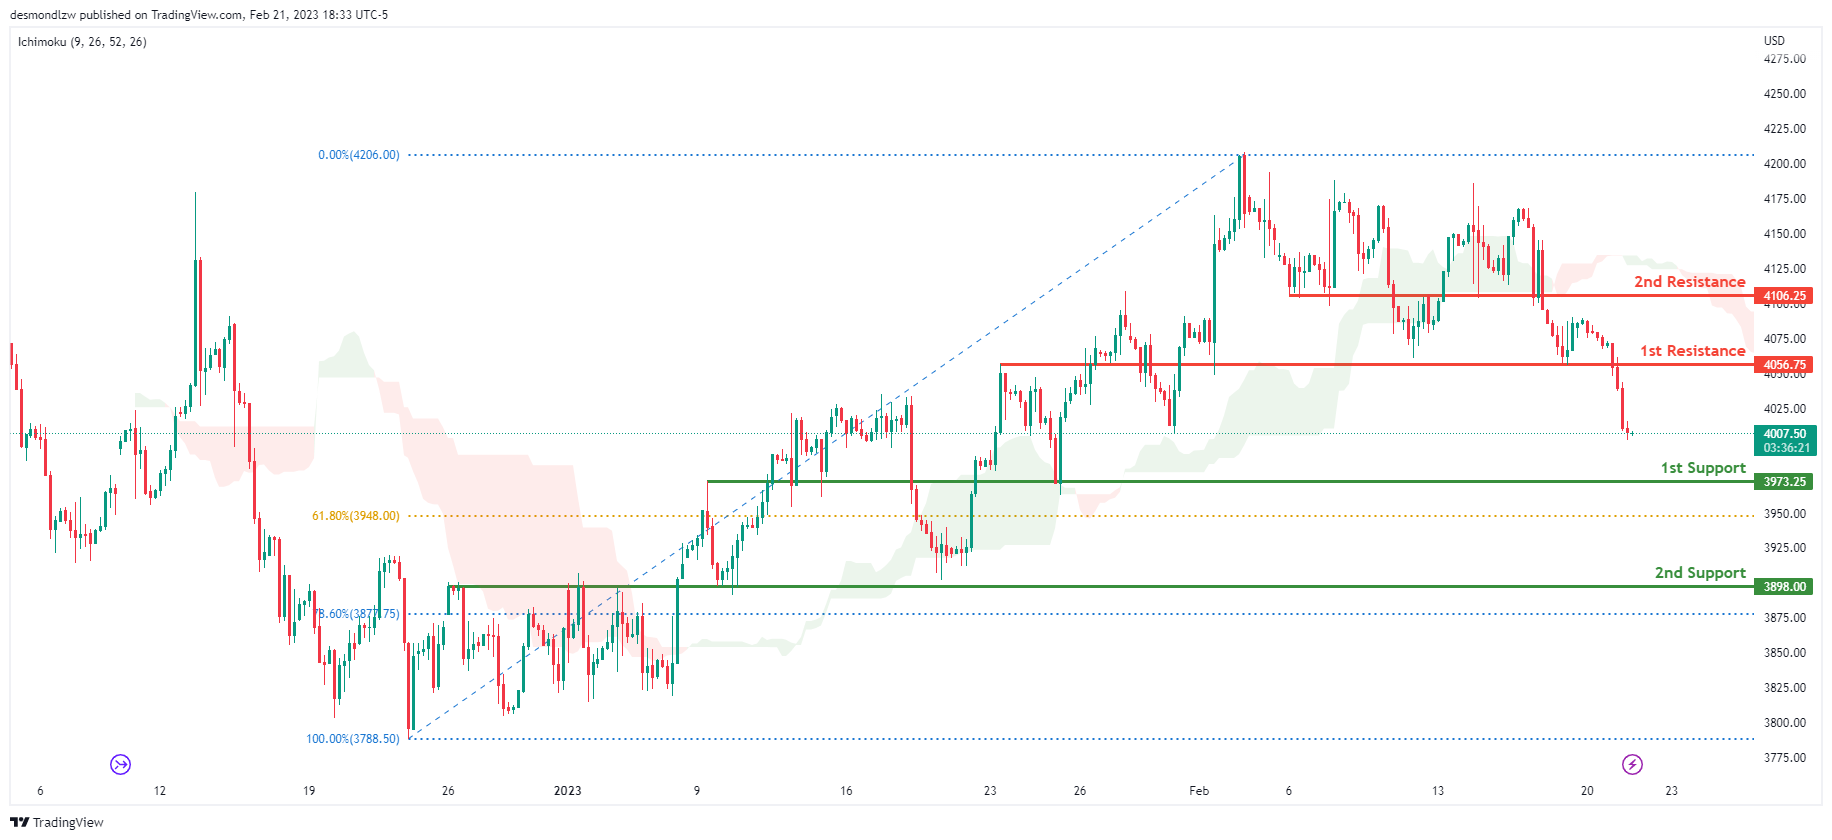
Looking at the H4 chart, my overall bias for S&P500 is bearish due to the current price being below the Ichimoku cloud, indicating a bearish market. If this bearish momentum continues, expect the price to continue heading towards the 1st support at 3973.25 which is the overlap support and slightly above where the 61.8% Fibonacci line is.
In an alternative scenario, price could possibly head back up to retest the 1st resistance at 4056.75, where the overlap resistance is.
Areas of consideration:
- H4 time frame, 1st support at 3973.25
- H4 time frame, 1st resistance at 4056.75
USD/CAD Daily Outlook
Daily Pivots: (S1) 1.3470; (P) 1.3509; (R1) 1.3577; More....
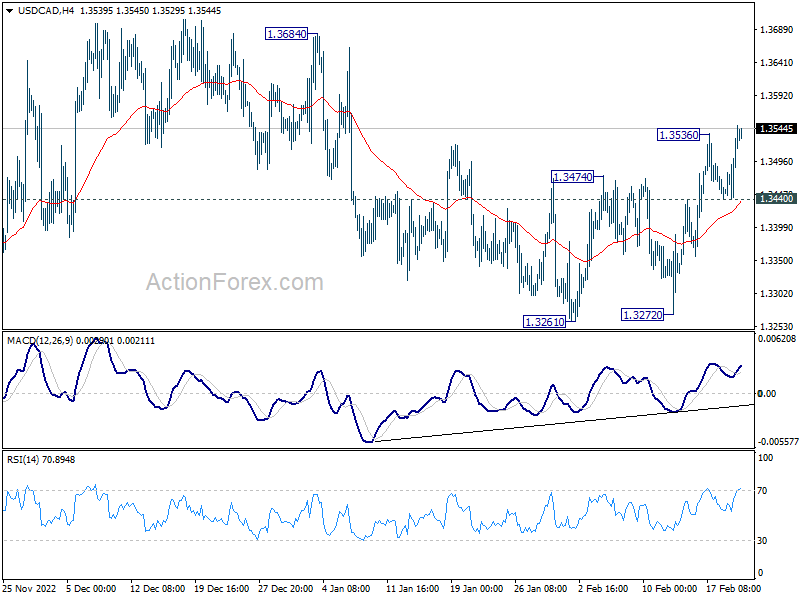
USD/CAD's rally resumed after brief retreat and intraday bias is back on the upside. Outlook is unchanged that corrective pattern from 1.3967 should have completed at 1.3261. Further rally should now be seen to 1.3684 resistance first. Break there will pave the way back to retest 1.3976 high. On the downside, however, break of 1.3440 support will dampen this bullish cas and turn intraday bias neutral first.
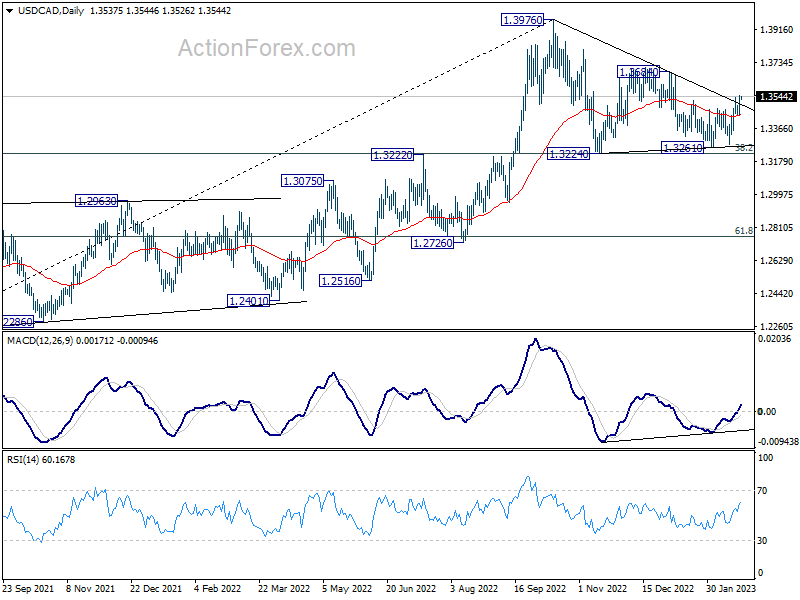
In the bigger picture, as long as 1.3222 cluster support (38.2% retracement of 1.2005 to 1.3976 at 1.3223) holds, larger up trend from 1.2005 (2021 low) is still expected to resume through 1.3976 high at a later stage. However, firm break of 1.3222/3 will indicate that the trend might have reversed. Deeper fall would be seen to next cluster support at 1.2726 (61.8% retracement at 1.2758).
NZD Higher after RBNZ Hike, Other Commodity Currencies Soft
New Zealand Dollar rises broadly today after hawkish RBNZ hike. But other commodity currencies are lagging behind on risk-off sentiment. As for the week so far, Sterling remains the strongest, as supported by optimism on avoiding recession. Dollar followed as second as supported by rising treasury yields, and then Swiss Franc. Aussie is the worst, followed by Yen and then Loonie.
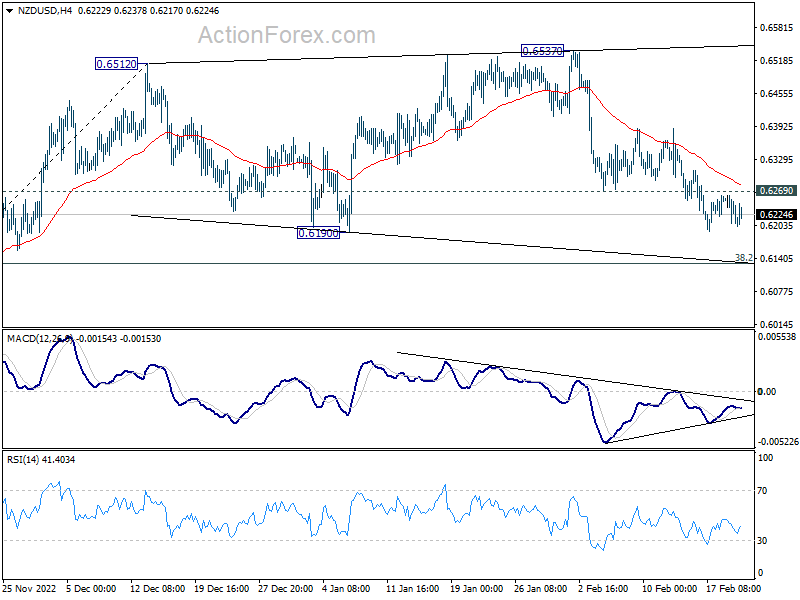
Technically, NZD/USD's recovery today is rather weak, and doesn't warrant a reversal. Fall from 0.6537 is still in favor to continue as long as 0.6269 support turned resistance holds. Yet, the three-wave consolidation from 0.6512 should be about to complete. Downside momentum should continue to slow while support will come in below 0.6190. Break of 0.6269 will suggest short term bottoming and bring stronger rebound.
In Asia, at the time of writing, Nikkei is down -1.30%. Hong Kong HSI is up 0.03%. China Shanghai SSE is down -0.25%. Singapore Strait Times is down -0.18%. Japan 10-year JGB yield is up 0.009 at 0.512. Overnight, DOW dropped -2.06%. S&P 500 dropped -2.00%. NASDAQ dropped -2.50%. 10-year yield rose 0.127 to 3.955.
RBNZ hikes 50bps, sees OCR peaking at 5.5%
RBNZ raises the Official Cash Rate by 50bps to 4.75% as widely expected. It also maintained hawkish bias and noted, "monetary conditions need to tighten further".
Regarding cyclone Gabrielle, it's "too early to accurately assess the monetary policy implications".. The committee will also "look through" the "short-term output variations and direct price effects" related to the weather event.
In the economic projections, RBNZ sees OCR peaking at 5.5% in Q4 2023, and stays above 5% until Q1 2025. GDP is projected to contract in Q2, Q3 and Q4 this year. Inflation is projected to drop gradually from 7.3% in Q1, but only falls back below 3% in Q3 2024.
In the post meeting press conference, RBNZ Governor Adrian Orr said that all options remain on the table today, "including 25, 50 and 75 bps hikes." There was "very little discussion of a 25bp rate hike", while "most focus was on 50bp".
Australia Westpac leading index ticked up, growth below trend through most of 2023
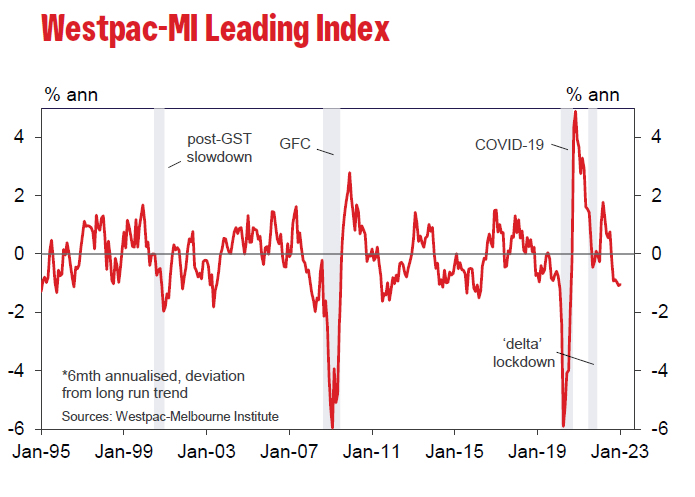
Australia Westpac-MI leading index ticked up slightly in January. Growth in the three to nine months period is estimated to be -1.04% below trend, comparing to -1.09% in December.
Westpac added that growth would remain below trend through most of 2023, with global factors, monetary policy and, recently, hours worked have weighed heavily on the Index.
Regarding RBA policy, Westpac expects another 25bps hike at March meeting to 3.60%. The cash rate is expected to peak at 3.85%, but recent communications from RBA "imply upside risks to that forecast".
BoJ Tamura: Appropriate to maintain monetary easing for now
BoJ board member Naoki Tamura said, "we're now in a phase where we need to scrutinise whether Japan can achieve a positive wage-inflation cycle. As such, it's appropriate to maintain monetary easing for now."
Tamura also noted that December's decision to double to yield cap was aimed at making monetary easing more sustainable, not at tightening. "At this stage, it's important to follow carefully and humbly how markets would stabilise and to what extent market functions will improve," he said.
Looking ahead
Germany Ifo business climate is the main focus in European session while CPI final will also be released. Swiss will release ZEW expectations. Later in the day, FOMC minutes will take center stage. Canada new housing price index will also be featured.
USD/CAD Daily Outlook
Daily Pivots: (S1) 1.3470; (P) 1.3509; (R1) 1.3577; More....
USD/CAD's rally resumed after brief retreat and intraday bias is back on the upside. Outlook is unchanged that corrective pattern from 1.3967 should have completed at 1.3261. Further rally should now be seen to 1.3684 resistance first. Break there will pave the way back to retest 1.3976 high. On the downside, however, break of 1.3440 support will dampen this bullish cas and turn intraday bias neutral first.
In the bigger picture, as long as 1.3222 cluster support (38.2% retracement of 1.2005 to 1.3976 at 1.3223) holds, larger up trend from 1.2005 (2021 low) is still expected to resume through 1.3976 high at a later stage. However, firm break of 1.3222/3 will indicate that the trend might have reversed. Deeper fall would be seen to next cluster support at 1.2726 (61.8% retracement at 1.2758).
Economic Indicators Update
| GMT | Ccy | Events | Actual | Forecast | Previous | Revised |
|---|---|---|---|---|---|---|
| 21:45 | NZD | Trade Balance (NZD) Jan | -1954M | -475M | -636M | |
| 23:30 | AUD | Westpac Leading Index M/M Jan | -0.10% | -0.10% | -0.20% | |
| 23:50 | JPY | Corporate Service Price Index Y/Y Jan | 1.60% | 1.50% | 1.50% | |
| 00:30 | AUD | Wage Price Index Q/Q Q4 | 0.80% | 1.00% | 1.00% | 1.10% |
| 00:30 | AUD | Construction Work Done Q4 | -0.40% | 1.60% | 2.20% | |
| 01:00 | NZD | RBNZ Rate Decision | 4.75% | 4.75% | 4.25% | |
| 02:00 | NZD | RBNZ Press Conference | ||||
| 07:00 | EUR | Germany CPI M/M Jan F | 1.00% | 1.00% | ||
| 07:00 | EUR | Germany CPI Y/Y Jan F | 8.70% | 8.70% | ||
| 09:00 | CHF | ZEW Expectations Feb | -40 | |||
| 09:00 | EUR | Germany IFO Business Climate Feb | 91.1 | 90.2 | ||
| 09:00 | EUR | Germany IFO Current Assessment Feb | 94.3 | 94.1 | ||
| 09:00 | EUR | Germany IFO Expectations Feb | 84.7 | 86.4 | ||
| 13:30 | CAD | New Housing Price Index M/M Jan | 0.10% | 0.00% | ||
| 19:00 | USD | FOMC Minutes |
Australia Westpac leading index ticked up, growth below trend through most of 2023
Australia Westpac-MI leading index ticked up slightly in January. Growth in the three to nine months period is estimated to be -1.04% below trend, comparing to -1.09% in December.
Westpac added that growth would remain below trend through most of 2023, with global factors, monetary policy and, recently, hours worked have weighed heavily on the Index.
Regarding RBA policy, Westpac expects another 25bps hike at March meeting to 3.60%. The cash rate is expected to peak at 3.85%, but recent communications from RBA "imply upside risks to that forecast".